
CIRCUS: an MDA platform for clinical image analysis in hospitals · 2020. 9. 1. · CIRCUS: an MDA...
16
CIRCUS: an MDA platform for clinical image analysis in hospitals Yukihiro Nomura 1 , Naoto Hayashi 2 , Yoshitaka Masutani 1,3 , Takeharu Yoshikawa 2 , Mitsutaka Nemoto 1 , Shouhei Hanaoka 1 , Soichiro Miki 3 , Eriko Maeda 2 , and Kuni Ohtomo 1,3 1 Department of Radiology, The University of Tokyo Hospital, 7-3-1 Hongo, Bunkyo-ku, Tokyo 113-8655, Japan 2 Department of Computational Diagnostic Radiology and Preventive Medicine, 22nd Century Medical and Research Center, The University of Tokyo Hospital 7-3-1 Hongo, Bunkyo-ku, Tokyo 113-8655, Japan 3 Division of Radiology and Biomedical Engineering,Graduate School of Medicine, The University of Tokyo, 7-3-1 Hongo, Bunkyo-ku, Tokyo 113-8655, Japan [email protected] Abstract. For mass image data analysis in hospitals, we have built an integrated platform for the development and assessment of various types of image analysis software such as computerized detection of lesions. It mainly consists of a set of clinical image databases, and a clinical server with web-based interfaces for launching analysis software and for view- ing and evaluating analysis results. The image databases are employed for the registration of a sufficient number of clinical cases for machine learning in computer-assisted detection/diagnosis (CAD) software devel- opment. In addition, the clinical server collects data for evaluating the interpretation performance of radiologists as well as that of the CAD software. Keywords: computer-assisted detection/diagnosis (CAD), image database system, web-based clinical server, on-line learning 1 Introduction A large number of images are generated by imaging devices in hospitals. The number of images is usually from 300 to 500 (and sometimes over 1,000) per examination and is increasing year by year. Hence, the workload of radiologists has been increasing. In addition, there are differences between the interpretation performance of radiologists. Therefore, computer-assisted detection/diagnosis (CAD) software is expected to assist radiologists. The development of CAD software involves a cycle of algorithm development, software implementation, clinical use, and refinement of the algorithm and the software based on clinical evaluation. This cycle is expected to accelerate the development of CAD software. However, there are currently problems in CAD software development.
Transcript of CIRCUS: an MDA platform for clinical image analysis in hospitals · 2020. 9. 1. · CIRCUS: an MDA...
CIRCUS: an MDA platformfor clinical image analysis in hospitals
Yukihiro Nomura1, Naoto Hayashi2, Yoshitaka Masutani1,3,Takeharu Yoshikawa2, Mitsutaka Nemoto1, Shouhei Hanaoka1,
Soichiro Miki3, Eriko Maeda2, and Kuni Ohtomo1,3
1 Department of Radiology, The University of Tokyo Hospital,7-3-1 Hongo, Bunkyo-ku, Tokyo 113-8655, Japan
2 Department of Computational Diagnostic Radiology and Preventive Medicine,22nd Century Medical and Research Center, The University of Tokyo Hospital
7-3-1 Hongo, Bunkyo-ku, Tokyo 113-8655, Japan3 Division of Radiology and Biomedical Engineering,Graduate School of Medicine,
The University of Tokyo, 7-3-1 Hongo, Bunkyo-ku, Tokyo 113-8655, [email protected]
Abstract. For mass image data analysis in hospitals, we have built anintegrated platform for the development and assessment of various typesof image analysis software such as computerized detection of lesions. Itmainly consists of a set of clinical image databases, and a clinical serverwith web-based interfaces for launching analysis software and for view-ing and evaluating analysis results. The image databases are employedfor the registration of a sufficient number of clinical cases for machinelearning in computer-assisted detection/diagnosis (CAD) software devel-opment. In addition, the clinical server collects data for evaluating theinterpretation performance of radiologists as well as that of the CADsoftware.
Keywords: computer-assisted detection/diagnosis (CAD), image databasesystem, web-based clinical server, on-line learning
1 Introduction
A large number of images are generated by imaging devices in hospitals. Thenumber of images is usually from 300 to 500 (and sometimes over 1,000) perexamination and is increasing year by year. Hence, the workload of radiologistshas been increasing. In addition, there are differences between the interpretationperformance of radiologists. Therefore, computer-assisted detection/diagnosis(CAD) software is expected to assist radiologists.
The development of CAD software involves a cycle of algorithm development,software implementation, clinical use, and refinement of the algorithm and thesoftware based on clinical evaluation. This cycle is expected to accelerate thedevelopment of CAD software. However, there are currently problems in CADsoftware development.
ynomura
テキストボックス
This paper was published in Transactions on Mass-Data Analysis of Images and Signals, Vol. 2, No. 1, pp.112-127, 2010 (Author's edition)

CIRCUS DB
Archiving
Research site
Database server
PC workstation for software development
Gateway
Database registration terminal
• Anonymize
• Enter gold standardand clinical properties
image files
Clinical site
server
Fig. 1. Configuration of CIRCUS DB for collecting clinical cases with pixel-based goldstandard data sets. CIRCUS DB includes a gateway, a database registration terminal,and a database server.
In algorithm development, a sufficient number of clinical cases are requiredto ensure the higher reliability of CAD software. In addition, the database mustinclude pixel-based gold standard data sets for supervised learning in CAD soft-ware.
The clinical use of a CAD system requires on-line processing in the clinicalimage network, the retrieval of images from an imaging device or an archivingserver, and the display of results obtained from the CAD software on interpre-tation terminals. In recent years, several research groups have reported CADservers based on on-line processing of CAD software [1–4], which are aimed atimprovement of diagnostic workflow and at clinical decision support. For exam-ple, Martinelli, et al. [4] reported an integrated platform dedicated to chronicheart failure, including web-based interfaces for analyzing echocardiograms anda knowledge-based decision support system. A commercial CAD server (syngo.via; Siemens Healthcare, Erlangen, Germany) has also been released. However,these systems might lack viewpoints of tuning and improvement of CAD softwareperformance in an efficient way.
Clinical images have different properties depending on imaging devices, interms of pixel size, slice thickness, signal-to-noise ratio, field of view, and oth-ers. It is important to adapt CAD software to various imaging configurationsbased on incremental learning. Previously, CAD software has been developedfor off-line applications [5]. Thus, if new clinical cases are collected, relearningincorporating the additional cases must be carried out. However, it is difficultto collect additional cases due to the protection of personal information in hos-pitals. Therefore, a strategy for the on-line learning of CAD software in clinicalenvironment is important. To refine or adapt CAD software based on on-line
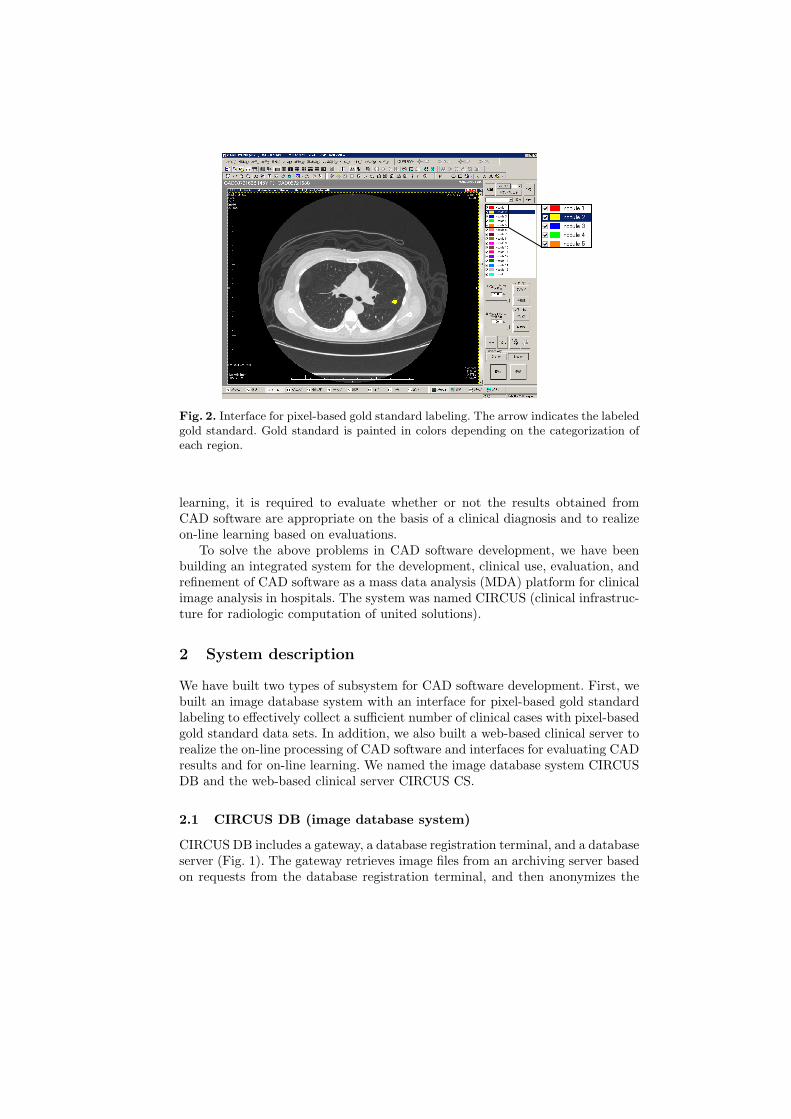
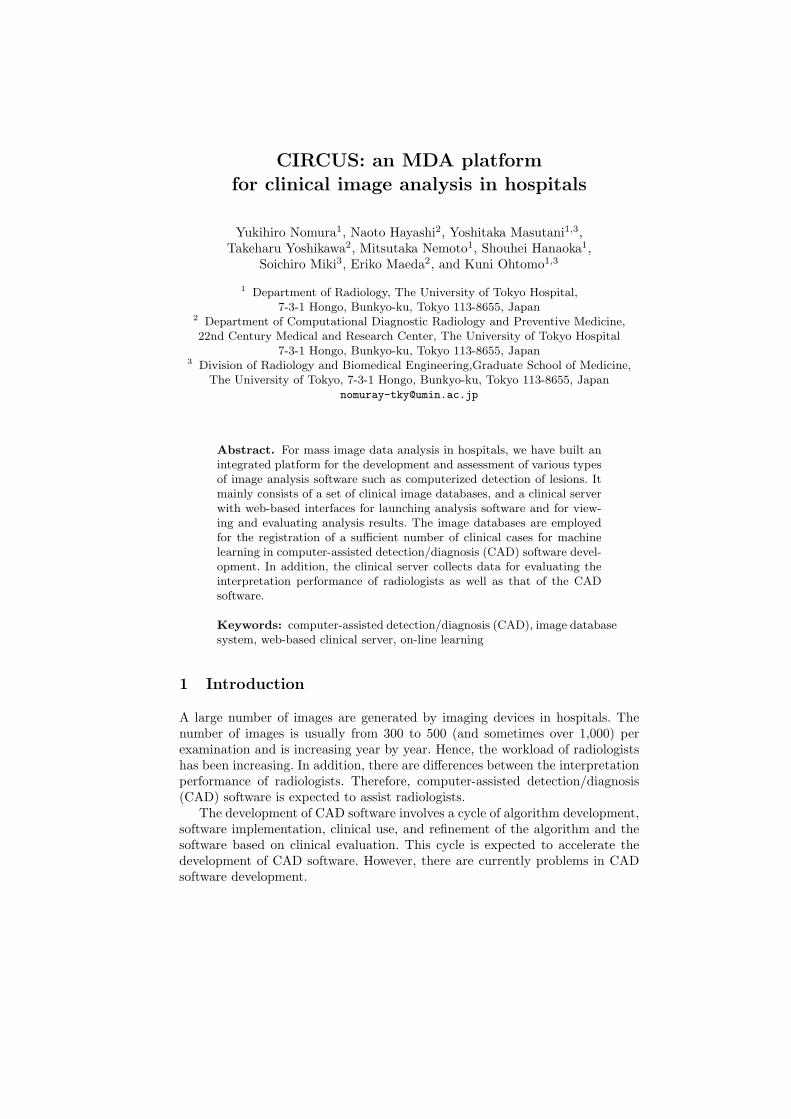
Fig. 2. Interface for pixel-based gold standard labeling. The arrow indicates the labeledgold standard. Gold standard is painted in colors depending on the categorization ofeach region.
learning, it is required to evaluate whether or not the results obtained fromCAD software are appropriate on the basis of a clinical diagnosis and to realizeon-line learning based on evaluations.
To solve the above problems in CAD software development, we have beenbuilding an integrated system for the development, clinical use, evaluation, andrefinement of CAD software as a mass data analysis (MDA) platform for clinicalimage analysis in hospitals. The system was named CIRCUS (clinical infrastruc-ture for radiologic computation of united solutions).
2 System description
We have built two types of subsystem for CAD software development. First, webuilt an image database system with an interface for pixel-based gold standardlabeling to effectively collect a sufficient number of clinical cases with pixel-basedgold standard data sets. In addition, we also built a web-based clinical server torealize the on-line processing of CAD software and interfaces for evaluating CADresults and for on-line learning. We named the image database system CIRCUSDB and the web-based clinical server CIRCUS CS.
2.1 CIRCUS DB (image database system)
CIRCUS DB includes a gateway, a database registration terminal, and a databaseserver (Fig. 1). The gateway retrieves image files from an archiving server basedon requests from the database registration terminal, and then anonymizes the

• size
– solid
• type
– mixed GGO– pure GGO
• location
– juxta-vascular– juxta-pleural– isolated
• with calcification
• free comment• with fat• with cavity
Fig. 3. Interface for entry of clinical properties in database of lung nodules. The prop-erties of lung nodules are size, type, location, calcification, cavity, and fat, and anadditional space is provided for comments (GGO: ground glass opacity).
image files. At the database registration terminal, pixel-based gold standard andclinical properties are entered using interface windows. After these processes,anonymized image files with gold standard and clinical properties are registeredin the database server. At the research site, image files with gold standard dataare retrieved upon request for software development. Clinical properties are alsoretrieved as comma-separated values (CSV) files.
Interfaces for labeling pixel-based gold standard and for entering clin-ical properties. Pixel-based gold standard is semiautomatically or manuallylabeled on each 2D image using a mouse or pen tablet. Figure 2 shows an inter-face for gold standard labeling. Gold standard is painted in colors depending onthe categorization of each region. For example, benign lung nodules are paintedin yellow, and malignant lung nodules are painted in red. Labeled gold standarddata are saved as digital imaging and communications in medicine (DICOM)overlays with up to 16 layers. After that, clinical properties are entered using aninterface window (Fig. 3). Various clinical properties are set for each database.For example, the properties of lung nodules are their size, type, location, calci-fication, cavity, and fat, and an additional space is provided for comments.
2.2 CIRCUS CS (clinical server with web interface)
Figure 4 shows the configuration of CIRCUS CS. The processing procedures ofCIRCUS CS are described as follows.
Lung noduledetection
Feedback database
DICOM datastorage server
4. result
2. application selection, job order
3. imagefiles
images
imagerequest
1. image files
5. evaluation
Fat volumetry
Jobmanager
Webserver
Web browser
Imaging device(or archiving server)
CIRCUS CS
Cerebral aneurysmdetection
CAD applications
Fig. 4. Configuration of CIRCUS CS for on-line processing of CAD software and evalu-ating CAD results. CIRCUS CS includes a DICOM data storage server, a job manager,a web server, and a feedback database. CAD applications are provided as plug-ins ofCIRCUS CS.
1. Image files are transferred from an imaging device or an archiving server toa DICOM data storage server.
2. The user selects a CAD application via a web browser and then registers ajob order.
3. The job manager process the selected application.4. The results obtained from the CAD application and interfaces for evaluation
(clinical feedback) are displayed as a web page.5. Radiologists evaluate the results from the CAD application on the basis
of a diagnostic decision, and the entered evaluations are registered in thefeedback database.
CAD applications are provided as plug-ins of CIRCUS CS. Our CAD applica-tions are outlined below.
– Lesion detection applications: cerebral aneurysm detection in magnetic res-onance (MR) angiograms [6], lung nodule detection in chest computed to-mography (CT) images [7], skin lesion detection in whole-body 18F-fluoro-deoxy-glucose positron emission tomography/computed tomography (FDG-PET/CT) images [8]
– Visualization application: virtual straightening of spine in whole-body CTimages [9]
– Measurement application: volumetry of visceral fat tissue (VAT) and subcu-taneous fat tissue (SAT) in whole-body CT images
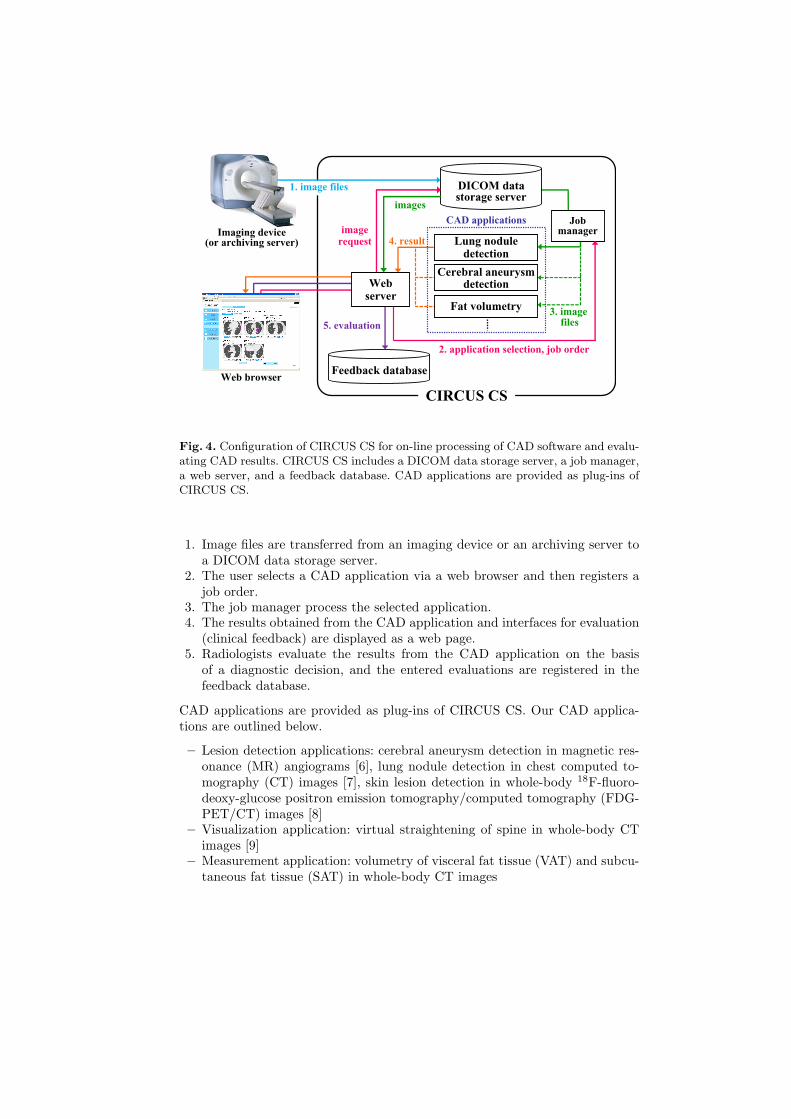
Fig. 5. Result of lung nodule detection in CT images. The center slice of the lesioncandidate and radio buttons (as a feedback interface) are displayed for each lesioncandidate. Circles indicate the locations of lesion candidates.
The user logs in to CIRCUS CS using his/her individual user ID and pass-word. The individual login enables us to adjust a set of displayed lesion can-didates adaptively for each user. In addition, it also enables the collection ofpersonal diagnostic decision data for each radiologist. On the basis of the col-lected data, the interpretation performance of the radiologist can be evaluated.
Figure 5 shows a result of lung nodule detection in chest CT images. Thecenter slice of the lesion candidate and radio buttons (as a feedback interface) aredisplayed for each lesion candidate. Lesion candidates are displayed in descendingorder of likelihood, and the number of displayed lesion candidates is adjustedby each user. In Fig. 5, the top five lesion candidates are displayed. Hereafter,the displayed lesion candidates are referred to “displayed candidates”, and otherpotential candidates are referred to “undisplayed candidates”.
2.3 Interfaces for clinical feedback
Radiologists evaluate the results obtained from the CAD application on thebasis of a diagnostic decision. The feedback entry in our system includes twostages: a personal entry and a consensual entry (Fig. 6). In the personal entry,

personal entry
Each user evaluatesCAD results on the basisof his/her diagnosticdecisions
lesion candidate
consensual entry
Evaluations in personal entry are integrated intoone final decision
(Entered by representative user with authority)
TP ?
User 1
FP ?
User 2
TP ?
User 3
Final decision: TP!
Fig. 6. Two stages of clinical feedback entry.
(a) (b)
Fig. 7. Radio buttons used to classify displayed candidates. (a) Personal entry, (b)consensual entry. The arrows indicate the number of users entered in the personalentry.
each radiologist can evaluate the result obtained from the CAD application.Evaluations in the personal entry by two radiologists (or more) are integratedinto one final decision as the consensual entry. We have implemented two typesof interface for clinical feedback entry, which are for lesion detection applicationsand for visualization applications.
Interfaces for lesion detection applications. The interfaces for lesion de-tection applications include radio buttons to classify displayed candidates andan interface for entering the locations of false negative (FN). Figure 7 (a) showsradio buttons used to classify displayed candidates in the personal entry. Eachdisplayed candidate is classified as follows:
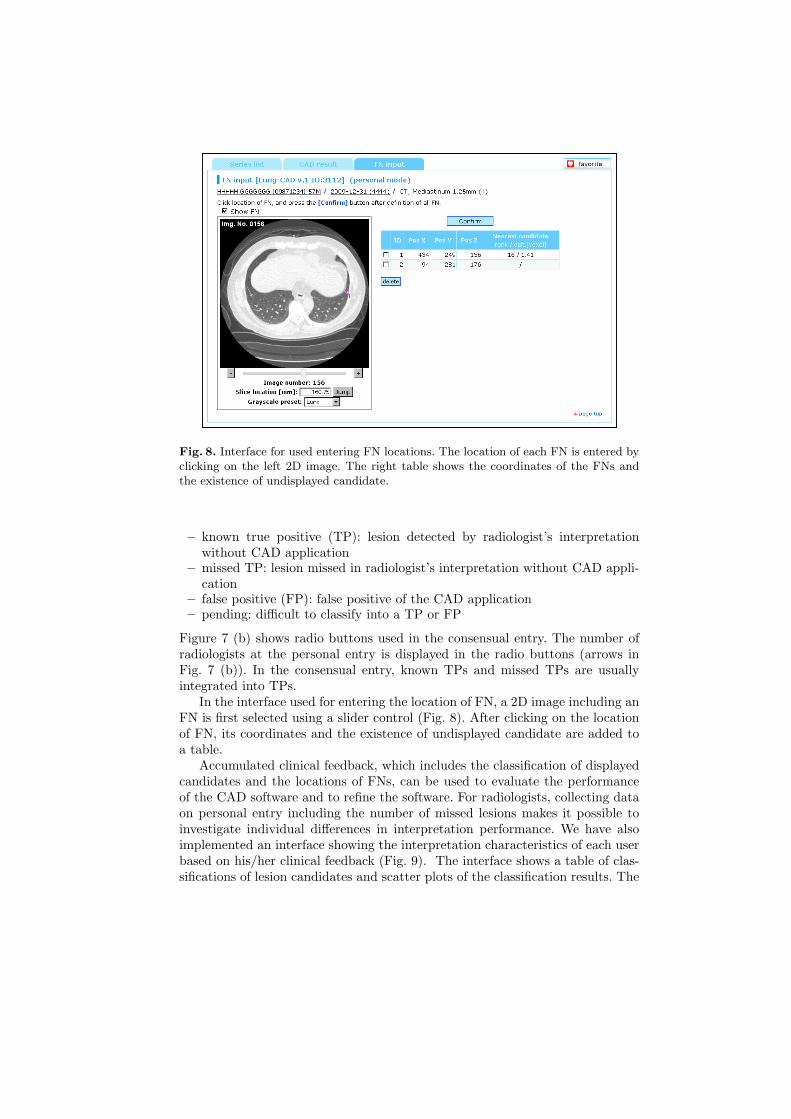
Fig. 8. Interface for used entering FN locations. The location of each FN is entered byclicking on the left 2D image. The right table shows the coordinates of the FNs andthe existence of undisplayed candidate.
– known true positive (TP): lesion detected by radiologist’s interpretationwithout CAD application
– missed TP: lesion missed in radiologist’s interpretation without CAD appli-cation
– false positive (FP): false positive of the CAD application– pending: difficult to classify into a TP or FP
Figure 7 (b) shows radio buttons used in the consensual entry. The number ofradiologists at the personal entry is displayed in the radio buttons (arrows inFig. 7 (b)). In the consensual entry, known TPs and missed TPs are usuallyintegrated into TPs.
In the interface used for entering the location of FN, a 2D image including anFN is first selected using a slider control (Fig. 8). After clicking on the locationof FN, its coordinates and the existence of undisplayed candidate are added toa table.
Accumulated clinical feedback, which includes the classification of displayedcandidates and the locations of FNs, can be used to evaluate the performanceof the CAD software and to refine the software. For radiologists, collecting dataon personal entry including the number of missed lesions makes it possible toinvestigate individual differences in interpretation performance. We have alsoimplemented an interface showing the interpretation characteristics of each userbased on his/her clinical feedback (Fig. 9). The interface shows a table of clas-sifications of lesion candidates and scatter plots of the classification results. The

Fig. 9. Interface showing interpretation characteristics in lung nodule detection. Theinterface shows a table of classifications of lesion candidates and scatter plots of theclassification results. Each classification in the scatter plots can be shown or hiddenusing check boxes (dashed box).
Fig. 10. Result of virtual straightening of spine in whole-body CT images with feedbackinterface for entering visual score (dashed box).

Table 1. Average times required for data retrieval at research site.
Type of database Image type SizeTime File size [MB][sec] original image gold standard
Cerebral aneurysm MR(A) 512×512×132 45 69.2 34.6
Lung nodule CT 512×512×250 80 131.0 65.5
Skin lesionCT* 512×512×275 95 144.2 72.1CT** 512×512×717 180 375.9 -PET 128×128×275 10 9.0 -
Visceral space CT 512×512×717 240 375.9 375.9
* Slice thickness: 3.75mm (for gold standard lebeling)** Slice thickness: 1.25mm (for processing)
Table 2. Average times required for transfer of image files and processing of CADapplications.
CAD applicationImagetype
SizeNo. ofimages
Time for Time forTotal[sec]
transfer processing[sec] [sec]
Cerebral aneurysm detection MR(A) 512×512 152 15 45 60
Lung nodule detection CT 512×512 250 20 185 205
Skin lesion detectionCT 512×512 717 50
270 330PET 128×128 275 10
Vertebral deformity analysis CT 512×512 717 50 220 270
Volumetry of VAT and SAT CT 512×512 717 50 380 430
coordinates of the scatter plots are normalized by target volumes. Each classifi-cation in the scatter plots can be shown or hidden using check boxes.
Interface for visualization applications. Figure 10 shows an example of afeedback interface for visualization applications. The user enters a visual scoreusing radio buttons. The visual score is divided into five levels: excellent, good,fair, unsatisfactory, and bad.
3 Results
The specifications of our platform including the databases and servers are shownbelow.
– Gateway: Intel Dual Xeon 1.86 GHz dual processor with 3 GB RAM, andMicrosoft Windows Server 2003 operating system
– Database registration terminal: Intel Pentium D 3.40 GHz with 2 GB RAM,and Microsoft Windows XP Professional operating system
– Database server: Intel Dual Xeon 1.86 GHz dual processor with 3 GB RAM,Microsoft Windows Server 2003 operating system, and MySQL 5.0.45
– Clinical server: Intel Quad Xeon 2.0 GHz with 4 GB RAM, Microsoft Win-dows Server 2003 operating system, Apache 2.2.15, Open SSL 0.9.8m, Post-greSQL 8.4.4, and DCMTK 3.5.4 [10]
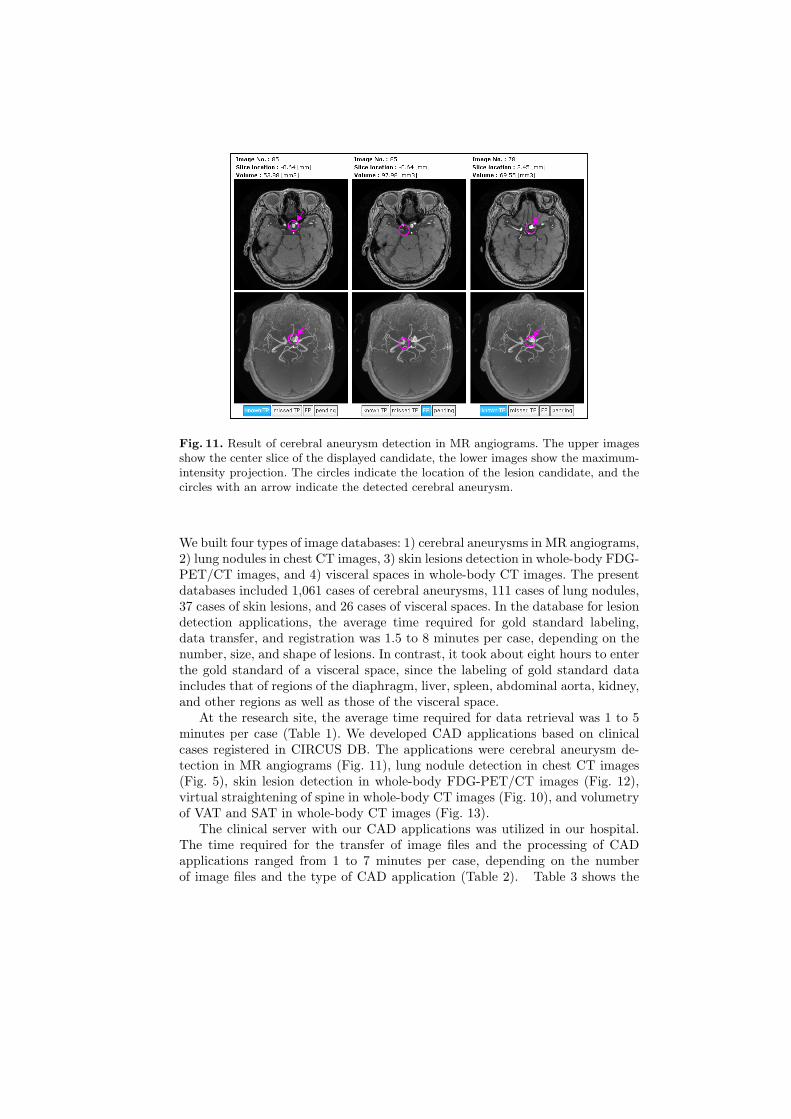
Fig. 11. Result of cerebral aneurysm detection in MR angiograms. The upper imagesshow the center slice of the displayed candidate, the lower images show the maximum-intensity projection. The circles indicate the location of the lesion candidate, and thecircles with an arrow indicate the detected cerebral aneurysm.
We built four types of image databases: 1) cerebral aneurysms in MR angiograms,2) lung nodules in chest CT images, 3) skin lesions detection in whole-body FDG-PET/CT images, and 4) visceral spaces in whole-body CT images. The presentdatabases included 1,061 cases of cerebral aneurysms, 111 cases of lung nodules,37 cases of skin lesions, and 26 cases of visceral spaces. In the database for lesiondetection applications, the average time required for gold standard labeling,data transfer, and registration was 1.5 to 8 minutes per case, depending on thenumber, size, and shape of lesions. In contrast, it took about eight hours to enterthe gold standard of a visceral space, since the labeling of gold standard dataincludes that of regions of the diaphragm, liver, spleen, abdominal aorta, kidney,and other regions as well as those of the visceral space.
At the research site, the average time required for data retrieval was 1 to 5minutes per case (Table 1). We developed CAD applications based on clinicalcases registered in CIRCUS DB. The applications were cerebral aneurysm de-tection in MR angiograms (Fig. 11), lung nodule detection in chest CT images(Fig. 5), skin lesion detection in whole-body FDG-PET/CT images (Fig. 12),virtual straightening of spine in whole-body CT images (Fig. 10), and volumetryof VAT and SAT in whole-body CT images (Fig. 13).
The clinical server with our CAD applications was utilized in our hospital.The time required for the transfer of image files and the processing of CADapplications ranged from 1 to 7 minutes per case, depending on the numberof image files and the type of CAD application (Table 2). Table 3 shows the

Fig. 12. Result of skin lesion detection in whole-body FDG-PET/CT images. Thecenter slice of the displayed candidate is displayed in a CT image. The circles indicatethe location of the lesion candidate, and the circle with an arrow indicates the detectedskin lesion.
SAT
VAT
Fig. 13. Result of volumetry of VAT and SAT in whole-body CT images. The upperimage shows a CT image in an umbilical slice, and the lower image shows extractedfat regions. The blue area represents SAT, and the red area represents VAT. The righttable shows measurement results.

Table 3. Number of cases processed using CIRCUS CS (13 Jan. 2009 - 15 Aug. 2010).
CAD application No. of cases
Cerebral aneurysm detection 2,564
Lung nodule detection 2,682
Skin lesion detection 7*
Vertebral deformity analysis 67*
Volumetry of VAT and SAT 654*
* Retrospective study
Fig. 14. Example of FROC curve for cerebral aneurysm detection.
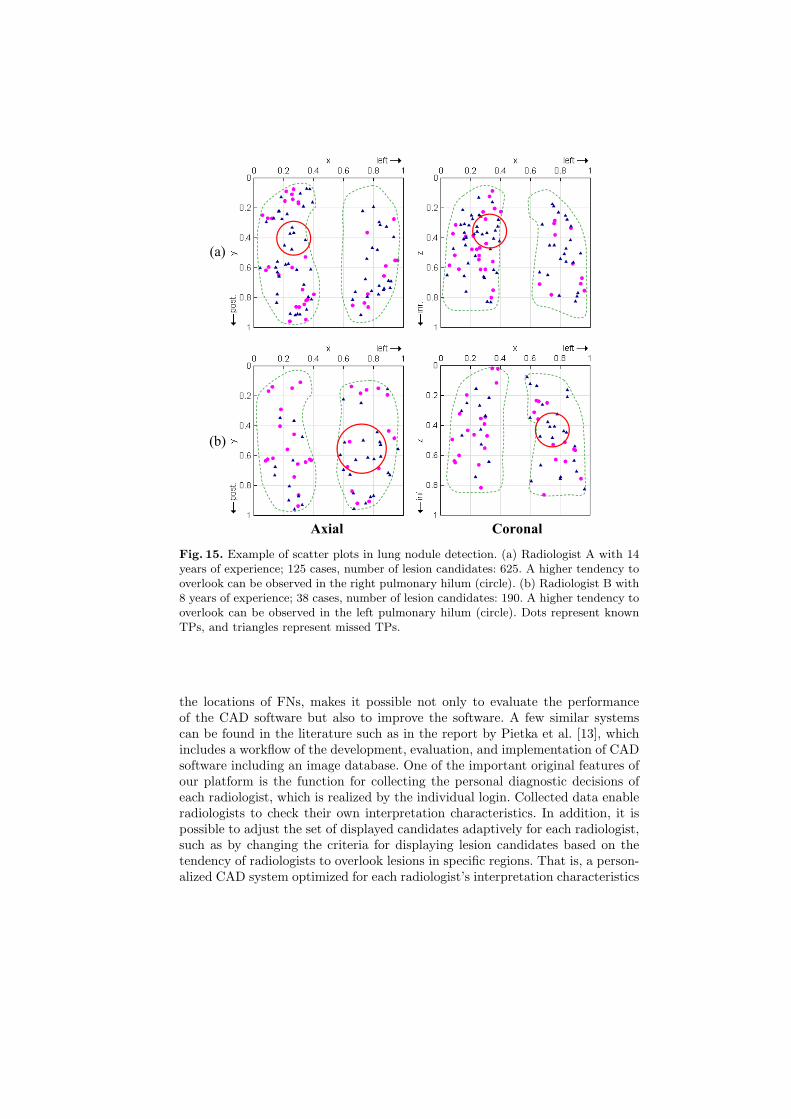
number of cases processed using CIRCUS CS. At present, the feedback databaseincludes 2,308 cases of cerebral aneurysm detection and 2,311 cases of lung nod-ule detection. Figure 14 shows an example of a free-response receiver operatingcharacteristic (FROC) curve for cerebral aneurysm detection on the basis ofaccumulated clinical feedback. The number of FPs was 4.0 per case at 80% sen-sitivity. Figure 15 shows examples of scatter plots in lung nodule detection. FromFig. 15, individual differences in interpretation characteristics can be observedbetween two radiologists.
4 Discussion
The results show that CIRCUS DB has the potential to collect and registera sufficient number of clinical cases for CAD software development in a shortperiod. However, the gold standard labeling of a large organ or region is still time-consuming. To reduce the time required for labeling a large organ or region, alabeling interface with interactive segmentation algorithms, such as the level setmethod [11] and graph cuts [12], is required.
CIRCUS CS makes it possible to use our CAD software in the daily clinicalroutine and to obtain feedback from radiologists. The method of clinical feed-back in our system, which includes the classification of displayed candidates and
Axial
(a)
(b)
Coronal
Fig. 15. Example of scatter plots in lung nodule detection. (a) Radiologist A with 14years of experience; 125 cases, number of lesion candidates: 625. A higher tendency tooverlook can be observed in the right pulmonary hilum (circle). (b) Radiologist B with8 years of experience; 38 cases, number of lesion candidates: 190. A higher tendency tooverlook can be observed in the left pulmonary hilum (circle). Dots represent knownTPs, and triangles represent missed TPs.
the locations of FNs, makes it possible not only to evaluate the performanceof the CAD software but also to improve the software. A few similar systemscan be found in the literature such as in the report by Pietka et al. [13], whichincludes a workflow of the development, evaluation, and implementation of CADsoftware including an image database. One of the important original features ofour platform is the function for collecting the personal diagnostic decisions ofeach radiologist, which is realized by the individual login. Collected data enableradiologists to check their own interpretation characteristics. In addition, it ispossible to adjust the set of displayed candidates adaptively for each radiologist,such as by changing the criteria for displaying lesion candidates based on thetendency of radiologists to overlook lesions in specific regions. That is, a person-alized CAD system optimized for each radiologist’s interpretation characteristics
can be realized. This aspect is as important as improving the performance of theCAD software.
5 Conclusion
We have built an integrated platform for the development and assessment of var-ious types of image analysis software, named CIRCUS. Our current works coverthe implementation of an interface for the on-line learning of CAD software, andthe tracking of longitudinal changes in performance by the refinement or adap-tation of the CAD software in our system. A software toolkit of the web-basedclinical server (CIRCUS CS) will be made publicity available after multicentertrials.
Acknowledgment
This study was partially supported by a Grant-in-Aid for Cancer Research fromthe Ministry of Health, Labour and Welfare, and a Grant-in-Aid and for Com-prehensive Research on Aging and Health from the Ministry of Health, Labourand Welfare.
References
1. Pietka, E., Kawa, J.: Web oriented CAD architecture, International Journal ofComputer Assisted Radiology and Surgery, 3, pp.S161–S162 (2008)
2. Le, A.H.T., Liu, B., Huang, H.K.: Integration of computer-aided diagno-sis/detection (CAD) results in a PACS environment using CAD-PACS toolkit andDICOM SR. International Journal of Computer Assisted Radiology and Surgery,4, pp.317–329 (2009)
3. Azevedo-Marques, P., Salomao, S.C., Traina, A.J.M., da Silva, M.P., Macedo, A.A.,Pessotti, H.C.: CAD-PACS integration: a framework for pattern recognition of dif-fuse lung disease in HRCT. International Journal of Computer Assisted Radiologyand Surgery, 4, pp.S180–S181 (2009)
4. Martinelli, M., Moroni, D., Salvetti, O., Tampucci, M.: A knowledge-based infras-tructure for the management of diagnostic imaging procedures in the heart failuredomain. Transactions on Mass-Data Analysis of Images and Signals, 2, pp.3–18(2010)
5. Winter, L., Motal, Y., Docef, A.: On-line versus off-line accelerated kernel featureanalysis: Application to computer-aided detection of polyps in CT colonography.Signal Processing, 90, pp.2456–2467 (2010)
6. Masumoto, T., Masutani, Y., Hayashi, N., Aoki, S., Mori H., Abe, O.: Automateddetection system for cerebral aneurysm in magnetic resonance angiography: devel-opment and initial clinical experiences in multiple MRI scanners. In: RSNA 200490th Scientific Assembly and Annual Meeting of Radiological Society of NorthAmerica, 2227NR-p (2004)

7. Nomura, Y., Nemoto, M., Masutani, Y., Maeda, E., Itoh, H., Hanaoka, S.,Yoshikawa, T., Hayashi, N., Yoshioka, N., Ohtomo, K.: Computerized detectionof pulmonary nodules based on dual classifiers for juxta-pleural and non-pleuralnodules. International Journal of Computer Assisted Radiology and Surgery, 3,pp.S186–S187 (2008)
8. Nemoto, M., Nomura, Y., Masutani, Y., Hanaoka, S., Yoshikawa, T., Hayashi, N.,Yoshioka, N., Ohtomo, K.: Development of ensemble based lesion detection methodfor body trunk FDG-PET/CT images. International Journal of Computer AssistedRadiology and Surgery, 4, pp.S190–S191 (2009)
9. Hanaoka, S., Nomura, Y., Nemoto, M., Masutani, Y., Maeda, E., Yoshikawa, T.,Hayashi, N., Yoshioka, N., Ohtomo, K.: Automated segmentation method for spinalcolumn based on a dual elliptic column model and its application for virtual spinalstraightening. Journal of Computer Assisted Tomography, 34, pp.156–162 (2010)
10. DCMTK – DICOM Toolkit, http://dicom.offis.de/dcmtk.php.en11. Yang, J., Staib, L., Duncan, J.: Neighbor-constrained segmentation with level set
based 3-D deformable models. IEEE Transactions on Medical Imaging, 23, pp.940–948 (2004)
12. Boykov, Y., Funka-Lea, G.: Graph cuts and efficient n-d image segmentation. In-ternational Journal of Computer Vision, 70, pp.109–131 (2006)
13. Pietka, E., Kawa, J., Spinczyk, D., Badura, P., Wieclawek, W., Czajkowska, J.,Rudzki, M.: Role of radiologists in CAD life-cycle. European Journal of Radiology(2009), doi:10.1016/j.ejrad.2009.08.015