Center for Workforce Studies - Michigan · Prepared by AAMC Center for Workforce Studies, ... AMA...
46
Physician Workforce Issues Atul Grover, MD, PhD, FCCP Center for Workforce Studies Wayne State University March 9, 2007
Transcript of Center for Workforce Studies - Michigan · Prepared by AAMC Center for Workforce Studies, ... AMA...

Physician Workforce Issues
Atul Grover, MD, PhD, FCCPCenter for Workforce Studies
Wayne State University
March 9, 2007
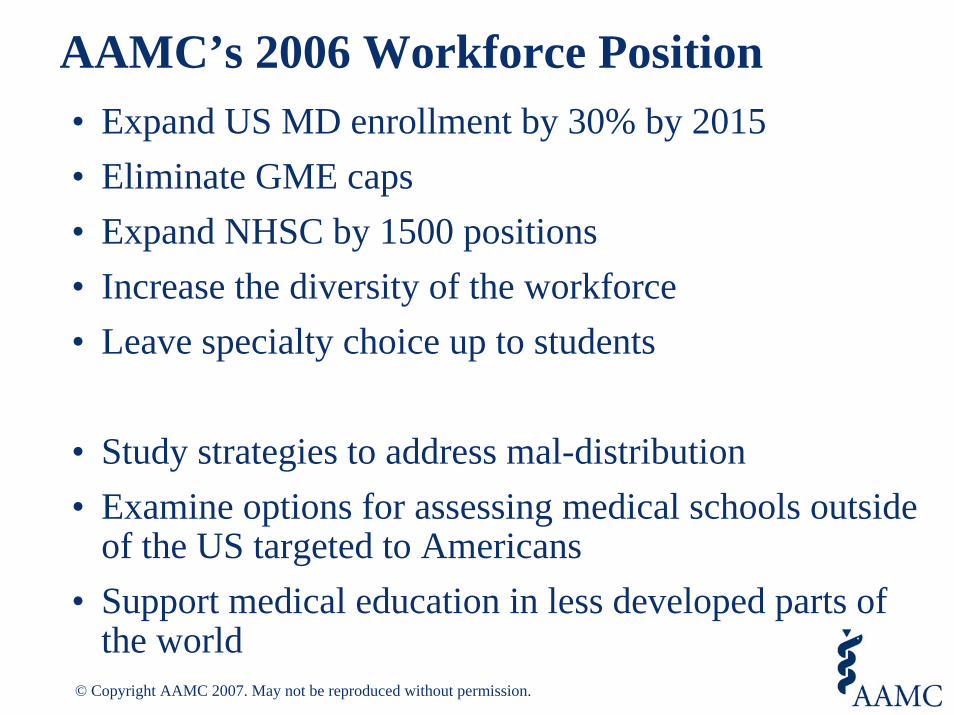
AAMC’s 2006 Workforce Position• Expand US MD enrollment by 30% by 2015• Eliminate GME caps • Expand NHSC by 1500 positions• Increase the diversity of the workforce• Leave specialty choice up to students
• Study strategies to address mal-distribution• Examine options for assessing medical schools outside
of the US targeted to Americans• Support medical education in less developed parts of
the world© Copyright AAMC 2007. May not be reproduced without permission.
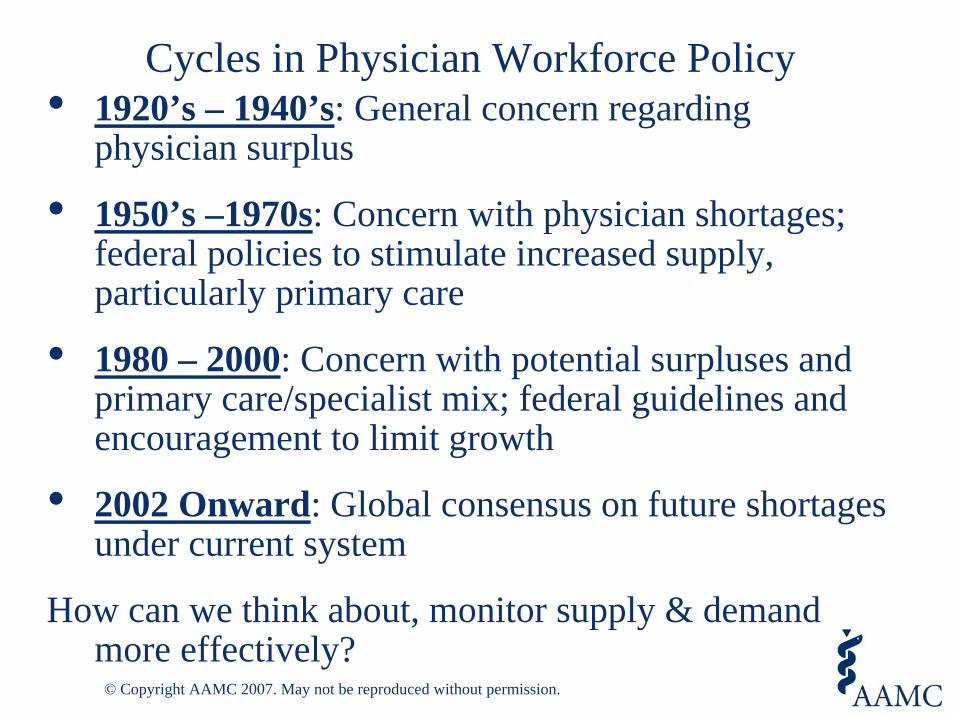
Cycles in Physician Workforce Policy• 1920’s – 1940’s: General concern regarding
physician surplus
• 1950’s –1970s: Concern with physician shortages; federal policies to stimulate increased supply, particularly primary care
• 1980 – 2000: Concern with potential surpluses and primary care/specialist mix; federal guidelines and encouragement to limit growth
• 2002 Onward: Global consensus on future shortages under current system
How can we think about, monitor supply & demand more effectively?
© Copyright AAMC 2007. May not be reproduced without permission.
Challenges to Effective Physician Workforce Planning
Very long time frames to change supply or distribution
Uncertain impact of new medical technology
Uncertain future organization, finance, delivery
Difficulty in distinguishing demand vs. need
Lack of good or consistent data
Who should/would be responsible?
© Copyright AAMC 2007. May not be reproduced without permission.
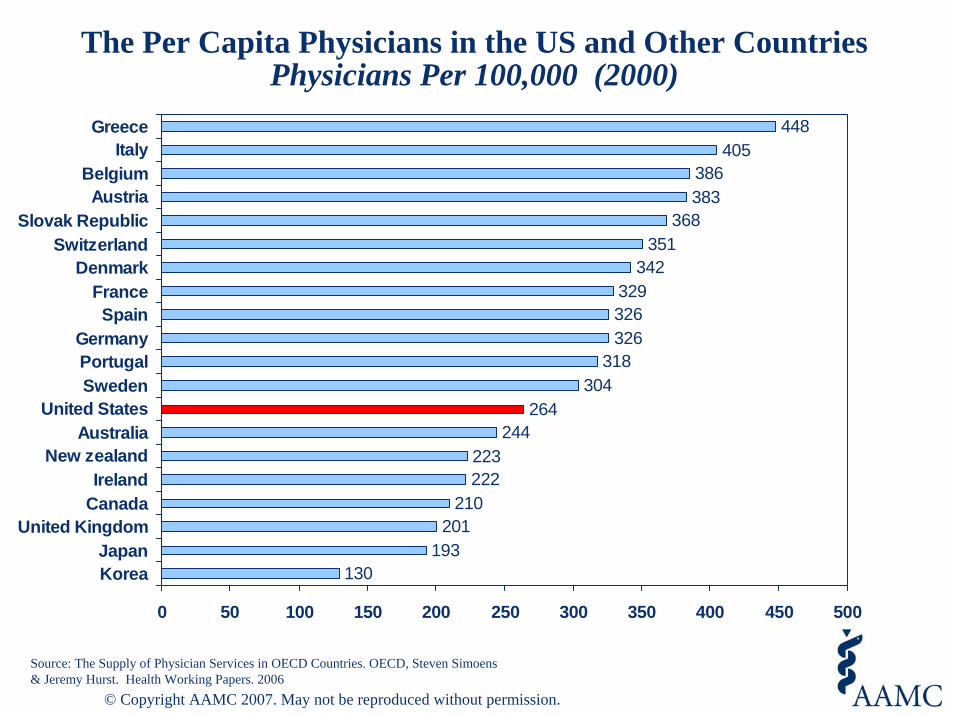
The Per Capita Physicians in the US and Other CountriesPhysicians Per 100,000 (2000)
Source: The Supply of Physician Services in OECD Countries. OECD, Steven Simoens & Jeremy Hurst. Health Working Papers. 2006
130193
201210
222223
244264
304318
326326329
342351
368383386
405448
0 50 100 150 200 250 300 350 400 450 500
KoreaJapan
United KingdomCanadaIreland
New zealandAustralia
United StatesSwedenPortugalGermany
SpainFrance
DenmarkSwitzerland
Slovak RepublicAustria
BelgiumItaly
Greece
© Copyright AAMC 2007. May not be reproduced without permission.
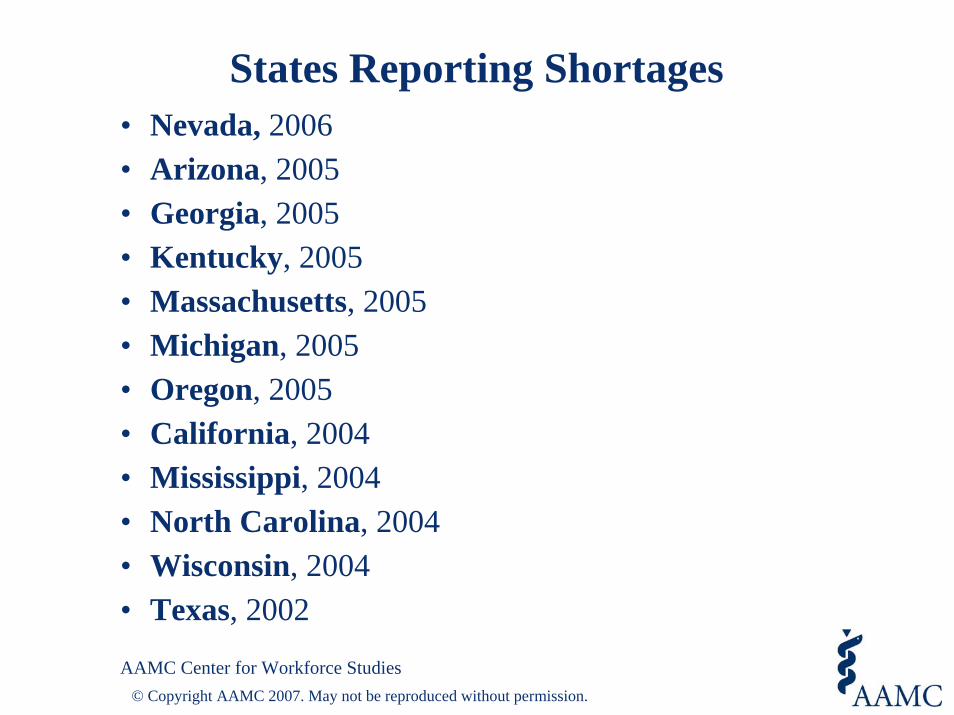
States Reporting Shortages• Nevada, 2006• Arizona, 2005• Georgia, 2005• Kentucky, 2005• Massachusetts, 2005• Michigan, 2005• Oregon, 2005• California, 2004• Mississippi, 2004 • North Carolina, 2004• Wisconsin, 2004• Texas, 2002
AAMC Center for Workforce Studies© Copyright AAMC 2007. May not be reproduced without permission.
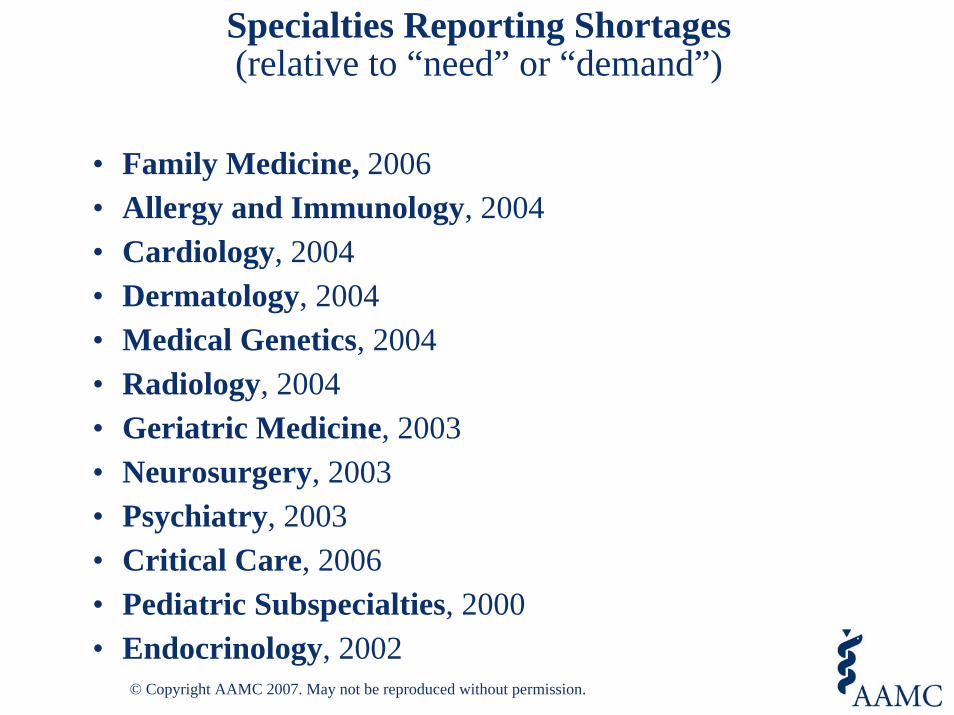
Specialties Reporting Shortages(relative to “need” or “demand”)
• Family Medicine, 2006• Allergy and Immunology, 2004 • Cardiology, 2004 • Dermatology, 2004• Medical Genetics, 2004 • Radiology, 2004• Geriatric Medicine, 2003 • Neurosurgery, 2003 • Psychiatry, 2003 • Critical Care, 2006• Pediatric Subspecialties, 2000• Endocrinology, 2002
© Copyright AAMC 2007. May not be reproduced without permission.
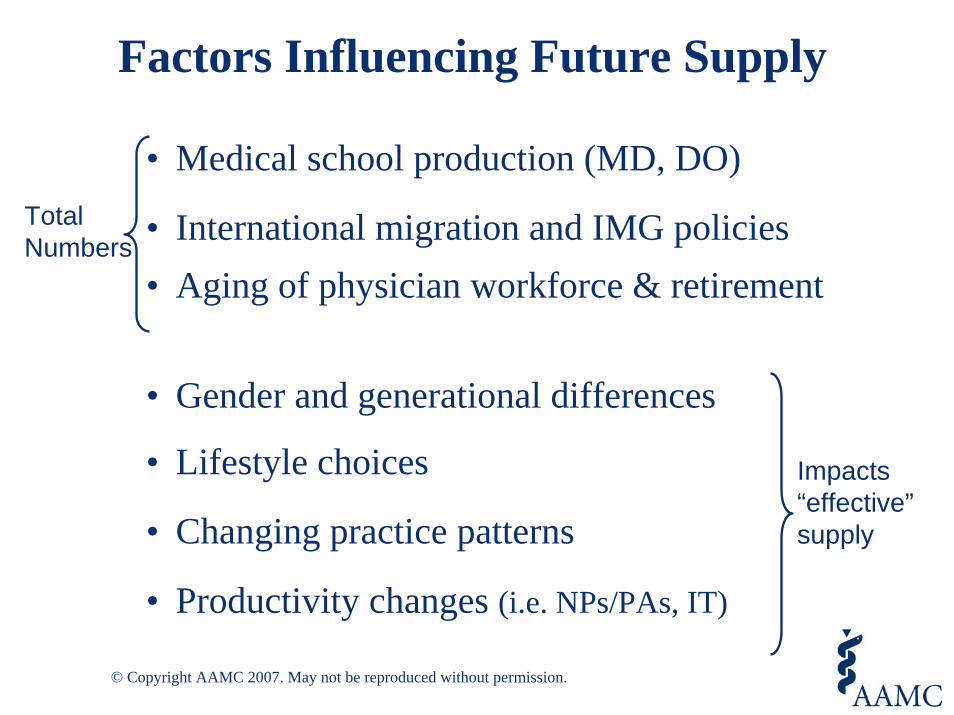
Factors Influencing Future Supply
• Medical school production (MD, DO)
• International migration and IMG policies• Aging of physician workforce & retirement
• Gender and generational differences
• Lifestyle choices
• Changing practice patterns
• Productivity changes (i.e. NPs/PAs, IT)
Total Numbers
Impacts “effective”supply
© Copyright AAMC 2007. May not be reproduced without permission.
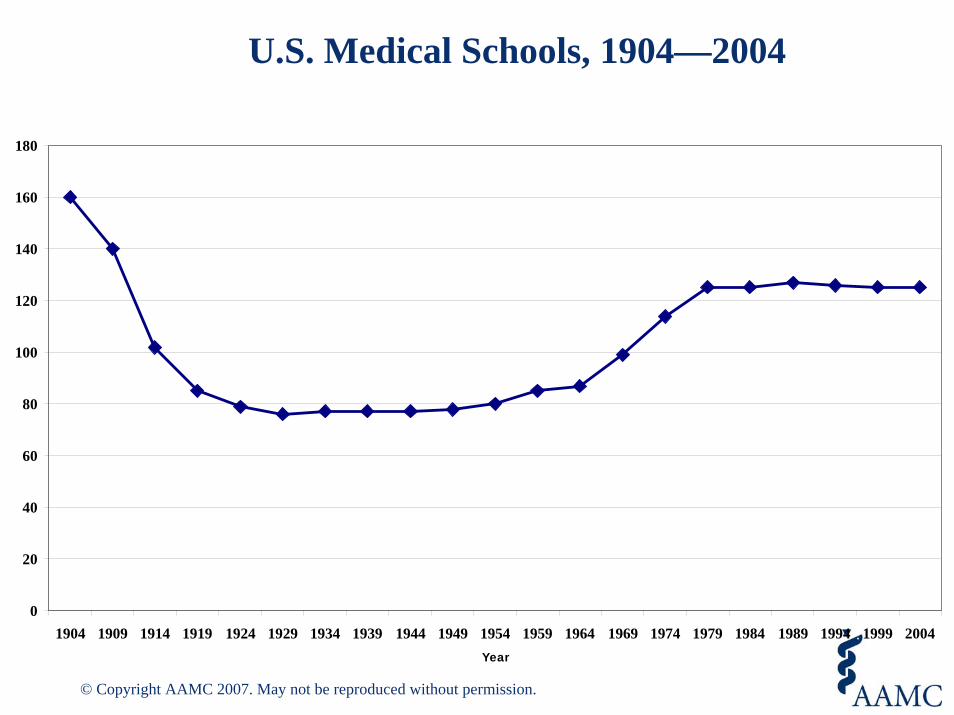
U.S. Medical Schools, 1904—2004
0
20
40
60
80
100
120
140
160
180
1904 1909 1914 1919 1924 1929 1934 1939 1944 1949 1954 1959 1964 1969 1974 1979 1984 1989 1994 1999 2004Year
© Copyright AAMC 2007. May not be reproduced without permission.

Medical School Graduates, 1904—2004
0
2000
4000
6000
8000
10000
12000
14000
16000
18000
1904 1909 1914 1919 1924 1929 1934 1939 1944 1949 1954 1959 1964 1969 1974 1979 1984 1989 1994 1999 2004
Total Graduates
© Copyright AAMC 2007. May not be reproduced without permission.
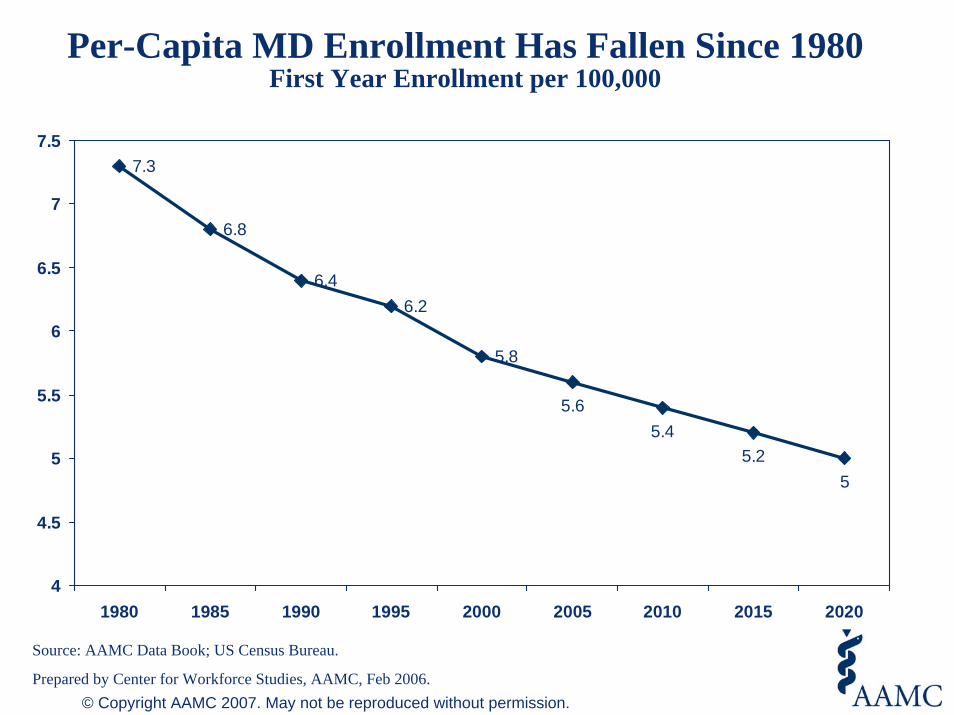
Per-Capita MD Enrollment Has Fallen Since 1980 First Year Enrollment per 100,000
Source: AAMC Data Book; US Census Bureau.
Prepared by Center for Workforce Studies, AAMC, Feb 2006.
5.65.4
5.25
5.8
6.26.4
6.8
7.3
4
4.5
5
5.5
6
6.5
7
7.5
1980 1985 1990 1995 2000 2005 2010 2015 2020
© Copyright AAMC 2007. May not be reproduced without permission.
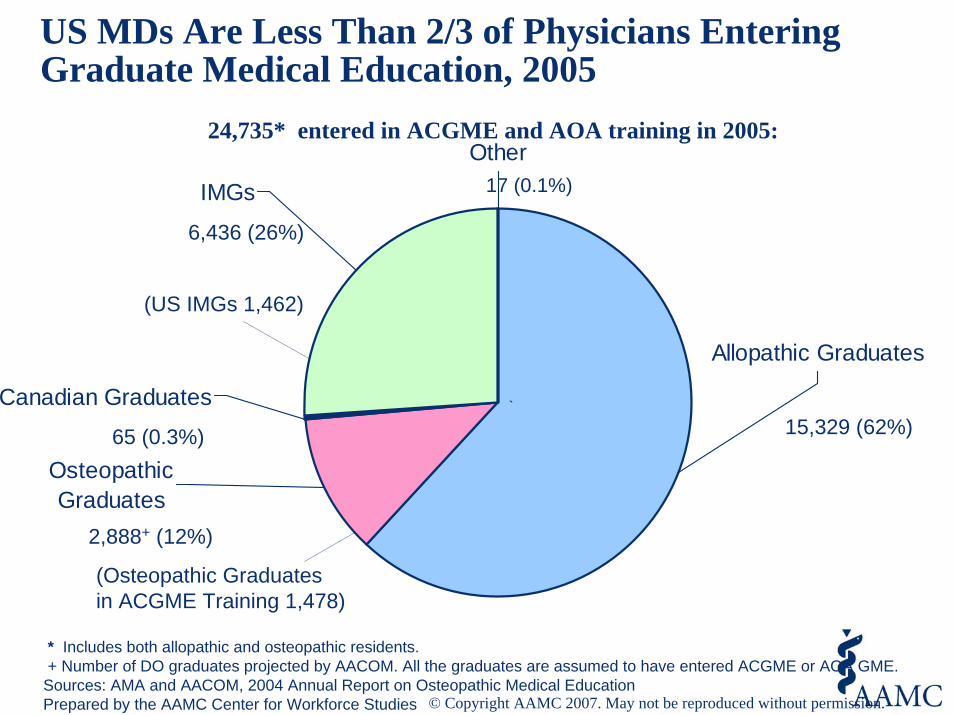
US MDs Are Less Than 2/3 of Physicians Entering Graduate Medical Education, 2005
24,735* entered in ACGME and AOA training in 2005:
* Includes both allopathic and osteopathic residents.+ Number of DO graduates projected by AACOM. All the graduates are assumed to have entered ACGME or AOA GME.
Sources: AMA and AACOM, 2004 Annual Report on Osteopathic Medical EducationPrepared by the AAMC Center for Workforce Studies
(Osteopathic Graduates in ACGME Training 1,478)
15,329 (62%)
2,888+ (12%)
65 (0.3%)
6,436 (26%)
17 (0.1%)
(US IMGs 1,462)
Allopathic Graduates
Other
IMGs
Canadian Graduates
Osteopathic Graduates
`
© Copyright AAMC 2007. May not be reproduced without permission.
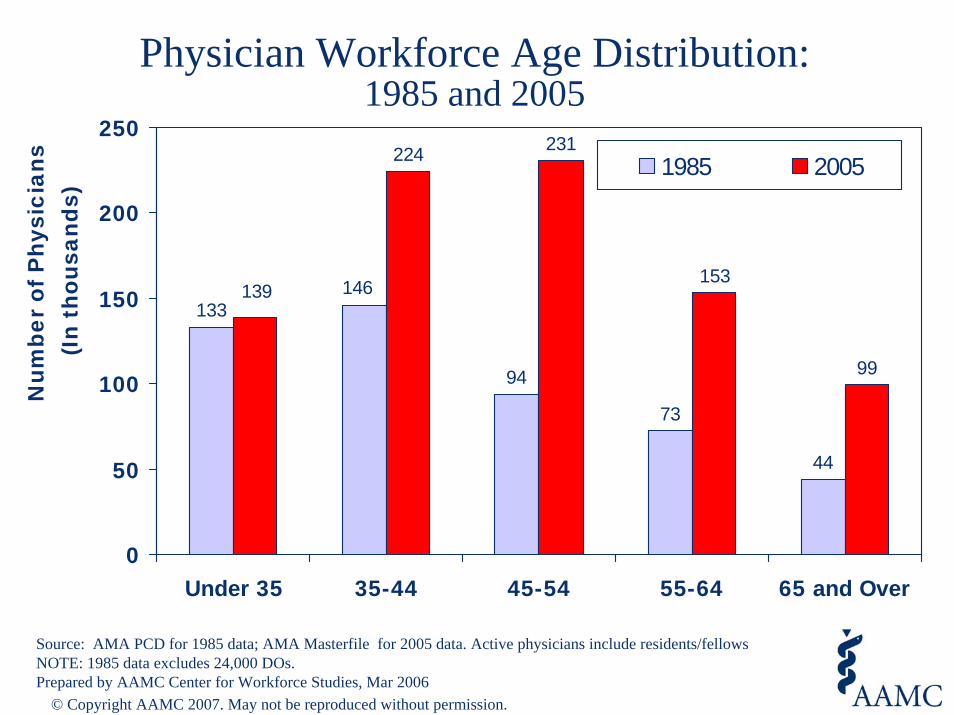
Physician Workforce Age Distribution:1985 and 2005
Source: AMA PCD for 1985 data; AMA Masterfile for 2005 data. Active physicians include residents/fellowsNOTE: 1985 data excludes 24,000 DOs. Prepared by AAMC Center for Workforce Studies, Mar 2006
94
73
44
224 231
153
99
146133
139
0
50
100
150
200
250
Under 35 35-44 45-54 55-64 65 and Over
Num
ber
of P
hysi
cian
s(I
n th
ousa
nds)
1985 2005
© Copyright AAMC 2007. May not be reproduced without permission.
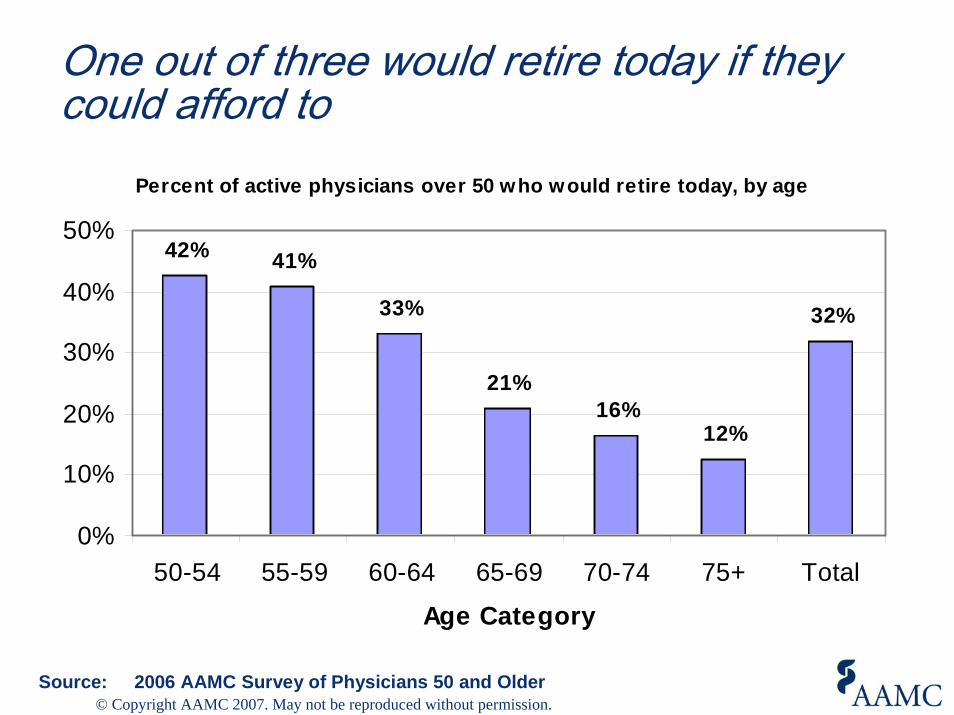
One out of three would retire today if they could afford to
Percent of active physicians over 50 who would retire today, by age
42% 41%
33%
21%16%
12%
32%
0%
10%
20%
30%
40%
50%
50-54 55-59 60-64 65-69 70-74 75+ Total
Age Category
Source: 2006 AAMC Survey of Physicians 50 and Older© Copyright AAMC 2007. May not be reproduced without permission.
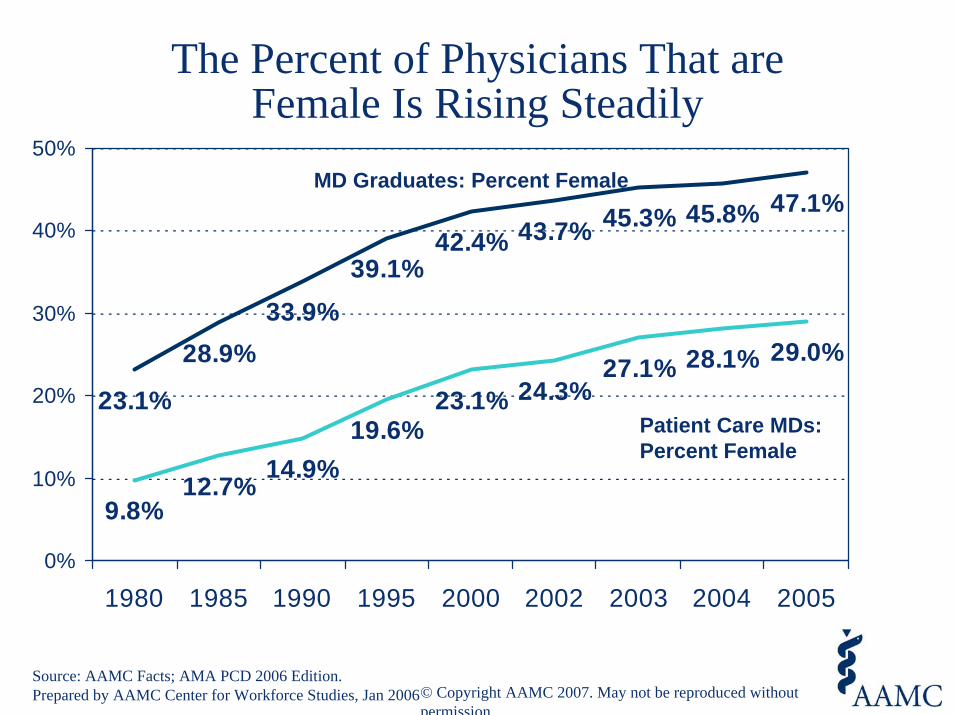
The Percent of Physicians That are Female Is Rising Steadily
Source: AAMC Facts; AMA PCD 2006 Edition.Prepared by AAMC Center for Workforce Studies, Jan 2006
MD Graduates: Percent Female
Patient Care MDs: Percent Female
23.1%
28.9%33.9%
39.1%42.4% 43.7% 45.3% 45.8% 47.1%
9.8%12.7% 14.9%
19.6%23.1% 24.3%
27.1% 28.1% 29.0%
0%
10%
20%
30%
40%
50%
1980 1985 1990 1995 2000 2002 2003 2004 2005
© Copyright AAMC 2007. May not be reproduced without permission.
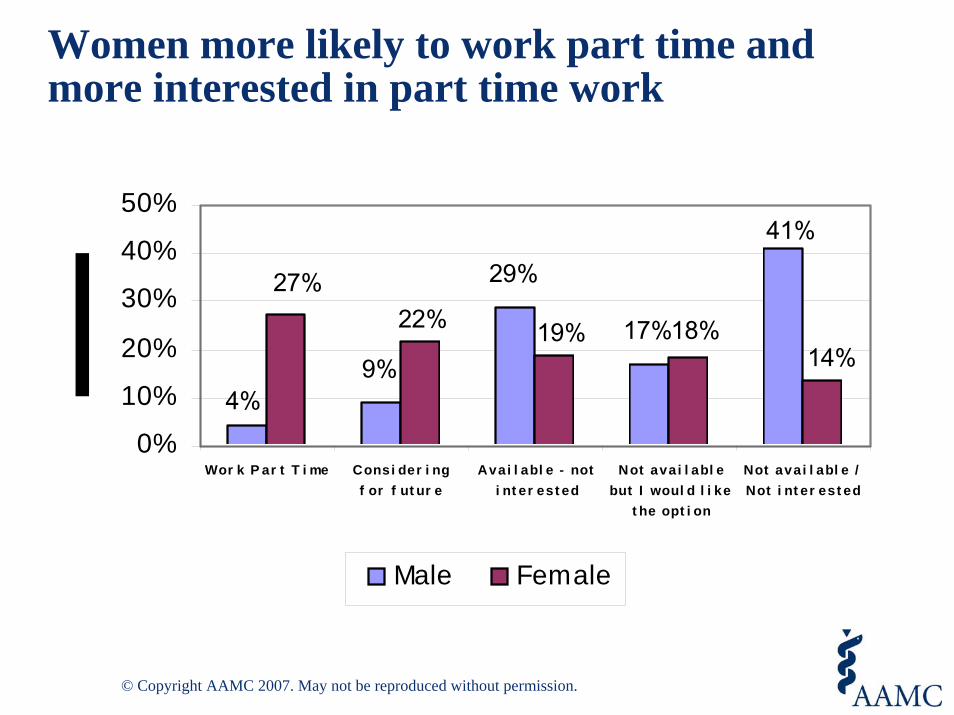
Women more likely to work part time and more interested in part time work
29%
17%
41%
4%9% 14%
19%22%27%
18%
0%
10%
20%
30%
40%
50%
Wor k P ar t T i me Consi der i ngf or f ut ur e
Avai l abl e - noti nt er est ed
Not avai l abl ebut I woul d l i ke
t he opt i on
Not avai l abl e /Not i nt er est ed
Male Female
© Copyright AAMC 2007. May not be reproduced without permission.
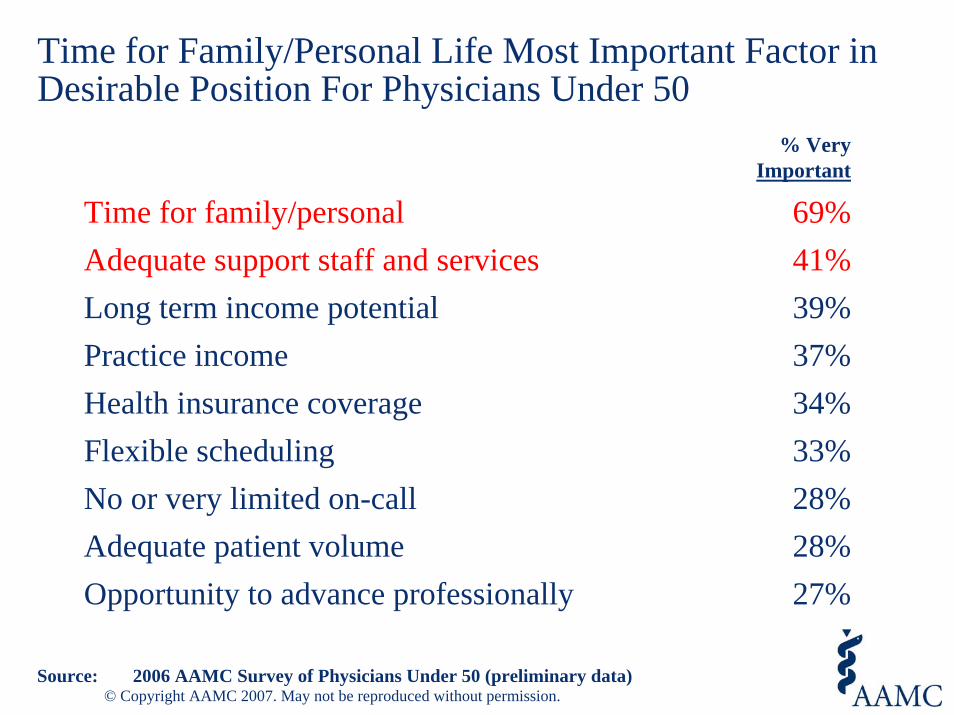
Time for Family/Personal Life Most Important Factor in Desirable Position For Physicians Under 50
% Very Important
Time for family/personal 69%Adequate support staff and services 41%Long term income potential 39%Practice income 37%Health insurance coverage 34%Flexible scheduling 33%No or very limited on-call 28%Adequate patient volume 28%Opportunity to advance professionally 27%
Source: 2006 AAMC Survey of Physicians Under 50 (preliminary data)© Copyright AAMC 2007. May not be reproduced without permission.
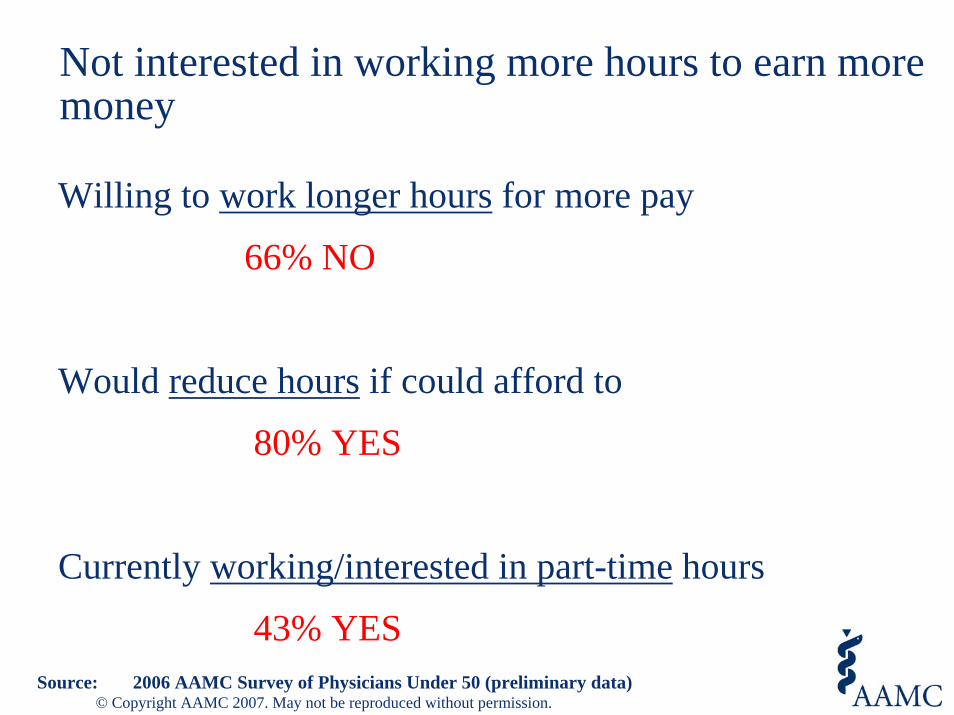
Not interested in working more hours to earn more money
Willing to work longer hours for more pay
66% NO
Would reduce hours if could afford to
80% YES
Currently working/interested in part-time hours
43% YESSource: 2006 AAMC Survey of Physicians Under 50 (preliminary data)
© Copyright AAMC 2007. May not be reproduced without permission.
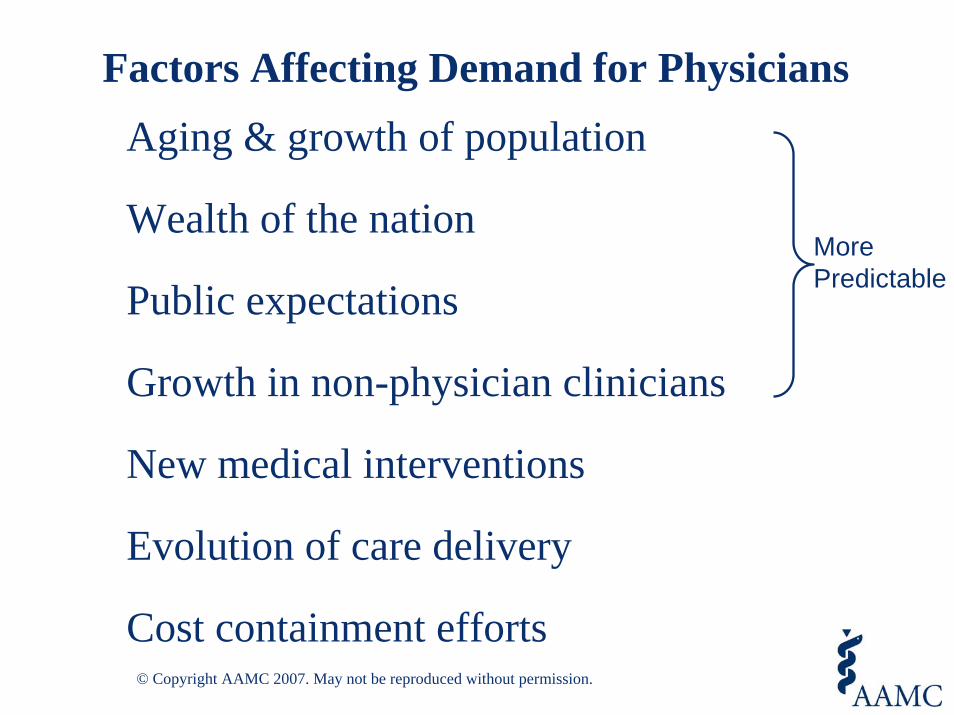
Factors Affecting Demand for PhysiciansAging & growth of population
Wealth of the nation
Public expectations
Growth in non-physician clinicians
New medical interventions
Evolution of care delivery
Cost containment efforts
MorePredictable
© Copyright AAMC 2007. May not be reproduced without permission.
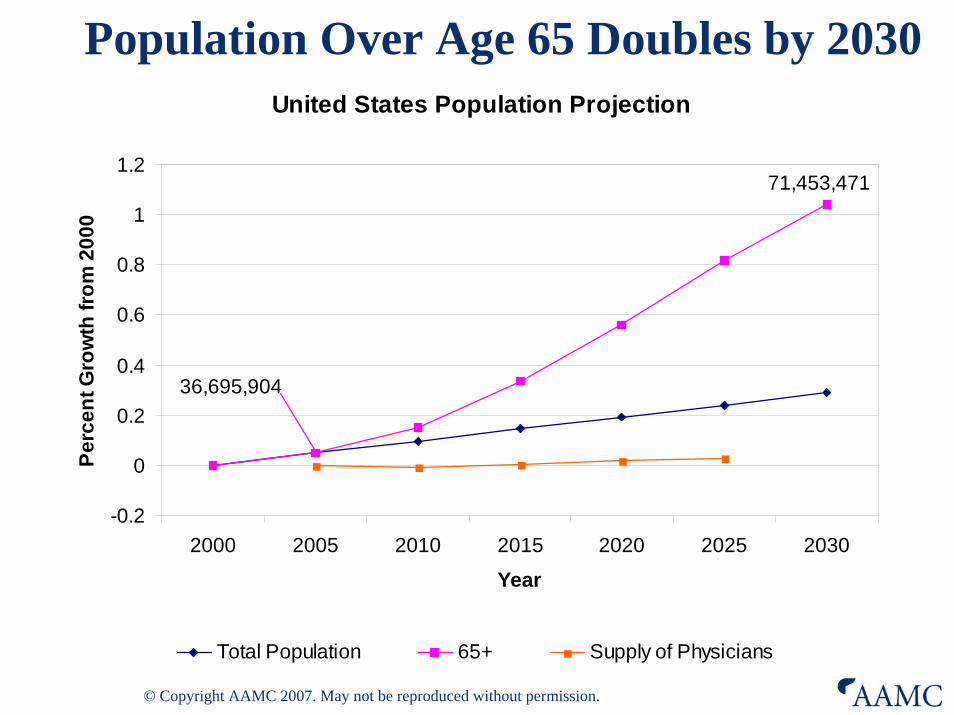
Population Over Age 65 Doubles by 2030United States Population Projection
36,695,904
71,453,471
-0.2
0
0.2
0.4
0.6
0.8
1
1.2
2000 2005 2010 2015 2020 2025 2030
Year
Perc
ent G
row
th fr
om 2
000
Total Population 65+ Supply of Physicians
© Copyright AAMC 2007. May not be reproduced without permission.
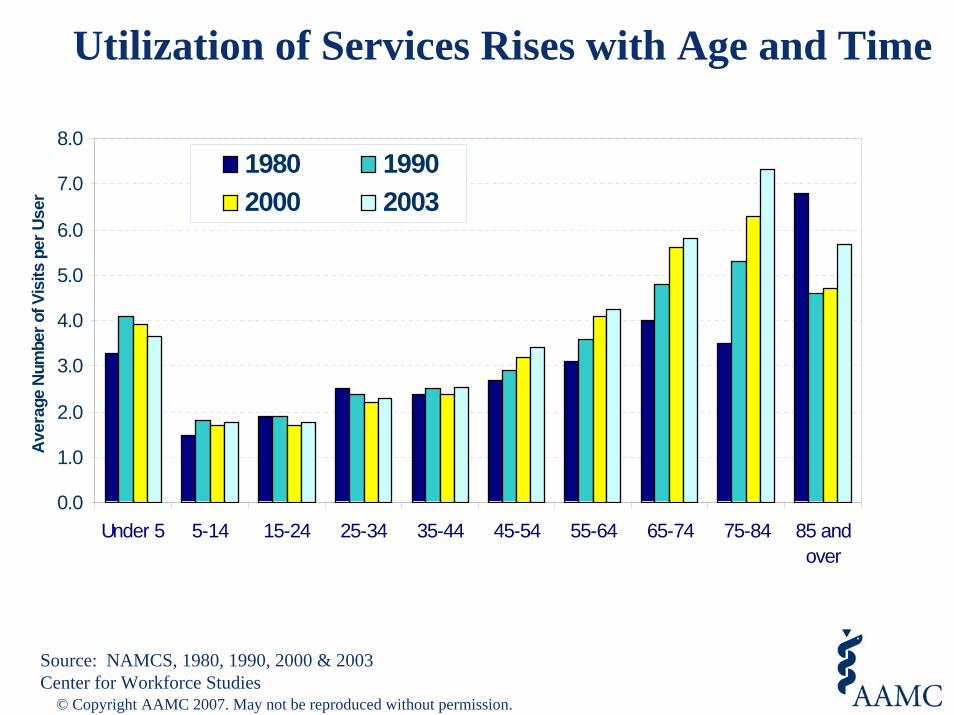
Utilization of Services Rises with Age and Time
Source: NAMCS, 1980, 1990, 2000 & 2003Center for Workforce Studies
0.0
1.0
2.0
3.0
4.0
5.0
6.0
7.0
8.0
Under 5 5-14 15-24 25-34 35-44 45-54 55-64 65-74 75-84 85 andover
Age
Aver
age
Num
ber o
f Vis
its p
er U
ser
1980 19902000 2003
© Copyright AAMC 2007. May not be reproduced without permission.
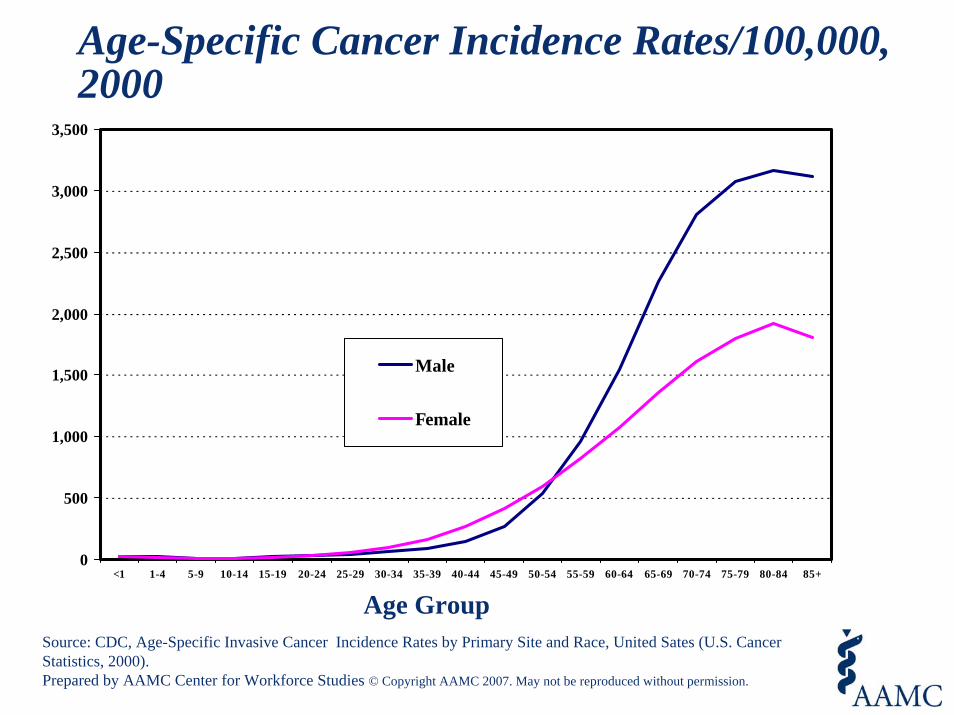
Age-Specific Cancer Incidence Rates/100,000, 2000
0
500
1,000
1,500
2,000
2,500
3,000
3,500
<1 1-4 5-9 10-14 15-19 20-24 25-29 30-34 35-39 40-44 45-49 50-54 55-59 60-64 65-69 70-74 75-79 80-84 85+
Male
Female
Source: CDC, Age-Specific Invasive Cancer Incidence Rates by Primary Site and Race, United Sates (U.S. Cancer Statistics, 2000). Prepared by AAMC Center for Workforce Studies © Copyright AAMC 2007. May not be reproduced without permission.
Age Group
Future Supply and Demand: The Bottom Line
The gross physician to population ratio in the US will peak around 2020, even with expansion
Effective supply of physicians likely to be lower as physicians work fewer hours
The baby boom generation – with higher expectations - will begin to turn 70 years old in 2016, increasing per capita demand
© Copyright AAMC 2007. May not be reproduced without permission.
International Medical School Graduates (IMGs): Why the Concern Now?
International concern about brain drain from less-developed to more-developed countries.
Global shortage of human resources in health.
Growth of off-shore for-profit schools primarily for US citizens but outside of US accrediting systems (15 new schools in the past decade)
1,500 US-IMGs entering GME annually.
As many as 2,500 US-citizens each year now enter a foreign medical school.
© Copyright AAMC 2007. May not be reproduced without permission.
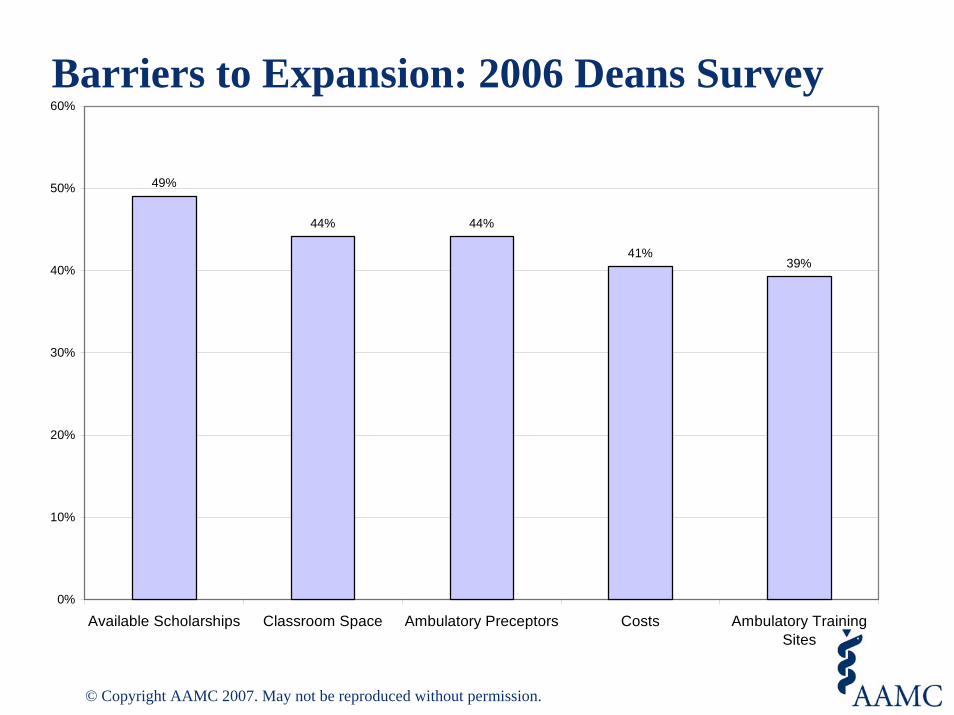
Barriers to Expansion: 2006 Deans Survey
49%
44% 44%
41%39%
0%
10%
20%
30%
40%
50%
60%
Available Scholarships Classroom Space Ambulatory Preceptors Costs Ambulatory TrainingSites
© Copyright AAMC 2007. May not be reproduced without permission.
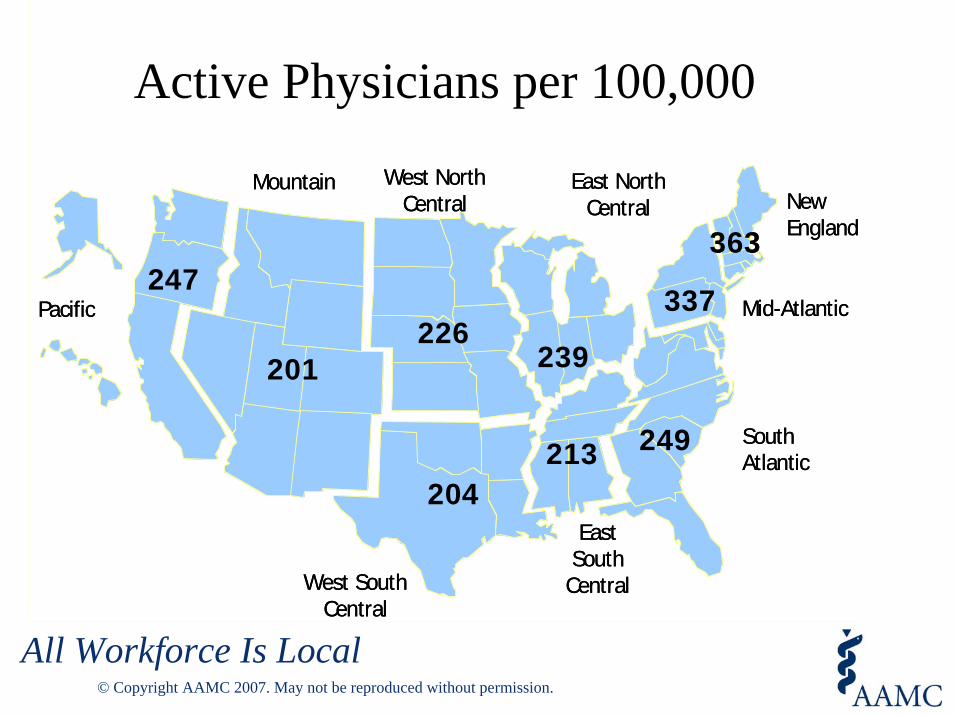
Active Physicians per 100,000
NewEngland
Mid-Atlantic
East North Central
West North Central
West South Central
Mountain
Pacific
EastSouth Central
South Atlantic
247
201226
204
239
213 249
337
363NewEngland
Mid-Atlantic
East North Central
West North Central
West South Central
Mountain
Pacific
EastSouth Central
South Atlantic
247
201226
204
239
213 249
337
363
All Workforce Is Local© Copyright AAMC 2007. May not be reproduced without permission.
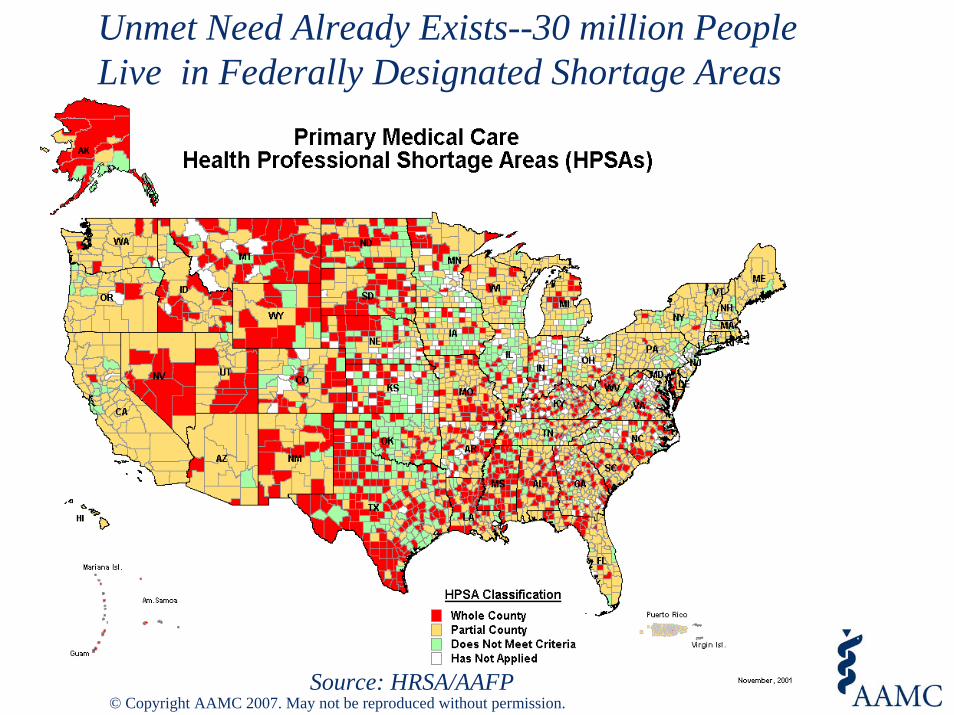
Unmet Need Already Exists--30 million People Live in Federally Designated Shortage Areas
Source: HRSA/AAFP© Copyright AAMC 2007. May not be reproduced without permission.
© Copyright AAMC 2007. May not be reproduced without permission.
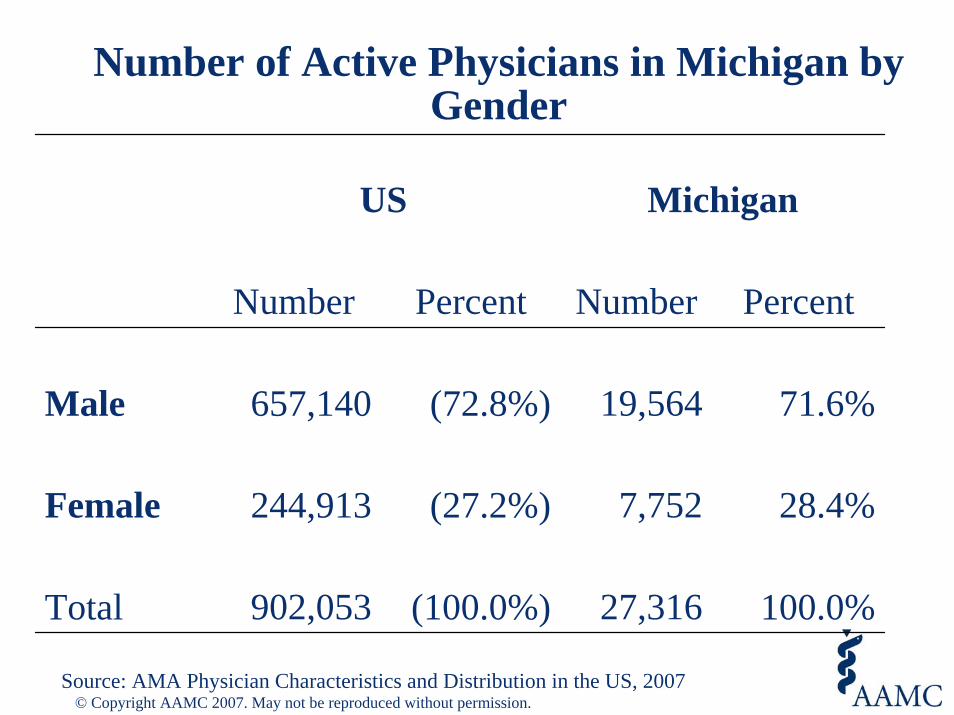
Number of Active Physicians in Michigan by Gender
US Michigan
Number Percent Number Percent
Male 657,140 (72.8%) 19,564 71.6%
Female 244,913 (27.2%) 7,752 28.4%
Total 902,053 (100.0%) 27,316 100.0%
Source: AMA Physician Characteristics and Distribution in the US, 2007© Copyright AAMC 2007. May not be reproduced without permission.
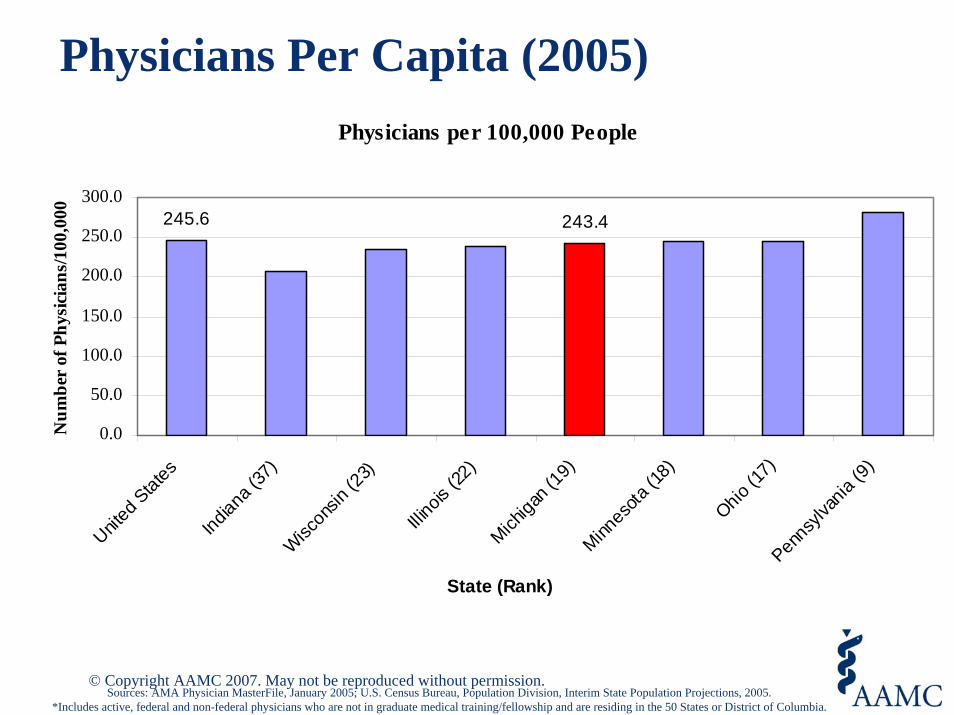
Physicians Per Capita (2005)
Sources: AMA Physician MasterFile, January 2005; U.S. Census Bureau, Population Division, Interim State Population Projections, 2005.*Includes active, federal and non-federal physicians who are not in graduate medical training/fellowship and are residing in the 50 States or District of Columbia.
Physicians per 100,000 People
245.6 243.4
0.0
50.0
100.0
150.0
200.0
250.0
300.0
United
States
Indian
a (37
)Wisc
onsin
(23)
Illinois
(22)
Michiga
n (19
)Minn
esota
(18)
Ohio (1
7)Pen
nsylv
ania
(9)
State (Rank)
Num
ber
of P
hysi
cian
s/10
0,00
0
© Copyright AAMC 2007. May not be reproduced without permission.
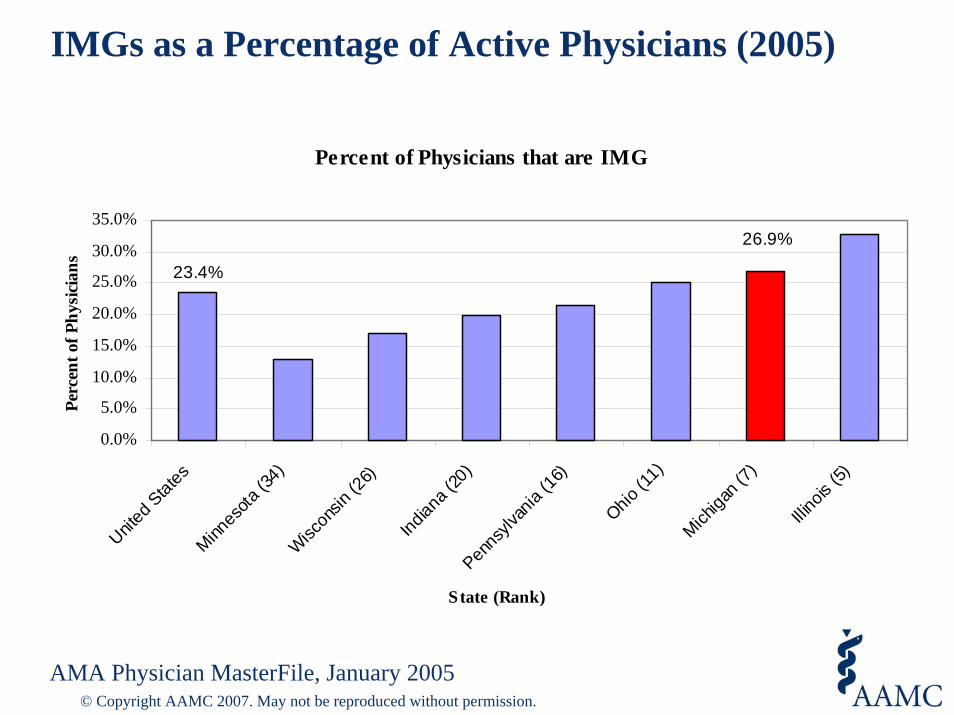
IMGs as a Percentage of Active Physicians (2005)
AMA Physician MasterFile, January 2005
Percent of Physicians that are IMG
23.4%
26.9%
0.0%
5.0%
10.0%
15.0%
20.0%
25.0%
30.0%
35.0%
United
States
Minnes
ota (3
4)Wisc
onsin
(26)
Indian
a (20
)Pen
nsylv
ania
(16)
Ohio (1
1)
Michiga
n (7)
Illinois
(5)
State (Rank)
Perc
ent o
f Phy
sici
ans
© Copyright AAMC 2007. May not be reproduced without permission.
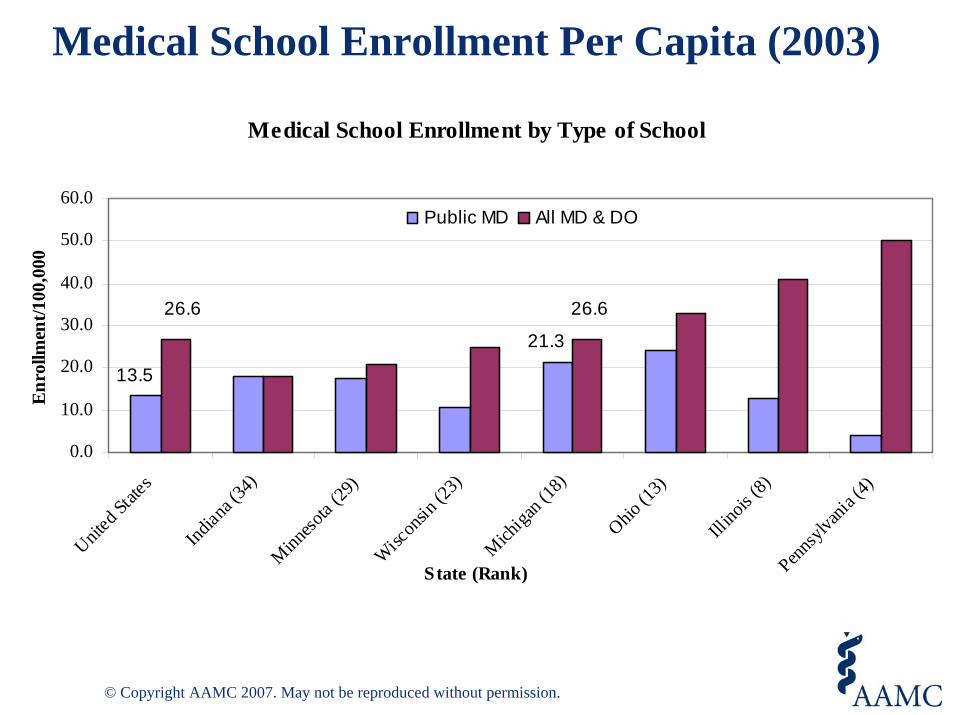
Medical School Enrollment Per Capita (2003)
Medical School Enrollment by Type of School
21.3
13.5
26.626.6
0.0
10.0
20.0
30.0
40.0
50.0
60.0
United
State
s
Indian
a (34
)Minn
esota
(29)
Wiscon
sin (2
3)
Michiga
n (18
)
Ohio (1
3)
Illino
is (8)
Pennsyl
vania
(4)
State (Rank)
Enr
ollm
ent/1
00,0
00
Public MD All MD & DO
© Copyright AAMC 2007. May not be reproduced without permission.
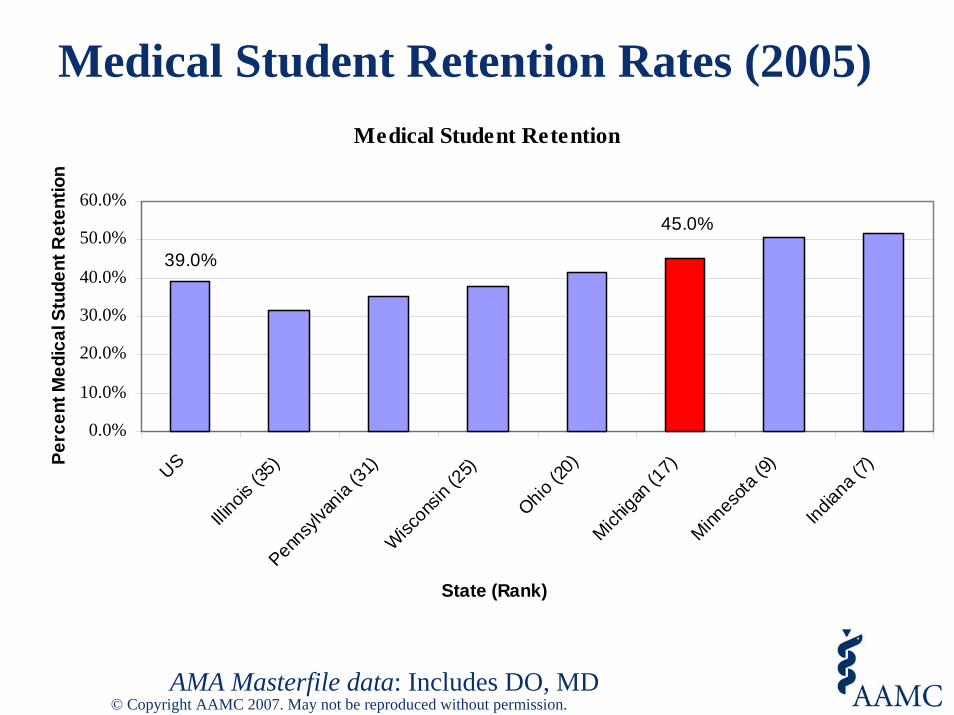
Medical Student Retention Rates (2005)
AMA Masterfile data: Includes DO, MD
Medical Student Retention
39.0%
45.0%
0.0%
10.0%
20.0%
30.0%
40.0%
50.0%
60.0%
US
Illinois
(35)
Penns
ylvan
ia (31
)Wisc
onsin
(25)
Ohio (2
0)Mich
igan (
17)
Minnes
ota (9
)
Indian
a (7)
State (Rank)
Perc
ent M
edic
al S
tude
nt R
eten
tion
© Copyright AAMC 2007. May not be reproduced without permission.
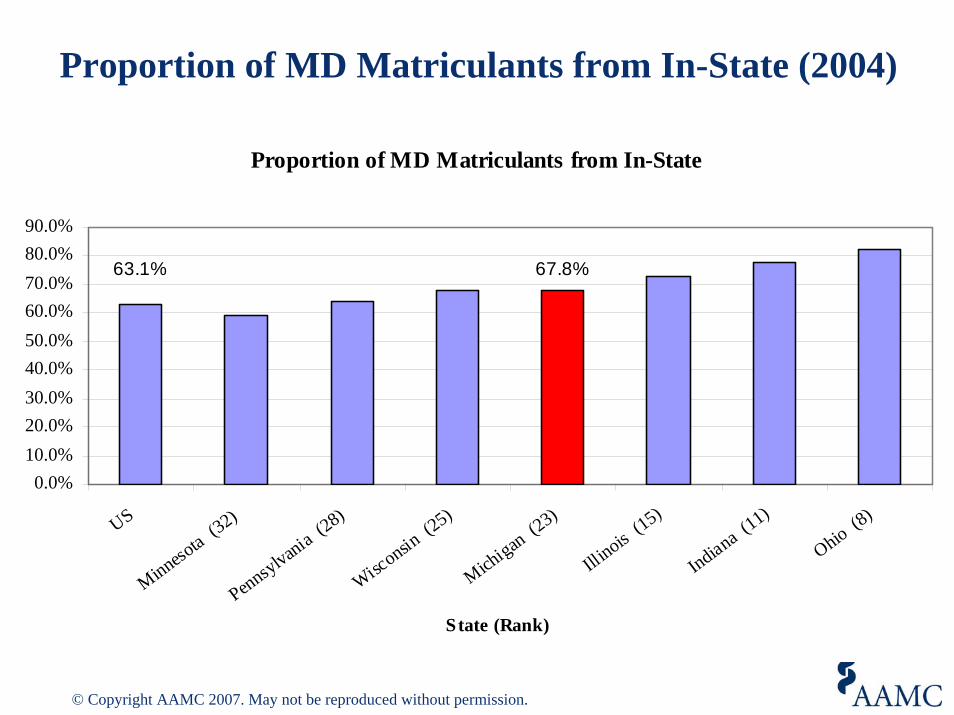
Proportion of MD Matriculants from In-State (2004)
Proportion of MD Matriculants from In-State
63.1% 67.8%
0.0%10.0%20.0%30.0%40.0%50.0%60.0%70.0%80.0%90.0%
US
Minnesota (3
2)
Pennsylvania (28)
Wisconsin
(25)
Michigan (2
3)
Illinois
(15)
Indiana (11)
Ohio (8)
State (Rank)
© Copyright AAMC 2007. May not be reproduced without permission.
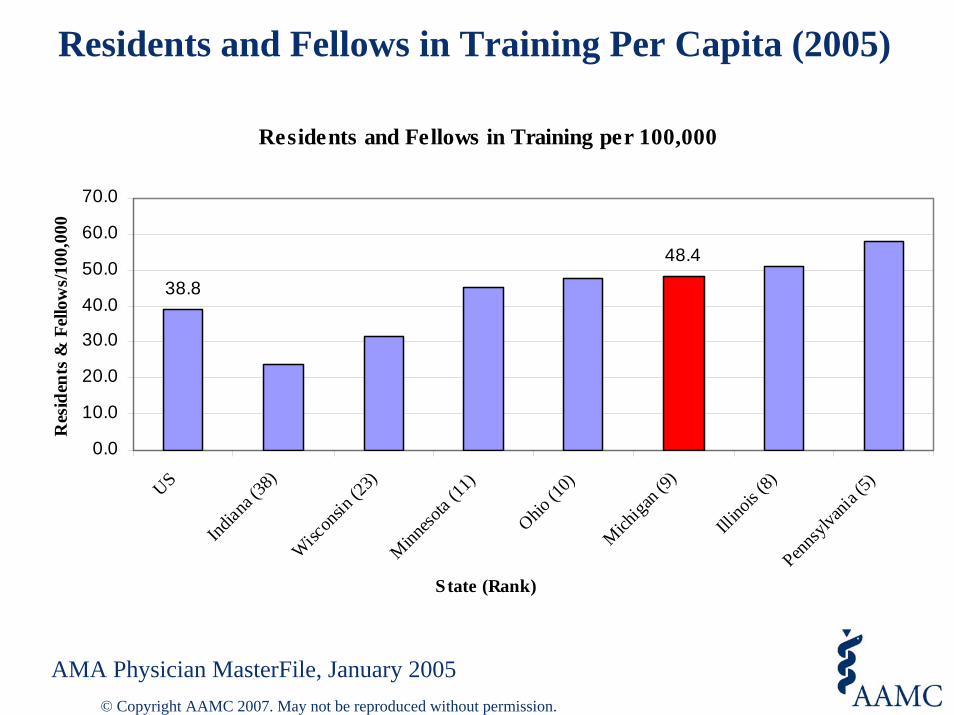
Residents and Fellows in Training Per Capita (2005)
AMA Physician MasterFile, January 2005
Residents and Fellows in Training per 100,000
38.8
48.4
0.0
10.0
20.0
30.0
40.0
50.0
60.0
70.0
US
Indian
a (38
)Wisc
onsin
(23)
Minneso
ta (11
)
Ohio (1
0)
Michiga
n (9)
Illino
is (8)
Pennsyl
vania
(5)
State (Rank)
Res
iden
ts &
Fel
low
s/10
0,00
0
© Copyright AAMC 2007. May not be reproduced without permission.
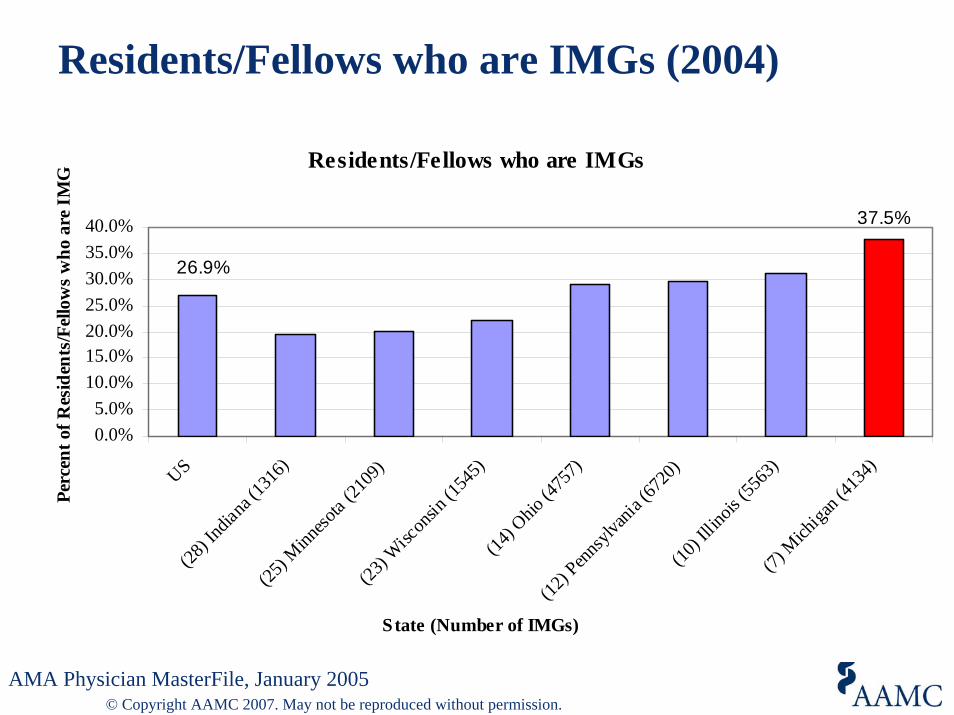
Residents/Fellows who are IMGs (2004)
AMA Physician MasterFile, January 2005
Residents/Fellows who are IMGs
26.9%
37.5%
0.0%5.0%
10.0%15.0%20.0%25.0%30.0%35.0%40.0%
US(28
) India
na (13
16)
(25) M
inneso
ta (21
09)
(23) W
iscon
sin (1
545)
(14) O
hio (4
757)
(12) P
ennsyl
vania
(6720
)(10
) Illin
ois (5
563)
(7) M
ichiga
n (41
34)
State (Number of IMGs)
Perc
ent o
f Res
iden
ts/F
ello
ws
who
are
IM
G
© Copyright AAMC 2007. May not be reproduced without permission.
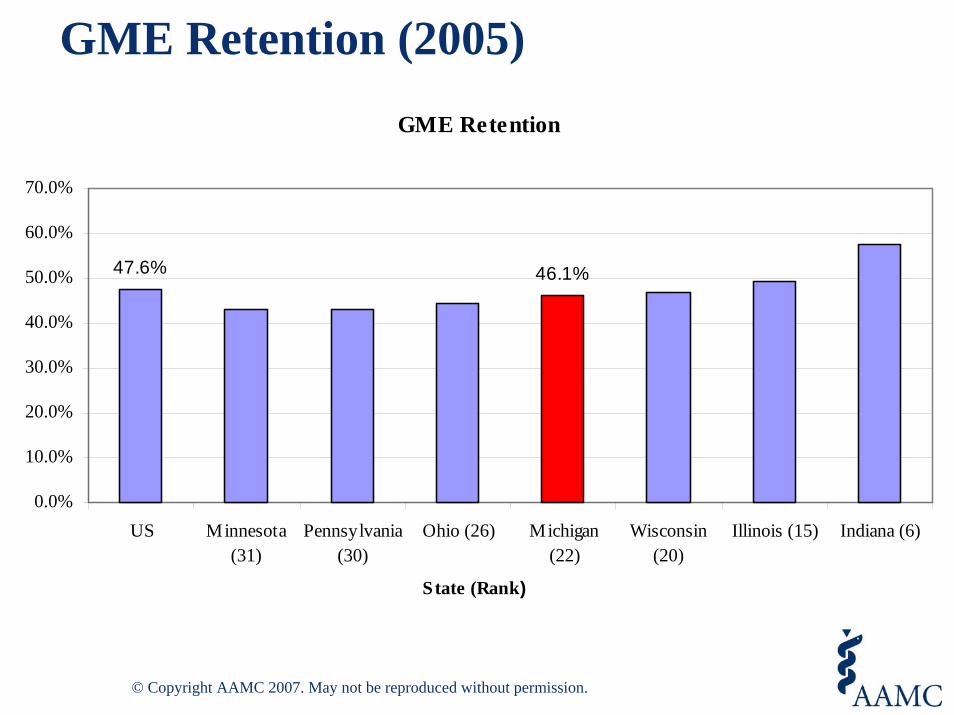
GME Retention (2005)GME Retention
47.6% 46.1%
0.0%
10.0%
20.0%
30.0%
40.0%
50.0%
60.0%
70.0%
US Minnesota(31)
Pennsylvania(30)
Ohio (26) Michigan(22)
Wisconsin(20)
Illinois (15) Indiana (6)
State (Rank)
© Copyright AAMC 2007. May not be reproduced without permission.
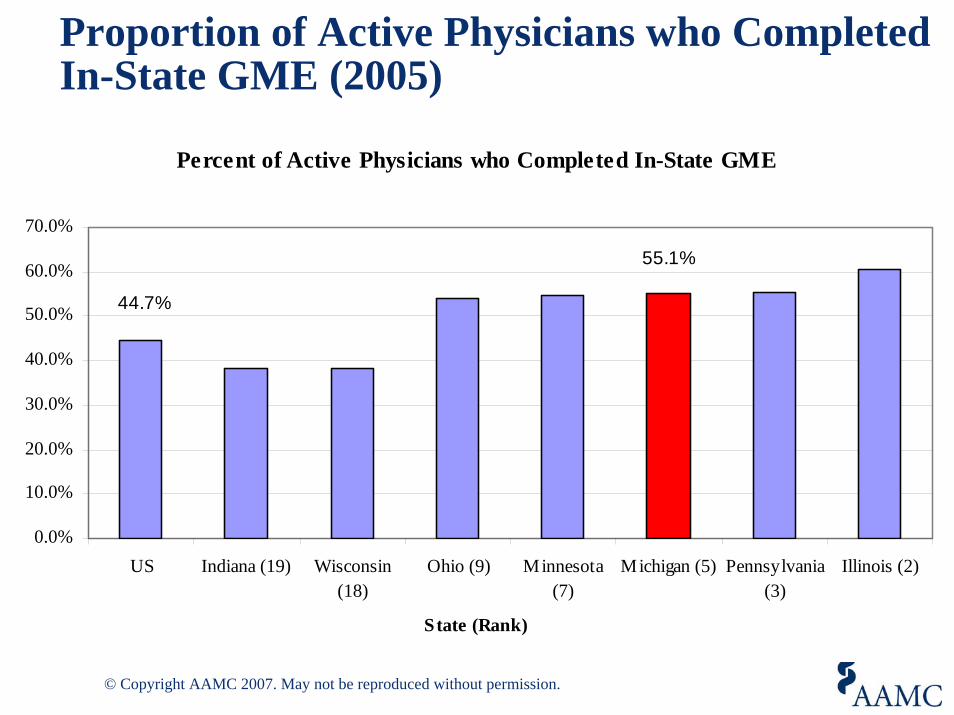
Proportion of Active Physicians who Completed In-State GME (2005)
Percent of Active Physicians who Completed In-State GME
44.7%
55.1%
0.0%
10.0%
20.0%
30.0%
40.0%
50.0%
60.0%
70.0%
US Indiana (19) Wisconsin(18)
Ohio (9) Minnesota(7)
Michigan (5) Pennsylvania(3)
Illinois (2)
State (Rank)
© Copyright AAMC 2007. May not be reproduced without permission.
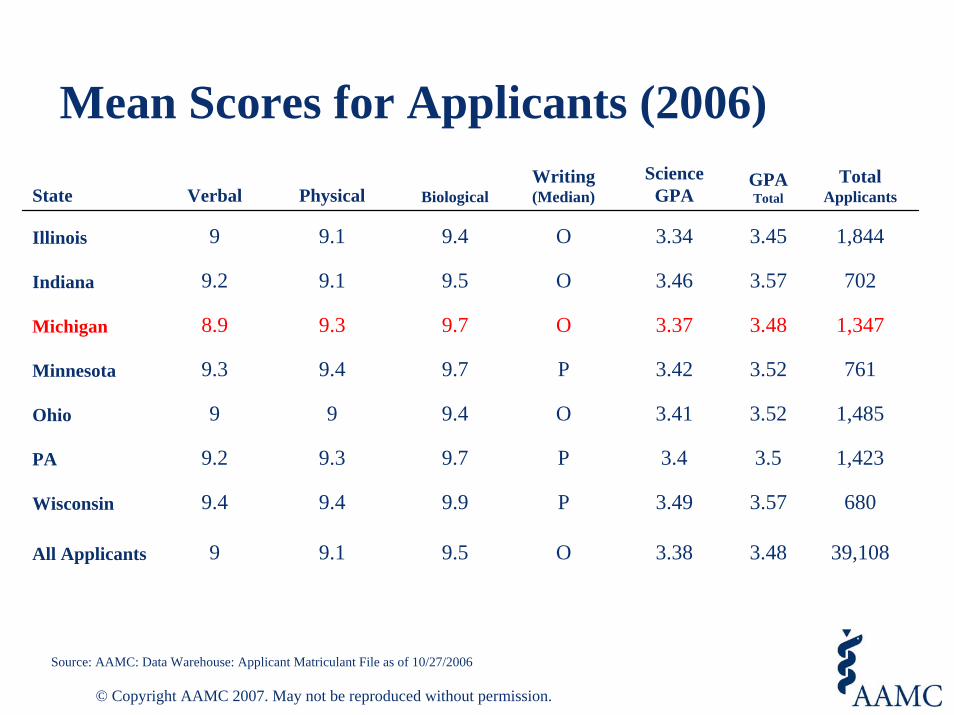
Mean Scores for Applicants (2006)
Source: AAMC: Data Warehouse: Applicant Matriculant File as of 10/27/2006
State Verbal Physical BiologicalWriting (Median)
Science GPA
GPA Total
Total Applicants
Illinois 9 9.1 9.4 O 3.34 3.45 1,844
Indiana 9.2 9.1 9.5 O 3.46 3.57 702
Michigan 8.9 9.3 9.7 O 3.37 3.48 1,347
Minnesota 9.3 9.4 9.7 P 3.42 3.52 761
Ohio 9 9 9.4 O 3.41 3.52 1,485
PA 9.2 9.3 9.7 P 3.4 3.5 1,423
Wisconsin 9.4 9.4 9.9 P 3.49 3.57 680
All Applicants 9 9.1 9.5 O 3.38 3.48 39,108
© Copyright AAMC 2007. May not be reproduced without permission.
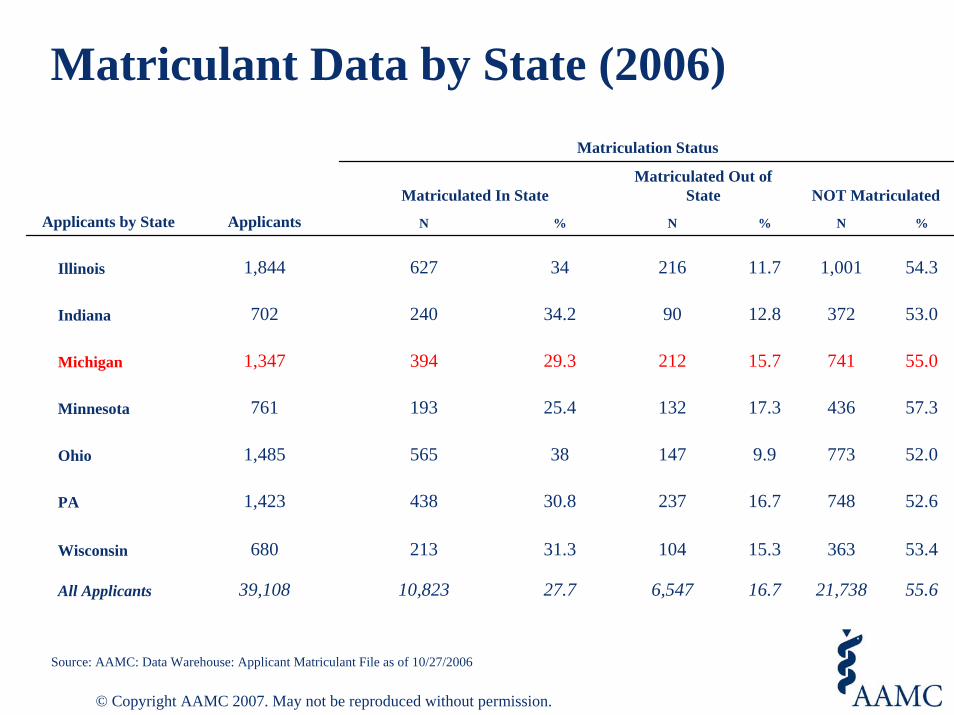
Matriculant Data by State (2006)
Source: AAMC: Data Warehouse: Applicant Matriculant File as of 10/27/2006
Matriculation Status
Matriculated In StateMatriculated Out of
State NOT Matriculated
N % N % N %
Illinois 1,844 627 34 216 11.7 1,001 54.3
Indiana 702 240 34.2 90 12.8 372 53.0
Michigan 1,347 394 29.3 212 15.7 741 55.0
Minnesota 761 193 25.4 132 17.3 436 57.3
Ohio 1,485 565 38 147 9.9 773 52.0
PA 1,423 438 30.8 237 16.7 748 52.6
Wisconsin 680 213 31.3 104 15.3 363 53.4
All Applicants 39,108 10,823 27.7 6,547 16.7 21,738 55.6
Applicants by State Applicants
© Copyright AAMC 2007. May not be reproduced without permission.

US Medical School Matriculants
15,40015,60015,80016,00016,20016,40016,60016,80017,00017,20017,40017,600
1992 1996 2000 2004 2006
Cooper et al
AAMC
© Copyright AAMC 2007. May not be reproduced without permission.
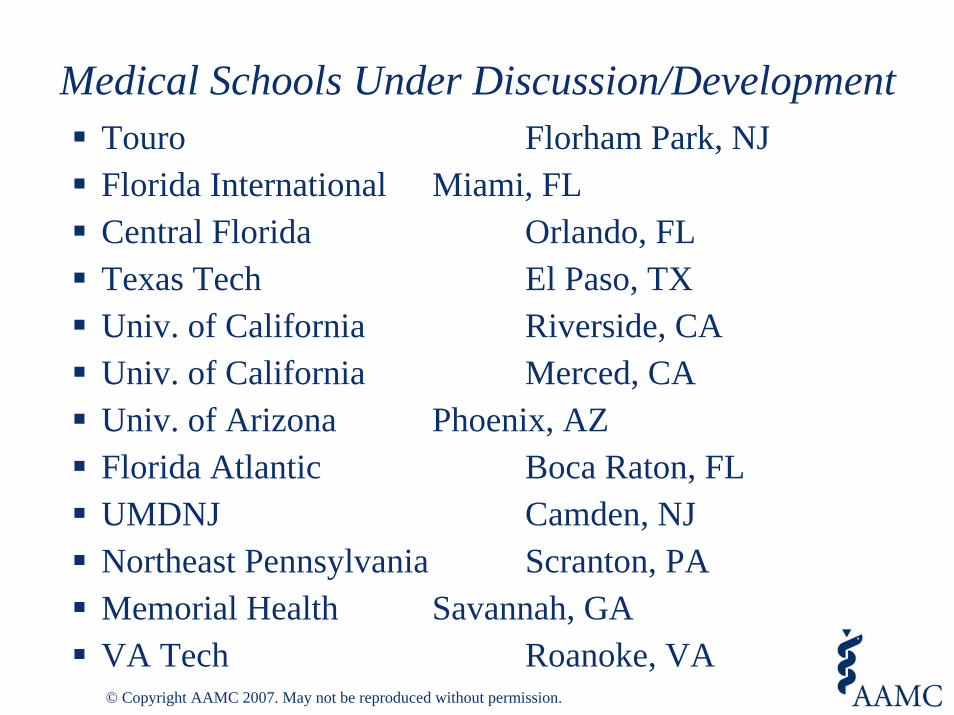
Medical Schools Under Discussion/DevelopmentTouro Florham Park, NJFlorida International Miami, FLCentral Florida Orlando, FLTexas Tech El Paso, TXUniv. of California Riverside, CAUniv. of California Merced, CAUniv. of Arizona Phoenix, AZFlorida Atlantic Boca Raton, FLUMDNJ Camden, NJNortheast Pennsylvania Scranton, PAMemorial Health Savannah, GAVA Tech Roanoke, VA© Copyright AAMC 2007. May not be reproduced without permission.
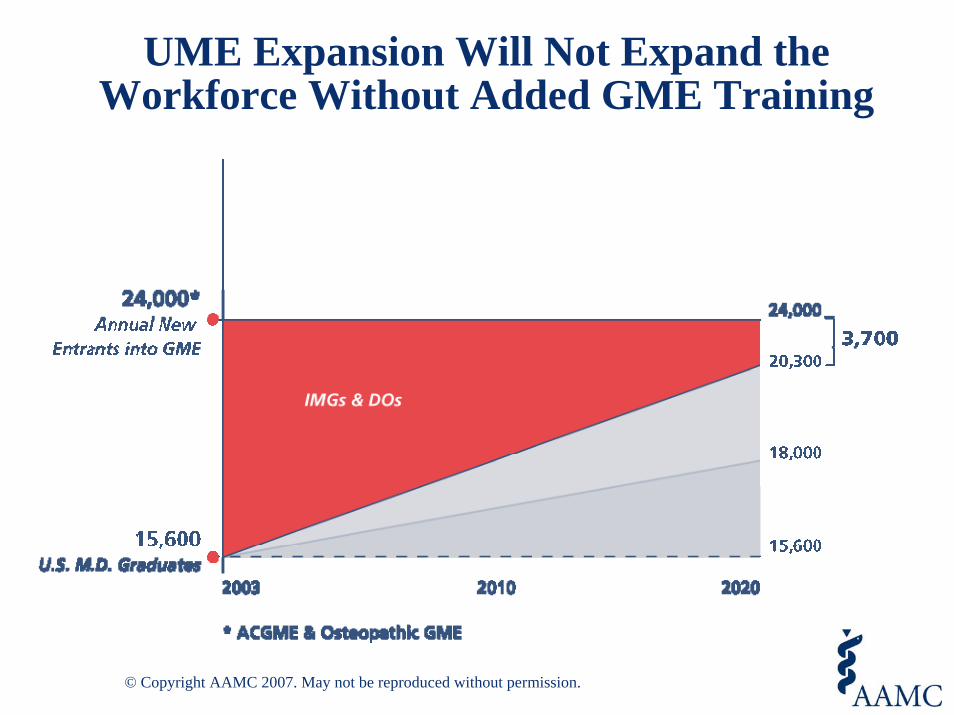
UME Expansion Will Not Expand the Workforce Without Added GME Training
© Copyright AAMC 2007. May not be reproduced without permission.
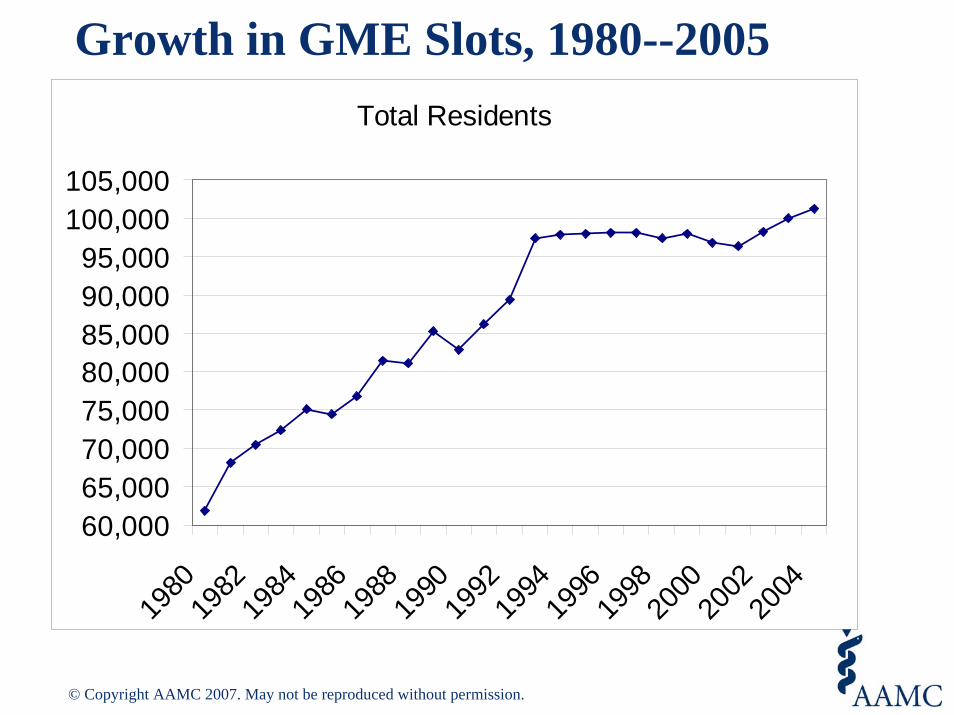
Growth in GME Slots, 1980--2005 Total Residents
60,00065,00070,00075,00080,00085,00090,00095,000
100,000105,000
1980
1982
1984
1986
1988
1990
1992
1994
1996
1998
2000
2002
2004
© Copyright AAMC 2007. May not be reproduced without permission.
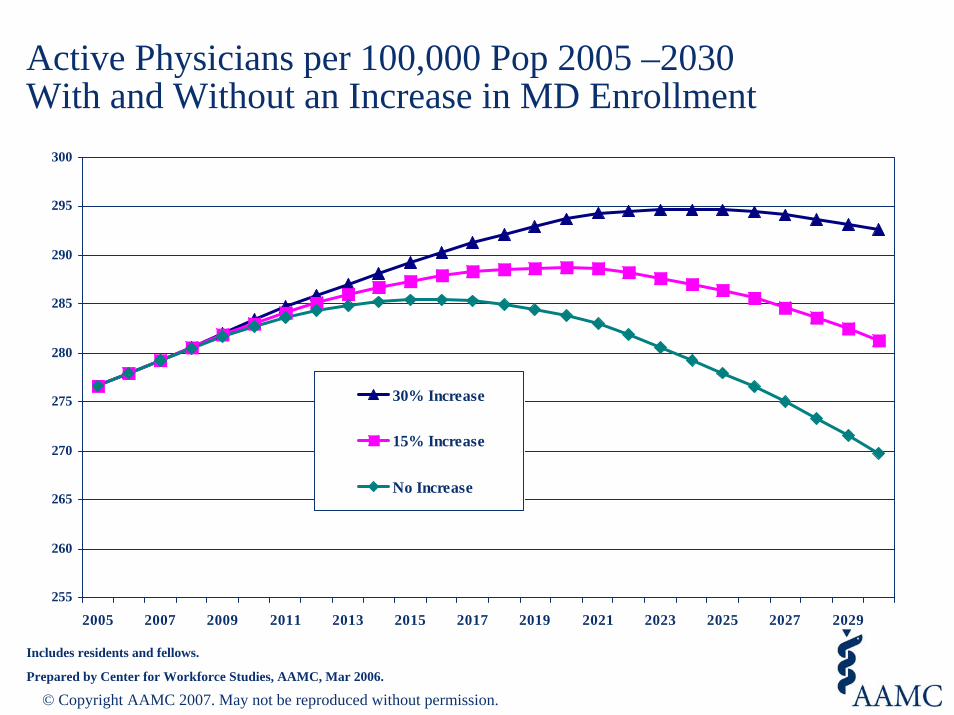
Active Physicians per 100,000 Pop 2005 –2030 With and Without an Increase in MD Enrollment
255
260
265
270
275
280
285
290
295
300
2005 2007 2009 2011 2013 2015 2017 2019 2021 2023 2025 2027 2029
30% Increase
15% Increase
No Increase
Includes residents and fellows.
Prepared by Center for Workforce Studies, AAMC, Mar 2006.
© Copyright AAMC 2007. May not be reproduced without permission.