CD Melbourne Congress: Bob James
21
The NBN Journey from 2009 - 2020: A Perspective 2020 2019 2018 2017 2016 2015 2014 2013 2012 2011 2010 2009 Today NBN Announced NBN 50% Built NBN Complete August 2013 Election Start of MTM 2019 Election. Changes? The Good News 1. Will be constructed about 2020. 2. Multi-Technology Mix a qualified success. Four Major Challenges 1. Game changing wireless substitution starting. 2. Pricing Model is flawed – leading to poor performance 3. NBN Economics must be re-set – a write-down (or equivalent) 4. NBN as fixed only monopoly obsolete on completion? Risk losing 1) all consumer benefits and 2) even greater economic losses in absence of fast changes. 1
-
Upload
decisive-publishing -
Category
Technology
-
view
197 -
download
3
Transcript of CD Melbourne Congress: Bob James

The NBN Journey from 2009 - 2020: A Perspective
202020192018201720162015201420132012201120102009
Today
NBN Announced
NBN 50% Built NBN Complete
August 2013 ElectionStart of MTM
2019 Election.Changes?
The Good News1. Will be constructed about 2020.2. Multi-Technology Mix a qualified success.
Four Major Challenges1. Game changing wireless substitution starting.2. Pricing Model is flawed – leading to poor performance3. NBN Economics must be re-set – a write-down (or equivalent)4. NBN as fixed only monopoly obsolete on completion?
Risk losing 1) all consumer benefits and 2) even greater economic losses in absence of fast changes.
1
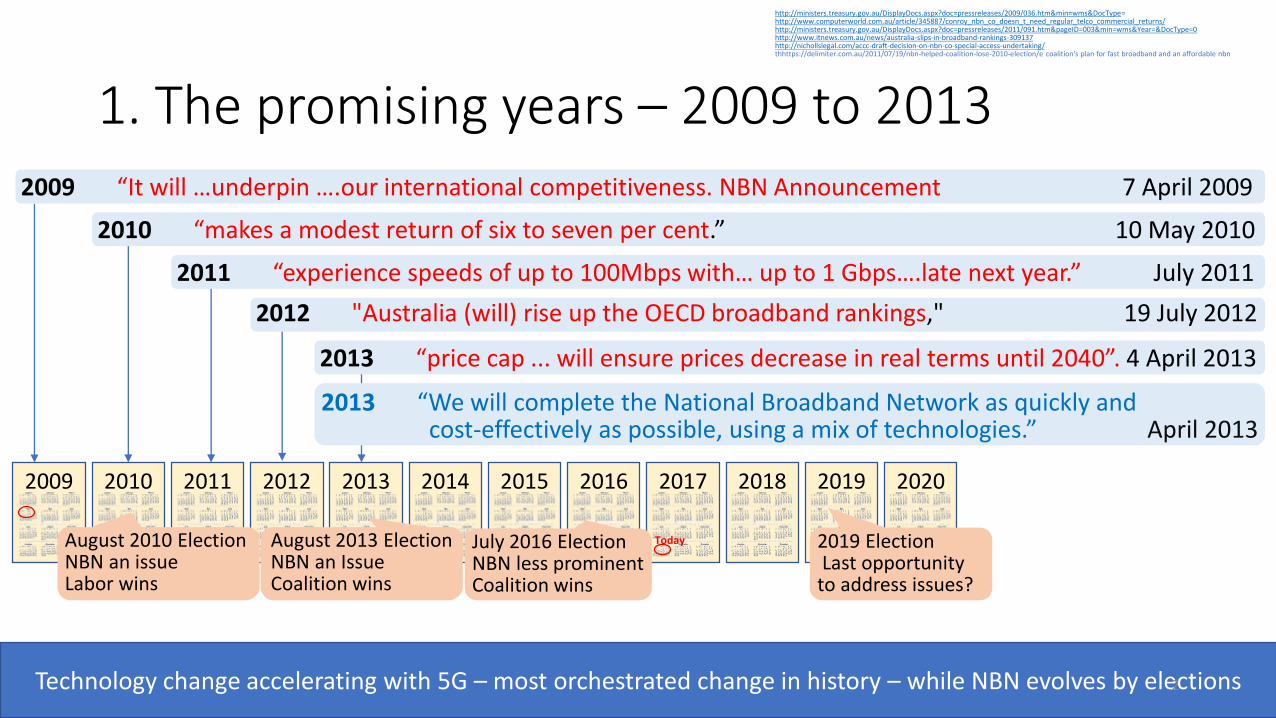
1. The promising years – 2009 to 2013
2011 “experience speeds of up to 100Mbps with… up to 1 Gbps….late next year.” July 2011
202020192018201720162015201420132012201120102009
Today
http://ministers.treasury.gov.au/DisplayDocs.aspx?doc=pressreleases/2009/036.htm&min=wms&DocType= http://www.computerworld.com.au/article/345887/conroy_nbn_co_doesn_t_need_regular_telco_commercial_returns/http://ministers.treasury.gov.au/DisplayDocs.aspx?doc=pressreleases/2011/091.htm&pageID=003&min=wms&Year=&DocType=0http://www.itnews.com.au/news/australia-slips-in-broadband-rankings-309137http://nichollslegal.com/accc-draft-decision-on-nbn-co-special-access-undertaking/thhttps://delimiter.com.au/2011/07/19/nbn-helped-coalition-lose-2010-election/e coalition's plan for fast broadband and an affordable nbn
2009 “It will …underpin ….our international competitiveness. NBN Announcement 7 April 2009
2010 “makes a modest return of six to seven per cent.” 10 May 2010
2012 "Australia (will) rise up the OECD broadband rankings," 19 July 2012
August 2013 ElectionNBN an IssueCoalition wins
2013 “We will complete the National Broadband Network as quickly and cost-effectively as possible, using a mix of technologies.” April 2013
August 2010 ElectionNBN an issueLabor wins
July 2016 ElectionNBN less prominentCoalition wins
August 2013 ElectionNBN an IssueCoalition wins
August 2010 ElectionNBN an issueLabor wins
2019 ElectionLast opportunity to address issues?
2013 “price cap ... will ensure prices decrease in real terms until 2040”. 4 April 2013
Technology change accelerating with 5G – most orchestrated change in history – while NBN evolves by elections2

2. How wireless is catching fixed in adoption, speed, and capacity- 2009 to 2017
202020192018201720162015201420132012201120102009
5G NR Launch4G Launch
200Gb Home Wireless announced
Mobile catches fixed for speed
100% mobile broadband penetration
5G Launch
Mobile penetrationpasses fixed
NBN Announced
Bottom 50% of premises at risk?
3
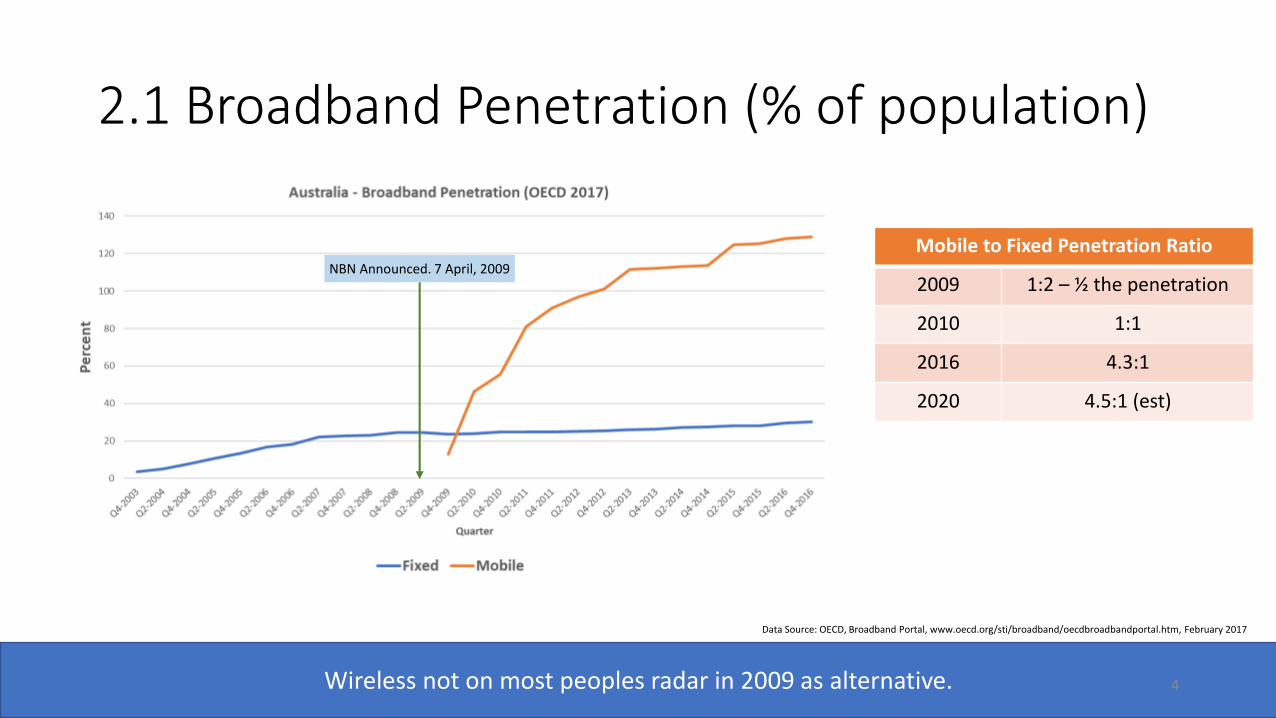
2.1 Broadband Penetration (% of population)
NBN Announced. 7 April, 2009
Data Source: OECD, Broadband Portal, www.oecd.org/sti/broadband/oecdbroadbandportal.htm, February 2017
Wireless not on most peoples radar in 2009 as alternative.
Mobile to Fixed Penetration Ratio
2009 1:2 – ½ the penetration
2010 1:1
2016 4.3:1
2020 4.5:1 (est)
4

2.2 Speed
Data Source: Akamai State of The Internet reports Q4 2009, Q1 2010 - 2017
Extrapolated
Mobile in Australia is now 41% faster and growing twice as fast!
Mobile catches fixed for speed
Mobile to Fixed Speed Ratio
2009 1/3 as fast
2015 Equal
2017 41% faster
2020 2X (extrapolated)
2017 Speed Data
Measure mbps Growth
Fixed 11.1mbps 26%
Mobile 15.7mbps 50%
NBN is responsible for only about 3M services even in 2017. It will however progressively dominate the fixed statistics in the next few years. This may slow fixed growth as the NBN AVC & CVC model will keep NBN speeds well below both the installed fixed network capability.
5
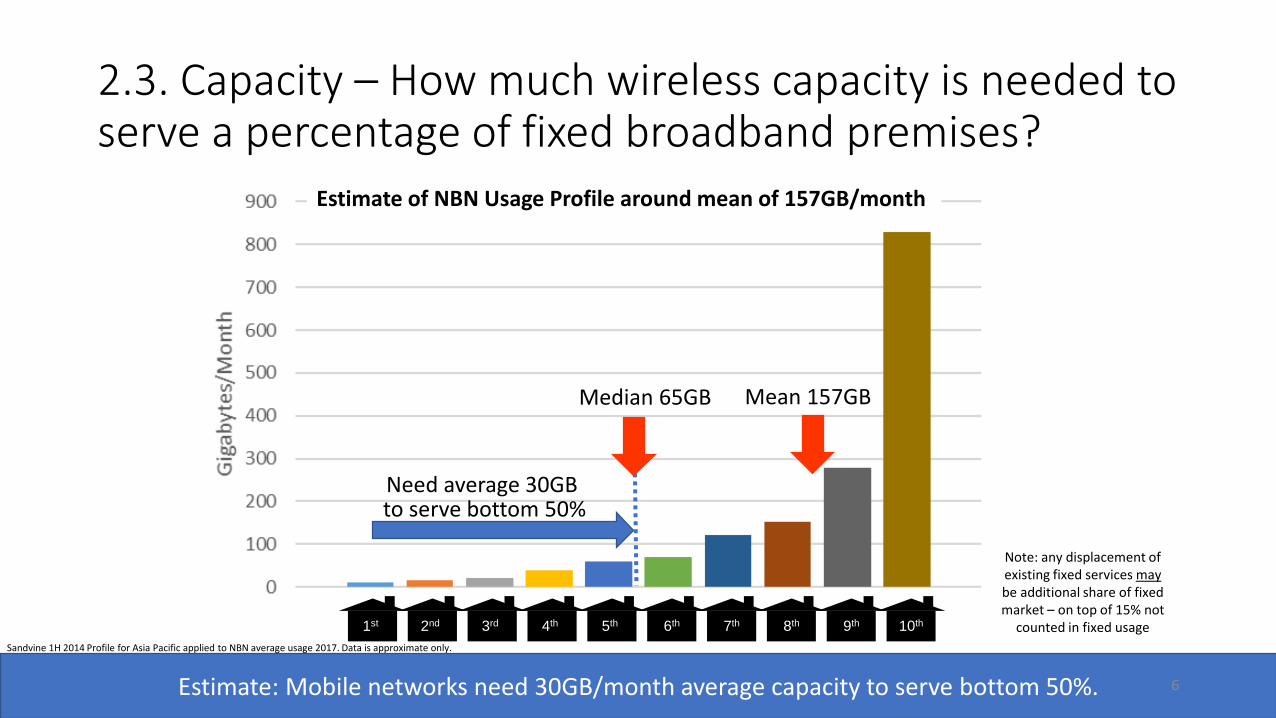
2.3. Capacity – How much wireless capacity is needed to serve a percentage of fixed broadband premises?
Mean 157GBMedian 65GB
10th9th8th7th6th5th
Sandvine 1H 2014 Profile for Asia Pacific applied to NBN average usage 2017. Data is approximate only.
Estimate of NBN Usage Profile around mean of 157GB/month
Need average 30GB to serve bottom 50%
Estimate: Mobile networks need 30GB/month average capacity to serve bottom 50%.
Note: any displacement of existing fixed services maybe additional share of fixed market – on top of 15% not
counted in fixed usage4th3rd2nd1st
6
Sandvine 1H 2014 Profile for Asia Pacific applied to NBN average usage 2017. Data is approximate only.
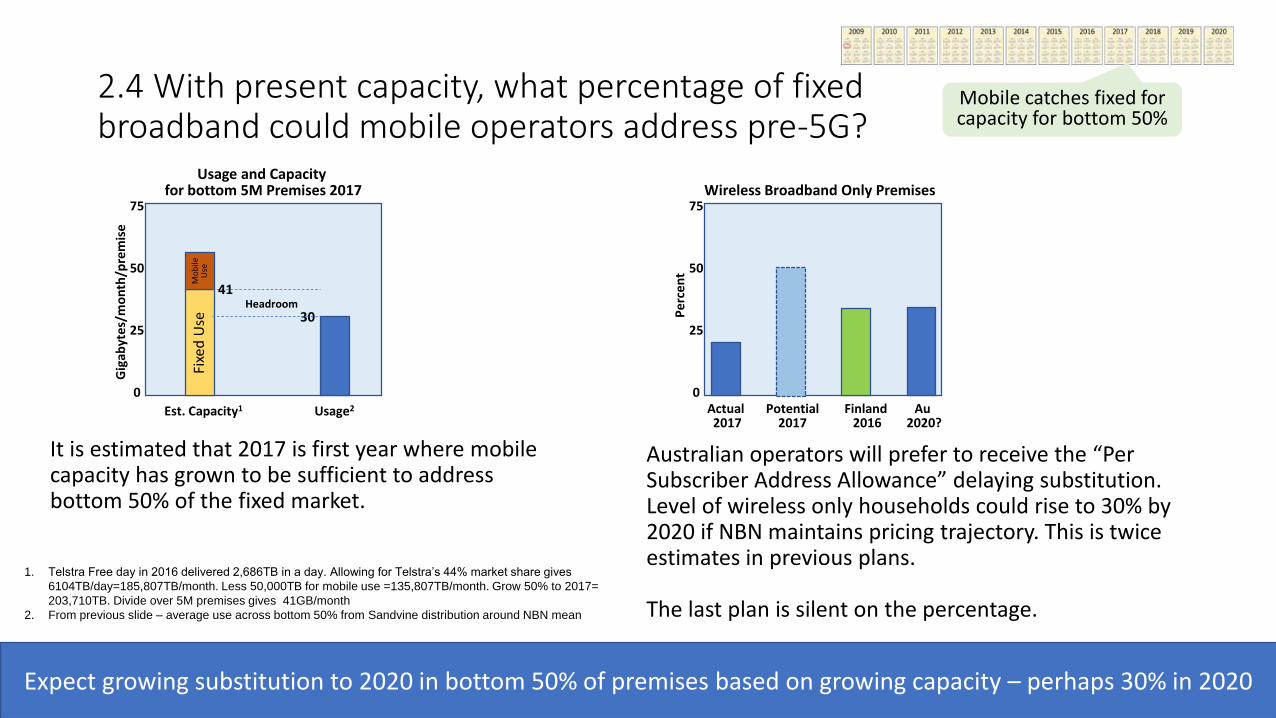
2.4 With present capacity, what percentage of fixed broadband could mobile operators address pre-5G?
It is estimated that 2017 is first year where mobile capacity has grown to be sufficient to address bottom 50% of the fixed market.
1. Telstra Free day in 2016 delivered 2,686TB in a day. Allowing for Telstra’s 44% market share gives
6104TB/day=185,807TB/month. Less 50,000TB for mobile use =135,807TB/month. Grow 50% to 2017=
203,710TB. Divide over 5M premises gives 41GB/month
2. From previous slide – average use across bottom 50% from Sandvine distribution around NBN mean
Expect growing substitution to 2020 in bottom 50% of premises based on growing capacity – perhaps 30% in 2020
Mobile catches fixed for capacity for bottom 50%
Fixe
d U
se
Gig
abyt
es/m
on
th/p
rem
ise
Usage2Est. Capacity1
25
50
75
0
Usage and Capacity for bottom 5M Premises 2017
Pe
rce
nt
Actual 2017
Finland 2016
25
50
75
0
Wireless Broadband Only Premises
Potential2017
Au 2020?
Australian operators will prefer to receive the “Per Subscriber Address Allowance” delaying substitution. Level of wireless only households could rise to 30% by 2020 if NBN maintains pricing trajectory. This is twice estimates in previous plans.
The last plan is silent on the percentage.
30
Mo
bile
U
se
Headroom41
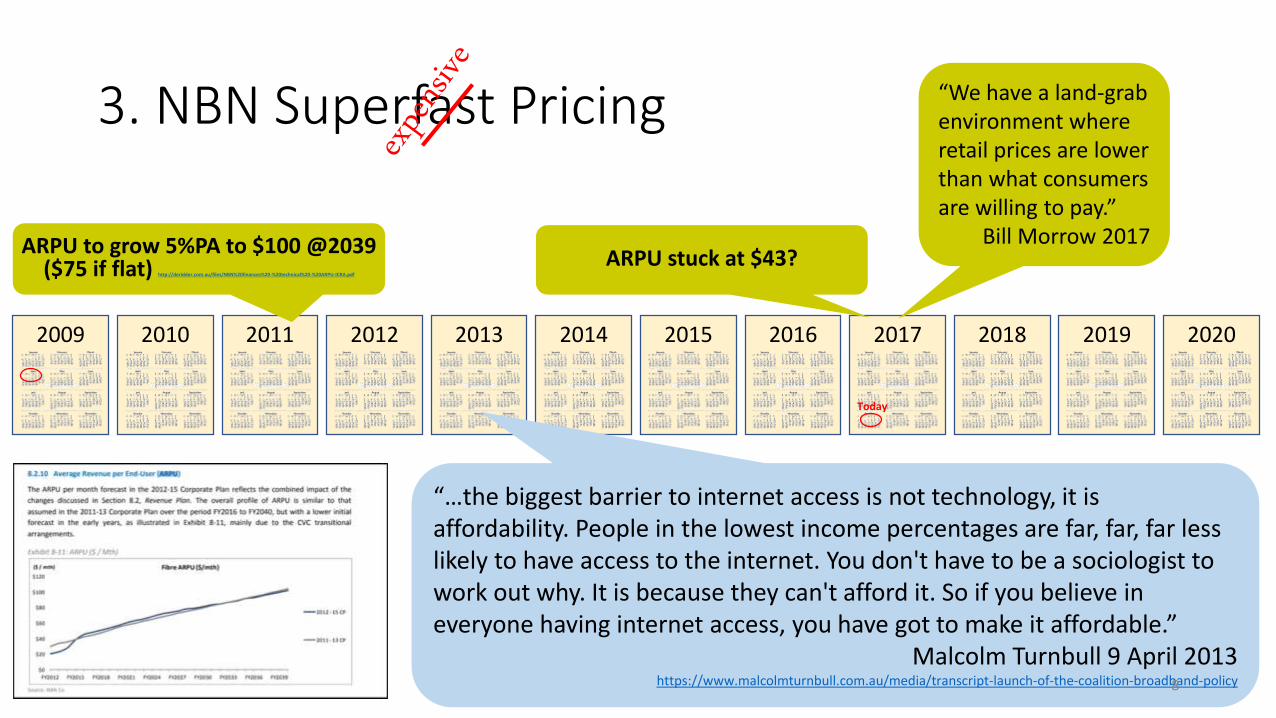
3. NBN Superfast Pricing
202020192018201720162015201420132012201120102009
Today
ARPU stuck at $43?ARPU to grow 5%PA to $100 @2039
($75 if flat) http://deridder.com.au/files/NBN%20finances%20-%20technical%20-%20ARPU-ICRA.pdf
“…the biggest barrier to internet access is not technology, it is affordability. People in the lowest income percentages are far, far, far less likely to have access to the internet. You don't have to be a sociologist to work out why. It is because they can't afford it. So if you believe in everyone having internet access, you have got to make it affordable.”
Malcolm Turnbull 9 April 2013https://www.malcolmturnbull.com.au/media/transcript-launch-of-the-coalition-broadband-policy
“We have a land-grab environment whereretail prices are lower than what consumersare willing to pay.”
Bill Morrow 2017
8
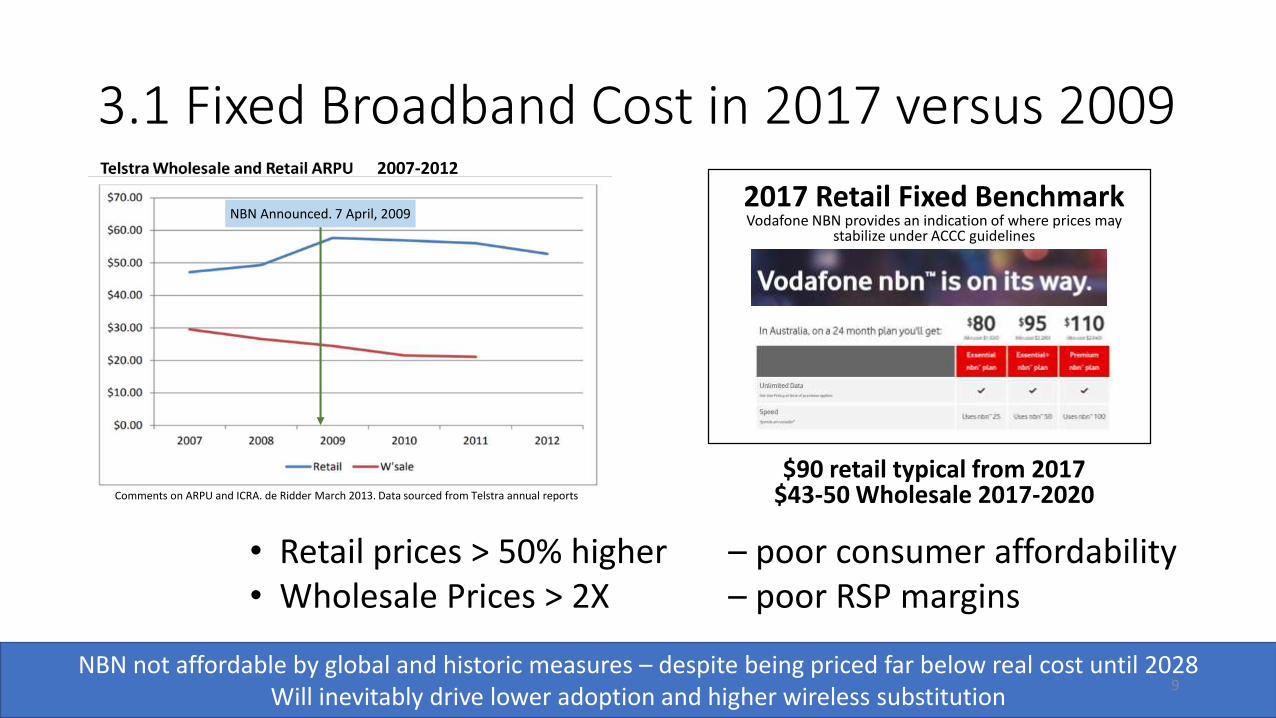
3.1 Fixed Broadband Cost in 2017 versus 2009
2017 Retail Fixed BenchmarkVodafone NBN provides an indication of where prices may
stabilize under ACCC guidelines
$90 retail typical from 2017$43-50 Wholesale 2017-2020
NBN not affordable by global and historic measures – despite being priced far below real cost until 2028Will inevitably drive lower adoption and higher wireless substitution
• Retail prices > 50% higher – poor consumer affordability• Wholesale Prices > 2X – poor RSP margins
Comments on ARPU and ICRA. de Ridder March 2013. Data sourced from Telstra annual reports
2007-2012
NBN Announced. 7 April, 2009
9
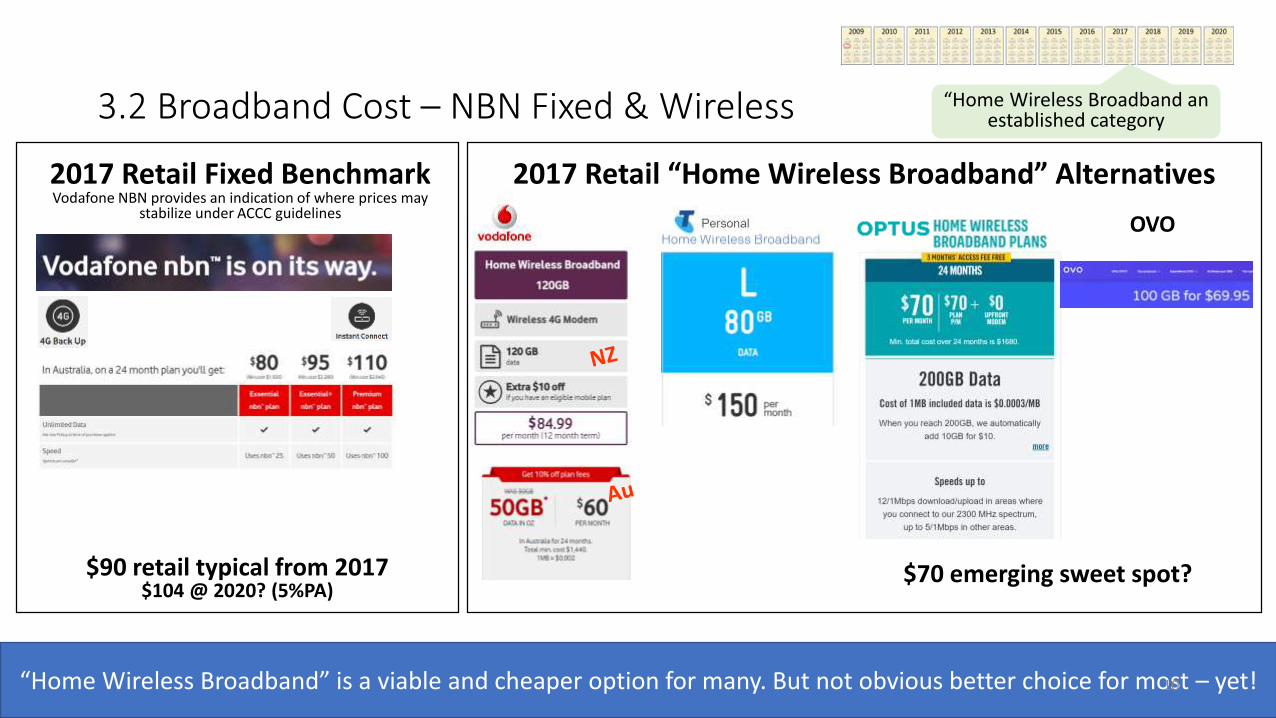
3.2 Broadband Cost – NBN Fixed & Wireless
2017 Retail Fixed BenchmarkVodafone NBN provides an indication of where prices may
stabilize under ACCC guidelines
$90 retail typical from 2017$104 @ 2020? (5%PA)
2017 Retail “Home Wireless Broadband” Alternatives
$70 emerging sweet spot?
OVO
“Home Wireless Broadband” is a viable and cheaper option for many. But not obvious better choice for most – yet!
“Home Wireless Broadband an established category
10
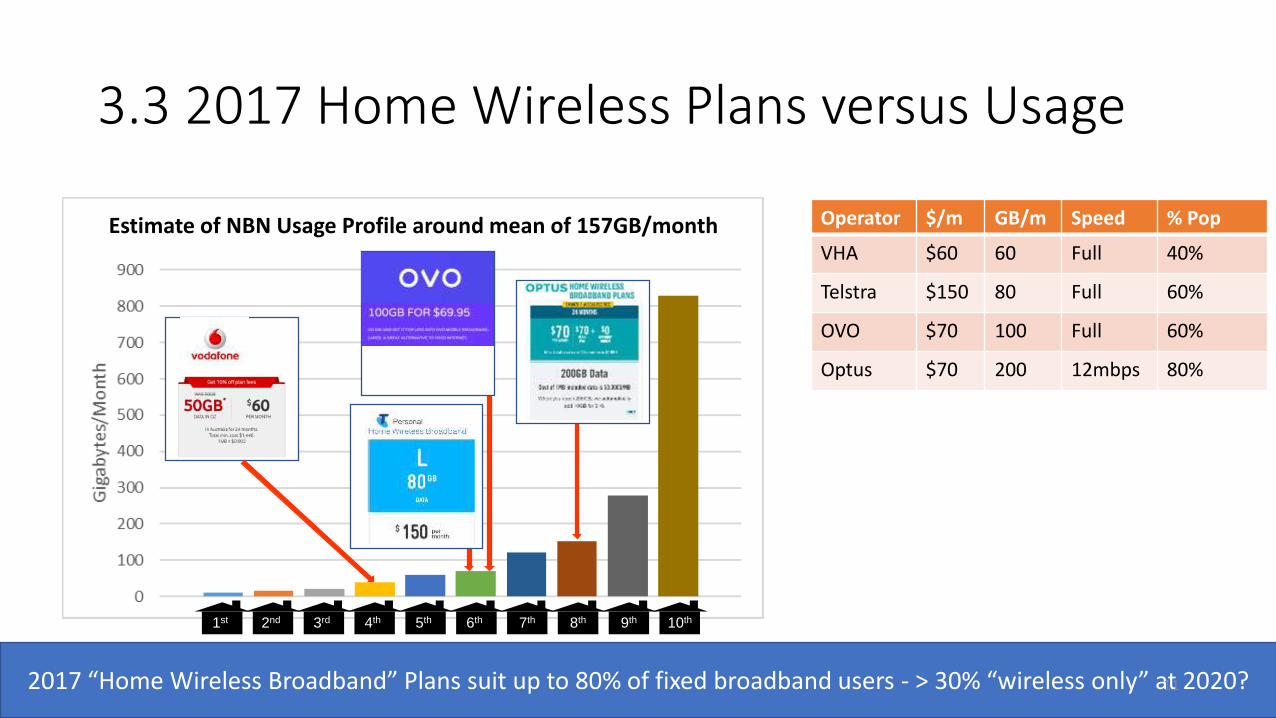
3.3 2017 Home Wireless Plans versus Usage
10th9th8th7th6th5th4th3rd2nd1st
Operator $/m GB/m Speed % Pop
VHA $60 60 Full 40%
Telstra $150 80 Full 60%
OVO $70 100 Full 60%
Optus $70 200 12mbps 80%
2017 “Home Wireless Broadband” Plans suit up to 80% of fixed broadband users - > 30% “wireless only” at 2020? 11
Estimate of NBN Usage Profile around mean of 157GB/month
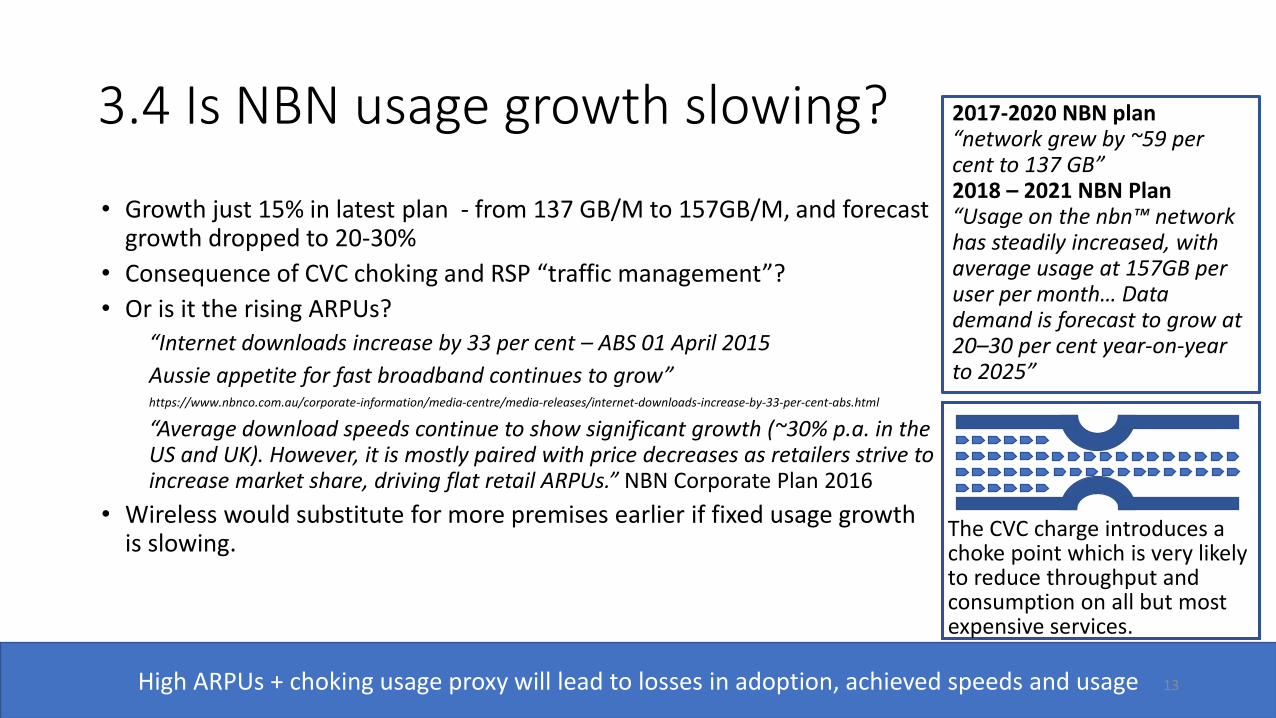
3.4 Is NBN usage growth slowing?
• Growth just 15% in latest plan - from 137 GB/M to 157GB/M, and forecast growth dropped to 20-30%
• Consequence of CVC choking and RSP “traffic management”?
• Or is it the rising ARPUs?“Internet downloads increase by 33 per cent – ABS 01 April 2015
Aussie appetite for fast broadband continues to grow”https://www.nbnco.com.au/corporate-information/media-centre/media-releases/internet-downloads-increase-by-33-per-cent-abs.html
“Average download speeds continue to show significant growth (~30% p.a. in the US and UK). However, it is mostly paired with price decreases as retailers strive to increase market share, driving flat retail ARPUs.” NBN Corporate Plan 2016
• Wireless would substitute for more premises earlier if fixed usage growth is slowing.
The CVC charge introduces a choke point which is very likely to reduce throughput and consumption on all but most expensive services.
High ARPUs + choking usage proxy will lead to losses in adoption, achieved speeds and usage 13
2017-2020 NBN plan “network grew by ~59 per cent to 137 GB” 2018 – 2021 NBN Plan“Usage on the nbn™ network has steadily increased, with average usage at 157GB per user per month… Data demand is forecast to grow at 20–30 per cent year-on-year to 2025”
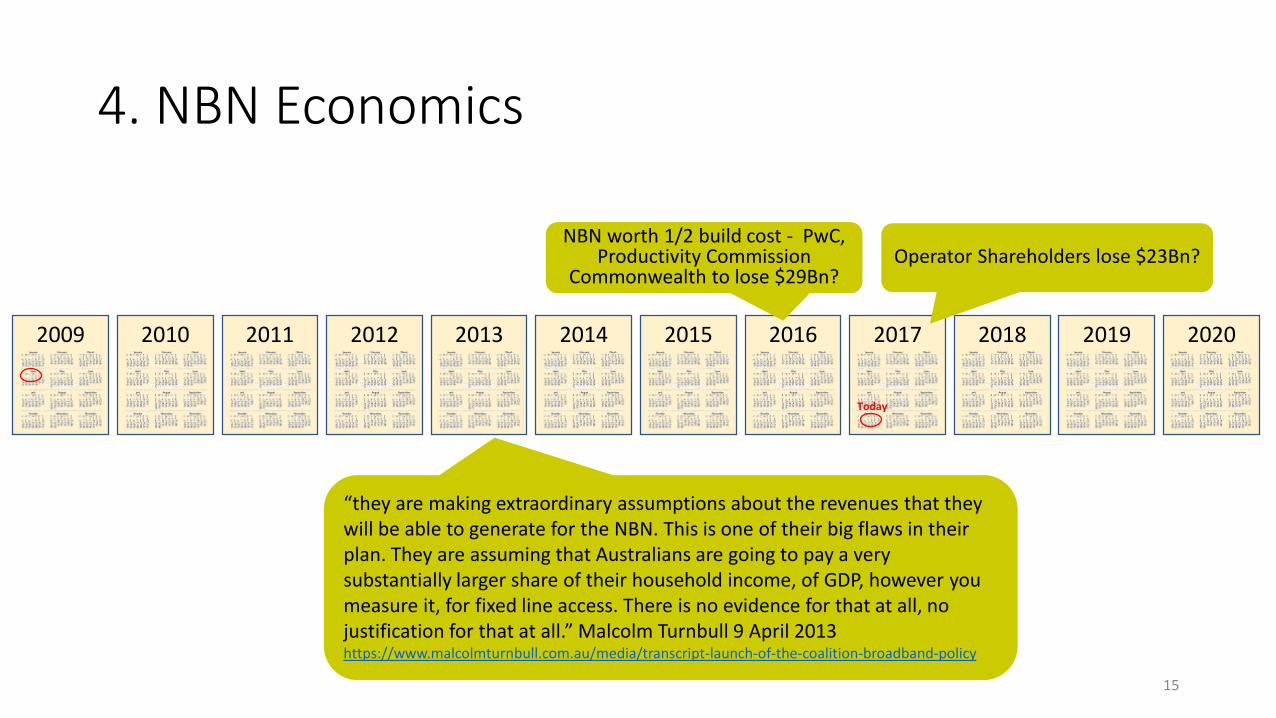
4. NBN Economics
202020192018201720162015201420132012201120102009
Today
Operator Shareholders lose $23Bn? NBN worth 1/2 build cost - PwC,
Productivity CommissionCommonwealth to lose $29Bn?
“they are making extraordinary assumptions about the revenues that they will be able to generate for the NBN. This is one of their big flaws in their plan. They are assuming that Australians are going to pay a very substantially larger share of their household income, of GDP, however you measure it, for fixed line access. There is no evidence for that at all, no justification for that at all.” Malcolm Turnbull 9 April 2013https://www.malcolmturnbull.com.au/media/transcript-launch-of-the-coalition-broadband-policy
15
4.1 Industry Impact
Rob Millner, Director of TPG and Chair of Soul Pattinson “said that he believed the market did not understand that the NBN was compressing telco margins across the board, not just at TPG but also at Telstra and Vocus”.
CommsDay 29/08/17
“The top three listed telco stocks lost cA$23bn (c28%) in market capitalisation in FY17—in our view, most of that directly or indirectly NBN related”
Ian Martin. nbn co Inflection impact in 2018. Ian Martin. 28/06/2017
The problem is caused by NBN pursuing an unsustainable level of ARPU growth having spent too much.16
4.2 NBN Write-down?
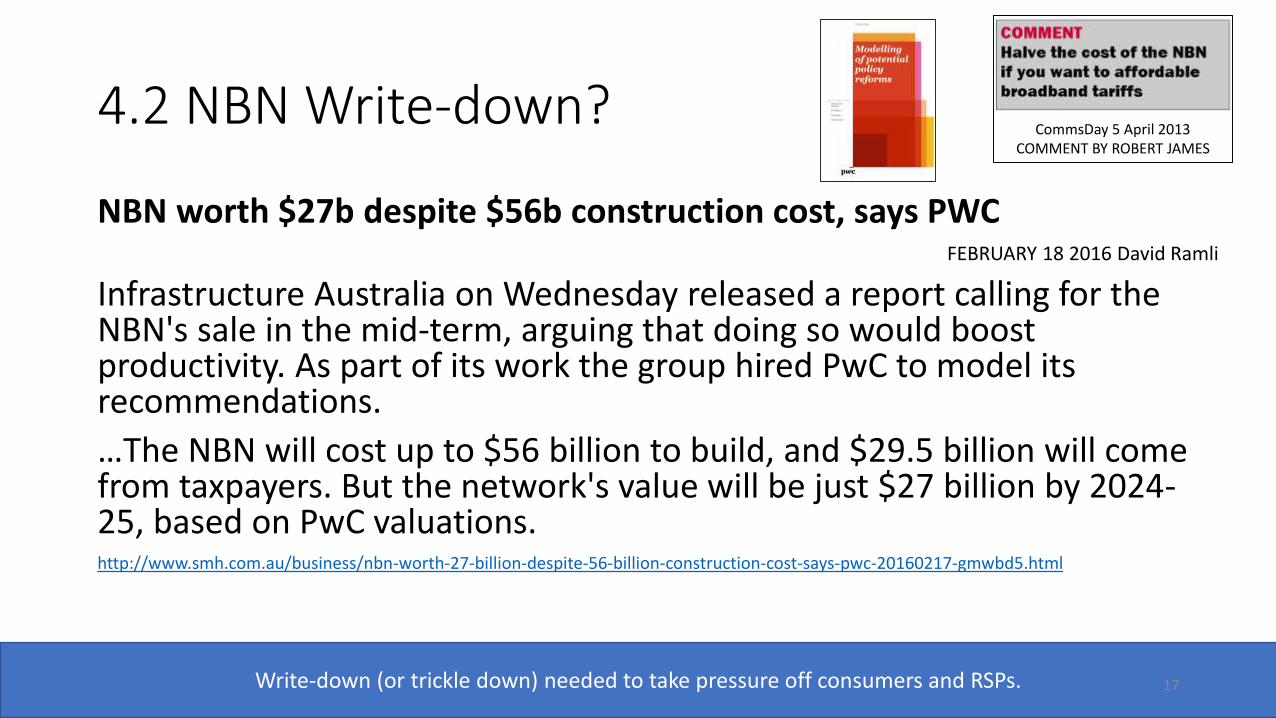
NBN worth $27b despite $56b construction cost, says PWC FEBRUARY 18 2016 David Ramli
Infrastructure Australia on Wednesday released a report calling for the NBN's sale in the mid-term, arguing that doing so would boost productivity. As part of its work the group hired PwC to model its recommendations.
…The NBN will cost up to $56 billion to build, and $29.5 billion will come from taxpayers. But the network's value will be just $27 billion by 2024-25, based on PwC valuations.http://www.smh.com.au/business/nbn-worth-27-billion-despite-56-billion-construction-cost-says-pwc-20160217-gmwbd5.html
CommsDay 5 April 2013COMMENT BY ROBERT JAMES
Write-down (or trickle down) needed to take pressure off consumers and RSPs. 17
4.3 NBN Economics Summary: Is the Balance Right?
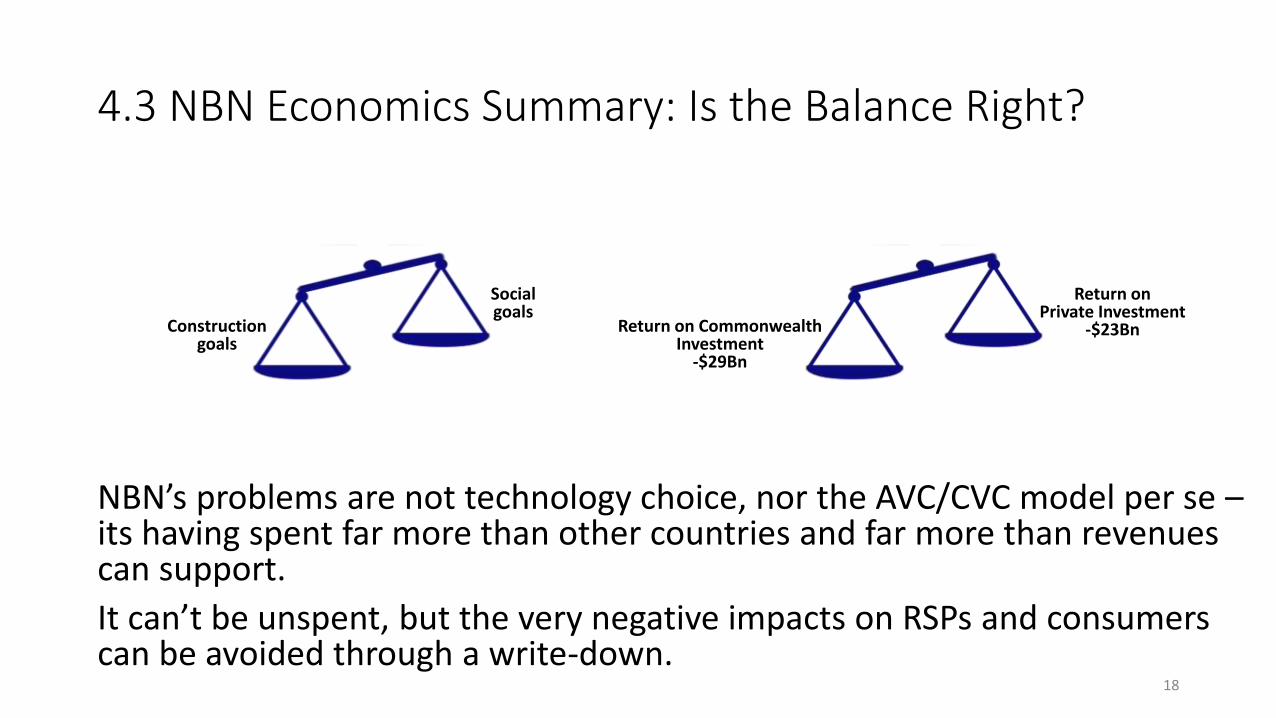
NBN’s problems are not technology choice, nor the AVC/CVC model per se –its having spent far more than other countries and far more than revenues can support.
It can’t be unspent, but the very negative impacts on RSPs and consumers can be avoided through a write-down.
Return on Commonwealth Investment
-$29Bn
Return on Private Investment
-$23BnConstruction goals
Social goals
18
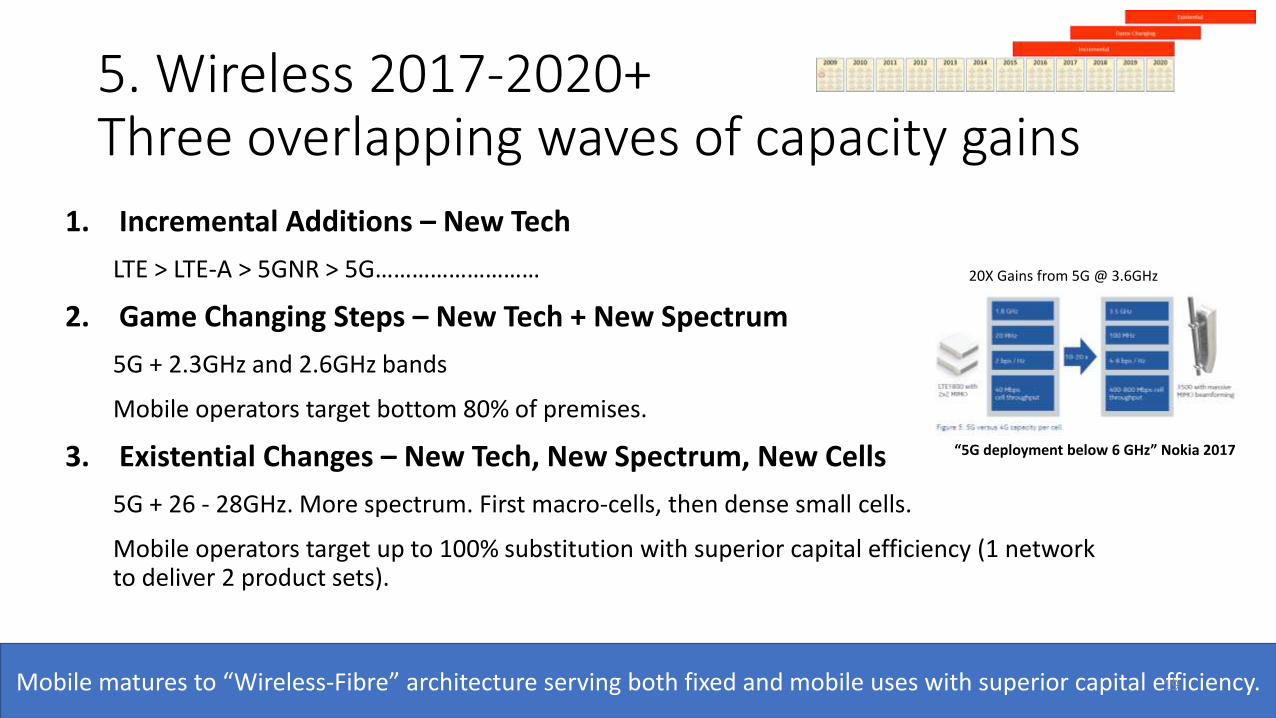
5. Wireless 2017-2020+Three overlapping waves of capacity gains
1. Incremental Additions – New Tech
LTE > LTE-A > 5GNR > 5G………………………
2. Game Changing Steps – New Tech + New Spectrum
5G + 2.3GHz and 2.6GHz bands
Mobile operators target bottom 80% of premises.
3. Existential Changes – New Tech, New Spectrum, New Cells
5G + 26 - 28GHz. More spectrum. First macro-cells, then dense small cells.
Mobile operators target up to 100% substitution with superior capital efficiency (1 network to deliver 2 product sets).
Mobile matures to “Wireless-Fibre” architecture serving both fixed and mobile uses with superior capital efficiency.
20X Gains from 5G @ 3.6GHz
“5G deployment below 6 GHz” Nokia 2017
19
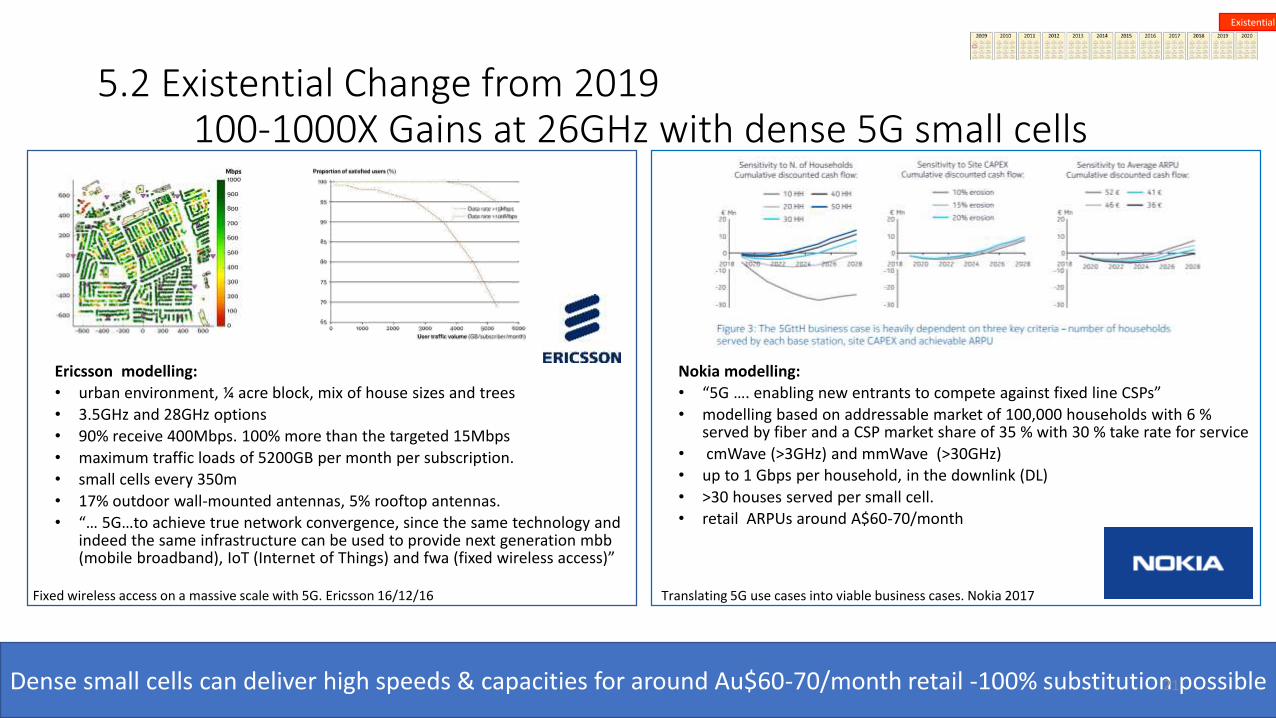
5.2 Existential Change from 2019100-1000X Gains at 26GHz with dense 5G small cells
Ericsson modelling:
• urban environment, ¼ acre block, mix of house sizes and trees
• 3.5GHz and 28GHz options
• 90% receive 400Mbps. 100% more than the targeted 15Mbps
• maximum traffic loads of 5200GB per month per subscription.
• small cells every 350m
• 17% outdoor wall-mounted antennas, 5% rooftop antennas.
• “… 5G…to achieve true network convergence, since the same technology and indeed the same infrastructure can be used to provide next generation mbb (mobile broadband), IoT (Internet of Things) and fwa (fixed wireless access)”
Nokia modelling:
• “5G …. enabling new entrants to compete against fixed line CSPs”
• modelling based on addressable market of 100,000 households with 6 % served by fiber and a CSP market share of 35 % with 30 % take rate for service
• cmWave (>3GHz) and mmWave (>30GHz)
• up to 1 Gbps per household, in the downlink (DL)
• >30 houses served per small cell.
• retail ARPUs around A$60-70/month
Translating 5G use cases into viable business cases. Nokia 2017Fixed wireless access on a massive scale with 5G. Ericsson 16/12/16
Dense small cells can deliver high speeds & capacities for around Au$60-70/month retail -100% substitution possible
Existential
21
5.3 Wireless 2017-2020+ : Summary
The future is fibre + wireless – converged fixed and wireless networks.
Converged infrastructure is likely to have superior capital efficiency through delivering two revenue streams for two families of products while investing capital in just one access platform.
22NBN Future? MNO response?
5.4 2018-2021 NBN Corporate Plan seems to be anticipating network, product and business model change
“there are also a number of emerging challenges. In the short term, these include responding to increasing competition, and longer term, management of the impact of technology convergence, which will require nbn to adapt its network to a wide range of future use cases, business models and product innovations.” Page 61
23
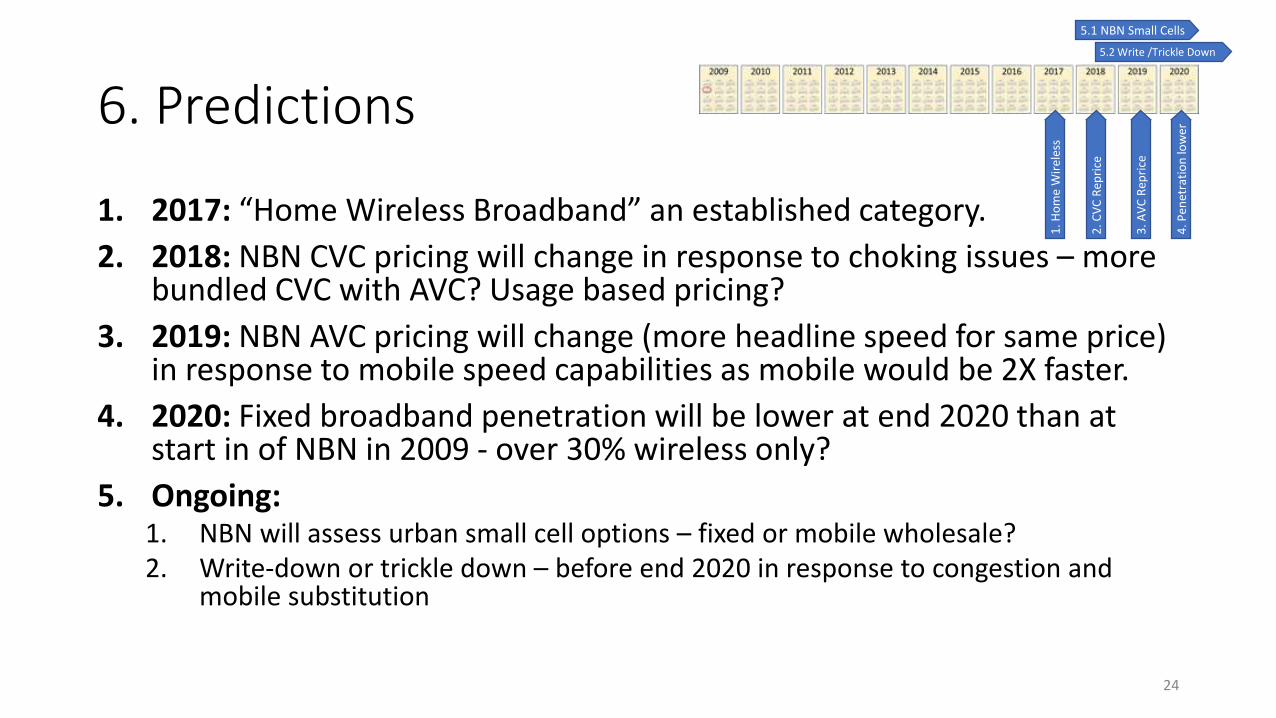
6. Predictions
1. 2017: “Home Wireless Broadband” an established category.
2. 2018: NBN CVC pricing will change in response to choking issues – more bundled CVC with AVC? Usage based pricing?
3. 2019: NBN AVC pricing will change (more headline speed for same price) in response to mobile speed capabilities as mobile would be 2X faster.
4. 2020: Fixed broadband penetration will be lower at end 2020 than at start in of NBN in 2009 - over 30% wireless only?
5. Ongoing:1. NBN will assess urban small cell options – fixed or mobile wholesale?2. Write-down or trickle down – before end 2020 in response to congestion and
mobile substitution
5.1 NBN Small Cells
1. H
om
e W
irel
ess
2. C
VC
Rep
rice
3. A
VC
Rep
rice
4. P
enet
rati
on
low
er
5.2 Write /Trickle Down
24