c Copyright 2012 The Authors. Notice Changes introduced as...
27
This is the author’s version of a work that was submitted/accepted for pub- lication in the following source: Wilson, Kimberley & Gilmore, Linda (2012) Assessing intellectual functioning in young adolescents : how do the WISC-IV and SB5 compare? Australian Journal of Guidance and Counselling Association, 22 (1), pp. 1-14. This file was downloaded from: https://eprints.qut.edu.au/52808/ c Copyright 2012 The Authors. Notice: Changes introduced as a result of publishing processes such as copy-editing and formatting may not be reflected in this document. For a definitive version of this work, please refer to the published source: https://doi.org/10.1017/jgc.2012.9
-
Upload
nguyenxuyen -
Category
Documents
-
view
212 -
download
0
Transcript of c Copyright 2012 The Authors. Notice Changes introduced as...
This is the author’s version of a work that was submitted/accepted for pub-lication in the following source:
Wilson, Kimberley & Gilmore, Linda(2012)Assessing intellectual functioning in young adolescents : how do theWISC-IV and SB5 compare?Australian Journal of Guidance and Counselling Association, 22(1), pp.1-14.
This file was downloaded from: https://eprints.qut.edu.au/52808/
c© Copyright 2012 The Authors.
Notice: Changes introduced as a result of publishing processes such ascopy-editing and formatting may not be reflected in this document. For adefinitive version of this work, please refer to the published source:
https://doi.org/10.1017/jgc.2012.9

Wilson, K., & Gilmore, L. (2012). Assessing intellectual functioning in young adolescents: How do the WISC-IV and SB5 compare? Australian Journal of Guidance and Counselling, 22, 1-14.
Assessing intellectual functioning in young adolescents: How do the WISC-IV and
SB5 compare?
Kimberley Wilson
Linda Gilmore
Queensland University of Technology
Brisbane, Australia
Address for correspondence: Linda Gilmore School of Learning and Professional Studies Queensland University of Technology Victoria Park Road Kelvin Grove QLD 4059 Australia Fax 61 7 3138 3987 E-mail [email protected]

WISC-IV SB5 COMPARISON 2
Abstract
The Wechsler Intelligence Scale for Children – Fourth Edition (WISC-IV) and the
Stanford-Binet – Fifth Edition (SB5) are two of the most commonly used intelligence
tests for children and adolescents. No comparative studies of the WISC-IV and SB5
have yet been published. In the current study the WISC-IV and SB5 were
administered in counterbalanced order to 30 typically-developing 12- to 14-year-old
adolescents. There was a significant difference between Full Scale IQs on the two
measures, with scores being higher on the WISC-IV. A significant difference was also
found between Verbal IQs and there were large score differences for some
participants. The paper concludes that the WISC-IV and SB5 cannot be presumed to
be interchangeable measures of intelligence.
Keywords: WISC-IV, SB5, intellectual assessment, intelligence test, child, adolescent

WISC-IV SB5 COMPARISON 3
Assessing intellectual functioning in young adolescents: How do the WISC-IV and
SB5 compare?
The assessment of intellectual ability is an important part of a psychologist’s
role, particularly for those who work with children and adolescents. On the basis of
intelligence test results, important decisions may be made about academic assistance,
educational placement and access to various supports and services.
Several well-established and psychometrically sound measures of intellectual
ability are available to psychologists, including the Wechsler Intelligence Scales, the
Stanford Binet Intelligence Scales and the Woodcock-Johnson Tests of Cognitive
Abilities. In practice, psychologists may prefer and use one specific test over others;
however, it is essential that they have access to more than one measure, along with the
necessary expertise in administration and interpretation. Re-testing with an alternative
measure may be required within a short time frame in order to examine a child’s
progress or to confirm the validity of results from a previous assessment. Although it
often seems to be presumed that all intelligence tests produce the same results and can
thus be used interchangeably, it would probably be surprising if that were the case,
given the notable differences in structure and content across different tests. There is,
however, a scarcity of published literature that contrasts the features of different
intelligence tests and considers their concurrent validity – that is, the expected
relationship between scores on one test to scores on another test that measures the
same construct of general intelligence.
The Wechsler Intelligence Scale for Children – Fourth Edition (WISC-IV;
Wechsler, 2003) is widely used for assessing the intellectual ability of children and
adolescents and, according to various surveys of psychological test usage, the
Wechsler continues to be the most frequently used measure of intellectual ability

WISC-IV SB5 COMPARISON 4
among school psychologists, neuropsychologists, and clinical psychologists
(Wasserman & Tulksy, 2005). The Stanford-Binet – Fifth Edition (SB5; Roid, 2003a)
is also used frequently (Sattler, 2008). Both instruments were most recently updated
in 2003 (Roid, 2003a; Wechsler, 2003) and Australian norms for the WISC-IV were
published in 2005.
Most robust measures of intellectual ability obtain concurrent validity scores
of .7 to .8, a range that is considered acceptable and desirable for two instruments that
measure the same construct (Urbina, 2004). No comparisons or concurrent validity
studies of the WISC-IV and SB5 have yet been published. Previous studies comparing
earlier editions of the two tests produced mixed results but, in general, moderate to
high correlations were reported, with the majority ranging from .68 to .88 (Carvajal et
al., 1993; Greene, Sapp, & Chissom, 1990; Hollinger & Baldwin, 1990; Lavin, 1996;
Lukens, 1990; Lukens & Hurrell, 1996; Prewett & Matavich, 1994; Roid, 2003b; Rust
& Lindstrom, 1996; Saklofske, Schwean, Yackulic, & Quinn, 1994; Simpson et al.,
2002). At times, however, there have been relatively large differences between
composite scores on the two tests, with the higher scoring instrument varying across
studies (Brown & Morgan, 1991; Lukens & Hurrell, 1996; Minton & Pratt, 2006;
Prewett & Matavich, 1994).
While there are no published reports using the most recent editions of both the
WISC and SB, one study compared the SB5 with the WISC-III. Minton and Pratt
(2006) tested 56 gifted children with the SB5 after they had been identified as gifted
on the WISC-III. Composite scores on the SB5 were significantly lower than the Full
Scale IQ (FSIQ) scores on the WISC-III, even after allowing for a 5-point difference
due to the Flynn effect (Flynn, 1984). There was an average difference of 12 points
for the gifted group and 18 points for the highly gifted group, and the correlation of
WISC-IV SB5 COMPARISON 5
FSIQs was only .46. Minton and Pratt suggested that statistical or sampling issues
may have been responsible for the differences; alternatively, they argued, the SB5 and
WISC-III could have been capturing different aspects of giftedness, a hypothesis
which is consistent with SB5 studies that have reported lower than expected scores for
gifted populations (Newton, McIntosh, Dixon, Williams, & Youman, 2008).
The aim of the current study was to provide comparative data for the WISC-
IV and SB5 by administering the two tests to a sample of typically-developing young
adolescents. Specifically, we sought to determine concurrent relationships between
scores on the two instruments and to consider any notable discrepancies in scores for
individual participants.
Method
Participants
The participants were 30 adolescents (17 girls, 13 boys) aged 12 to 14 years
(M = 12.90, SD = 0.35). The students attended a private, independent school in
Brisbane where they were enrolled in the first year of high school. Information about
the study, consent forms and a brief screening questionnaire were sent home to
parents of all Year 8 students. The screening instrument requested details of the
child’s gender, age, first language and any significant difficulties with learning,
attention, vision or hearing. No difficulties were reported, and of the 32 students who
agreed to participate, all were taken into the study with the exception of two who had
recently been tested with the WISC-IV.
Measures
Wechsler Intelligence Scale for Children – Fourth Edition Australian
Standardised Edition (WISC-IV Australian) (Wechsler, 2005). The WISC-IV is an
individually administered test of intelligence for children aged 6 to 16 years. It

WISC-IV SB5 COMPARISON 6
contains 10 core subtests which form four indexes: Verbal Comprehension (VCI),
Perceptual Reasoning (PRI), Working Memory (WMI) and Processing Speed (PSI),
and an overall composite Full Scale IQ (FSIQ). Supplementary subtests are also
available. In the current study, the 10 core subtests were administered in the
prescribed order, following the standard procedures shown in the Administration
Manual.
Stanford-Binet – Fifth Edition (SB5) (Roid, 2003a). The SB5 is an
individually administered intelligence test for individuals aged 2 to 85 years and
older. It consists of 10 subtests that provide verbal and nonverbal scores on five
cognitive factors: Fluid Reasoning (FR), Knowledge (KN), Quantitative Reasoning
(QR), Visual-Spatial Processing (VS), and Working Memory (WM). There are three
composite scores: Verbal IQ (VIQ), Nonverbal IQ (NVIQ) and Full Scale IQ (FSIQ).
All 10 subtests were administered following the standard procedures and instructions
outlined in the Administration Manual.
Student Questionnaire. A short questionnaire was developed for use before
and after each test administration. The questions prior to testing asked the students to
rate how tired, excited and nervous they were feeling on a 6-point Likert scale which
ranged from 0 (not at all) to 5 (extremely). After the administration, students rated
how tired they felt, how much fun the test was, and how difficult the activities were,
using the same 6-point scale. The pressure they felt in timed tasks was measured by a
6-point Likert scale which ranged from 0 (none at all) to 5 (extreme pressure). The
participants were also asked which set of activities they preferred and which activities
in particular they liked or disliked, and the reasons for their preferences. Lastly,
students were given the opportunity to provide some general comments about the
tests.

WISC-IV SB5 COMPARISON 7
Procedure
Participants were assessed individually by the examiner (the first author) in a
quiet room at their school. Each student completed both the WISC-IV and the SB5 in
a repeated measures design, with an interval between the two tests that ranged from
one day to three weeks (M = 6.6 days). Although attempts were made to achieve a
consistent interval of one week between the two administrations, this was not always
possible because of absences caused by illness, school excursions, or holidays. The
order of the tests was counterbalanced, and the time of day at which participants were
tested was the same across the two testing sessions.
In each session, students first completed the pre-test questions. The intellectual
assessment was then administered. At the end of the session, participants completed
the post-test questionnaire.
Results
Preliminary Analyses
Preliminary analyses were conducted to examine skew and kurtosis. All test
scores were found to have normal distributions and no adjustments were needed.
Independent samples t-tests showed that order of administration had no effect on any
variables including FSIQ. There were no gender differences on any of the scores or
ratings.
Comparison of WISC-IV and SB5 Composite, Factor and Subtest Scores
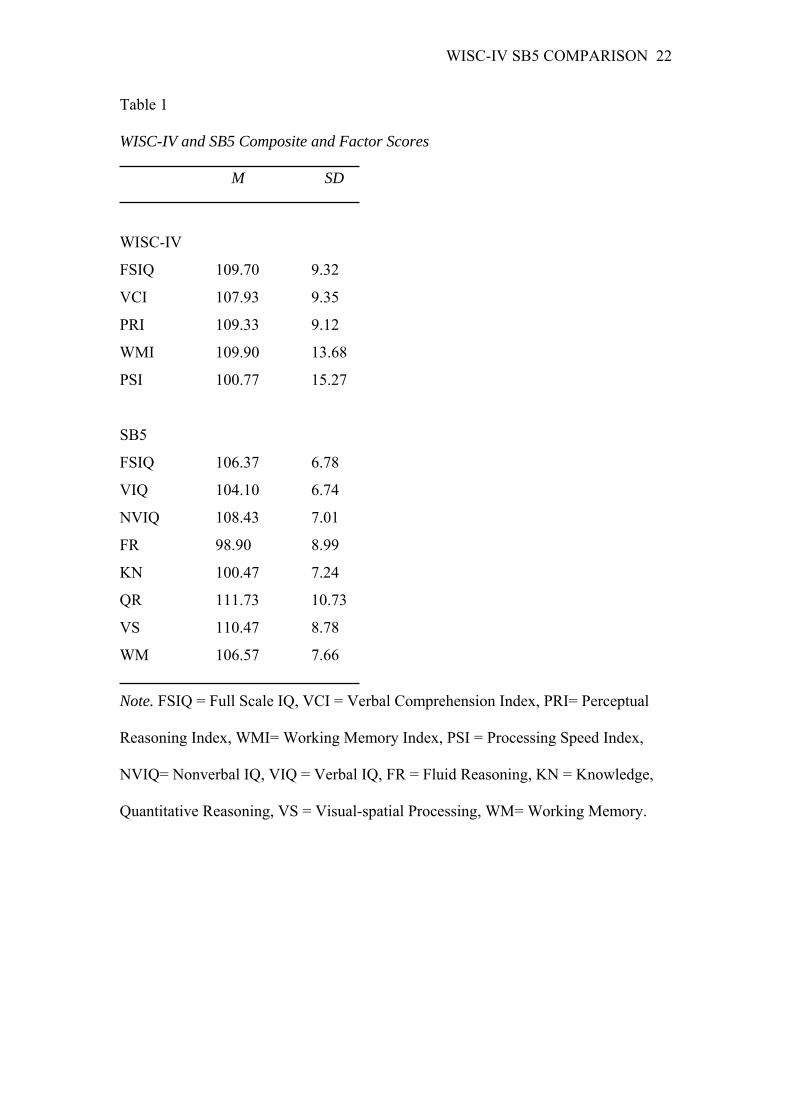
Means and standard deviations for composite, factor and subtest scores are
presented in Table 1. Paired samples t-tests were conducted to examine differences
between composite and factor scores. A significant difference was found for FSIQ on
the two instruments, t(29) = 2.26, p = .03, 95% CI [0.31, 6.36], η2 = .15. WISC-IV
scores (M = 109.7) were significantly higher than those on the SB5 (M = 106.37).
WISC-IV SB5 COMPARISON 8
There was also a significant difference between the WISC-IV VCI and SB5 VIQ,
t(29) = -2.05, p = .04, 95% CI [-7.66, -0.01], η2 = .13 with the WISC-IV VCI (M =
107.93) being significantly higher than the SB5 VIQ (M = 104.1). There was no
significant difference between the WISC-IV PRI (M = 109.33) and the SB5 NVIQ (M
= 108.43).
INSERT TABLE 1 ABOUT HERE
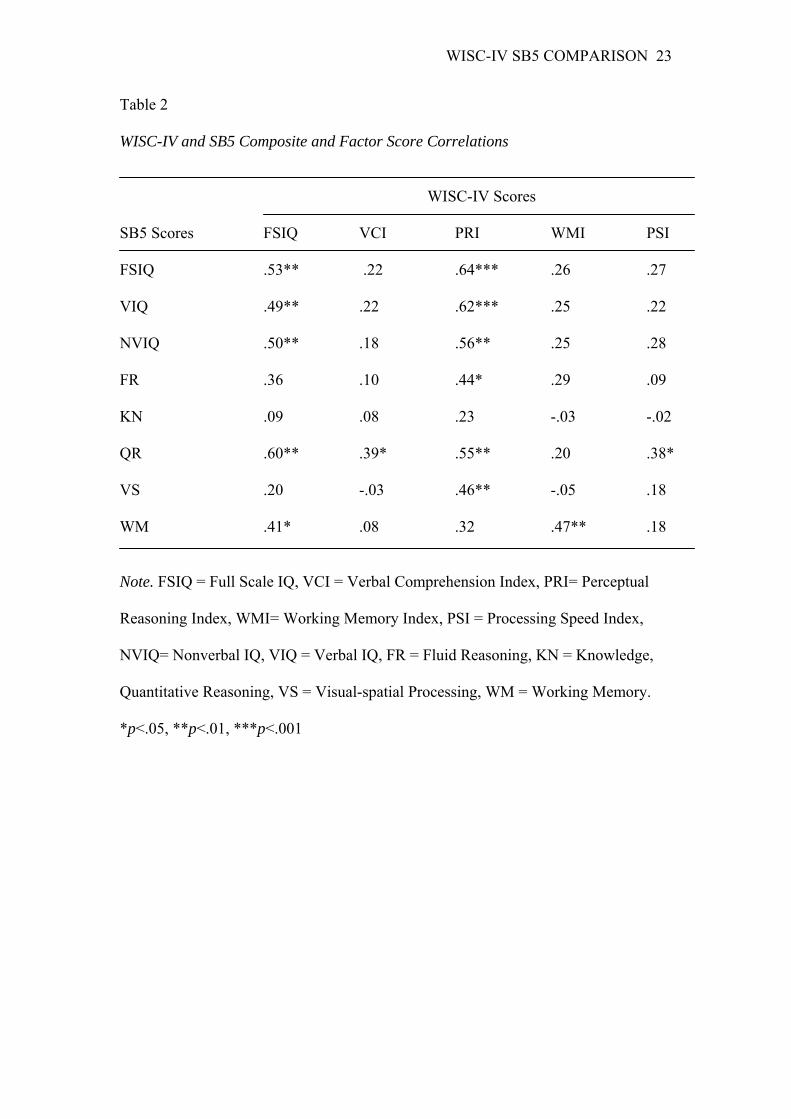
Correlations of SB5 and WISC-IV composite and factor scores are presented
in Table 2. There were significant relationships between the two FSIQs, (r = .53), and
between the nonverbal composites, PRI and NVIQ (r = .56), but there was no
significant relationship between the verbal composites. In the WISC-IV and the SB5,
there are two areas which contain very similar tasks. These are the subtests Matrix
Reasoning (WISC-IV) and Nonverbal Fluid Reasoning (SB5), which involve
choosing the piece that belongs in a matrix pattern, and the subtests Vocabulary
(WISC-IV) and Verbal Knowledge (SB5), which involve explaining the meaning of
words. There was a significant correlation between Matrix Reasoning and Nonverbal
Fluid Reasoning (r = .39, p = .03), but no significant correlation between Vocabulary
and Verbal Knowledge (r = .13).
INSERT TABLE 2 ABOUT HERE
Instrument Preference
Initial analyses found that 63.3% of students preferred the WISC-IV,
compared to 33.3% who preferred the SB5, and 3.3% who liked the instruments
equally. A chi-squared test for independence showed that order of administration had
no effect on instrument preference. Independent t-tests were conducted to examine the
possible impact of instrument preference on WISC-IV and SB5 scores, and no
significant differences were found.
WISC-IV SB5 COMPARISON 9
Fifty-nine percent of participants performed better on the instrument they
preferred, compared to 31% who did worse on their preferred instrument and 7% who
performed very similarly. A chi-squared test of independence found no significant
relationship between preferred instrument and higher scoring instrument.
Length of Test Administrations
Using a paired samples t-test, there was a significant difference between
length of assessments, t(29) = 5.68, p <.001, 95% CI [0.10, 0.22], η2 = .53, with the
SB5 (M = 1.60) taking longer than the WISC-IV (M = 1.44).
Post-assessment ratings
Paired sample t-tests were conducted to examine differences between
students’ ratings for the two instruments. A significant difference was found for
ratings of difficulty by participants following the assessments, t(29) = -2.26, p = .031,
95% CI [-0.88, -0.05], η2 = .15. They rated the SB5 (M = 2.82) as more difficult than
the WISC-IV (M = 2.35). A significant difference was found also for ratings of
perceived time pressure during the assessments, t(29) = 3.01, p = .005, 95% CI [0.26,
1.37], η2 =.24. Students reported more time pressure during the WISC-IV (M = 1.72)
than the SB5 (M = 0.90). There was no significant difference in their ratings of how
much fun each assessment had been.
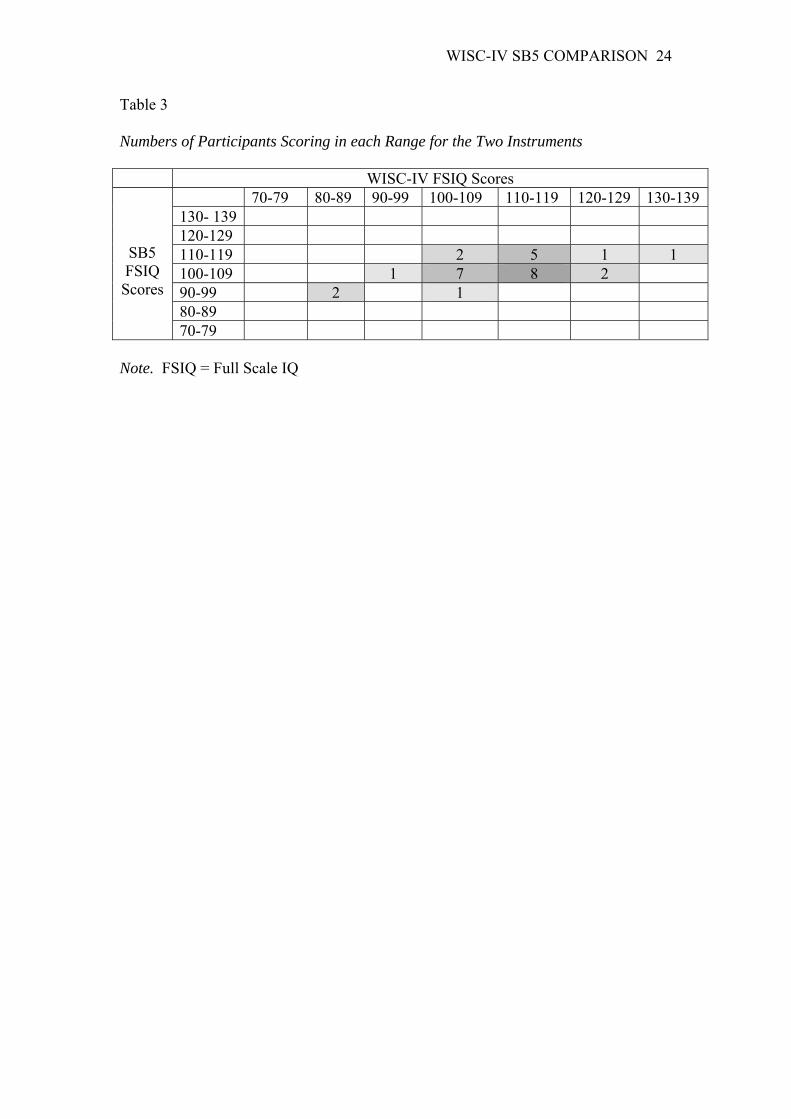
Within-group differences
The distributions of individual scores on the WISC-IV and SB5 are presented
in Table 3. The range of scores was wider on the WISC-IV, with two participants in
the 80-89 (below average) range and four being classified as superior (120-129) or
very superior (130-139). By contrast, no participants scored in these ranges on the
SB5.
INSERT TABLE 3 ABOUT HERE
WISC-IV SB5 COMPARISON 10
Table 4 shows score differences across the two instruments for each
participant. Twenty-eight percent (n = 8) of the sample had a discrepancy of 10 or
more points between their FSIQ scores on the two instruments, with 7% (n = 2)
having at least a 15 point difference. The FSIQ ranges given by the WISC-IV and
SB5 (95% Confidence Level) did not overlap for these participants. Half of the
sample were placed in different descriptive ranges on the basis of their results from
the two assessments, including three students (10%) who had a difference of two
descriptive ranges (Average on the SB5 compared with Superior on the WISC-IV,
and High Average on the SB5 contrasted with Very Superior on the WISC-IV). In
60% of the sample, the WISC FSIQ was higher than the SB5 FSIQ and in 7 of the 8
cases where there was a discrepancy of at least 10 points, the WISC-IV was the higher
scoring instrument (see Table 4).
INSERT TABLE 4 ABOUT HERE
Qualitative Information
Some of the reasons adolescents gave for preferring one test over the other are
presented in Table 5. Common comments about the WISC-IV included that it was
easier, the activities were “fun” and it was not as complicated and repetitive as the
SB5. Those who preferred the SB5 said that it was more “hands-on” and more
challenging, and that it had “a better mix of easy and hard”.
The favourite subtests were Block Design (WISC-IV) and Nonverbal Visual-
Spatial (SB5) which were described as being “fun” and “hands-on”. The least
favourite activities included Quantitative Reasoning (SB5), which was often described
as being difficult and “tricky”, and Letter-Number Sequencing (WISC-IV), which was
reported to be confusing and hard.
INSERT TABLE 5 ABOUT HERE
WISC-IV SB5 COMPARISON 11
Discussion
This study provides valuable comparative data for two of the most commonly
used measures of intellectual ability in children. Although IQ is certainly not the only
information obtainable from these instruments, an estimate of FSIQ is usually an
important reason (and indeed sometimes the only reason) for administering an
assessment of intelligence. The FSIQ score is frequently used to categorise children in
some way (e.g., for intellectual impairment or intellectual giftedness) or to rule out
low intelligence as the primary reason for a child’s difficulties with learning. For
these purposes, the WISC-IV and SB5 provide an overall composite score: the FSIQ.
In the present study, however, there was a significant difference between FSIQs
obtained from the two instruments. At the group level, WISC-IV FSIQs were higher
by more than 3 points and the majority of participants obtained a higher score on the
WISC-IV. This occurred despite the fact that the two tests were administered by the
same examiner, in the same setting, with only a short time interval between
assessments.
Despite the significant difference in scores, the FSIQs on the two instruments
are significantly correlated. However, the correlation of .58 is lower than the reported
correlations of .65 to .88 for earlier versions of the two instruments (Carvajal et al.,
1993; Greene et al., 1990; Hollinger & Baldwin, 1990; Lukens, 1990; Lukens &
Hurrell, 1996; Prewett & Matavich, 1994; Rust & Lindstrom, 1996; Saklofske et al.,
1994; Simpson et al., 2002). Given that both tests provide estimates of g, moderately
high to high correlations in the magnitude of .7 to .8 would be expected (Urbina,
2004). However, Minton and Pratt (2006) reported only a moderate correlation of .46
between the WISC-III and SB5 FSIQs in a sample of gifted children, with scores
being higher on the WISC-III. The present findings, in combination with those of
WISC-IV SB5 COMPARISON 12
Minton and Pratt using the WISC-III, suggest that there may be specific features in
the most recent revision of the SB that account for the less robust relationship.
The difference in FSIQs can be attributed largely to the difference between the
two verbal composites. While the WISC-IV PRI and SB5 NVIQ did not differ
markedly, the VCI and VIQ were significantly different with an almost 4 point
discrepancy and a non-significant correlation of only .22. There have been some
notable changes in the structure of the SB5 compared with the previous 4th edition.
Two composites (Verbal and Nonverbal) have replaced the previous four, one of
which was Verbal Reasoning. Of the four SB:IV Verbal Reasoning subtests
(Vocabulary, Comprehension, Absurdities and Verbal Relations) only Vocabulary and
Absurdities have been retained and three new verbal measures have been added
(visual-spatial processing, quantitative reasoning and working memory) to provide a
direct comparison with the nonverbal scales of the same name.
In the SB:IV, Vocabulary, Comprehension and Verbal Relations were similar
to the WISC-III/WISC-IV Vocabulary, Comprehension and Similarities subtests.
These similarities may account for the higher correlations between the SB:IV and
WISC-III (Carvajal et al., 1993; Lavin, 1996; Lukens & Hurrell, 1996; Prewett &
Matavich, 1994; Roid, 2003b; Rust & Lindstrom, 1996; Saklofske et al., 1994;
Simpson et al., 2002). By contrast, the SB5 Verbal subtests examine verbal abilities
that are not directly assessed by the WISC-IV VCI (i.e., working memory, visual-
spatial processing and quantitative reasoning). Perhaps the WISC-IV VCI and the
SB5 VIQ now measure aspects of verbal intelligence which are too different to be
strongly related.
Intriguingly, however, the only verbal tasks that should be directly comparable
across the two instruments (WISC-IV Vocabulary and SB5 Verbal Knowledge) did
WISC-IV SB5 COMPARISON 13
not correlate significantly. A closer examination of individual scores on these two
subtests shows that over half of the participants obtained scores within one point of
each other on the two vocabulary subtests, and 24 of the 30 students scored within 3
points (i.e., one standard deviation). Where the difference was more than one point,
the WISC-IV score was always the higher one. For the remaining 6 participants, the
score difference was 4 to 7 points, with the WISC-IV producing the higher result. In
particular, these students tended to miss points on the SB5 vocabulary subscale
because they provided responses that were accurate, but not sufficiently complex to
be scored as 2 points. Compared with the WISC-IV, the SB5 does not prescribe
examiner querying as frequently, and the lower SB5 scores are probably at least partly
due to this difference in administration procedure.
Another factor that may contribute to the discrepancy in scores across the two
instruments is the higher ceiling on the SB5. It may be that the SB5 gives a more
realistic portrayal of scores in young adolescents due to the greater range of more
difficult items. The WISC-IV’s lower ceiling may result in an overestimate of ability
for those who are in the above average range of intelligence. It is possible also that the
SB5’s placement of verbal subtests following the more hands-on nonverbal tasks may
lower scores on the VIQ due to increased fatigue, boredom or a lower level of interest
in the second half of an assessment.
There were some particularly large differences between scores on the two tests
for some individuals, and in a few cases there was a difference as great as two
descriptive ranges. For the majority where there was a large difference, the WISC-IV
was the higher scoring instrument. Interestingly, there was a larger spread of scores
on the WISC-IV, with a range of 87 to 131, compared with 90 to 118 on the SB5. It
seems that it may be more difficult to get a high score on the SB5, possibly because of

WISC-IV SB5 COMPARISON 14
the specific ceiling rules that are used. Minton and Pratt (2006) found that the SB5
produced lower than expected scores for a gifted sample and also did not distinguish
between different levels of gifted children. The fact that the current sample did not
contain any students who scored in the very low or very high ranges limits our ability
to explore the different spread of scores on the two instruments. Nevertheless, this is
an important aspect that should be investigated further in future research.
The majority of adolescents in the current study said they preferred the
WISC-IV to the SB5, although they did not necessarily perform better on their
preferred test. The most common reasons for preferring the WISC-IV were that it was
easier and more enjoyable. By contrast, the SB5 was rated as being significantly more
difficult than the WISC-IV. The perceived difficulty is probably related to the
different structure and ceiling rules on the two instruments. For the WISC-IV,
discontinuation on each subtest usually follows failure on 4 or 5 consecutive items in
a graded series. The SB5, however, involves the administration of complete 6-item
sets for most subtests. If three or more items in the set are passed, the higher level set
is administered in its entirety. Because there is often an abrupt increase in difficulty
level from one set to the next, children who manage to pass a sufficient number of
items at one level of difficulty are then faced with a set of six very much more
difficult items at the higher level. This may affect children’s perceptions about the
test’s difficulty, and perhaps also their enjoyment of the testing experience. The
structure may also impact on the time taken to complete the test, as the SB5 session
was significantly longer than the WISC-IV (1.60 hours compared with 1.44 hours).
The greater time pressure participants perceived on the WISC-IV was
undoubtedly related to the fact that there are more timed tasks on this instrument than
on the SB5. However, perceived time pressure did not seem to affect students’ test

WISC-IV SB5 COMPARISON 15
scores or enjoyment of the test. Simpson et al. (2002) hypothesised that the lack of
time pressure on the SB5 should have a positive effect on test scores, and although
this was not evident in the current study, it is possible that certain sub-groups of
children, such as those with learning or intellectual disabilities, would benefit
positively from a lack of time pressure.
The results of the current study have implications for psychologists who assess
the intellectual functioning of children and adolescents. They highlight the importance
of gathering data from multiple assessments and at multiple time points. Clearly,
considerable caution should be exercised when making important decisions about
eligibility for services or entry into programs on the basis of a single IQ score from a
single assessment. Triangulation of data from multiple sources and the inclusion of
other measures of ability, such as work samples, achievement scores and functional
and adaptive abilities and behaviours are highly desirable.
Two specific practice issues are raised by the findings of this study. One issue
is related to test choice. What factors should a psychologist take into account when
selecting the most appropriate instrument for assessing the intellectual ability of a
specific child? In practice, it seems that choice is often restricted by the availability of
a particular instrument and the practitioner’s familiarity and confidence with its use.
The WISC-IV tends to be a popular choice in the Australian context because
Australian norms are available. Some children may be disadvantaged by the WISC-
IV’s inclusion of time limits for some subtests, whereas others who work quickly or
perform better under time pressure may benefit. The fact that the SB5 takes longer
than the WISC-IV to administer may have implications for test choice. Although an
average of 10 minutes extra probably has little practical relevance, there is the
increasing possibility of fatigue or inattention when testing is prolonged and, as

WISC-IV SB5 COMPARISON 16
mentioned earlier, this may contribute to the lower scores that were achieved on SB5
verbal subtests compared with the WISC-IV.
The SB5 may have particular value for children in the overlapping
WPPSI/WISC or WISC/WAIS age ranges. For those aged 6 years 0 months to 7 years
3 months or 16 years 0 months to 16 years 11 months, choices between the WPPSI-III
and WISC-IV or between the WISC-IV and the WAIS-IV can be challenging as the
floors or ceilings may be too low or too high for the individual being tested. In these
cross-over ranges, the SB5 can provide a valuable alternative to the Wechsler scales.
Another appealing feature of the SB5 is its structure that comprises verbal and
nonverbal subtests for each of the five factors, thus providing the capacity to contrast
verbal and nonverbal performance within a particular domain.
A more complex issue arises when two intellectual assessments administered
at different times produce markedly discrepant results. Irrespective of whether or not
the results have come from the same or different instruments, how do psychologists
reconcile substantial differences across test scores? There is a notable scarcity of
literature to guide practitioners in dealing with such dilemmas. In general, it seems
they rely on clinical judgement, drawing together other sources of information, and
searching for possible explanations for the discrepant findings, in order to decide
which test score is more reliable and valid, and how to interpret the pattern of results.
This issue is particularly pertinent when children’s intellectual functioning is being
monitored over time because of degenerative conditions or to evaluate the effects of
intervention or medication. The practice of alternating WISC-IV and SB5
assessments, with the unquestioning assumption that the two tests provide comparable
scores, should be undertaken with considerable caution.

WISC-IV SB5 COMPARISON 17
The present study has some limitations which should be kept in mind when
interpreting the findings. The most important limitations involve the small sample
size, the restricted age range of participants, and the somewhat higher than average
intellectual ability of the sample compared to the general population. It is possible that
more consistency in scores would be evident in a larger sample and in a group of
children who are younger or older than those who participated in the current study.
Furthermore, the sample was restricted to one private school where the socioeconomic
status of families was higher than average, and the FSIQ means for the sample were
well above 100 on both instruments. The fact that the group contained no participants
in the borderline, intellectually impaired or extremely intellectually gifted ranges
means that the results cannot be generalised to atypical groups. Given that children
referred for intellectual assessment are usually atypical in that they have difficulties
with learning or indications of possible intellectual impairment or giftedness, research
comparing the use of the WISC-IV and SB5 in various atypical groups would be of
considerable value to practitioners. It is also important for future research to focus on
a wider range of ages and socioeconomic backgrounds.
Another factor to be kept in mind when interpreting the findings is that scores
across the two instruments are not perfectly comparable because Australian norms are
available only for the WISC-IV. These norms were used in the current study, whereas
the SB5 results were based on norms from the USA. An exploratory analysis using
American norms for the WISC-IV produced even greater score differences between
the two instruments: WISC-IV FSIQ scores were almost one point higher when
American norms were used, increasing the FSIQ difference between the two tests to
4.5 points.
WISC-IV SB5 COMPARISON 18
Despite these limitations, the current study provides valuable information for
psychologists who assess children’s intellectual ability and raises issues that are
worthy of further reflection and investigation. Overall, the results suggest that the
WISC-IV and SB5 cannot be presumed to be interchangeable measures of
intelligence, and therefore caution should be used when interpreting and comparing
test results.
WISC-IV SB5 COMPARISON 19
References
Brown, T., & Morgan, S. (1991). Concurrent validity of the Stanford-Binet, 4th
Edition: Agreement with the WISC—R in classifying learning disabled
children. Psychological Assessment: A Journal of Consulting and Clinical
Psychology, 3, 247-253. doi: 10.1037/1040-3590.3.2.247
Carvajal, H. H., Hayes, J., Lackey, K. Rathke, M., Weibe, D., & Weaver, K. (1993).
Correlations between scores on the Wechsler Intelligence Scale for Children-III
and the General Purpose Abbreviated Battery of the Stanford-Binet IV.
Psychological Reports, 72, 1167-1170.
Flynn, J. R. (1984). The mean IQ of Americans: Massive gains 1932 to 1978.
Psychological Bulletin, 95, 29-51. doi: 10.1037//0033-2909.95.1.29
Greene, A., Sapp, G., & Chissom, B. (1990). Validation of the Stanford-Binet
Intelligence Scale: Fourth Edition with exceptional Black male students.
Psychology in the Schools, 27, 35-41. doi:10.1002/1520-
6807(199001)27:1<35::AID-PITS2310270106>3.0.CO;2-Q
Hollinger, C., & Baldwin, C. (1990). Comparing scores on the Stanford-Binet, Fourth
Edition with the WISC—R for exceptional children. Psychological Reports, 66,
979-984.
Lavin, C. (1996). The Wechsler Intelligence Scale for Children-Third edition and the
Stanford-Binet Intelligence Scale: Fourth edition: A preliminary study of
validity. Psychological Reports, 78, 491-496.
Lukens, J. (1990). Stanford-Binet, Fourth Edition and the WISC—R for children in the
lower range of intelligence. Perceptual and Motor Skills, 70, 819-822.
doi:10.2466/PMS.70.3.819-822
Lukens, J., & Hurrell, R. (1996). A comparison of the Stanford-Binet IV and the
WISC-IV SB5 COMPARISON 20
WISC-III with mildly retarded children. Psychology in the Schools, 33, 24-27.
doi:10.1002/(SICI)1520-6807(199601)33:1<24::AID-PITS3>3.0.CO;2-W
Minton, B. A., & Pratt, S. (2006). Gifted and Highly Gifted Students: How Do They
Score on the SB5? Roeper Review, 28, 232-236. Retrieved from
http://www.roeper.org/RoeperInstitute/roeperReview/index.aspx
Newton, J., McIntosh, D., Dixon, F., Williams, T., & Youman, E. (2008). Assessing
giftedness in children: Comparing the accuracy of three shortened measures of
intelligence to the Stanford-Binet Intelligence Scales, Fifth Edition.
Psychology in the Schools, 45, 523-536. doi: 10.1002/pits.20321
Prewett, P., & Matavich, M. A. (1994). A comparison of referred students' performance
on the WISC-III and the Stanford-Binet Intelligence Scale: Fourth Edition.
Journal of Psychoeducational Assessment, 12, 42-48. doi:
10.1177/073428299401200104
Roid, G. H. (2003a). Stanford-Binet Intelligence Scales, Fifth Edition. Itasca, IL:
Riverside.
Roid, G. H. (2003b). Stanford-Binet Intelligence Scales, Fifth Edition: Technical
manual. Itasca, IL: Riverside.
Rust, J. O., & Lindstrom, A. (1996). Concurrent validity of the WISC-III and
Stanford-Binet IV. Psychological Reports, 79, 618-620.
Saklofske, D. H., Schwean, V., Yackulic, R., & Quinn, D. (1994). WISC-III and SB:FE
performance of children with attention deficit hyperactivity disorder. Canadian
Journal of School Psychology, 10, 167-171. doi:10.1177/082957359501000210
Sattler, J. (2008). Assessment of children: Cognitive foundations. (5th ed.). San Diego;
J.M Sattler.
Simpson, M., Carone, D. Jr., Burns, W., Seidman, T., Montgomery, D., & Sellers, A.

WISC-IV SB5 COMPARISON 21
(2002). Assessing giftedness with the WISC-III and the SB-IV. Psychology in
the Schools, 39, 515-524. doi:10.1002/pits.10057
Urbina, S. (2004). Essentials of psychological testing. Hoboken, N.J: John Wiley &
Sons.
Wasserman, J., & Tulksy, D. (2005). A history of intelligence assessment. In D. P.
Flanagan & P. L. Harrison (Eds.), Contemporary intellectual assessment:
theories, tests, and issues (pp. 3-22). New York, NY: Guilford Press.
Wechsler, D. (2003). Wechsler Intelligence Scale for Children - Fourth Edition. San
Antonio, TX: Psychological Corporation.
Wechsler, D. (2005). Wechsler Intelligence Scale for Children - Fourth Edition.
Australian Standardised Edition. Harcourt Assessment: Psychological
Corporation.
WISC-IV SB5 COMPARISON 22
Table 1
WISC-IV and SB5 Composite and Factor Scores
M SD
WISC-IV
FSIQ 109.70 9.32
VCI 107.93 9.35
PRI 109.33 9.12
WMI 109.90 13.68
PSI 100.77 15.27
SB5
FSIQ 106.37 6.78
VIQ 104.10 6.74
NVIQ 108.43 7.01
FR 98.90 8.99
KN 100.47 7.24
QR 111.73 10.73
VS 110.47 8.78
WM 106.57 7.66
Note. FSIQ = Full Scale IQ, VCI = Verbal Comprehension Index, PRI= Perceptual
Reasoning Index, WMI= Working Memory Index, PSI = Processing Speed Index,
NVIQ= Nonverbal IQ, VIQ = Verbal IQ, FR = Fluid Reasoning, KN = Knowledge,
Quantitative Reasoning, VS = Visual-spatial Processing, WM= Working Memory.
WISC-IV SB5 COMPARISON 23
Table 2 WISC-IV and SB5 Composite and Factor Score Correlations
WISC-IV Scores SB5 Scores FSIQ VCI PRI WMI PSI FSIQ .53** .22 .64*** .26 .27 VIQ .49** .22 .62*** .25 .22 NVIQ .50** .18 .56** .25 .28 FR .36 .10 .44* .29 .09 KN .09 .08 .23 -.03 -.02 QR .60** .39* .55** .20 .38* VS .20 -.03 .46** -.05 .18 WM .41* .08 .32 .47** .18 Note. FSIQ = Full Scale IQ, VCI = Verbal Comprehension Index, PRI= Perceptual
Reasoning Index, WMI= Working Memory Index, PSI = Processing Speed Index,
NVIQ= Nonverbal IQ, VIQ = Verbal IQ, FR = Fluid Reasoning, KN = Knowledge,
Quantitative Reasoning, VS = Visual-spatial Processing, WM = Working Memory.
*p<.05, **p<.01, ***p<.001
WISC-IV SB5 COMPARISON 24
Table 3 Numbers of Participants Scoring in each Range for the Two Instruments
WISC-IV FSIQ Scores
SB5 FSIQ Scores
70-79 80-89 90-99 100-109 110-119 120-129 130-139 130- 139 120-129 110-119 2 5 1 1 100-109 1 7 8 2 90-99 2 1 80-89 70-79
Note. FSIQ = Full Scale IQ

WISC-IV SB5 COMPARISON 25
Table 4 Score Differences between WISC-IV and SB5 Composite Scores Participant
FSIQ VIQ/VCI NVIQ/PRI Difference Higher Difference Higher Difference Higher (points) scoring (points) scoring (points) scoring instrument a instrument a instrument a
1 2 1 6 2 9 4 15 SB5 3 1 6 5 4 7 8 3
5 0 8 6 6 6 9 5 7 6 3 2 8 5 9 10 WISC-IV 9 12 WISC-IV 8 1 10 8 11 SB5 9 11 0 4 2 12 2 3 9 13 7 4 6 14 12 WISC-IV 3 2 15 6 20 WISC-IV 3 16 11 WISC-IV 23 WISC-IV 8 17 13 WISC-IV 7 12 WISC-IV 18 6 10 SB5 4 19 8 1 4 20 18 WISC-IV 13 WISC-IV 6 21 2 1 4 22 14 WISC-IV 1 16 WISC-IV 23 1 3 6 24 5 9 6 25 9 4 5 26 7 3 7 27 11 SB5 11 WISC-IV 15 SB5 28 7 11 SB5 15 WISC-IV 29 18 WISC-IV 28 WISC-IV 7 30 2 9 0
Note. FSIQ = Full Scale IQ, VCI = Verbal Comprehension Index, VIQ = Verbal IQ,
PRI= Perceptual Reasoning Index, NVIQ= Nonverbal IQ.
a Higher scoring instrument is shown when there are differences of 10 or more points
between scores on the two instruments.

WISC-IV SB5 COMPARISON 26
Table 5 Reasons for Preferred Instrument and Favourite and Least Favourite Subtests
Reasons given for preferring the WISC-IV (number of children who gave that reason) Difficulty Level Activities “It was easier.” (9) “It was more fun.” (2) “The other one was much harder.” (2) “I found it more interesting.” (1) “I liked the timed activities.” (1) Clarity and Structure “I liked the writing ones.” (1) “It wasn’t as complicated as the other one “I liked the blocks and there were and it was easier to understand.” (1) more patterns.” (1) “It was more straightforward.” (1) “I liked the pictures one.” (1) “There was more variety instead of swapping “It was more about your own thoughts back to the same activities like the other one. rather than just right or wrong answers.” (1) I liked that in this one the activities were all “It felt more interactive.” (1) done in one go.” (1)
Dislike of the SB5 “The other one was too repetitive, going back to the same activities over and over.” (1) “Last time had maths.” (1) “I didn’t like the maths on the other one.” (1) “The other dragged on for too long.” (1)
Reasons given for preferring the SB5 (number of children who gave that reason) Activities Difficulty Level “It was pretty fun.” (4) “It was more challenging.” (2) “I liked the silly and impossible pictures.” (1) “It had a better mix of easy and hard.” (1) “It was more hands-on.” (4) “I liked the blocks.” (2) Favourite Subtests (times mentioned) Least favourite Subtests (times mentioned) Block Design (WISC-IV) (10) Quantitative Reasoning (SB5) (5) Nonverbal Visual-Spatial (SB5) (6) Letter-Number Reasoning (WISC-IV) (5) Nonverbal Knowledge (SB5) (4) Verbal Working Memory (SB5) (4) Symbol Search (WISC-IV) (2) Vocabulary (WISC-IV) (3) Coding (WISC-IV) (2) Nonverbal Working Memory (SB5) (3)