Bemidji Community Health Needs Assessment 8-11-15 · 2015 Bemidji Community Health Needs Assessment...
43
May 2015 Results from a March 2015 generalizable survey of community residents in the Bemidji Metropolitan Area including Beltrami and Clearwater counties in Minnesota CSR Center for Social Research North Dakota State University www.ndsu.edu/csr 2015 Bemidji Community Health Needs Assessment of Residents
Transcript of Bemidji Community Health Needs Assessment 8-11-15 · 2015 Bemidji Community Health Needs Assessment...

May 2015
Results from a March 2015 generalizable survey of community residents in the Bemidji Metropolitan Area including Beltrami and Clearwater counties in Minnesota
CSR Center for Social ResearchNorth Dakota State Universitywww.ndsu.edu/csr
2015 Bemidji Community Health Needs Assessment of Residents

2015 Greater Bemidji Community Health Needs Assessment of Residents page 1
PREFACE This report, entitled 2015 Greater Bemidji Community Health Needs Assessment of Residents, presents the results of a March 2015 generalizable survey of residents in Beltrami and Clearwater counties in Minnesota. The study was conducted by the Center for Social Research at North Dakota State University on behalf of the Community Health Needs Assessment Collaborative. Funding for the study was provided by Collaborative member organizations.

2015 Greater Bemidji Community Health Needs Assessment of Residents page 2
PREFACE ........................................................................................................................................................ 1 TABLE OF CONTENTS .................................................................................................................................... 2 INTRODUCTION ............................................................................................................................................ 4 Study Design and Methodology ............................................................................................................ 4 Limitations of the Study ........................................................................................................................ 4 SURVEY RESULTS ......................................................................................................................................... 6
Figure 1. Level of concern with statements about the community regarding ECONOMICS ................ 6 Figure 2. Level of concern with statements about the community regarding TRANSPORTATION ...... 6 Figure 3. Level of concern with statements about the community regarding the ENVIRONMENT ..... 7 Figure 4. Level of concern with statements about the community regarding the CHILDREN AND YOUTH .......................................................................................................... 7 Figure 5. Level of concern with statements about the community regarding the AGING POPULATION ....................................................................................................... 8 Figure 6. Level of concern with statements about the community regarding SAFETY......................... 8 Figure 7. Level of concern with statements about the community regarding HEALTH CARE .............. 9 Figure 8. Level of concern with statements about the community regarding PHYSICAL AND
MENTAL HEALTH ................................................................................................................. 10 Figure 9. Level of concern with statements about the community regarding SUBSTANCE USE AND
ABUSE ................................................................................................................................... 10
General Health ........................................................................................................................................... 11
Figure 10. Respondents’ rating of their health in general ................................................................. 11 Figure 11. Respondents’ weight status based on the Body Mass Index (BMI) scale ......................... 11 Figure 12. Number of servings of vegetables, fruit, and fruit juice that respondents had yesterday .......................................................................................................................... 12 Figure 13. Number of days in an average week respondents engage in MODERATE and VIGOROUS activity ............................................................................................................ 12
Mental Health ............................................................................................................................................. 13
Figure 14. Percentage of respondents who have been told by a doctor or health professional that they have a mental health issue, by type of mental health issue ...................................... 13
Figure 15. Number of days in the last month that respondents’ mental health was not good .......... 13 Figure 16. How often, over the past two weeks, respondents have been bothered by mental health issues ....................................................................................................................... 14
Tobacco Use ............................................................................................................................................ 14
Figure 17. Whether respondents have smoked at least 100 cigarettes in their entire life ................ 14 Figure 18. How often respondents currently smoke cigarettes and use chewing tobacco or snuff... 15 Figure 19. Location respondents would first go if they wanted help to quit using tobacco ............... 15
Alcohol Use and Prescription Drug/Non‐prescription Drug Abuse .......................................................... 16
Figure 20. Number of days during the past month that respondents had at least one drink of any alcoholic beverage ....................................................................................................... 16
TABLE OF CONTENTS

2015 Greater Bemidji Community Health Needs Assessment of Residents page 3
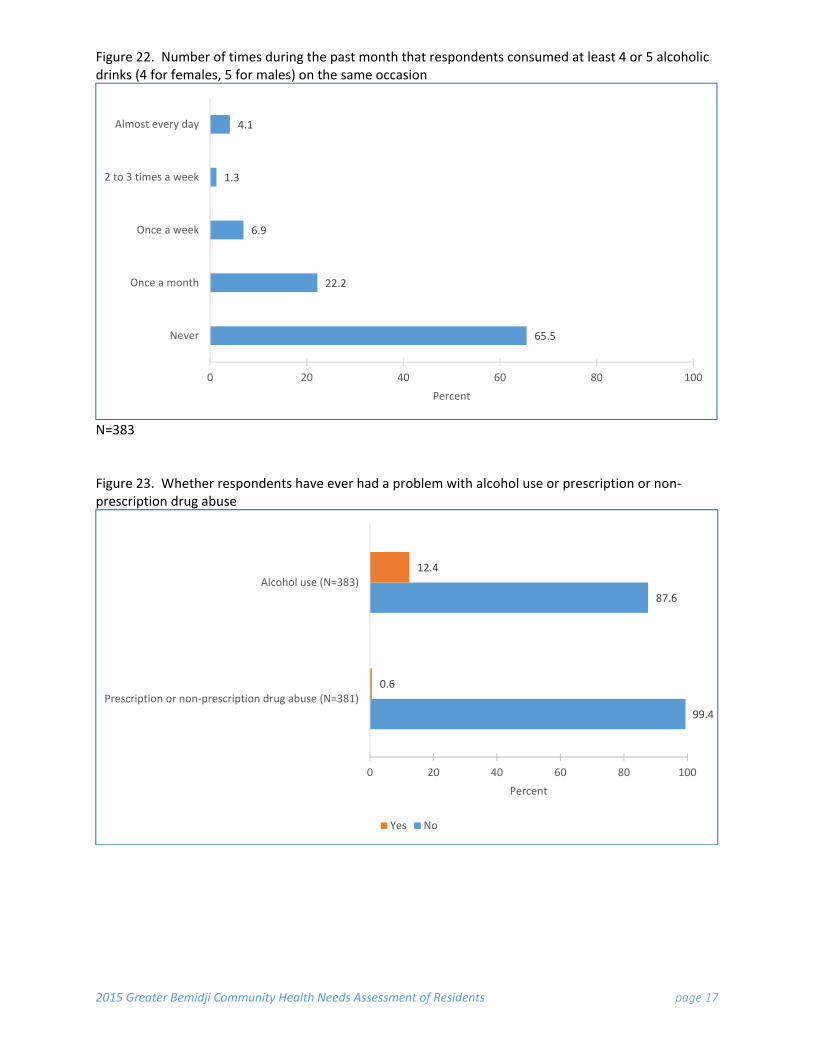
Figure 21. During the past month on days that respondents drank, average number of drinks per day respondents consumed ......................................................................................... 16 Figure 22. Number of times during the past month that respondents consumed at least 4 or 5
alcoholic drinks (4 for females, 5 for males) on the same occasion .................................. 17 Figure 23. Whether respondents have ever had a problem with alcohol use or prescription or non‐prescription drug abuse .............................................................................................. 17 Figure 24. Of respondents who ever had a problem with alcohol use or prescription or non‐
prescription drug abuse, whether respondents got the help they needed ....................... 18 Figure 25. Whether alcohol use or prescription or non‐prescription drug abuse has had harmful
effects on respondents or a family member over the past two years ............................... 18
Preventive Health ....................................................................................................................................... 19
Table 1. Whether or not respondents have had preventive screenings in the past year, by type of screening ................................................................................................................ 19 Table 2. Of respondents who have not had preventive screenings in the past year, reasons why they have not, by type of screening ................................................................................... 19 Figure 26. Whether respondents have any of the following chronic diseases ................................... 20 Figure 27. Length of time since respondents last visited a doctor or health care provider for a
routine physical exam and length of time since they last visited a dentist or dental clinic for any reason ..................................................................................................................... 21
Figure 28. Where respondents get most of their health information ................................................ 21 Figure 29. Best way for respondents to access technology for health information ........................... 22
Demographic Information .......................................................................................................................... 22
Figure 30. Age of respondents ............................................................................................................ 22 Figure 31. Highest level of education of respondents......................................................................... 23 Figure 32. Gender of respondents....................................................................................................... 23 Figure 33. Race and ethnicity of respondents ..................................................................................... 24 Figure 34. Annual household income of respondents ........................................................................ 24 Figure 35. Employment status of respondents ................................................................................... 25 Figure 36. Length of time respondents have lived in their community .............................................. 25 Figure 37. Whether respondents own or rent their home ................................................................. 26 Figure 38. Whether respondents have health insurance (private, public, or governmental) or oral health or dental care insurance coverage ................................................................... 26 Figure 39. Whether respondents have one person who they think of as their personal doctor or
health care provider ........................................................................................................... 27 Figure 40. Facilities that respondents go to most often when sick and take their children when they are sick ........................................................................................................................ 27 Figure 41. Number of children younger than 18 and number of adults age 65 or older living in
respondents’ household ..................................................................................................... 28 Figure 42. Whether all children in home are current on their immunizations and all children age 6
months or older get a flu shot or flu mist each year .......................................................... 28 Table 3. Location of respondents based on zip code ....................................................................... 29 Table 4. Additional comments from respondents ........................................................................... 30
APPENDICES ................................................................................................................................................ 34 Introductory and reminder postcards .................................................................................................. 34 Survey instrument ................................................................................................................................ 35

2015 Greater Bemidji Community Health Needs Assessment of Residents page 4
The purpose of this generalizable survey of residents in the greater Bemidji area (i.e., Beltrami and Clearwater counties in Minnesota) was to learn about the perceptions of area residents regarding community health, their personal health, preventive health, and the prevalence of disease. Study Design and Methodology A generalizable survey was conducted of residents in Beltrami and Clearwater counties in Minnesota. The survey instrument was developed in partnership with members of the Greater Bemidji Community Health Needs Assessment collaborative and the Center for Social Research (CSR) at North Dakota State University. Staff at the CSR, along with members of the collaborative, created the cover letter. Elements of informed consent were included in the letter ensuring that the NDSU Institutional Review Board requirements were met and the protection of human subjects maintained. The survey instrument was designed as a scannable 8‐page mail survey containing 54 questions. The questions focused on general community concerns, community health and wellness concerns, personal health, preventive health, and demographic characteristics. The sample, obtained from a national vendor, was a stratified random sample to ensure that appropriate proportions from each of the two counties were included. A total of 1,500 records with names, addresses, and a few demographic indicators were included in the sample. Residents listed in the sample were first mailed an introductory postcard briefly explaining the project and notifying them that a survey packet would be arriving in their mail. Surveys packets, which contained the cover letter, scannable paper survey, and a pre‐paid return envelope were mailed three days after the introductory postcards; 5 percent of the packets were returned as undeliverable. A reminder postcard containing a link to an online version of the survey was mailed to non‐responders approximately 10 days after the initial survey was mailed. A total of 405 paper surveys were returned for scanning and an additional five surveys were completed online for a total of 410; the response rate was 27 percent. Upon further analysis, it was apparent that elderly and male respondents were overrepresented in the scanned results. Therefore, post‐stratification weights were used to ensure proper representation of the population with respect to age and gender. Respondents who did not enter a gender and age response were eliminated from the analyses. A total of 391 surveys were analyzed providing a generalizable sample with a confidence level of 95 percent and an error rate of plus or minus 5 percentage points. Limitations of the Study The findings in this study provide an overall snapshot of behaviors, attitudes, and perceptions of residents living in Beltrami and Clearwater counties. However, when comparing certain demographic characteristics (i.e., age, income, minority status) with the current population estimates from the U.S.
INTRODUCTION

2015 Greater Bemidji Community Health Needs Assessment of Residents page 5
Census Bureau1, it was evident that older, white, more highly educated, and higher income earners were overrepresented. Overrepresentation of this nature is typical in health needs assessments. Literature reviews indicate that there are nonresponse rate issues among younger respondents2. In particular, response rates to health care and community health needs assessment surveys have often been found to be higher for older respondents3. Studies have also shown lower response rates for socially disadvantaged groups4 (i.e., socially, culturally, or financially). In order to supplement the findings of this study, particularly for the subpopulations that are underrepresented, one might consider utilizing other data resources, such as local public health data, the Minnesota Center for Health Statistics5, and Minnesota Compass6. Given the nature of this study, it may be necessary to reach out to community partnerships and implement a variety of recruitment techniques in order to gather information from underrepresented groups in future studies. However, one should be mindful of increased time commitments and financial resources that may be necessary when gathering data from hard‐to‐reach populations.
1 U.S. Census Bureau, Population Division, Annual Estimates of the Resident Population by Sex, Race, and Hispanic Origin for the United States, States, and Counties: April 1, 2010 to July 1, 2013. Released June 2014. Available from http://www.census.gov/popest/. 2 Michael J. Stern, Ipek Bilgen, and Don Al Dillman. Field Methods 2014, Vol. 26(3) 284‐301. The State of Survey Methodology: Challenges, Dilemmas, and New Frontiers in the Era of the Tailored Design. 3 See the following examples: http://www.mathematica‐mpr.com/~/media/publications/PDFs/internetmailsurvey.pdf; http://www.allied‐services.org/wp‐content/uploads/2013/06/CHNA‐lackawanna‐2013.pdf; http://www.hcno.org/pdf/counties/Cuyahoga%20County%20Health%20Assessment%20FINAL.pdf 4 See the following literature review: http://www.ncbi.nlm.nih.gov/pmc/articles/PMC3974746/#__ffn_sectitle 5 See Minnesota Center for Health Statistics site: http://www.health.state.mn.us/divs/chs/ 6 See Minnesota Compass site: http://www.health.state.mn.us/divs/chs/
2015 Greater Bemidji Community Health Needs Assessment of Residents page 6
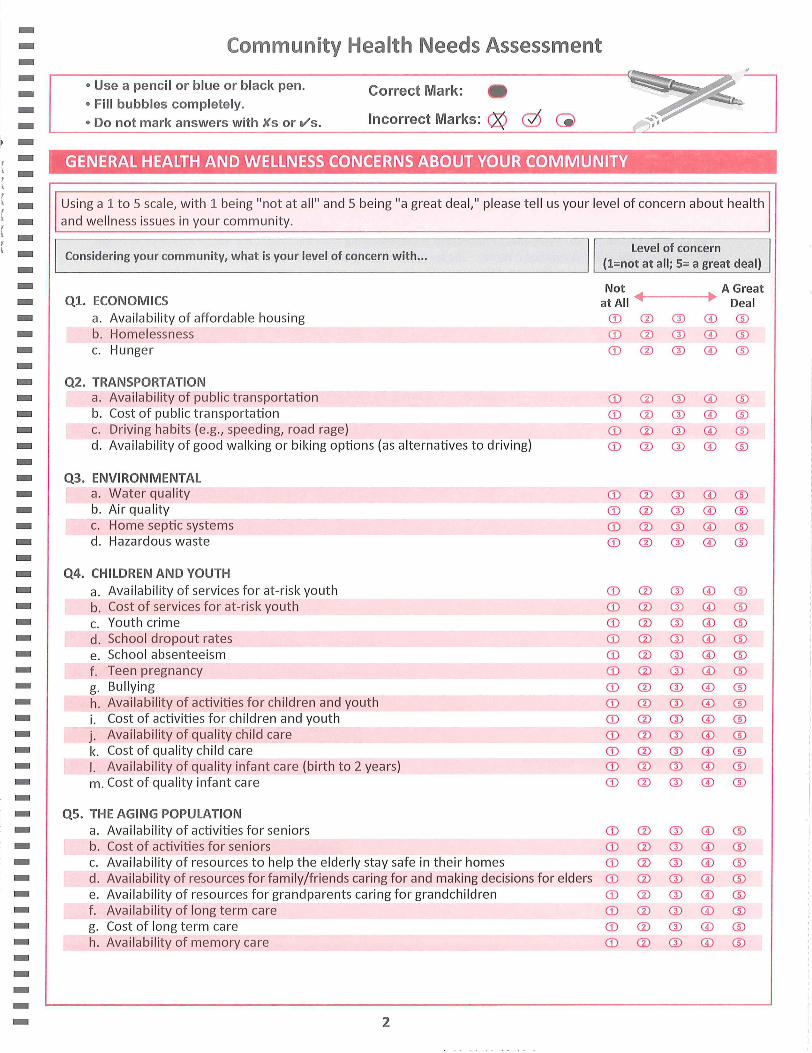
General Health and Wellness Concerns about the Community Using a 1 to 5 scale, with 1 being “not at all” and 5 being “a great deal,” respondents were asked to rate their level of concern with various statements regarding ECONOMICS, TRANSPORTATION, the ENVIRONMENT, CHILDREN AND YOUTH, the AGING POPULATION, SAFETY, HEALTH CARE, PHYSICAL AND MENTAL HEALTH, and SUBSTANCE USE AND ABUSE. Figure 1. Level of concern with statements about the community regarding ECONOMICS
Figure 2. Level of concern with statements about the community regarding TRANSPORTATION
3.31
3.35
3.41
1 2 3 4 5
Availability of affordable housing (N=384)
Homelessness (N=385)
Hunger (N=383)
Mean(1=Not at All; 5=A Great Deal)
2.60
2.71
2.84
3.12
1 2 3 4 5
Cost of public transportation (N=378)
Availability of good walking or biking options (asalternatives to driving) (N=379)
Driving habits (e.g., speeding, road rage) (N=374)
Availability of public transportation (N=379)
Mean(1=Not at All; 5=A Great Deal)
SURVEY RESULTS

2015 Greater Bemidji Community Health Needs Assessment of Residents page 7
Figure 3. Level of concern with statements about the community regarding the ENVIRONMENT
Figure 4. Level of concern with statements about the community regarding CHILDREN AND YOUTH
2.84
2.99
3.06
3.15
1 2 3 4 5
Home septic systems (N=378)
Air quality (N=378)
Hazardous waste (N=377)
Water quality (N=378)
Mean(1=Not at All; 5=A Great Deal)
3.18
3.35
3.37
3.44
3.48
3.49
3.52
3.52
3.53
3.55
3.58
3.62
3.68
1 2 3 4 5
School absenteeism (N=369)
Cost of services for at‐risk youth (N=372)
School dropout rates (N=367)
Availability of services for at‐risk youth (N=376)
Cost of activities for children and youth (N=370)
Teen pregnancy (N=370)
Cost of quality infant care (N=365)
Availability of quality child care (N=369)
Availability of quality infant care (birth to 2 years) (N=363)
Availability of activities for children and youth (N=370)
Cost of quality child care (N=369)
Bullying (N=372)
Youth crime (N=371)
Mean(1=Not at All; 5=A Great Deal)

2015 Greater Bemidji Community Health Needs Assessment of Residents page 8
Figure 5. Level of concern with statements about the community regarding the AGING POPULATION
Figure 6. Level of concern with statements about the community regarding SAFETY
3.08
3.21
3.47
3.51
3.51
3.52
3.52
4.10
1 2 3 4 5
Cost of activities for seniors (N=378)
Availability of activities for seniors (N=384)
Availability of resources for grandparents caring forgrandchildren (N=381)
Availability of resources to help the elderly stay safe in theirhomes (N=384)
Availability of memory care (N=379)
Availability of resources for family/friends caring for andmaking decisions for elders (N=381)
Availability of long term care (N=384)
Cost of long term care (N=380)
Mean(1=Not at All; 5=A Great Deal)
3.20
3.52
3.73
3.95
3.96
4.04
4.04
4.07
1 2 3 4 5
Sex trafficking (N=371)
Elder abuse (N=376)
Presence of gang activity (N=380)
Domestic violence (N=382)
Presence of drug dealers in the community (N=384)
Presence of street drugs, prescription drugs, and alcohol inthe community (N=381)
Crime (N=383)
Child abuse and neglect (N=382)
Mean(1=Not at All; 5=A Great Deal)

2015 Greater Bemidji Community Health Needs Assessment of Residents page 9
Figure 7. Level of concern with statements about the community regarding HEALTH CARE
1.89
2.31
2.41
2.65
2.79
2.83
2.86
2.86
2.99
3.04
3.13
3.14
3.20
3.24
3.33
3.33
3.52
3.61
3.64
3.71
3.88
3.89
1 2 3 4 5
Timely access to bilingual providers and/or translators(N=376)
Timely access to exercise specialists or personal trainers(N=372)
Timely access to registered dietitians (N=372)
Timely access to transportation (N=375)
Timely access to vision care providers (N=375)
Timely access to prevention programs and services (N=376)
Timely access to dental care providers (N=381)
Distance to health care services (N=380)
Timely access to substance abuse providers (N=372)
Availability of transportation (N=373)
Timely access to mental health providers (N=374)
Coordination of care between providers and services(N=370)
Availability of non‐traditional hours (e.g., evenings,weekends) (N=377)
Providers not taking new patients (N=379)
Timely access to physician specialists (N=375)
Timely access to doctors, physician assistants, or nursepractitioners (N=382)
Cost of affordable vision insurance (N=373)
Use of emergency room services for primary health care(N=379)
Cost of affordable dental insurance coverage (N=378)
Access to affordable prescription drugs (N=384)
Access to affordable health insurance (N=382)
Access to affordable health care (N=384)
Mean(1=Not at All; 5=A Great Deal)
2015 Greater Bemidji Community Health Needs Assessment of Residents page 10
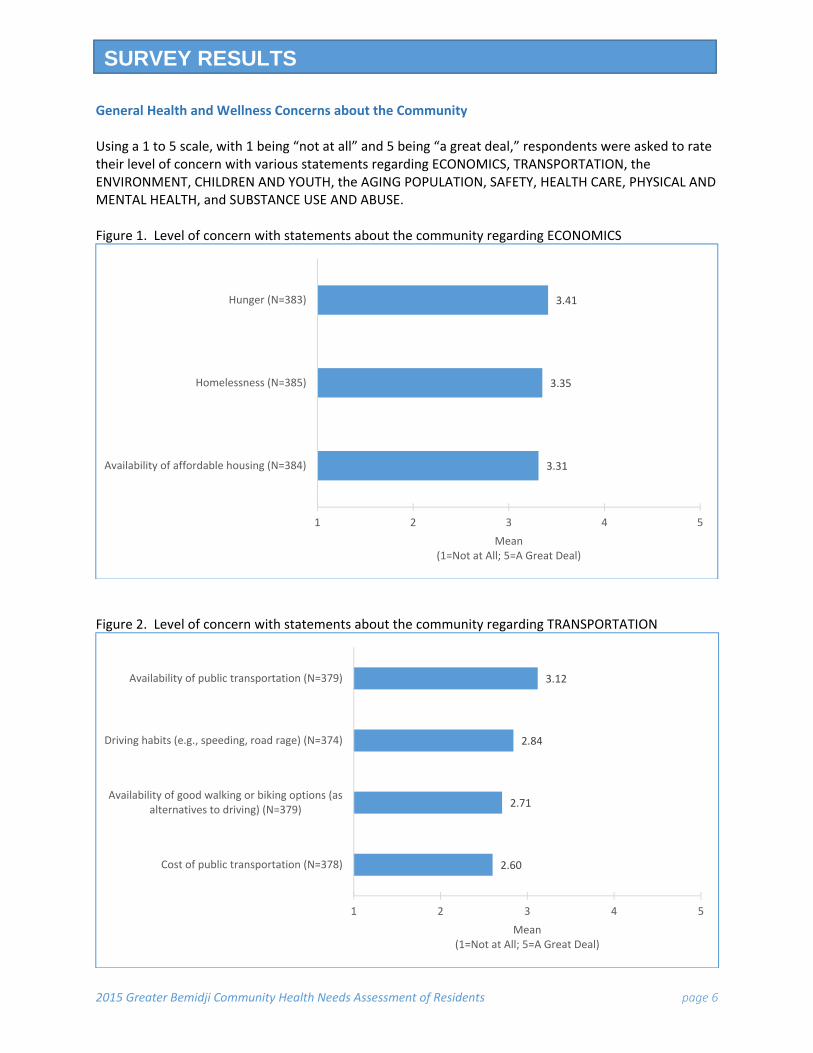
Figure 8. Level of concern with statements about the community regarding PHYSICAL AND MENTAL HEALTH
Figure 9. Level of concern with statements about the community regarding SUBSTANCE USE AND ABUSE
2.88
3.14
3.20
3.43
3.46
3.51
3.51
3.71
3.71
3.75
3.75
3.78
1 2 3 4 5
Sexually transmitted diseases (e.g., AIDS, HIV, chlamydia)(N=376)
Other psychiatric diagnosis (N=369)
Infectious diseases such as the flu (N=381)
Dementia and Alzheimer's disease (N=380)
Stress (N=381)
Suicide (N=380)
Depression (N=381)
Poor nutrition and eating habits (N=373)
Chronic disease (e.g., diabetes, heart disease, multiplesclerosis) (N=382)
Obesity (N=382)
Inactivity and lack of exercise (N=383)
Cancer (N=382)
Mean(1=Not at All; 5=A Great Deal)
3.03
3.44
3.59
3.64
3.78
3.90
1 2 3 4 5
Exposure to second‐hand smoke (N=380)
Smoking and tobacco use (N=380)
Underage drinking (N=383)
Alcohol use and abuse (N=383)
Drug use and abuse (N=382)
Underage drug use and abuse (N=382)
Mean(1=Not at All; 5=A Great Deal)

2015 Greater Bemidji Community Health Needs Assessment of Residents page 11
General Health Figure 10. Respondents’ rating of their health in general
N=379 Figure 11. Respondents’ weight status based on the Body Mass Index (BMI)* scale
N=370 *For information about the BMI, visit the Centers for Disease Control and Prevention, About BMI for Adults, http://www.cdc.gov/healthyweight/assessing/bmi/adult_bmi/.
0.0
2.2
13.7
30.2
43.2
10.7
0 10 20 30 40 50
Don't know
Poor
Fair
Good
Very Good
Excellent
Percent
29.6
41.0
27.3
2.1
0 10 20 30 40 50
Obese (BMI of 30.0 or greater)
Overweight (BMI from 25.0 to 29.9)
Normal weight (BMI from 18.5 to 24.9)
Underweight (BMI less than 18.5)
Percent

2015 Greater Bemidji Community Health Needs Assessment of Residents page 12
Figure 12. Number of servings of vegetables, fruit, and fruit juice that respondents had yesterday
*Percentages may not total 100.0 due to rounding. Figure 13. Number of days in an average week respondents engage in MODERATE and VIGOROUS activity
*Percentages may not total 100.0 due to rounding.
0.3
0.5
3.2
11.4
29.2
55.4
2.5
6.3
11.7
28.2
29.1
22.2
3.9
6.7
20.3
39.4
22.9
7.0
0 20 40 60 80 100
5 or more
4
3
2
1
None
Percent*
Number of servings
Vegetables (N=390) Fruit (N=389) Fruit juice (N=390)
7.9
14.8
40.6
36.6
20.7
28.6
38.9
11.8
0 10 20 30 40 50
5 or more days
3 to 4 days
1 to 2 days
None
Percent*
MODERATE activity (N=382) VIGOROUS activity (N=384)

2015 Greater Bemidji Community Health Needs Assessment of Residents page 13
Mental Health Figure 14. Percentage of respondents who have been told by a doctor or health professional that they have a mental health issue, by type of mental health issue
N=391 *Percentages do not total 100.0 due to multiple responses. Figure 15. Number of days in the last month that respondents’ mental health was not good
N=350 *Percentages do not total 100.0 due to rounding
5.0
5.0
17.1
21.6
0 10 20 30 40 50
Other mental health problems
Panic attacks
Depression
Anxiety/Stress
Percent*
Men
tal health issue
0.6
5.2
9.1
34.6
50.6
0 20 40 60 80 100
22 to 30
15 to 21
8 to 14
1 to 7
None
Percent*
Number of days

2015 Greater Bemidji Community Health Needs Assessment of Residents page 14
Figure 16. How often, over the past two weeks, respondents have been bothered by mental health issues
*Percentages may not total 100.0 due to rounding. Tobacco Use Figure 17. Whether respondents have smoked at least 100 cigarettes in their entire life
N=389
0.2
3.6
17.2
79.1
0.2
2.5
19.8
77.5
0 20 40 60 80 100
Nearly every day
More than half the days
Several days
Not at all
Percent*
Little interest or pleasure in doing things (N=382) Feeling down, depressed or hopeless (N=378)
Yes, 45.6%
No, 54.4%
2015 Greater Bemidji Community Health Needs Assessment of Residents page 15
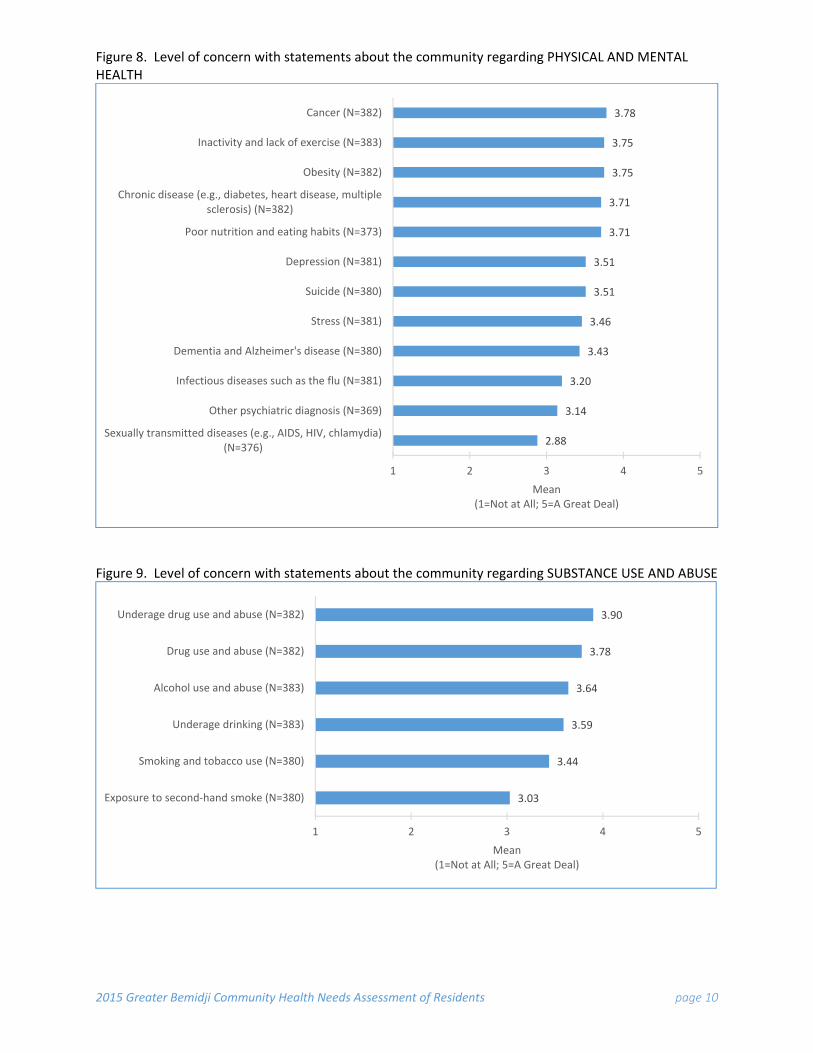
Figure 18. How often respondents currently smoke cigarettes and use chewing tobacco or snuff
Figure 19. Location respondents would first go if they wanted help to quit using tobacco
N=350 *Percentages do not total 100.0 due to rounding. **Other responses include “Quit cold turkey (5)” and “meditation and prayer”.
95.2
1.7
3.1
86.0
2.4
11.6
0 20 40 60 80 100
Not at all
Some days
Every day
Percent
Smoke cigarettes (N=385) Use chewing tobacco or snuff (N=380)
2.5
3.6
69.3
9.1
0.1
0.1
2.9
9.9
2.4
0 20 40 60 80 100
Other**
I don't want to quit
Not applicable
Don't know
Health Department
Private counselor/therapist
Pharmacy
Doctor
Quitline
Percent*

2015 Greater Bemidji Community Health Needs Assessment of Residents page 16
Alcohol Use and Prescription Drug/Non‐prescription Drug Abuse Figure 20. Number of days during the past month that respondents had at least one drink of any alcoholic beverage
N=383 *Percentages do not total 100.0 due to rounding. Figure 21. During the past month on days that respondents drank, average number of drinks per day respondents consumed
N=267
9.8
8.2
14.9
38.0
29.0
0 10 20 30 40 50
22 to 30
15 to 21
8 to 14
1 to 7
None
Percent*
Number of days
7.7
14.3
15.1
33.3
29.6
0 10 20 30 40 50
5 or more
4
3
2
1
Percent
Number of drinks
2015 Greater Bemidji Community Health Needs Assessment of Residents page 17
Figure 22. Number of times during the past month that respondents consumed at least 4 or 5 alcoholic drinks (4 for females, 5 for males) on the same occasion
N=383 Figure 23. Whether respondents have ever had a problem with alcohol use or prescription or non‐prescription drug abuse
65.5
22.2
6.9
1.3
4.1
0 20 40 60 80 100
Never
Once a month
Once a week
2 to 3 times a week
Almost every day
Percent
99.4
87.6
0.6
12.4
0 20 40 60 80 100
Prescription or non‐prescription drug abuse (N=381)
Alcohol use (N=383)
Percent
Yes No

2015 Greater Bemidji Community Health Needs Assessment of Residents page 18
Figure 24. Of respondents who ever had a problem with alcohol use or prescription or non‐prescription drug abuse, whether respondents got the help they needed
Figure 25. Whether alcohol use or prescription or non‐prescription drug abuse has had harmful effects on respondents or a family member over the past two years
0.0
56.3
25.8
8.0
74.2
35.7
0 20 40 60 80 100
Prescription or non‐prescription drug abuse (N=2)
Alcohol use (N=47)
Percent
Yes No Didn't need help
93.0
78.8
7.0
21.2
0 20 40 60 80 100
Prescription or non‐prescription drug abuse had harmfuleffects on respondent or family member (N=384)
Alcohol use had harmful effects on respondent or familymember (N=384)
Percent
Yes No

2015 Greater Bemidji Community Health Needs Assessment of Residents page 19
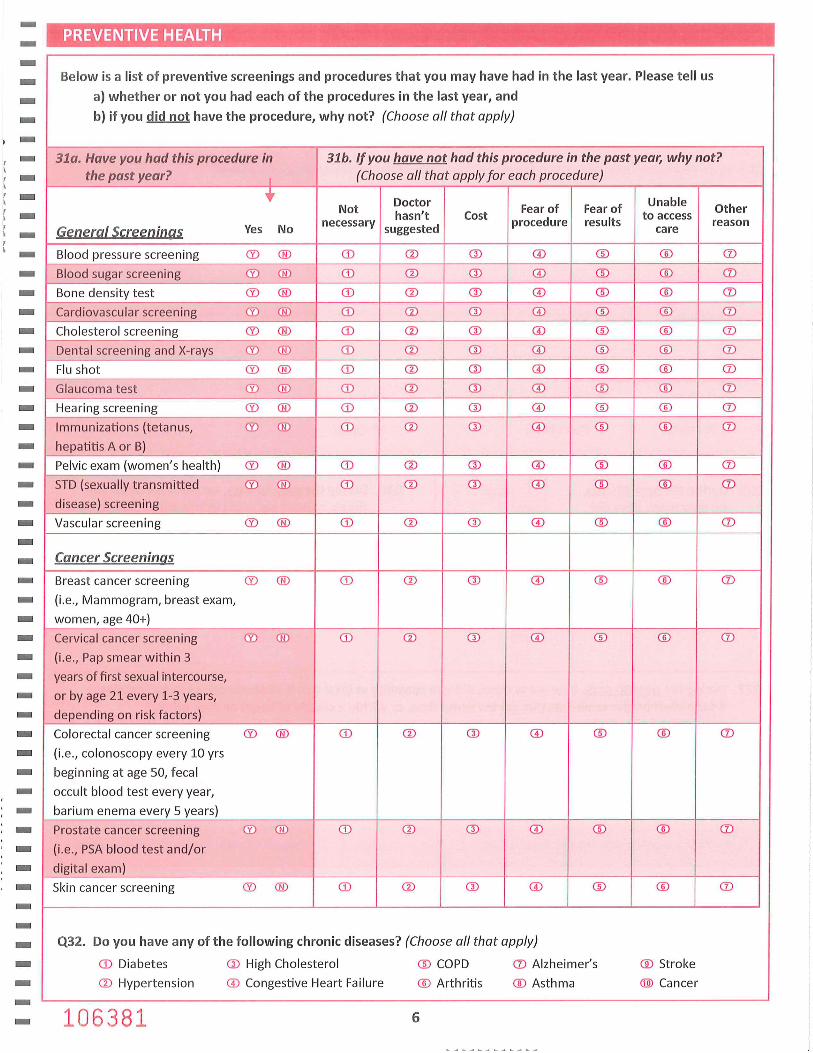
Preventive Health
Table 1. Whether or not respondents have had preventive screenings in the past year, by type of screening
Type of screening
Percent of respondents
Yes No Total
GENERAL SCREENINGS
Blood pressure screening (N=384) 83.0 17.0 100.0
Blood sugar screening (N=381) 64.7 35.3 100.0
Bone density test (N=374) 9.1 90.9 100.0
Cardiovascular screening (N=373) 31.5 68.5 100.0
Cholesterol screening (N=382) 66.3 33.7 100.0
Dental screening and X‐rays (N=382) 78.4 21.6 100.0
Flu shot (N=383) 57.6 42.4 100.0
Glaucoma test (N=376) 41.6 58.4 100.0
Hearing screening (N=378) 22.0 78.0 100.0
Immunizations (N=374) 17.9 82.1 100.0
Pelvic exam (N= 191 Females) 62.3 37.7 100.0
STD (N=375) 2.4 97.6 100.0
Vascular screening (N=370) 9.2 90.8 100.0
CANCER SCREENINGS
Breast cancer screening (N=196 Females) 69.8 30.2 100.0
Cervical cancer screening (N=191 Females) 55.3 44.7 100.0
Colorectal cancer screening (N=374) 35.6 64.4 100.0
Prostate cancer screening (N= 179 Males) 46.3 53.7 100.0
Skin cancer screening (N=369) 19.2 80.8 100.0
Table 2. Of respondents who have not had preventive screenings in the past year, reasons why they have not, by type of screening
Type of screening
Percent of respondents*
Not necessary
Doctor hasn’t
suggested Cost Fear of
procedure Fear of results
Unable to access care
Other reason
GENERAL SCREENINGS
Blood pressure screening (N=65) 47.1 6.6 16.0 0.0 0.0 0.0 15.1
Blood sugar screening (N=134) 49.8 27.3 7.8 0.0 0.0 0.0 7.6
Bone density test (N=340) 50.2 34.6 5.3 0.0 0.0 0.0 5.3
Cardiovascular screening (N=255) 45.2 38.0 6.9 0.0 0.0 0.0 5.9
Cholesterol screening (N=129) 48.2 22.8 8.4 0.0 0.0 0.0 12.3
Dental screening and X‐rays (N=83) 35.5 3.0 26.9 0.6 3.9 2.9 10.0
Flu shot (N=162) 53.4 1.6 6.9 2.8 0.4 0.0 26.9
Glaucoma test (N=220) 59.3 21.4 2.8 0.0 0.0 0.1 8.4
Hearing screening (N=295) 55.3 19.9 5.9 0.0 0.4 1.8 7.7
Immunizations (N=307) 73.5 13.4 3.5 0.0 0.0 0.0 4.6
Pelvic exam (N=72 Females) 43.4 27.1 0.6 0.0 0.0 0.0 11.8
STD (N=366) 81.0 7.6 1.5 0.0 0.0 0.0 2.3

2015 Greater Bemidji Community Health Needs Assessment of Residents page 20
Type of screening
Percent of respondents*
Not necessary
Doctor hasn’t
suggested Cost Fear of
procedure Fear of results
Unable to access care
Other reason
Vascular screening (N=336) 55.2 28.6 3.4 0.1 0.0 0.0 5.7
CANCER SCREENINGS
Breast cancer screening (N=59 Females) 41.4 21.8 2.7 0.0 1.3 0.7 17.0
Cervical cancer screening (N=85 Females) 48.9 23.0 1.0 0.0 0.0 0.0 14.6
Colorectal cancer screening (N=241) 59.2 17.2 7.5 0.7 0.0 2.2 6.5
Prostate cancer screening (N=96 Males) 48.4 7.6 10.8 1.0 0.0 5.4 19.1
Skin cancer screening (N=298) 46.2 32.5 3.9 0.0 0.0 1.7 7.1
*Percentages do not total 100.0 due to multiple responses. Figure 26. Whether respondents have any of the following chronic diseases
N=391 *Percentages do not total 100.0 due to multiple responses.
0.1
1.2
1.6
2.7
3.0
6.0
6.6
15.0
17.5
24.5
0 10 20 30 40 50
Alzheimer's
Stroke
COPD
Cancer
Congestive Heart Failure
Diabetes
Asthma
Arthritis
Hypertension
High cholesterol
Percent*

2015 Greater Bemidji Community Health Needs Assessment of Residents page 21
Figure 27. Length of time since respondents last visited a doctor or health care provider for a routine physical exam and length of time since they last visited a dentist or dental clinic for any reason
*Percentages do not total 100.0 due to rounding. Figure 28. Where respondents get most of their health information
N=391 *Percentages do not total 100.0 due to multiple responses. **Other response is “I don’t.”
0.1
1.9
3.7
9.7
12.9
71.8
2.7
1.0
7.8
4.1
14.7
69.6
0 20 40 60 80 100
Never
Don't know
6 or more years
3 to 5 years
1 to 2 years
Within the past year
Percent*
Doctor or health care provider (N=390) Dentist or dental clinic (N=386)
1.3
4.3
10.4
11.3
13.8
23.5
24.1
35.5
73.4
0 20 40 60 80 100
Other**
Health Helpline (telephone)
Alternative health specialist
Television/Radio
Government websites (i.e., local public health, CDC)
Magazine, newspapers, or books
Family or friends
Non‐government websites (i.e., WebMD)
Medical professional
Percent*

2015 Greater Bemidji Community Health Needs Assessment of Residents page 22
Figure 29. Best way for respondents to access technology for health information
N=391 *Percentages do not total 100.0 due to multiple responses. **“Other” responses do not pertain to the question. Respondents listed “books/magazines”, “medical professionals”, “friends”, and “television”. Demographic Information Figure 30. Age of respondents
N=391 *Percentages do not total 100.0 due to rounding.
6.3
2.7
24.5
75.0
0 20 40 60 80 100
Other**
Public computer (e.g., library, community center)
Smart Phone
Personal computer or tablet
Percent*
19.8
17.0
63.3
0 20 40 60 80 100
Retirees (65 years or older)
Pre‐retirees (55 to 64 years of age)
Prime workforce (18 to 54 years of age)
Percent*

2015 Greater Bemidji Community Health Needs Assessment of Residents page 23
Figure 31. Highest level of education of respondents
N=388 Figure 32. Gender of respondents
N=391 Note: Respondents who entered “prefer to not answer” were excluded from the analysis.
0.4
19.8
25.2
13.5
18.4
21.5
1.2
0 10 20 30 40 50
Prefer to not answer
Graduate or professional degree
Bachelor's degree
Associate's degree
Some college, no degree
High school diploma or GED
Some high school
Percent
Male49.6%
Female50.4%

2015 Greater Bemidji Community Health Needs Assessment of Residents page 24
Figure 33. Race and ethnicity of respondents
N=387 *Percentages do not total 100.0 due to rounding. Figure 34. Annual household income of respondents
N=379 *Percentages do not total 100.0 due to rounding.
0.9
0.0
0.0
0.1
6.2
92.7
0 20 40 60 80 100
Prefer to not answer
Hispanic
Black or African American
Asian or Pacific Islander
Native American or Alaska Native
White
Percent*
10.4
9.7
29.9
24.7
14.5
10.7
0 10 20 30 40 50
Prefer to not answer
$120,000 or more
$70,000 to $119,999
$40,000 to $69,999
$20,000 to $39,999
Less than $20,000
Percent*

2015 Greater Bemidji Community Health Needs Assessment of Residents page 25
Figure 35. Employment status of respondents
N=379 *Percentages do not total 100.0 due to rounding. Figure 36. Length of time respondents have lived in their community
N=391
2.1
0.8
2.1
0.0
20.4
5.1
12.6
56.8
0 20 40 60 80 100
Out of work ‐ 1 year or more
Out of work ‐ less than 1 year
Unable to work
A student
Retired
Homemaker
Self‐employed
Employed for wages
Percent*
95.9
3.6
0.5
0 20 40 60 80 100
More than 5 years
2 to 5 years
Less than 2 years
Percent
2015 Greater Bemidji Community Health Needs Assessment of Residents page 26
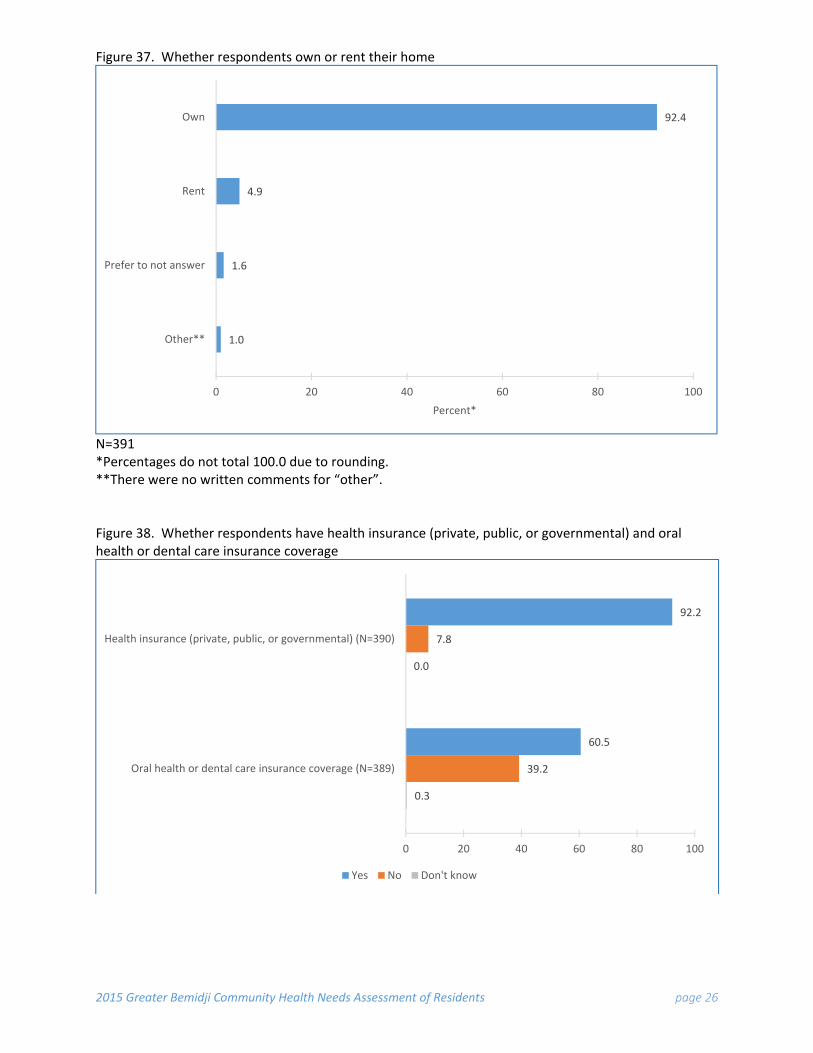
Figure 37. Whether respondents own or rent their home
N=391 *Percentages do not total 100.0 due to rounding. **There were no written comments for “other”. Figure 38. Whether respondents have health insurance (private, public, or governmental) and oral health or dental care insurance coverage
1.0
1.6
4.9
92.4
0 20 40 60 80 100
Other**
Prefer to not answer
Rent
Own
Percent*
0.3
0.0
39.2
7.8
60.5
92.2
0 20 40 60 80 100
Oral health or dental care insurance coverage (N=389)
Health insurance (private, public, or governmental) (N=390)
Yes No Don't know

2015 Greater Bemidji Community Health Needs Assessment of Residents page 27
Figure 39. Whether respondents have one person who they think of as their personal doctor or health care provider
N=390 Figure 40. Facilities that respondents go to most often when sick and take their children when they are sick
*Percentages do not total 100.0 due to rounding. **Of respondents who have children younger than age 18 living in their household.
2.2
21.9
27.2
48.7
0 10 20 30 40 50
Don't know
No
Yes, more than one
Yes, only one
Percent
4.4
0.0
2.2
33.2
60.3
4.6
1.2
1.2
29.7
63.4
0 20 40 60 80 100
Other free or discounted clinic
Hospital emergency room
Public Health Department
Urgent care
Physician's office
Percent*
Where respondents go (N=365) Where respondents take their children (N=148)**

2015 Greater Bemidji Community Health Needs Assessment of Residents page 28
Figure 41. Number of children younger than 18 and number of adults age 65 or older living in respondents’ household
Figure 42. Whether all children in home are current on their immunizations and all children age 6 months or older get a flu shot or flu mist each year*
*Of respondents who have children younger than age 18 living in their household. **Percentages may not total 100.0 due to rounding.
0.0
0.0
23.7
76.3
0.0
9.1
30.1
60.8
0 20 40 60 80 100
6 or more
3 to 5
1 to 2
None
Percent
Children younger than 18 (N=386) Adults 65 or older (N=390)
2.1
0.0
49.2
48.6
0.0
0.0
5.6
94.4
0 20 40 60 80 100
Not applicable
Don't know
No
Yes
Percent**
Children are current on immunizations (N=151)
Children age 6 months or older get flu shot or flu mist each year (N=151)

2015 Greater Bemidji Community Health Needs Assessment of Residents page 29
Table 3. Location of respondents based on zip code
Percent of respondents*
Beltrami County, MN 72.5
Bemidji 55.5
Rural 17.0
Clearwater County, MN 15.6
Bagley 7.7
Rural 7.9
Other counties, MN 6.8
Unknown or missing 5.0
N=391 *Percentages do not total 100.0 due to rounding.

2015 Greater Bemidji Community Health Needs Assessment of Residents page 30
Table 4. Additional comments from respondents
Additional comments
70 year old male; Medicare & Blue X Platinum. Primary care physician being forced by ACA (Obamacare) to limit my access. Death panels next? Let's get the government out of health care?
A recent visit to the walk‐in clinic in Bemidji took 2 hours, 40 minutes to get in and to complete my visit. It was mentioned that there is one full‐time and one part‐time physician to care for patients needing same‐day care. (Sad)
All the tree huggers in the world will not stop a person from drinking to drown their unhappiness. We cannot save all of us from ourselves. I have friends who complain that they cannot afford health insurance and then vote Republican. Man does not always make sense.
Cancer survivor of 18 years. Also a veteran. A veteran's home should be placed in Bemidji, MN.
Cannot afford co‐pays, so do not look for health care unless medical emergency.
Cost of health insurance. Cost of health care procedures, office visits, lab work. I consider our health care very good. Cost is a hardship.
Drug and alcohol abuse are a tremendous concern in this community, especially in the Native American population. Homelessness is secondary to those problems. We should be ashamed at not controlling these problems better than we do!
Everyone should have single‐payer health insurance. Insurance companies are the reason people don’t have health insurance, and the cost is so high. Got to help health students pay for training. [Medical facility] is not a company this is non‐profit. I suspect it is a tough place to work. We love our doctor and nurses. They are great.
Everyone that goes to [medical facility] in Bemidji is very dissatisfied with their service and care. Costs are too expensive for people in the community. Natives need to go to IHS instead of clogging up health care for insurance paying people.
Great need for senior living, both assisted and income based. Better quality rentals and rental agreements. More apartments for single and family, both upscale and income based. New park on other side of town, nothing fancy.
Hard to get an appointment when needed or wanted, most times.
Have not drank since 1976. Have not smoked since 1980. Have not chewed since 1991. Do all my doctoring with VA.
Health care is becoming unaffordable for families along with dental care. My husband is the insurance carrier and it costs our family of six over $1,200 per month for both. Thanks Obama. We don't have a choice anymore!! And [medical facility] all about MONEY vs. Quality Care!
Hope this helps you. I'm 89 years old, don't spend a lot of time with medical personnel. Maybe I'll need it someday. I hope not.
I am 96 years old and live by myself, do all my own work. So, feel I am quite fortunate. I go to the Senior Center several times a week, play cards and have dinner. I haven't been sick for years and never have a flu shot. So hope it keeps up this way.
I am a cancer survivor of nearly 3 years. We have the best oncology department. Also, all of my doctors and the entire medical staff are excellent. No complaints.
I am a community health nurse in my community. I help people to have access to services and follow‐up with their care. So, I do have concerns for the resources we do have and are lacking.
I am currently a cancer and heart condition patient under medical treatment and therapy.
I am not a big fan of [medical facility].
I am particularly concerned about the procedures and availability of mental health care for our youth K‐12. This spans from moderate to severe mental health issues. The diagnosis and treatment seems to have been delegated to our schools, where lack of budget results in lack of counseling, lack of educational specialists, and lack of medical or psychological specialists. If our schools are going to be the mental health centers for our youth, then we must provide funding for the proper tools and staff. Students are now mainstreamed with little or no services. This is an injustice for them as well as disruptive for others.

2015 Greater Bemidji Community Health Needs Assessment of Residents page 31
Additional comments
I feel that [medical facility] does not treat elderly people who are on Medicare as well as they do the general population that is insured with private insurance companies, because of the Medicare reimbursement rates. I have experienced this first hand as it recently happened to me.
I feel when it comes to personal health, which directly relates to diet and exercise, people should be responsible for themselves.
I have two children with severe mental health issues who also need many specialists. Because of that, we have to travel for their medical care often.
I was paying for MN Care, which includes vision and dental. All was dropped when I turned 65. I get help with paying for Med B, but no help with Med D. I was $5 over the limit. I have no insurance for medication or as a supplement to Med B.
I work at [medical facility] so I see more of the issues mentioned in the survey than most in the community. I also realize just how expensive and yet not sufficient the insurance policy is for [medical facility] employees. [Health insurance] is the WORST thing that happened to the Bemidji community.
I work in the community and am one of the lucky ones. Need more counselors in school. Need more mental health services in schools. Need more help for EBD teachers to deal with courts/social services/mental health problems in youth!
Lack of psychiatric medication providers.
Love [medical facility]. I have lived elsewhere and the medical care here is great.
Make everyone pay a co‐pay to reduce the trivial ER visits.
Marijuana use among teens and young adults is more common than cigarette smoking in our community. Youth and young adult suicide rates are alarming and access to fast mental health care is an issue.
Much needs to be done for those with Alzheimer’s to help them actually enjoy life and know that they are an individual.
My biggest problem is migraine headaches. Please find a cure!
My husband passed away 9 months ago from cancer leaving me to care for our 5 year old child. So, yes, I am depressed but work on it every day. Health care costs are extremely expensive and sometimes I'm unsure about Obamacare or if we need a system like Canada's.
My main concerns are for our doctors. They try to keep us well, but the insurance companies are so iffy. They pay for all generics and birth control pills, but won't pay for a lot of the surgeries and other medical help. Frustrated.
My wife and I are very discouraged with our local hospital/clinic. Coordination of care is poor at best. Communication among care givers sometimes seems nonexistent. I hear very little from staff that is affirming. Many complain bitterly. "No one really cares about staff" ‐ mostly about financial, bottom line stuff. [Medical facility] seemed to terminate a lot of good people.
Need more available assisted living homes with more than a small room. When a person has a power chair, lift chair, bed, bed stand, special toilet with bars, television ‐ you need more space. But not necessarily a Rest Home ‐ not for a young person with special needs.
Need more hike‐bike paths, bike parking, and more mental health providers.
NO ONE in our community or this United States should be homeless, hungry, [without clothing], or denied health care. Bullying should be stopped right now as it leads to depression, suicide, school dropouts, and that leads to gangs and violence. What is wrong with this world!!
Our community has given control of our local healthcare system to a corporate healthcare company with a nasty reputation for stripping communities of both values and benefits of having a locally controlled system with strong involvement of community and government. Since the introduction of [medical facility] in our community, quality of care has decreased, staff to patient rations have worsened, and all too many patients are being sent to out of area hospitals, which is money leaving our community. Mental health crisis intervention tells me that there may be increasing lack of mental healthcare and education. The minimal physical activity of our un/under employed local population,

2015 Greater Bemidji Community Health Needs Assessment of Residents page 32
Additional comments
combined with ease of access to the least healthy food possibly contributes to some of our area's biggest health concerns. Does anyone care?
Our [medical facility] is poorly run. Some doctors should not be there. I have had a so called physician the last two years and never even took one piece of clothing off ‐ and was charged for a physical. Not Right. I would not recommend our [medical facility] to anyone.
People in this community readily receive SNAP, cash and other benefits. They need a hand up ‐ not a hand out to make them more responsible for their households.
Putting an oil pipeline through this area will threaten people's health. Options for members of the community to stay active in winter are needed. Religious teachings that go against sensible exercise of reproductive rights by women is a negative influence on their health. "[Corporation]" coming to Bemidji is emblematic of this situation!
[Medical facility] in Bemidji is good except for excessive wait times at emergency room, often 2 to 8 hours. Total disregard for patient comfort, pain, fear, work time lost for patient and family, and other inconveniences occurred for those involved. Disgrace.
[Medical facility] is so lowly perceived in my community (Bemidji) that I and essentially all my friends will not go there unless absolutely necessary, and I am a former RN from ICV. The entire system and ideology stinks!
So many parents work. Establish an area within the hospital, with nurse in charge, that children who are ill can spend the day. Parents then would not have to stay home creating a hardship. This system worked in Orlando, FL.
The biggest barrier to health care is cost. This is especially true for seniors.
The oncology department of Bemidji has the "BEST" staff ever. [The] Mrs. filled this out for the husband as he has trouble with brain cancer.
Too much government in our lives. People need to be more responsible for themselves. All people should be able to take care of themselves. Government needs to take a step back.
Very concerned about the monopoly on health care services in much of our state (MN). It is resulting in less options, mediocre care, and very high costs. Insurers are leaving some areas and those staying are raising rates a lot.
Very concerned by the quality of health care around here. If you have something that needs immediate attention, you have to go to urgent care. Seems all they do is tell you to see your regular doctor, which can take a month.
We are rather pleased with health care provisions in our rural setting; especially with Bemidji's added services to [medical facility].
We could benefit from a gerontologist at the clinic level.
We do not have good access to chemical health (drugs and alcohol) treatment because the Beltrami County assessors delay or reclassify assessments, effectively denying clients the services they need.
When the government recognizes all 58 genders why do you only list two? I am SisGyneTransMale FYI. Also, my race is Lakota‐German‐Irish‐Tasmanian‐American. You also do not list Auto Immune Disorder.
Would have more health care if it wasn't for [insurance company]. They won't pay for follow‐ups and have too high deductibles for someone who is retired. It takes over one month's social security to pay deductible for a year.
You can't get in to see your doctor if you are sick, so you have to drive 100 miles round trip to Urgent Care.
My wife is in her late 70's and I am in my early 80's and both are in decent health for our age.
In section 31a; all health screenings checked "no", and then in 31b checked "other". That is because I have not been to a doctor in over 10 years.
I think I'm doing OK for 85. Can shovel some snow, help groom ski trails, take naps. Have a plow on my 4‐wheeler. Have a beer with the friends.
I live alone and have no children living with me. My answers are based on that concept.

2015 Greater Bemidji Community Health Needs Assessment of Residents page 33
Additional comments
I live 30 miles from the nearest town. Some questions don't apply. We have no youth programs and not much for elders. I used the nearest town for some answers.
I have one child in college.
I consider Bemidji my community, not the small town I live near.
Survey related comments:
"Concern" is ambiguous. Personally not concerned because a) I don't care or b) It's already been addressed. Survey is well put together ‐ excellent job!
I think the questions on the first 2 pages are very unclear, i.e., do you want to know if they are personally a concern for my health or are you looking for my opinion about what I think needs of the community are? I answered based on what I think the community needs are.
Sorry, I thought some of your questions were like asking "is cup half full or half empty". I did not know how to answer some of them.
Survey is a waste of money.
When you ask "level of concern", a certain confusion steps in. If there is/are adequate programs in place, is the 'not concerned' answer correct, i.e., what are you looking for, or do you want the 'very concerned' answer. Hunger is a problem well addressed, hence adequate, so why should I be concerned?!
Why don't you have any VA options?

2015 Greater Bemidji Community Health Needs Assessment of Residents page 34
Dear Resident: Here is an opportunity for you to help improve the health of your community! The Bemidji Health Needs Assessment Partnership is conducting a health assessment of randomly selected households in Beltrami and Clearwater counties in Minnesota. Your household was selected! This process assists community leaders in understanding the health status of the area and identifying priority health issues affecting residents. We are partnering with the North Dakota State University Center for Social Research (CSR) to conduct this assessment. In a few days you will receive a packet from the CSR that contains a letter of explanation, a survey, and a postage‐paid return envelope. Please complete the survey and return it to us as soon as possible. We look forward to your feedback! Thank you for assisting us in this important community health assessment. Sincerely, Dan Olson Kay Mack President Beltrami County Administration Sanford Health Northern Minnesota
Dear Resident: Here is an opportunity for you to help improve the health of your community! The Bemidji Health Needs Assessment Partnership is conducting a health assessment of randomly selected households in Beltrami and Clearwater counties in Minnesota. Several days ago we sent your household a survey packet and asked you to complete the survey and return it to us as soon as possible. There is still time for you to help improve the health of your community! If you have not already done so, please complete the survey and return it to us so that we may include it in our assessment. To complete the survey online, please use the following link: https://www.surveymonkey.com/s/Bemidji‐HNA We look forward to your feedback! Thank you for assisting us in this important community health assessment. Sincerely, Dan Olson Kay Mack President Beltrami County Administration Sanford Health Northern Minnesota
APPENDICES