Bebczuk Div Pol
19
First draft March 2004 Explaining dividend policies in Argentina Ricardo N. Bebczuk (*) Department of Economics Universidad Nacional de La Plata Abstract Dividend policy is central to the performance and valuation of listed companies, but the issue still remains scarcely investigated in emerging countries. The purpose of this paper is to study, for the first time, the determinants of the dividend policy of listed companies in Argentina over the 1996-2002 period. Although the modern theory stresses agency and other informational problems as the principal explanations of the so-called dividend puzzle, we will contend here that for many companies with highly concentrated ownership, a model of a sole owner-manager provides most (but not all) of the needed clues to answer the question as to why comp anies pay d ividends in Argentina. Our main findings are that: (a) Bigger and more profitable firms without good investment opportunities pay more dividends; (b) Companies with more fluid access to debt pay more dividends; (c) Furthermore, riskier and more indebted firms prefer to pay lower dividends, and the same applies to foreign-owned firms; (d) ADR issuers disburse more dividends than other companies; and (e) Firms do not seem to care about maintaining stable payout ratios over time, but there is some inertia in that non-payers tend to stay that way and otherwise. (*) I would like to especially thank Martín Cicowiez for its invaluable and generous help in solving the model in GAMS. The efficient assistantship of Máximo Sangiácomo and the insightful suggestions of Jorge Balat and Walter Cont are also gratefully acknowledged. The usual disclaimer applies. Comments welcome at [email protected] .
-
Upload
stephani-stevi -
Category
Documents
-
view
226 -
download
0
Transcript of Bebczuk Div Pol

7/25/2019 Bebczuk Div Pol
http://slidepdf.com/reader/full/bebczuk-div-pol 1/19
First draft
March 2004
Explaining dividend policies in Argentina
Ricardo N. Bebczuk (*)
Department of Economics
Universidad Nacional de La Plata
Abstract
Dividend policy is central to the performance and valuation of listed companies, but the
issue still remains scarcely investigated in emerging countries. The purpose of this paper is to study, for the first time, the determinants of the dividend policy of listed
companies in Argentina over the 1996-2002 period. Although the modern theory
stresses agency and other informational problems as the principal explanations of the
so-called dividend puzzle, we will contend here that for many companies with highly
concentrated ownership, a model of a sole owner-manager provides most (but not all) of
the needed clues to answer the question as to why companies pay dividends in
Argentina. Our main findings are that: (a) Bigger and more profitable firms without
good investment opportunities pay more dividends; (b) Companies with more fluid
access to debt pay more dividends; (c) Furthermore, riskier and more indebted firms
prefer to pay lower dividends, and the same applies to foreign-owned firms; (d) ADR
issuers disburse more dividends than other companies; and (e) Firms do not seem tocare about maintaining stable payout ratios over time, but there is some inertia in that
non-payers tend to stay that way and otherwise.
(*) I would like to especially thank Martín Cicowiez for its invaluable and generous help in solving the
model in GAMS. The efficient assistantship of Máximo Sangiácomo and the insightful suggestions of
Jorge Balat and Walter Cont are also gratefully acknowledged. The usual disclaimer applies. Commentswelcome at [email protected].

7/25/2019 Bebczuk Div Pol
http://slidepdf.com/reader/full/bebczuk-div-pol 2/19
Introduction
Dividend policy is central to the performance and valuation of listed companies, but the
issue still remains scarcely investigated in emerging countries. The purpose of this
paper is to study, for the first time, the determinants of the dividend policy of listed
companies in Argentina over the 1996-2002 period. Although the modern theory
stresses agency and other informational problems as the principal explanations of the
so-called dividend puzzle, we will contend here that for many companies with highly
concentrated ownership, a model of a sole owner-manager provides most (but not all) of
the needed clues to answer the question as to why companies pay dividends in
Argentina.
The interaction of dividends with debt and investment policies is central to rationalize
dividend payments. Especially, risk management considerations, often disregarded in
corporate finance models, prove to be of crucial relevance. By introducing risk aversion
on the part of the entrepreneur, we show in a simple model that the choice between self-
financing and debt is not only influenced by the relative cost of these sources of funding
–as in the traditional pecking order theory-, but also by the risk faced by the
entrepreneur. While the opportunity cost of internal funds is fixed and certain once such
resources are sunk into the firm’s projects, the repayment of debt principal plus interest
will be high in good states of nature –in which full repayment takes place- and low in
bad, default states, as far as the borrower is protected by contractual limited liability.
We will test this hypothesis.
The paper is structured as follows: In Section1, we succinctly survey the literature on
dividend policy to motivate the theoretical model outlined in Section 2. Afterwards, in
Section 3, we describe the database. We discuss the econometric results in Section 4.
Some conclusions and policy implications close.
1. A brief survey of the dividend literature and its relevance for emerging markets
The reasons why firms pay dividends or not has attracted a great deal of attention for the
last five decades since the seminal paper by Lintner (1956). This and many subsequent
pieces of research convincingly established that firms aim to avoid drastic changes in
dividends over time. However, early dividend theories did not warrant such preference

7/25/2019 Bebczuk Div Pol
http://slidepdf.com/reader/full/bebczuk-div-pol 3/19
for smoothing cash distributions. As a matter of fact, Miller and Modigliani (1961)
advanced the idea that, when financial markets are frictionless, investors are indifferent
between dividends and capital gains as far as they can substitute one for the other to
reach their desired level of cash dividends by selling or buying stock. Usually observed
differences in tax rates between dividends and capital gains rose as the first argument
against this dividend irrelevance proposition. It was at this time that Black (1976)
coined the label “dividend puzzle” to illustrate the astonishing contrast between a
theoretical body claiming either the irrelevance or the disadvantage of paying dividends
and the indisputable fact that firms pay relatively high and stable dividends.
Since the early 1980s, a host of papers offer alternative and appealing approaches to
disentangle this enigma, most of them rooted in information asymmetries between firm
insiders and outsiders and bounded rationality of the latter (see Baker et al. (2003) for
an excellent survey and Bebczuk (2003) for a textbook presentation). One of such recent
hypotheses is that firms pay dividends to credibly signal their quality to the market in
order to mitigate the undervaluation that arises in an adverse selection context. By
paying high and stable dividends, high-quality companies might distinguish themselves
from low-quality competitors for funds (see for example Miller and Rock (1985)),
which may be unable to mimic the first group –unlike poor-performance companies,
profitable firms can replace the diminished retained earnings with the more expensive
external funds. Another strand of literature focuses on the agency problems between
managers and shareholders, making the point that higher dividends partially prevent
managers from committing moral hazard at the expense of shareholders, by reducing the
free cash flow at the disposal of those running the firm (see Jensen (1986)). Finally,
other scholars have put forward behavioral explanations that support the investor
preference for cash dividends, such as the psychological (but not necessarily rational
from a purely financial standpoint) loss derived from the principal reduction of selling
stock or the regret of liquidating stock just before its price rises.
At this point, it is imperative to establish the explanatory power of this theoretical
framework for financially developed as opposed to emerging markets. The model
implicit in the theories just described is one where: (a) Ownership is highly dispersed,
dividend recipients are different from the company’s decision-makers. In this context,
dividend policy is mostly driven by market value considerations, in which dividends are

7/25/2019 Bebczuk Div Pol
http://slidepdf.com/reader/full/bebczuk-div-pol 4/19
a device to mitigate potential conflicts of interest between insiders and outsiders. The
ultimate goal of the dividend policy is to maximize the stock price so as to reduce the
cost of equity in future stock issues; (b) Capital markets are efficient –in that stock
prices fully capture any value-related corporate change-; and (c) Firms do not appear to
face important financial constraints in the present, as they enjoy some freedom to
determine how much to distribute from their net earnings, filling the gap with other
sources of funding, such as external equity or debt.
However, when it comes to analyze dividend policy in Argentina -and most emerging
countries in general-, one must realize that these assumptions lack a great deal of
realism on several grounds, namely: (a) Companies exhibit concentrated ownership. For
instance, the (simple) average free froat in the sample is only ….% as of December
2002. As a result, outside shareholders are not a primary concern for the company’s
officers, and neither it is the principal-agent paradigma, as ownership and management
are not clearly separated in most cases.1 Furthermore, the incentive mechanism that
leads the firm to please outside shareholders in other markets, i.e., the ability to issue
more valuable stock in the near future, does not seem to work in this case in view of the
almost negligible activity of primary equity markets as a whole; (b) Even though the
evidence is mixed (see Fernandez (2002) and Bebczuk (1997)), capital market
efficiency is under suspicion because markets are thin and transparency is questioned by
many analysts. Thus, dividend announcements might not be clearly reflected in stock
prices; and (c) Most importantly, current financial constraints are likely to have an
overwhelming impact on dividend policies. Meeting the cash dividend demand from
outside shareholders may mean that good investment opportunities have to be passed up
in response to the funding shortage. In other words, retained earnings may have no close
(not even more onerous) substitutes at all. We will refer to as “Dispersed Ownership
Model (DOM)” the previous theoretical body as opposed to an alternative
“Concentrated Ownership Model (COM)” that we outline next.
Even though some shares float, firms seem to be governed to a great extent as if outside
shareholders do not count at all. Henceforth, when we go back to the owner-manager
model, many features of the dividend model must be revisited as well. For our purposes,
1 A thorough study is under way to describe this and other corporate governance practices of listed
companies in Argentina.

7/25/2019 Bebczuk Div Pol
http://slidepdf.com/reader/full/bebczuk-div-pol 5/19
dividends are set to maximize the owner’s utility from lifetime dividends. Under this
framework, the entrepreneur’s decision has to do with debt, investment and risk
management aspects.2 Essentially, the entrepreneur faces a trade-off in that high
dividends today forces the firm to raise more expensive debt that may reduce
investment and dividends tomorrow. The model that follows displays some of the
desired features of the dividend policy decision-making.
2. The model
We next set up a model that gives a more formal flavor to the previous discussion, and
in which dividends, debt, and investment are simultaneously determined. The model
does not aim to be a thorough representation of all dividend-related decisions, but it
solely intends to highlight the role of uncertainty and the relationship of dividends and
debt.
A risk-averse entrepreneur-manager maximizes his expected two-period utility from
dividends d . We assume that the utility function is isoelastic, with parameter σ>1 :
(1) Max
−+
−+
−=
−−−
σπ
σπβ
σ
σσσ
111
1
,2
1
,2
1
1 l l
hh
d d d U
In the first period, the entrepreneur has an initial endowment y0=k 0α and must decide
how much to invest, k 1, how much to borrow, b1, and thus how much dividends to pay,
. In the second period, one of two states of nature will be realized:
either a high-productivity state, with y
1101 k bk d −+= α
2=ah k 1α, or a low-productivity one, with y2=al
k 1α, and ah > al ; each state is associated with probabilities πh and πl , respectively. In
state h, dividends equal output less debt repayment, (1+ib )b1, and the opportunity cost
of retained earnings from period 1, [(1+r)(k 1-b1 )] :
(2) d ))(1()1( 1111,2 bk r bik a bhh −+−+−= α
The gross loan interest rate (1+ib ) is determined by perfectly competitive and risk-
neutral lenders, according to the following break-even condition:
2 Gobert (2001) emphasizes the importance of risk management in capital structure decisions.

7/25/2019 Bebczuk Div Pol
http://slidepdf.com/reader/full/bebczuk-div-pol 6/19
(3) ( )1
()1(1
)1
/1
(1
)1 αθππγω k l
acl b
ih
bk bbr ++=++
where r is the required return in frictionless credit markets, and the second term on the
left-hand side is a moral hazard premium increasing in the proportion of the project
financed with debt, (b1/k 1) (see Gertler and Hubbard (1988) and Bebczuk (2002)), with
parameters ω>0 and γ>0. Expected revenues come from the full repayment in the high-
productivity state and the appropriation of the company’s income in the bad state, in
which case the company defaults on its debt. We allow for an imperfect seizure, 0≤θc≤1,
by the creditor in favor of the borrower, who therefore retains 0≤θb≤1, with θc+θb=1.
Here, deviations from the benchmark case, θc=1 andθb=0, can take place in countries
with pro-borrower bankruptcy laws and weak contract enforcement (see La Porta etal.(1997)). In turn, under the bad state, the entrepreneur just loses the retained earnings
sunk in the project and eventually keeps part of the revenue:
(4) d ))(1(][ 111,2 bk r k al bl −+−= αφ
To solve the model we impose the following constraints:
(5) k 1/,0,0 1111 ≤≥≥ k bb
(6)( )( )[ ]
σσπ
σπ
σσσ
−
−+≥
−+
−
−−−
1
1
11
1
11
1
,2
1
,2 bk r d d l
l
h
h
(7) a 0)1( 11 <+− bik bl
α
In (5) we established the non-negativity of the state variables b1 and k 1, and that b1 is
only used to finance investment. Inequality (6) means that the entrepreneur will only
use internal funds if the expected utility from dividends is at least equal to the utilityderived from investing the funds in a risk-free asset with return r . The default condition,
which makes clear that uncertainty affects corporate decisions, in the bad state appears
in equation (7).
The first order conditions with respect to b1 and k 1 are:
k 1:

7/25/2019 Bebczuk Div Pol
http://slidepdf.com/reader/full/bebczuk-div-pol 7/19
[ ] 0)1())(1(][)/(
))(1()()/()1(
)(
111
1
11
111
1
11111110
=+−+−+
−
−+−
−++−+−+
−−
−
−
r bk r k ak b
bk r bb
k ak bbr k ak bk
l bl
h
h
l cl hh
σαγ
σαγ
ασα
φβπ
π
ωγ
π
θπωβπ
b1:
[ ] [ ] { } 0)1())(1(][)1())(1(][
)1()/()/(
))(1()()/()1(
)(
1
1111111
1
1
2
1
1
111
1
111
1
1111
1110
1
=+−−+−++−+−+
+−
+−−
−+−
−++−+−+−
−−−
−−−
−
−
r k abk r k ar bk r k a
r k ak bk b
k a
bk r bb
k ak bbr k ak bk
l bl bl l bl
h
l cl
h
h
l cl
hh
ασασα
αγα
σαγ
ασα
αφφβπφβπ
π
αθπωγα
π
θπωβπ
In short, the model describes the behavior of an entrepreneur deciding simultaneously
his optimal investment, debt, self-financing and dividends. The separation of investment
and financing is ruled out here by introducing the moral hazard premium explained
above. As for the financing choices, self-financing (meaning less dividends) is attractive
in that its opportunity cost is lower than the cost of debt for any positive value of b1. But
for a risk-averse agent facing some positive probability of default like our entrepreneur,
debt is relatively appealing because it acts as an insurance device: while the cost of
internal funds is the same across all possible states of nature, the creditor gets a high
payoff in the good state, but a low one in the bad state, thus contributing to dividend
smoothing.
The presence of nonlinearities prevents us from finding a closed form solution, but we
have solved the problem numerically using GAMS to explore the more relevant
comparative statics exercises referred to the level of first-period dividends, d 1, our
dependent variable.3 In particular, the model yields the following predictions that will
be tested empirically afterwards:
3 I am very grateful to Martín Cicowiez for his invaluable assistance on running the model in GAMS.

7/25/2019 Bebczuk Div Pol
http://slidepdf.com/reader/full/bebczuk-div-pol 8/19
(1) The higher the amount of internal funds available for distribution (y0 ), the
higher d 1. This is simply due to the fact that entrepreneurs prefer more
dividends to less, everything else equal.
(2) The higher the (endogenous) investment k 1 , the lower d 1. An optimal investment
plan suggests that all projects carrying a return higher than the opportunity cost
of dividends must be undertaken;
(3) The higher the risk -as measured by a higher probability of failure πl -, the
higher d 1.4 Due to its insurance properties, debt financing becomes more
valuable for firms with unstable cash flows, by enabling more risk sharing with
creditors instead of forcing the entrepreneur to absorb an expected negative
shock entirely by himself; and
(4) The easier the access to debt, here measured by the wedge between the actual
cost of debt and the required return r –represented by lower values ω and γ-,
the higher d 1.
3. Some exploratory analysis of the data
The study will cover 55 listed companies in Argentina from 1996-2002 using annualdata. The primary source of information is Economatica, a for-profit firm that assembles
a balance sheet database for Latin American countries. Economatica contains 77
Argentine companies, but we exclude all banks -because of the specificity of their line
of business and their heavy regulation- and firms in general without complete annual
information for at least 1995-2002.
We start by showing some summary measures of dividend activity. The first noticeable
fact is that many companies do not distribute dividends at all: the proportion of dividend
payers ranges, out of a total 55 firms, from a minimum of 12 in 2002 (22% of total
firms) to a maximum of 31 in 1997 (56%). Three subperiods can be distinguished from
a visual inspection: (i) In 1995-2000, with rather stable ratios of dividends to earnings,
cash flow and sales, averaging 55.4%, 27.3% and 7.7%, respectively; (ii) A steep
increase in dividend payments in 2001, and (iii) An equally pronounced reduction in
4
To isolate the uncertainty effect, changes in the probability of success are made such under a mean- preserving value of dividends, that is, the expected value of dividends is kept constant by altering the productivity parameter ah.

7/25/2019 Bebczuk Div Pol
http://slidepdf.com/reader/full/bebczuk-div-pol 9/19
2002. The change in 2001 and 2002 is allegedly attributable to the financial crisis
initiated in 2001 that induced firms to first pay high dividends as a means of allowing
shareholders to cover themselves from the expected devaluation and banking system by
buying external assets; then, in the context of a marked contraction in sales and the
balance sheet problems derived from the currency crisis, companies seem to have
adjusted through dividend cuts.
For comparison purposes, Faccio et al. (2001) show that, for 14 European and Asian
countries in 1992-1996, the dividend to earnings, cash flow and sales ratios were 34%,
23.4% and 3.57%, respectively, that is, lower than in our sample. Regarding the
proportion of payers, Fama and French (2002) find that in the U.S. only 23.5% of firms
did so in 1993-1998.5 This striking finding can be partially explained on a tax motive:
dividends in Argentina are tax-exempt unlike director and manager fees.
Dividend measures for dividend paying firms
Year Total # of firms # of dividend Total Dividends Dividends to:
paying firms (in mill.$) Earnings Cash flow Sales
1995 55 15 1,114,034 0.48 0.25 0.08
1996 55 27 1,377,950 0.56 0.27 0.081997 55 31 1,391,101 0.46 0.25 0.071998 55 28 1,644,654 0.62 0.31 0.08
1999 55 30 1,449,132 0.67 0.30 0.07
2000 55 24 1,310,618 0.53 0.26 0.072001 55 23 2,488,017 1.62 0.58 0.15
2002 55 12 303,355 0.06 0.04 0.01
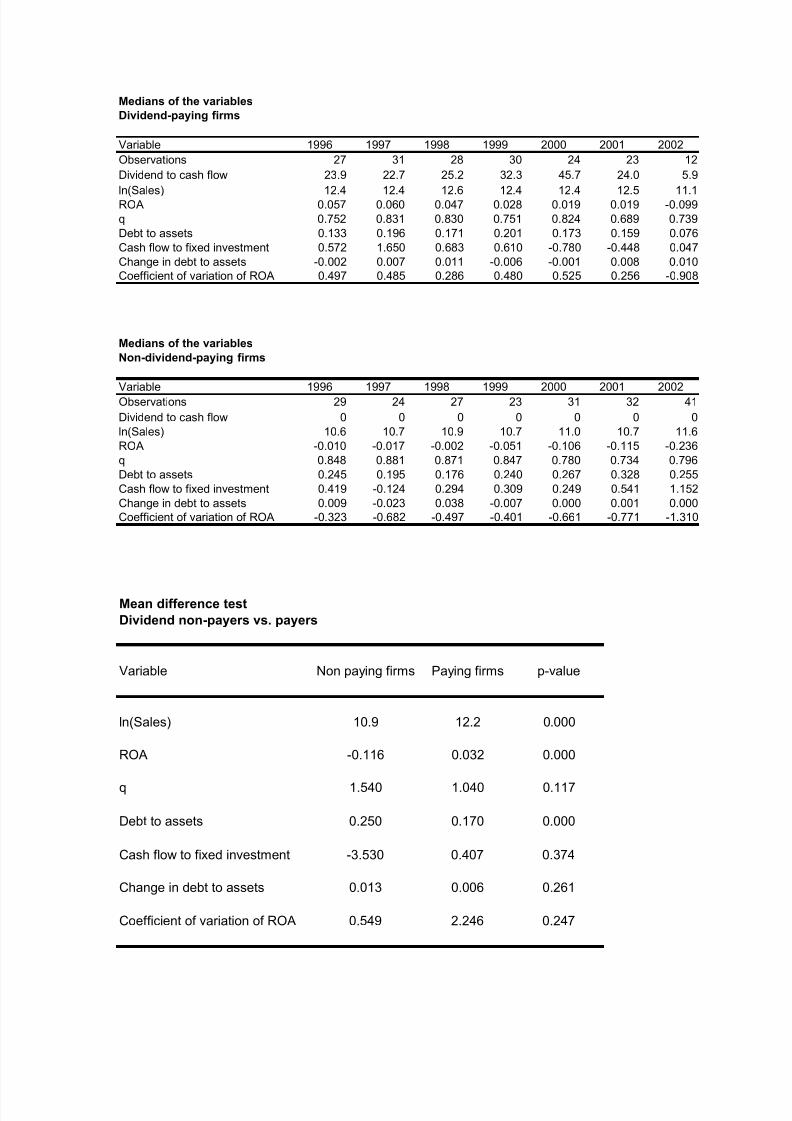
The three next tables present the medians and means of the main explanatory variables,
splitting the sample into dividend payers and non-payers. As the tests on cross-section
means make clear, it is evident that dividend-paying firms are bigger, earn more, and
have less debt.
5 This number looks smaller than in Argentina, but we should bear in mind that many of the firms not
included in the Economatica database most likely do not pay any dividends at all.
7/25/2019 Bebczuk Div Pol
http://slidepdf.com/reader/full/bebczuk-div-pol 10/19
Medians of the variables
Dividend-paying firms
Variable 1996 1997 1998 1999 2000 2001 2002
Observations 27 31 28 30 24 23 12
Dividend to cash flow 23.9 22.7 25.2 32.3 45.7 24.0 5.9
ln(Sales) 12.4 12.4 12.6 12.4 12.4 12.5 11.1ROA 0.057 0.060 0.047 0.028 0.019 0.019 -0.099q 0.752 0.831 0.830 0.751 0.824 0.689 0.739Debt to assets 0.133 0.196 0.171 0.201 0.173 0.159 0.076Cash flow to fixed investment 0.572 1.650 0.683 0.610 -0.780 -0.448 0.047Change in debt to assets -0.002 0.007 0.011 -0.006 -0.001 0.008 0.010Coefficient of variation of ROA 0.497 0.485 0.286 0.480 0.525 0.256 -0.908
Medians of the variables
Non-dividend-paying firms
Variable 1996 1997 1998 1999 2000 2001 2002Observations 29 24 27 23 31 32 41
Dividend to cash flow 0 0 0 0 0 0 0ln(Sales) 10.6 10.7 10.9 10.7 11.0 10.7 11.6ROA -0.010 -0.017 -0.002 -0.051 -0.106 -0.115 -0.236q 0.848 0.881 0.871 0.847 0.780 0.734 0.796Debt to assets 0.245 0.195 0.176 0.240 0.267 0.328 0.255Cash flow to fixed investment 0.419 -0.124 0.294 0.309 0.249 0.541 1.152Change in debt to assets 0.009 -0.023 0.038 -0.007 0.000 0.001 0.000Coefficient of variation of ROA -0.323 -0.682 -0.497 -0.401 -0.661 -0.771 -1.310
Mean difference test
Dividend non-payers vs. payers
Variable Non paying firms Paying firms p-value
ln(Sales) 10.9 12.2 0.000
ROA -0.116 0.032 0.000
q 1.540 1.040 0.117
Debt to assets 0.250 0.170 0.000
Cash flow to fixed investment -3.530 0.407 0.374
Change in debt to assets 0.013 0.006 0.261
Coefficient of variation of ROA 0.549 2.246 0.247

7/25/2019 Bebczuk Div Pol
http://slidepdf.com/reader/full/bebczuk-div-pol 11/19
The correlation matrix appears in the next table, in which it can be seen that the
dividend-to-cash flow ratio is not strongly correlated to neither explanatory variable, as
most coefficient are either not statistically significant or low in absolute value.
Correlation Matrix
D/CF Lagged D/CF Ln(sales) ROA q Debt Cash flow Change debt Coef.var. ROA ADR Foreign
D/CF 1
Lagged D/CF 0.09* 1
Ln(sales) 0.06 0.07 1
ROA 0.17*** 0.0699 0.08* 1
q -0.005 0.019 -0.035 -0.003 1
Debt to assets -0.094* -0.08 0.0329 -0.11** -0.05 1
CF to change in LT assets 0.03 0.006 -0.05 0.01 -0.001 0.05 1
Change in debt to assets 0.01 0.006 0.045 -0.039 -0.033 0.61*** 0.01 1
Coefficient of variation of ROA -0.04 -0.00 -0.015 0.023 0.002 -0.047 0.021 -0.003 1
ADR Issuance (dummy) 0.168*** 0.173*** 0.298*** 0.063 -0.045 -0.025 -0.042 -0.01 -0.027 1
Foreign-owned f irm (dummy) -0.020 -0.019 0.3057*** -0.013 0.122*** 0.055 -0.047 -0.019 -0.034 0.41*** 1
4. Empirical strategy and results
Our preferred dividend measure is the ratio of cash dividends to cash flows, for it best
reflects the choice over distributing or not the money generated each year, as cash flow
is the relevant measure of company’s disposable income. According to the Concentrated
Ownership Model, the explanatory variables should capture: (1) The availability of
resources to distribute once investment funding is secured, which should increase
dividend payments. This will be proxied by the return on assets and the ratio of cashflows to investment in long-term assets; (2) The demand of funds for investment
purposes, with a negative impact on dividends, represented by Tobin’s q; (3) The
business risk, with a positive expected sign, measured through the debt to assets ratio6
and the coefficient of variation (the ratio of quarterly standard deviation to the average
of each year); and (4) The availability of external funding, as proxied by the change in
the debt to assets ratio, which should increase dividends. Besides this set of variables,
6 For a given interest rate, the debt to assets also ratio affects negatively the availability of funds available
for paying dividends.
7/25/2019 Bebczuk Div Pol
http://slidepdf.com/reader/full/bebczuk-div-pol 12/19
we will control for the level of sales (in logs) as a measure of size. Size is a priori
attributable to several of the previous factors, as bigger firms tend to have fewer
investment opportunities, to be more diversified and thus less risky, and to have a more
fluid access to credit.
In addition, we test the effect of some variables to be consistent with the competing
Dispersed Ownership Model, namely: (a) The lagged dividend to cash flow ratio. From
the empirical finding by Lintner (op.cit.) and the more recent signalling models, we
should presume that firms attempt to maintain stable dividends over time, creating a
persitent pattern; and (b) A dummy variable for ADRs (American Depositary Receipts)
issuers. Firms cross-listing in the U.S. may be induced to mimic the dividend policies of
those firms they compete with for funds in foreign markets;7 and (c) A dummy variable
for foreign-owned firms. These firms may follow the dividend policy decided by their
main houses abroad, which are probably influenced by the DOM. Anyway, the fact of
being foreign-owned may also be related to the COM: an often heard argument is that,
due to their reputation and the affiliation to big firms from abroad, these companies are
likely to have less stringent financial constraints and to overcome more easily situations
of financial distress. This, in combination with the desire of recovering the investment
in as short a period as possible in macroeconomic and politically unstable countries,
may induce firms to pay high dividends to foreign shareholders.8
A Tobit estimation will be carried out to establish the determinants of dividend policies
in Argentina.9 The need to use this technique is clear once we note that the dependent
variable is truncated at zero, with many individual observations displaying such value.
In view of the nature of the subject under study, endogeneity does not seem to be a
critical issue here. Dividend payments are decided by the firm right after each fiscal
year t has ended, and balance sheet variables are known. From this timeline structure, it
7 ADR issuance might also be an indicator of lax financial constraints because of the positive signal of
being listed in more regulated foreign markets.8 The mean dividend-cash flow is 48.3% and 12.5% for ADR and non-ADR issuers, respectively, beingthe difference statistically significant at a 1% level. Conversely, the mean for foreign firms is lower than
for domestic ones (19.1% against 23.1%) and is not statistically significant.9 Other panel data, GMM-based techniques recently developed for dealing with dynamic panel data are
not appropriate in the present context. For one, we only have seven annual observations, and theinstruments’ structure for these technique would consume a great deal of our usable sample. Secondly, theshort time span of our database creates biased estimates of its own, reducing the attractiveness of these
methods. Thirdly, it is not clear whether the desirable properties of GMM hold when the dependentvariable is truncated. Finally, endogeneity –a major reason for using GMM- does not seem particularlyrelevant in this work.

7/25/2019 Bebczuk Div Pol
http://slidepdf.com/reader/full/bebczuk-div-pol 13/19
is unlikely that year t dividends could cause changes in past, realized variables, such as
earnings, sales, and the like. On the contrary, year t dividends are prone to have some
impact on investment and debt policies from t+1 on, as highligthed in the theoretical
model. However, our regressions explain dividends based on accounting information
dated at t, preventing the usual endogeneity critique to be relevant in the present
context, although we will take some steps when estimate consistency is in doubt.
VER TOBIT ROBUST.HTML
HACIENDO XTTOBIT Y X, TOBIT SE PUEDE COMPARAR XT Y POOLED
The following table display the main regression results. In Column (1) we find that the
previous year’s payout does not affect current dividend decisions, in contrast to the welldocumented goal of avoiding abrupt dividend changes on the part of companies listed in
industrial countries. Sales (in logs), ROA, and cash flow have the expected positive
signs at 1% significance levels. Investment opportunities, as reflected in Tobin’s q,
reduce dividends as expected.10 More access to debt, represented by an increase in the
debt to assets ratio, raises dividend payments.11
The one finding that does not seem to fit into the model’s predictions is that uncertainty,
captured by the Debt/Assets ratio and the coefficient of variation of ROA, diminishes
the average payout. One plausible explanation to reconcile this behavior with the model
above has to do with the expected costs of financial distress and default. Our two-period
model has no room for them, because the company starts with this one project and
automatically disappears after it matures, neglecting the existence of future benefits
should the firm continue as a going concern. Furthermore, the limited liability condition
prevents creditors from seizing any assets not committed to this particular project in
case of default, such as personal assets posted as collateral or other company assets.12
Also, there could be psychological costs for managers and other insiders associated with
the bankruptcy and loss of control over the firm. No matter the precise form of these
costs, what seems clear is that firms behave in a rather conservative way, avoiding
excessive risk-taking that could trigger default. In a sense, they exhibit precautionary
10 Fama and French (2001) claim that size, return on assets and investment opportunities explain a greatdeal of dividend payouts in the US.11
The estimated coefficient is, in all cases, greater than one, indicating that there a high elasticity ofdividends to external funding.12 The model can be easily modified by including a new cost in the utility function in the bad event.

7/25/2019 Bebczuk Div Pol
http://slidepdf.com/reader/full/bebczuk-div-pol 14/19
saving behavior, under which they diminish dividend payments to create a buffer stock
for anticipated bad events.
Somewhat at odds with this argument, the time dummies included in the regression
reveal that companies paid more dividends as macroeconomic instability began to
escalate, and especially in 2000 -that is, the dividends decided and paid in early 2001,
just a few months before the climax of the crisis. However, this preference for dividend
in a turbulent macroeconomic environment is linked to the desire of most shareholders
to transform domestic financial wealth into dollars –as a matter of fact, individuals and
firms also withdrew their money from the banking system for the same purpose,
contributing to the currency crisis that lasted from December 2001 through July 2002.
Subsequently, it is noteworthy that a generalized dividend cut took place in 2002, likely
as a result of delicate financial situations in the aftermath of the crisis and the lack of
alternative financing sources.
All previous results repeat themselves in Columns (2) and (3), which shows two
changes with respect to Column (1): First, we added dummy variables for foreign-
owned firms and for ADR issuers. The estimation shows that ADR issuers pay more
dividends than other companies but, surprisingly, foreign firms pay lower dividends
than local ones, an issue that calls for further research. Second, we instrumented the
change in the debt to assets ratio to make sure that endogeneity is not plaguing the
results. Banks and other financiers monitor the dividend policy of borrowing
companies, extracting signals about the liquidity of the firm, its financing needs and its
willingness to repay. Therefore, reverse causality, from dividends to credit availability
may be present. The chosen instruments (tangibility –fixed to total assets-, the change in
total sales, and long-term to total debt) are usually recognized in the literature as
important drives of the access to credit. The estimation appears to be robust to this
instrument, as no major change is observed in the results.

7/25/2019 Bebczuk Div Pol
http://slidepdf.com/reader/full/bebczuk-div-pol 15/19
Regression results
Dependent variable: Dividend to cash flow(Heteroskedastic-consistent t-statistics in parenthesis)
Variables (1) (2) (3)
Lagged dividend to cash flow 0.023(0.44)
Paid any dividend last year (dummy) 64.36*** 58.42***(4.68) (4.8)
Ln(sales) 13.84*** 5.57** 4.41**(5.75) (2.74) (1.97)
ROA 261.23*** 232.80*** 237.96***(4.37) (4.46) (4.61)
q -35.66*** -23.83** -29.55**
(-2.86) (-2.01) (-2.51)
Debt to assets -153.03*** -112.0** -105.18***(-3.39) (-2.61) (-2.77)
Cash flow to change in long term assets 0.044*** 0.034** .038***(2.63) (2.53) (2.62)
Change in debt to assets 153.01*** 114.61** 109.0**
(2.87) (2.42) (2.34)
Coefficient of variation of ROA -1.613*** -1.18** -1.19**(-2.96) (-2.36) (-2.31)
Dummy 1996 17.02 16.31 19.16*(1.31) (1.63) (1.73)
Dummy 1997 19.44* 25.56** 24.69**(1.7) (2.16) (2.08)
Dummy 1999 35.63*** 36.39*** 36.05***(3.0) (3.12) (3.35)
Dummy 2000 54.94*** 47.70*** 48.28***(2.83) (2.71) (2.95)
Dummy 2001 17.91 18.56 17.82(1.45) (1.54) (1.43)
Dummy 2002 -45.7** -39.94** -38.54**(-2.12) (-2.31) (-2.33)
ADR Issuance (dummy) 41.50***(2.77)
Foreign-owned firm (dummy) -23.22**(-1.98)
Constant -128.15*** -90.45*** -72.99***(-4.7) (-4.19) (-3.03)
Observations 319 319 319Censored observations 172 172 171Wald test 62.55*** 80.08*** 79.73***

7/25/2019 Bebczuk Div Pol
http://slidepdf.com/reader/full/bebczuk-div-pol 16/19
Regression results (*)
Dependent variable: Dividend to cash flow
(Heteroskedastic-consistent t-statistics in parenthesis)
Variables (4) (5) (6) (7)
Lagged dividend to cash flow 0.028
(0.49)
Paid any dividend last year (dummy) 66.82*** 61.69*** 66.47***(4.74) (4.89) (4.75)
Ln(sales) 15.65*** 6.79*** 5.68** 7.58***(5.86) (3.12) (2.37) (3.11)
ROA 242.92*** 213.87*** 219.68*** 214.75***(3.76) (3.99) (4.23) (4.11)
q -42.01*** -28.46** -31.69*** -24.76**(-3.26) (-2.27) (-2.6) (-2.0)
Debt to assets -191.74*** -146.24** -128.56** -152.89**(-3.14) (-2.4) (-2.31) (-2.41)
Cash flow to change in long term assets 0.047*** .037*** 0.038*** 0.035***(3.32) (3.23) (3.2) (3.19)
Change in debt to assets 233.77** 208.34** 164.4 228.55**(2.14) (2.0) (1.62) (2.04)
Coefficient of variation of ROA -1.68** -1.23** -1.22** -1.21**(-2.5) (-2.06) (-2.04) (-2.03)
Dummy 1996 10.15 11.59 14.11 12.73(0.78) (1.18) (1.29) (1.25)
Dummy 1997 13.65 21.54* 20.95* 21.02*(1.19) (1.85) (1.78) (1.8)
Dummy 1999 30.35*** 32.17*** 32.22*** 32.23***(2.6) (2.78) (3.02) (2.78)
Dummy 2000 43.78** 38.27** 38.50** 38.41**(2.44) (2.35) (2.51) (2.35)
Dummy 2001 9.19 12.94 12.71 14.25(0.75) (1.12) (1.06) (1.22)
Dummy 2002 -60.03*** -50.00*** -47.83*** -50.86***(-2.63) (-2.84) (-2.85) (-2.94)
ADR Issuance (dummy) 38.62***(2.62)
Foreign-owned firm (dummy) -24.25** -10.33(-2.03) (-1.16)
Constant -132.10*** -92.50*** -79.17*** -99.8***
(-4.64) (-4.11) (-3.24) (-4.12)
Observations 321 321 321 321Censored observations 173 173 173 173Wald test 58.96*** 83.63*** 85.15*** 84.38***
(*) Change in debt to assets instrumented with tangibility, percentage change in total sales and long-term debt to total assets

7/25/2019 Bebczuk Div Pol
http://slidepdf.com/reader/full/bebczuk-div-pol 17/19
Additional exploratory regressions made use of: (i) Industry dummies, which turned out
to be not significant, and (ii) a random-effects Tobit technique, which did not alter the
main results reported above.
Conclusions
The study looked for explanations for observed dividend policies in Argentine listed
firms in 1996-2002. The results are to a great extent consistent with a model of a firm
where the conflicts of interest between managers and shareholders, and between
controlling and minority shareholders, appear to be less relevant than the conventional
decision-making process of a sole owner-manager. Our main findings are that: (a)
Bigger and more profitable firms without good investment opportunities pay more
dividends; (b) Companies with more fluid access to debt pay more dividends; (c)
Furthermore, riskier and more indebted firms prefer to pay lower dividends, and the
same applies to foreign-owned firms; (d) ADR issuers disburse more dividends than
other companies; and (e) Firms do not seem to care about maintaining stable payout
ratios over time, but there is some inertia in that non-payers tend to stay that way and
otherwise.

7/25/2019 Bebczuk Div Pol
http://slidepdf.com/reader/full/bebczuk-div-pol 18/19
References
Allen F. and R. Michaely (1995), “Dividend Policy”, in Handbook in Operations
Research and Management Science: Finance, edited by R. Jarrow, V. Maksimovic, and
W. Ziemba, Amsterdam: Elsevier-Science, 793-839.
Angrist J. and A. Krueger (2001), “Instrumental variables and the search for
identification: From supply and demand to natural experiments”, NBER Working
Paper, No. 8456, September.
Baker K., G. Powell, and T. Veit (2003), “Revisiting the Dividend Puzzle: Do All of the
Pieces Now Fit”, Review of Financial Economics.
Bebczuk R. (1997), “Is the Argentine stock market efficient? Some empirical tests”,
mimeo, University of Illinois at Urbana-Champaign.
Bebczuk R. (2002), Corporate Finance, Financial Development, and Growth, Centro deEstudios Monetarios Latinoamericanos, Mexico D.F..
Bebczuk R. (2003), Asymmetric Information in Financial Markets: Introduction and
Applications, Cambridge University Press, U.K., September.
Black F. (1976), “The dividend puzzle”, Journal of Portfolio Management, Vol.2, 5-8.
Claessens S., D. Klingebiel, and S. Schmukler (2002), “The future of stock exchanges
in emerging economies: Evolution and prospects”, Financial Institutions Center,
Wharton, Working Paper 02-03.
Faccio M., L. Lang, and L. Young (2001), “Dividends and Expropriation”, American
Economic Review, Vol.91, No.1.
Fama E. and K. French (2001), “Disappearing dividends: Changing firm characteristics
or lower propensity to pay?”, Journal of Financial Economics, Vol.60, 3-43.
Fernandez Baribiera A. (2002), “Estacionalidad en la Bolsa argentina: El efecto ´fin de
semana`”, mimeo, Universidad Rovira-i-Virgili, Spain.
García Zamora, F. (2002), “Determinantes de la política de dividendos en efectivo enArgentina, 1991-2001”, unpublished thesis, Posgraduate Specialization in Capital
Markets, Universidad Nacional de Buenos Aires, Argentina.
Gertler M. and R. G. Hubbard (1988), "Financial Factors in Business Fluctuations", NBER
Working Papers, No.2758.
Gobert K. (2001), “Capital Structure and Risk Management”, CIRANO Scientific
Series, No. 2001s-51.
IAMC (2002), “Política de distribución de dividendos en efectivo en Argentina.
Decisiones empresariales y mercado accionario”, Documento de Trabajo, InstitutoArgentino de Mercado de Capitales.

7/25/2019 Bebczuk Div Pol
http://slidepdf.com/reader/full/bebczuk-div-pol 19/19
Jensen M. (1986), “Agency costs of free cash flow, corporate finance, and takeovers”,
American Economic Review, Vol.76, 323-329.
La Porta R., F. Lopez de Silanes y A. Shleifer (1997), “Legal Determinants of External
Finance”, Journal of Finance, Vol. 52, No. 3.
La Porta R., F. Lopez-de-Silanes, A. Shleifer, and R. Vishny (1999), “Agency Problems
and Dividend Policies Around the World”, mimeo, Harvard University.
Lintner (1956), “Distribution of incomes of corporations among dividends, retained
earnings and taxes”, American Economic Review, Vol. 46, 97-113.
Miller M. and F. Modigliani (1961), “Dividend policy, growth, and the valuation of
shares”, Journal of Business, Vol. 34, 411-433.
Miller M. and K. Rock (1985), “Dividend policy under asymmetric information”,
Journal of Finance, Vol.40, 1031-1051.
Yang C., C. Lin, and Y. Lu (2000), “Investment Strategy, Dividend Policy and
Financial Constraints of the Firm”, Review of Pacific Basin Financial Markets and
Policies, Vol.3, No.2, 235-267.


![c+za08fsf] !* g+= df plNnlvt lg0f{o g+= **^(/cite>lg0f{o](https://static.fdocument.pub/doc/165x107/5ac3e86e7f8b9ae06c8cbb58/cza08fsf-g-df-plnnlvt-lg0fo-g-.jpg)