Author's personal copy - Naturalis - Universidad Nacional de La Plata
This article appeared in a journal published by Elsevier. The attachedcopy is furnished to the author for internal non-commercial researchand education use, including for instruction at the authors institution
and sharing with colleagues.
Other uses, including reproduction and distribution, or selling orlicensing copies, or posting to personal, institutional or third party
websites are prohibited.
In most cases authors are permitted to post their version of thearticle (e.g. in Word or Tex form) to their personal website orinstitutional repository. Authors requiring further information
regarding Elsevier’s archiving and manuscript policies areencouraged to visit:
http://www.elsevier.com/copyright
Author's personal copy
The complete mitochondrial genome and phylogenomics of a damselfly,Euphaea formosa support a basal Odonata within the Pterygota
Chung-Ping Lin a,b,⁎, Ming-Yu Chen a,b, Jen-Pan Huang a,b,c
a Department of Life Science, Tunghai University, Taichung, Taiwanb Center for Tropical Ecology and Biodiversity, Tunghai University, Taichung, Taiwanc Biodiversity Research Center, Academia Sinica, Taipei, Taiwan
a b s t r a c ta r t i c l e i n f o
Article history:Accepted 3 August 2010Available online 8 August 2010
Received by J.G. Zhang
Keywords:PhylogenomicsMitochondrial genomeIntergenic spacerDamselflyOdonataBasal Pterygota
This study determined the first complete mitochondrial genome of a damselfly, Euphaea formosa (Insecta:Odonata: Zygoptera), and reconstructed a phylogeny based on thirteen protein-coding genes of mitochondrialgenomes in twenty-five representative hexapods to examine the relationships among the basal Pterygota. Thedamselfly's mitochondrial genome is a circular molecule of 15,700 bp long, and contains the entire set of thirty-seven genes typically found in insects. The gene arrangement, nucleotide composition, and codon usage patternof the mitochondrial genome are similar across the three odonate species, suggesting a conserved genomeevolutionwithin the Odonata. The presence of the intergenic spacer s5 likely represents a synapomorphy for thedragonflies (Anisoptera). Maximum parsimony, maximum likelihood, and Bayesian analyses of both nucleotideand amino acid sequences cannot support the three existing phylogenetic hypotheses of the basal Pterygota(Palaeoptera, Metapterygota, and Chiastomyaria). In contrast, the phylogenetic results indicate an alternativehypothesis of a strongly supported basal Odonata and a sister relationship of the Ephemeroptera and Plecoptera.TheunexpectedsisterEphemeroptera+Plecoptera clade,which contradictswith thewidely acceptedhypothesisof a monophyletic Neoptera, requires further analyses with additional mitochondrial genome sampling at thebase of the Neoptera.
© 2010 Elsevier B.V. All rights reserved.
1. Introduction
Insects were the first group of organisms to take to the skies andthe only invertebrates to have acquired functional wings, startingapproximately 400 million years ago in the early Devonian period(Engel and Grimaldi, 2004). Researchers have regarded the origin ofwings as themost important morphological innovation for the successof insects, which allows them to colonize every terrestrial andfreshwater ecosystem through increased locomotion and dispersalability (Hennig, 1981; Brodsky, 1994; Grimaldi and Engel, 2005). Thesuccessive structural and functional wing modifications in derived
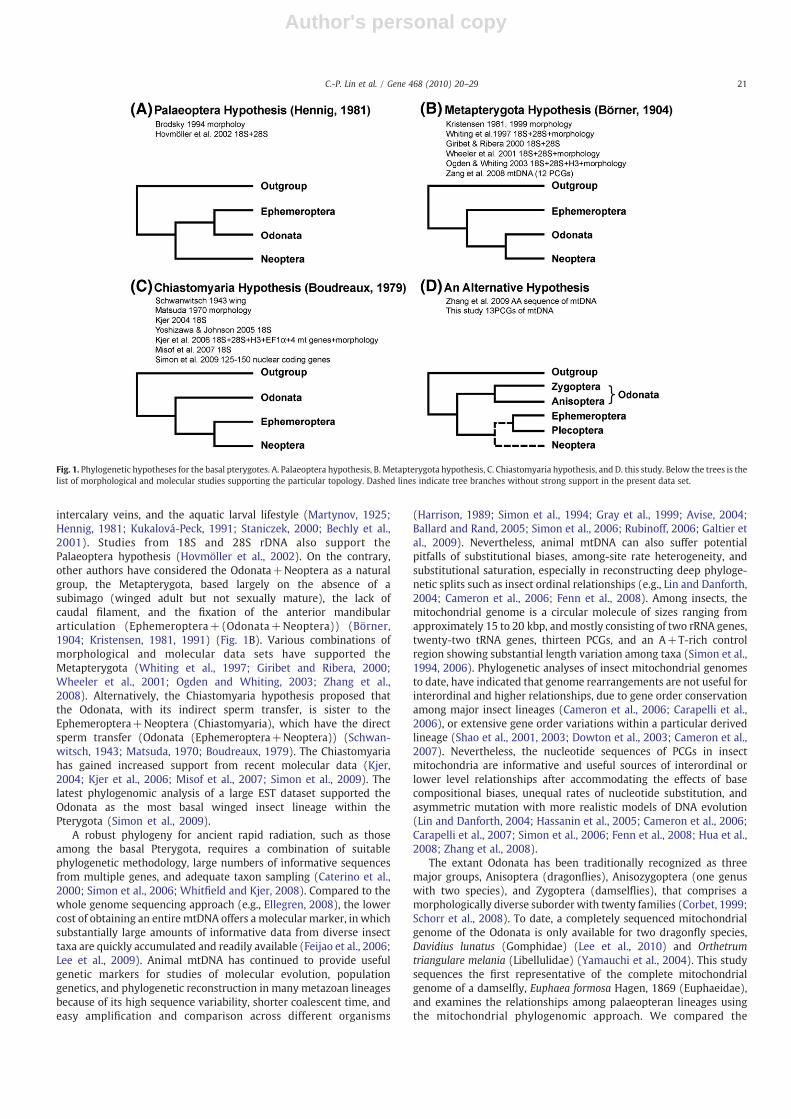
insect lineages, such as the harden elytra of beetles, further facilitatethe radiation and domination of insects in diverse habitats. Thewinged insects (Pterygota) are the most diverse organisms and theecologically predominant lineages over all life forms. However, theorigin and evolution of these tremendous radiations are far from clear,largely due to unresolved phylogenetic relationships among the basalPterygota, including the Palaeoptera and the remaining primitivewinged insects. The Palaeoptera contains merely two extant lineages,dragonflies (Odonata) and mayflies (Ephemeroptra). Nevertheless,the relationships of palaeopteran groups and their phylogeneticpositions within the winged or secondarily wingless insect orders(Neoptera) remain controversial. Earlier studies propose threedifferent phylogenetic hypotheses for the relationships among thebasal Pterygota: 1) the Palaeoptera (Hennig, 1981), 2) the Metapter-ygota (Börner, 1904; Kristensen, 1991), and 3) the Chiastomyaria(Boudreaux, 1979) (Fig. 1).
The Palaeoptera hypothesis suggests that the Odonata is thesister to the Ephemeroptera, which together forms a monophyleticgroup (Palaeoptera) sister to the remaining winged insects of theNeoptera ((Odonata+Ephemeroptera)+Neoptera) (Hennig, 1981;Brodsky, 1994) (Fig. 1A). The Palaeoptera is mainly supported bythe “palaeopterous condition”, the incapability of flexing the wingsover the abdomen during rest, and other morphological traits suchas the anal brace, the bristle-like antennae, the formation of
Gene 468 (2010) 20–29
Abbreviations: atp6 and atp8, ATPase subunits 6 and 8; BIC, Bayes informationcriteria; BI, Bayesian inference; BPP, Bayesian posterior probability; CDspT, codons perthousands codons; cob, cytochrome b; cox1–3, cytochrome c oxidase subunits 1–3; EST,expressed sequence tag; LB, likelihood bootstrap; l-rRNA, large subunit of ribosomalgene; MCMC, Markov chain Monte Carlo; ML, maximum likelihood; MP, maximumparsimony; mtDNA, mitochondrial DNA; nad1–6, 4L, NADH dehydrogenase subunits 1–6, 4L; nt1, nt2, and nt3, the first, second, and third nucleotide positions; PB, parsimonybootstrap; PCR, polymerase chain reaction; PCGs, protein-coding genes; RSCU, RelativeSynonymous Codon Usage; trnX, gene encoding for transfer RNA corresponding toamino acids X.⁎ Corresponding author. Department of Life Science, Tunghai University, Taichung,
Taiwan. Tel.: +886 4 23590121x32412; fax: +886 4 23590296.E-mail addresses: [email protected] (C.-P. Lin), [email protected]
(M.-Y. Chen), [email protected] (J.-P. Huang).
0378-1119/$ – see front matter © 2010 Elsevier B.V. All rights reserved.doi:10.1016/j.gene.2010.08.001
Contents lists available at ScienceDirect
Gene
j ourna l homepage: www.e lsev ie r.com/ locate /gene
Author's personal copy
intercalary veins, and the aquatic larval lifestyle (Martynov, 1925;Hennig, 1981; Kukalová-Peck, 1991; Staniczek, 2000; Bechly et al.,2001). Studies from 18S and 28S rDNA also support thePalaeoptera hypothesis (Hovmöller et al., 2002). On the contrary,other authors have considered the Odonata+Neoptera as a naturalgroup, the Metapterygota, based largely on the absence of asubimago (winged adult but not sexually mature), the lack ofcaudal filament, and the fixation of the anterior mandibulararticulation (Ephemeroptera+(Odonata+Neoptera)) (Börner,1904; Kristensen, 1981, 1991) (Fig. 1B). Various combinations ofmorphological and molecular data sets have supported theMetapterygota (Whiting et al., 1997; Giribet and Ribera, 2000;Wheeler et al., 2001; Ogden and Whiting, 2003; Zhang et al.,2008). Alternatively, the Chiastomyaria hypothesis proposed thatthe Odonata, with its indirect sperm transfer, is sister to theEphemeroptera+Neoptera (Chiastomyaria), which have the directsperm transfer (Odonata (Ephemeroptera+Neoptera)) (Schwan-witsch, 1943; Matsuda, 1970; Boudreaux, 1979). The Chiastomyariahas gained increased support from recent molecular data (Kjer,2004; Kjer et al., 2006; Misof et al., 2007; Simon et al., 2009). Thelatest phylogenomic analysis of a large EST dataset supported theOdonata as the most basal winged insect lineage within thePterygota (Simon et al., 2009).
A robust phylogeny for ancient rapid radiation, such as thoseamong the basal Pterygota, requires a combination of suitablephylogenetic methodology, large numbers of informative sequencesfrom multiple genes, and adequate taxon sampling (Caterino et al.,2000; Simon et al., 2006; Whitfield and Kjer, 2008). Compared to thewhole genome sequencing approach (e.g., Ellegren, 2008), the lowercost of obtaining an entire mtDNA offers a molecular marker, in whichsubstantially large amounts of informative data from diverse insecttaxa are quickly accumulated and readily available (Feijao et al., 2006;Lee et al., 2009). Animal mtDNA has continued to provide usefulgenetic markers for studies of molecular evolution, populationgenetics, and phylogenetic reconstruction in many metazoan lineagesbecause of its high sequence variability, shorter coalescent time, andeasy amplification and comparison across different organisms
(Harrison, 1989; Simon et al., 1994; Gray et al., 1999; Avise, 2004;Ballard and Rand, 2005; Simon et al., 2006; Rubinoff, 2006; Galtier etal., 2009). Nevertheless, animal mtDNA can also suffer potentialpitfalls of substitutional biases, among-site rate heterogeneity, andsubstitutional saturation, especially in reconstructing deep phyloge-netic splits such as insect ordinal relationships (e.g., Lin and Danforth,2004; Cameron et al., 2006; Fenn et al., 2008). Among insects, themitochondrial genome is a circular molecule of sizes ranging fromapproximately 15 to 20 kbp, andmostly consisting of two rRNA genes,twenty-two tRNA genes, thirteen PCGs, and an A+T-rich controlregion showing substantial length variation among taxa (Simon et al.,1994, 2006). Phylogenetic analyses of insect mitochondrial genomesto date, have indicated that genome rearrangements are not useful forinterordinal and higher relationships, due to gene order conservationamong major insect lineages (Cameron et al., 2006; Carapelli et al.,2006), or extensive gene order variations within a particular derivedlineage (Shao et al., 2001, 2003; Dowton et al., 2003; Cameron et al.,2007). Nevertheless, the nucleotide sequences of PCGs in insectmitochondria are informative and useful sources of interordinal orlower level relationships after accommodating the effects of basecompositional biases, unequal rates of nucleotide substitution, andasymmetric mutation with more realistic models of DNA evolution(Lin and Danforth, 2004; Hassanin et al., 2005; Cameron et al., 2006;Carapelli et al., 2007; Simon et al., 2006; Fenn et al., 2008; Hua et al.,2008; Zhang et al., 2008).
The extant Odonata has been traditionally recognized as threemajor groups, Anisoptera (dragonflies), Anisozygoptera (one genuswith two species), and Zygoptera (damselflies), that comprises amorphologically diverse suborder with twenty families (Corbet, 1999;Schorr et al., 2008). To date, a completely sequenced mitochondrialgenome of the Odonata is only available for two dragonfly species,Davidius lunatus (Gomphidae) (Lee et al., 2010) and Orthetrumtriangulare melania (Libellulidae) (Yamauchi et al., 2004). This studysequences the first representative of the complete mitochondrialgenome of a damselfly, Euphaea formosa Hagen, 1869 (Euphaeidae),and examines the relationships among palaeopteran lineages usingthe mitochondrial phylogenomic approach. We compared the
Fig. 1. Phylogenetic hypotheses for the basal pterygotes. A. Palaeoptera hypothesis, B. Metapterygota hypothesis, C. Chiastomyaria hypothesis, and D. this study. Below the trees is thelist of morphological and molecular studies supporting the particular topology. Dashed lines indicate tree branches without strong support in the present data set.
21C.-P. Lin et al. / Gene 468 (2010) 20–29
Author's personal copy
genome organization, structure, and composition of mtDNA amongthe three available odonates and reconstructed phylogenies based onthirteen PCGs of mitochondrial genomes from exemplars of ninewingless insects and thirteen major basal pterygote lineages. Thisinvestigation used phylogenetic analyses and statistical methods totest the validity of the three hypotheses proposed for the basalPterygota.
2. Materials and methods
2.1. Sequencing mitochondrial genome of E. formosa
The E. formosa specimen (code EfRa010) used for this study wascollected from Fongkang River (22°13′50″N–120°47′10″E) of south-ern Taiwan in 2006. The insect was preserved in 95% EtOH and kept ina −80 °C freezer. We extracted total genomic DNA from the thoraxmuscle of the specimen using standard CTAB protocol outlined in Linand Wood (2002). Vouchers consisting of the remaining damselflieswere deposited in the insect collection of Tunghai University. Weamplified the whole mitochondrial genome as two DNA fragmentsusing long PCR primer sets, L2020-CO1/H12230-16S and L12167-16S/H5244-CO3, following the recommended thermal cycle profile(Yamauchi et al., 2004). PCRs were performed on a thermalMastercycler (EPPENDORF, USA) with a total volume of 25 μlcontaining 1 μl (approximately 100 ng) of genomic DNA, 1 μl of eachprimer (10 mM), 4 μl of dNTP (1 mM), 2.5 μl of 10× buffer, and 1.25 Uof TaKaRa LA Taq™ polymerase (Takara Bio Inc., Japan). The amplifiedlong PCR fragments were isolated using Gel/PCR DNA FragmentsExtraction Kit (Geneaid, Taiwan) and cloned into pCR® 2.l-TOPOvector (Invitrogen). DNA sequencing was performed using primerwalking approach with a combination of 5 published and 17 newlydesigned primers (Online supplementary data), cycle sequencing, anddye terminator methodologies on an ABI PRISM™ 377 automaticsequencer (Perkin Elmer, USA) by the Mission Biotech, Taiwan.
2.2. Sequence annotation and tRNA folding
The mtDNA sequences were edited and assembled using SegManprogram in the Lasergene (v. 7.1, DNAStar, Madison, WI). Chromato-grams of contig sequences were checked manually for ambiguousbase calls. PCGs, rRNA genes, and intergenic spacers were identifiedthrough BLAST searches in GenBank and by comparison withhomologous sequences of other insect mtDNA. Nomenclature ofgenes and strands followed Simon et al. (1994). The abundance ofcodon families and the pattern of CDspT and RSCU in PCGs for thethree available mtDNAs of the Odonata were analyzed in DAMBE (v.4.2.13, Xia and Xie, 2001). The start and incomplete stop codons wereexcluded from the analyses. The transfer RNA identification andanalysis was conducted using DOGMA (Dual Organellar GenomeAnnotator, Wyman et al., 2004), with the COVE threshold set to alower value of 7 to allow all putative tRNAs. We chose the tRNA basedon its COVE score and the quality of predicted secondary folding withreference to published insect's mitochondrial tRNAs. The completemitochondrial genome of E. formosa was deposited in the GenBank(accession no. HM126547).
2.3. Taxon sampling, sequence alignment, and phylogenetic analyses
To reconstruct the basal relationships of pterygote insects, theDNA sequences of the complete mitochondrial genome of represen-tative taxa of 21 basal insect orders and three Collembolan outgroupswere obtained from GenBank (Table 1). Taxon sampling was focusedon available mitochondrial genomes in the basal pterygote lineages.The mitochondrial genomes of the more derived taxa, such as theparaneopterous or holometabolous insects were available but notincluded in the present data set because some of these highly
divergent mitochondrial genomes can violate the assumptions foundin nucleotide substitution models and result in incorrect treetopologies. The nucleotide sequences of all 13 PCGs were firsttranslated into amino acid sequences in MacClade (v. 4.06, Maddisonand Maddison, 2000) with the invertebrate mitochondrial geneticcode (translation Table 5) and aligned using Clustal W method with agap penalty of 15 and a gap length penalty of 6.6 in MegAlign ofLasergene package. The alignment of nucleotide sequences wasobtained by converting aligned amino acid sequences back tonucleotide sequences. The level of substitution saturation of the first(nt1), second (nt2), and third (nt3) codon positions of nucleotidesequences was evaluated using a saturation test with F84 modelimplemented in DAMBE. We excluded all nt3 positions from thephylogenetic analyses because of substitution saturation in these sites(see Section 3.2).
Maximum parsimony analyses of nucleotide and proteinsequences were performed using PAUP* (v. 4.0b10, Swofford, 1998),with 400 replicates of parsimony ratchet procedure implemented inPauprat (Sikes and Lewis, 2000). Parsimony bootstrap (PB) valueswere calculated using 1000 replicates and 100 random taxonadditions in PAUP*. For Bayesian inference (BI) and maximumlikelihood (ML) analyses of nucleotide sequences, we divided thenucleotide sequences into 26 character partitions corresponding togenes and codon positions (nt1 and nt2). The best-fit model ofnucleotide substitution for each partition was selected on the basis ofthe Bayes Information Criteria (BIC) in Modeltest (v. 3.7, Posada andCrandall, 1998). The chosen models for each partitions were asfollows: GTR+G model for nt2 of nd2 and nt1 of nd4L; GTR+I+Gmodel for nt1 of atp6, cox2, cob and nd2, nt2 of atp8, nt1 and nt2 ofcox1, cox3, nd1, nd4 and nd5; HKY+I+Gmodel for nt1 of nd6; K81uf+I+G model for nt1 of atp8; TIM+I+G model for nt1 of nd3; andTVM+I+G model for nt2 of atp6, cox2, cob, nd3 and nd6. Thesesubstitution models were used in the site-specific BI analyses inMrBayes (v. 3.1.2, Huelsenbeck and Ronquist, 2001), with all modelparameters unlinked and rate multipliers variable across sites. Twoindependent Markov chain Monte Carlo (MCMC) processes eachcontaining four Markov chains were performed simultaneously for4×106 generations, with Markov chains being sampled for every 100iteration. We terminated MCMC searches after the average splitfrequencies of two processes falling below the value of 0.01 and theconvergence diagnostic potential scale reduction factor reaching 1,which indicated the convergence of separate MCMC processes. Theinitial 20,000 MCMC samples were discarded as burnin. The remain-ing 20,000 trees were used to compute a 50% majority rule tree, withthe percentage of trees recovering the node representing the node'sBayesian posterior probability (BPP).
For the ML analyses of nucleotide sequences, we conducted thetree searches and parameter optimization using a rapid approxima-tion algorithm implemented in RAxML (Stamatakis, 2006) to reducethe computational time and memory requirement. Because RAxMLdoes not allow less complex models, such as HKY+I+G or TVM+I+G, to be applied separately to individual partitions, we recon-structed the ML tree using the GTRCAT GAMMAI model toapproximate the site-specific substitution rates for individual parti-tions, and to accommodate the rate heterogeneity within eachpartition using four discrete rate categories of a gamma distribution(GAMMA) and an estimation of the proportion of invariable sites (I).We conducted 100 iterations in each ML analyses and identified theoptimal ML tree by comparing the likelihood values among them. Toassess the support for internal nodes of the ML tree, we calculated1000 likelihood bootstrap (LB) replications with the GTRGAMMAImodel.
For phylogenetic analyses of protein sequences, we conducted BIin MrBayes using the MtRev model, with the rate heterogeneityaccommodations (G+F: atp8, nad2, and nad4L; I+G: cox1, cox3, andcob; and I+G+F: atp6, cox2, nad1, nad3, nad4, nad5, and nad6)
22 C.-P. Lin et al. / Gene 468 (2010) 20–29
Author's personal copy
selected separately for each gene partitions in ProtTest (v. 2.4, Abascalet al., 2005). Two independent MCMC processes were performedsimultaneously for 1×10⁵ generations and terminated after theaverage split frequencies of two processes falling below the value of0.01. Trees and parameters were sampled for every 100 iterations,with a burnin of 1×10⁴ generations. We conducted ML tree searchesusing the MtArt+I+G model of amino acid changes (Abascal et al.,2007), and performed bootstrap analyses of 100 replicates in PHYML(v. 3.0, Guindon and Gascuel, 2003).
2.4. Testing alternative phylogenetic hypotheses
We tested the three alternative phylogenetic hypotheses of basalPterygota (Fig. 1) by calculating the probability values of the treetopologies (Table 2) using the Kishino–Hasegawa (KH), Shimodaira–Hasegawa (SH), weighted Kishino–Hasegawa (WKH), weightedShimodaira–Hasegawa (WSH), and approximately unbiased (AU)test calculated from the multi-scale bootstrap in CONSEL (Shimodairaand Hasegawa, 2001). The likelihood values of alternative treetopologies were obtained from ML heuristic searches of 5×10⁶
generations using the constrained topologies and GTR+I+G modelin GARLI (Zwickl, 2006). A p-value of less than 0.05 was interpreted asstrong evidence for rejecting the phylogenetic hypothesis.
3. Results
3.1. Genome organization, structure, and composition
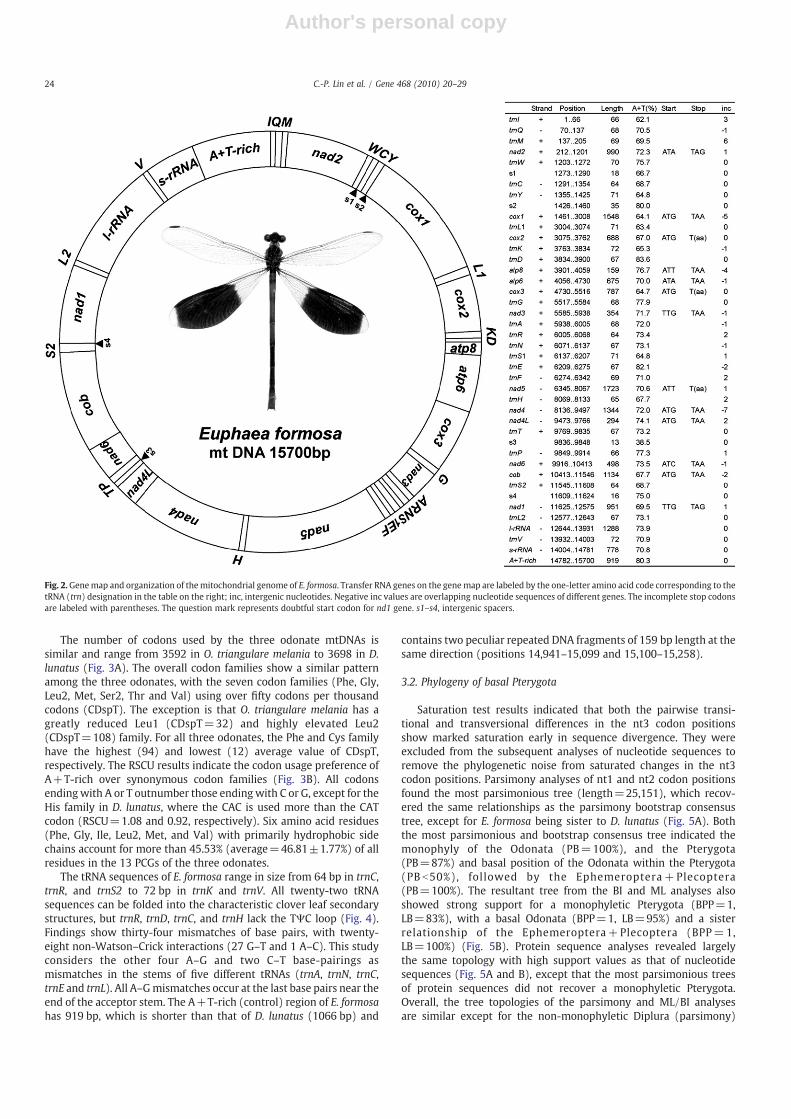
The complete mtDNA of the E. formosa is a circular molecule of15,700 bp long. This length is within the range of the other twoodonate mitochondrial genomes (incomplete 14,033 bp in O. trian-
gulare melania and 15,913 bp in D. lunatus). The mtDNA of E. formosacontains the entire set of thirty-seven genes (13 PCGs, 22 tRNA genes,two rRNA genes and an A+T-rich control region), with the genearrangement typically found in an insect'smitochondria (Boore, 1999;Simon et al., 1994), and identical to the other two odonate genomes(Fig. 2). This genome contains four non-coding intergenic spacers(s1–s4), ranging from 13 to 35 bp. The result also found three of thesefour spacers (s2–s4) in another two odonate mtDNA, while E. formosahas a unique s1 and is missing an intergenic spacer (s5, between nd1and trnL2), shared by O. triangulare melania and D. lunatus. Six genejunctions in the mtDNA of E. formosa have short overlaps, with thelargest one being eight nucleotides long and found at the junction oftrnC–trnY. The base frequency of the entire E. formosa mtDNA is asfollows: A=42.2%; T=28.3%; C=17.3%; G=12.0%, with a typicallyhigh A+T content of 70.3% within the range of values found in O.triangulare melania (73.9%) and D. lunatus (70.1%).
Eleven of the thirteen PCGs in E. formosa employ the standard startcodons for invertebrate mtDNA: eight use ATA and ATG (nad2, cox1,cox2, atp6, cox3, nad4, nad4L, and cob), which encode for methionine(M); three use ATC and ATT (atp8, nad5, and nad6), encoding forisoleucine (I). Findings showed an exception in nad1 and nad3 genes,which initiate with the non-canonical putative start codon TTGencoding for leucine (L). The current work recognized a standard stopcodon in ten PCGs (TAA for cox1, atp8, atp6, nad3, nad4, nad4L, nad6and cob; TAG for nad1 and nad2). The cox2, cox3 and nad5 have anincomplete stop codon of a single T. The atp8–atp6 and nad4–nad4Lare the PCG pairs having a nucleotide overlap. The A+T content of allPCGs in E. formosa is highly biased (70.5%), with atp8 having thehighest (84.3%) and cox1 having the lowest values (64%). Cox1 of O.triangulare melania and D. lunatus also has the lowest A+T content,but the PCG with the highest A+T content for D. lunatus is nad4L.
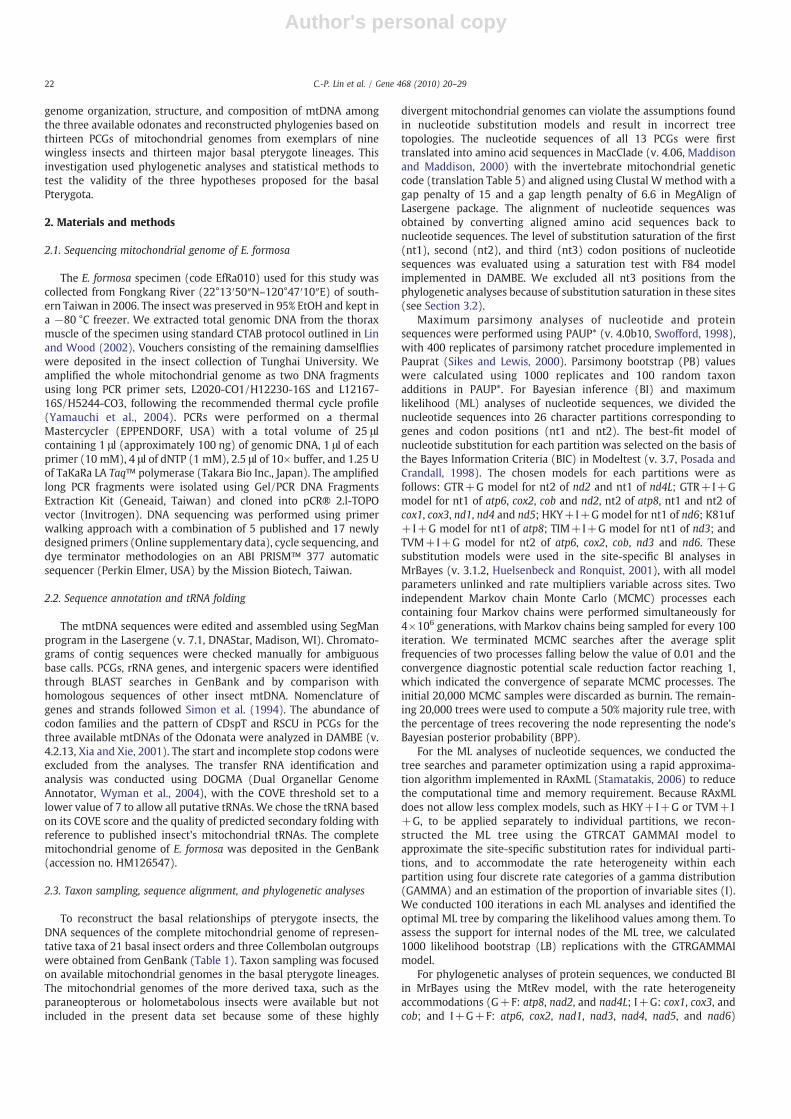
Table 1List of taxa and their mtDNAs analyzed in this study.
Order Family Species Acc. number References
Collembola Entomobryidae Orchesella villosa NC_010534 Carapelli et al. (2007)Neanuridae Bilobella aurantiaca NC_011195 Carapelli et al. unpublishedSminthuridae Sminthurus viridis NC_010536 Carapelli et al. (2007)
Diplura Campodeidae Campodea fragilis NC_008233 Podsiadlowski et al. (2006)Japygidae Japyx solifugus NC_007214 Carapelli et al. (2005)
Archaeognatha Machilidae Pedetontus silvestrii NC_011717 Zhang et al. (2008)Machilidae Petrobius brevistylis NC_007688 Podsiadlowski (2006)Machilidae Trigoniophthalmus alternatus NC_010532 Carapelli et al. (2007)Meinertellidae Nesomachilis australica NC_006895 Cameron et al. (2004)
Zygentoma Lepismatidae Thermobia domestica NC_006080 Cook et al. (2005)Lepidotrichidae Tricholepidion gertschi NC_005437 Nardi et al. (2003)Nicoletiidae Atelura formicaria NC_011197 Comandi et al. (2009)
Ephemeroptera Ephemeridae Ephemera orientalis NC_012645 Lee et al. (2010)Heptageniidae Parafronurus youi EU349015 Zhang et al. (2008)
Odonata Euphaeidae Euphaea formosa HM126547 This studyGomphidae Davidius lunatus NC_012644 Lee et al. (2010)Libellulidae Orthetrum triangulare melania AB126005 Yamauchi et al. (2004)
Plecoptera Pteronarcyidae Pteronarcys princeps NC_006133 Stewart and Beckenbach (2006)Isoptera Rhinotermitidae Reticulitermes hageni NC_009501 Cameron and Whiting (2007)Blattaria Blattidae Periplaneta fuliginosa NC_006076 Yamauchi et al. (2004)Mantodea Mantidae Tamolanica tamolana NC_007702 Cameron et al. (2006)Mantophasmatodea Mantophasmatidae Sclerophasma paresisense NC_007701 Cameron et al. (2006)Phasmatodea Phasmatidae Ramulus hainanense NC_013185 Hua et al. unpublished
Timematidae Timema californicum DQ241799 Cameron et al. (2006)Orthoptera Acrididae Locusta migratoria NC_001712 Flook et al. (1995)
Table 2Maximum likelihood values and statistics for alternative phylogenetic hypotheses of basal Pterygota calculated in GARLI and CONSEL program.
Hypothesis Topological constraints LnL AU KH SH WKH WSH
Palaeoptera ((Odonata, Ephemeroptera), Neoptera) −103,878.5042 0.006* 0.032* 0.161 0.014* 0.034*Metapterygota (Ephemeroptera, (Odonata, Neoptera)) −103,866.8527 b0.001* b0.001* b0.001* b0.001* b0.001*Chiastomyaria (Odonata, (Ephemeroptera, Neoptera)) −103,860.7880 0.150 0.139 0.397 0.139 0.359This study −103,842.0322 0.875 0.861 0.921 0.861 0.958
23C.-P. Lin et al. / Gene 468 (2010) 20–29
Author's personal copy
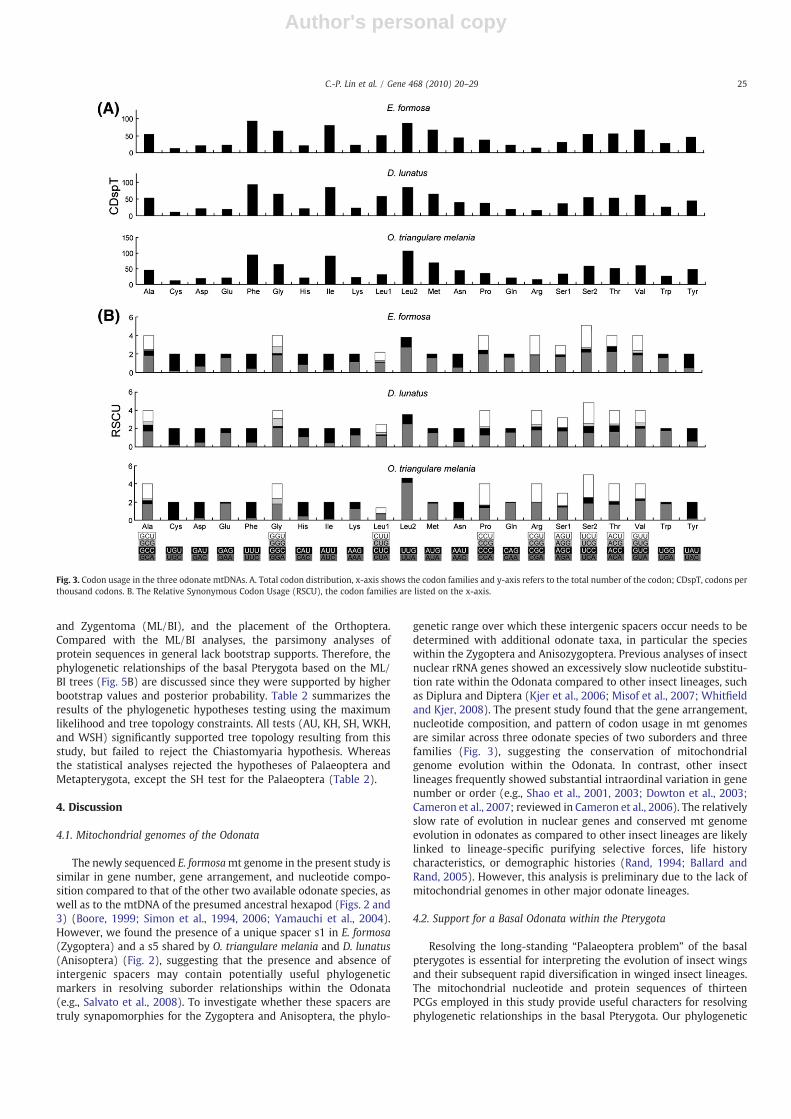
The number of codons used by the three odonate mtDNAs issimilar and range from 3592 in O. triangulare melania to 3698 in D.lunatus (Fig. 3A). The overall codon families show a similar patternamong the three odonates, with the seven codon families (Phe, Gly,Leu2, Met, Ser2, Thr and Val) using over fifty codons per thousandcodons (CDspT). The exception is that O. triangulare melania has agreatly reduced Leu1 (CDspT=32) and highly elevated Leu2(CDspT=108) family. For all three odonates, the Phe and Cys familyhave the highest (94) and lowest (12) average value of CDspT,respectively. The RSCU results indicate the codon usage preference ofA+T-rich over synonymous codon families (Fig. 3B). All codonsendingwith A or T outnumber those endingwith C or G, except for theHis family in D. lunatus, where the CAC is used more than the CATcodon (RSCU=1.08 and 0.92, respectively). Six amino acid residues(Phe, Gly, Ile, Leu2, Met, and Val) with primarily hydrophobic sidechains account for more than 45.53% (average=46.81±1.77%) of allresidues in the 13 PCGs of the three odonates.
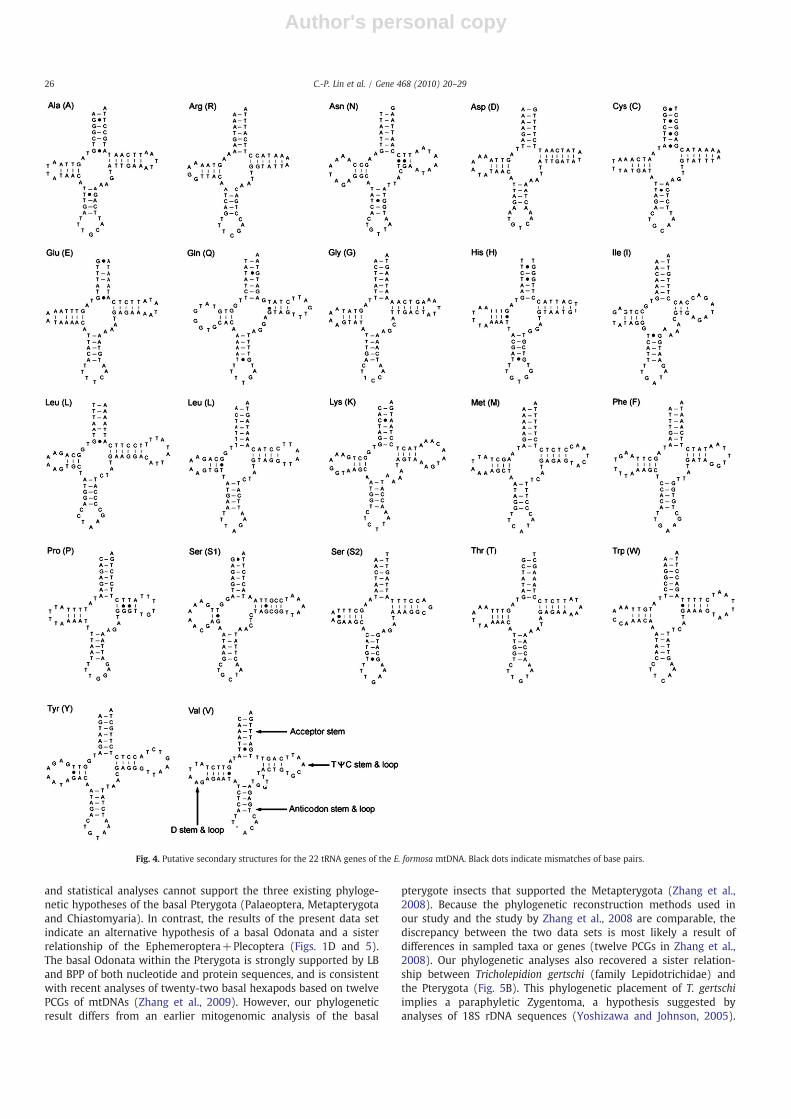
The tRNA sequences of E. formosa range in size from 64 bp in trnC,trnR, and trnS2 to 72 bp in trnK and trnV. All twenty-two tRNAsequences can be folded into the characteristic clover leaf secondarystructures, but trnR, trnD, trnC, and trnH lack the TΨC loop (Fig. 4).Findings show thirty-four mismatches of base pairs, with twenty-eight non-Watson–Crick interactions (27 G–T and 1 A–C). This studyconsiders the other four A–G and two C–T base-pairings asmismatches in the stems of five different tRNAs (trnA, trnN, trnC,trnE and trnL). All A–Gmismatches occur at the last base pairs near theend of the acceptor stem. The A+T-rich (control) region of E. formosahas 919 bp, which is shorter than that of D. lunatus (1066 bp) and
contains two peculiar repeated DNA fragments of 159 bp length at thesame direction (positions 14,941–15,099 and 15,100–15,258).
3.2. Phylogeny of basal Pterygota
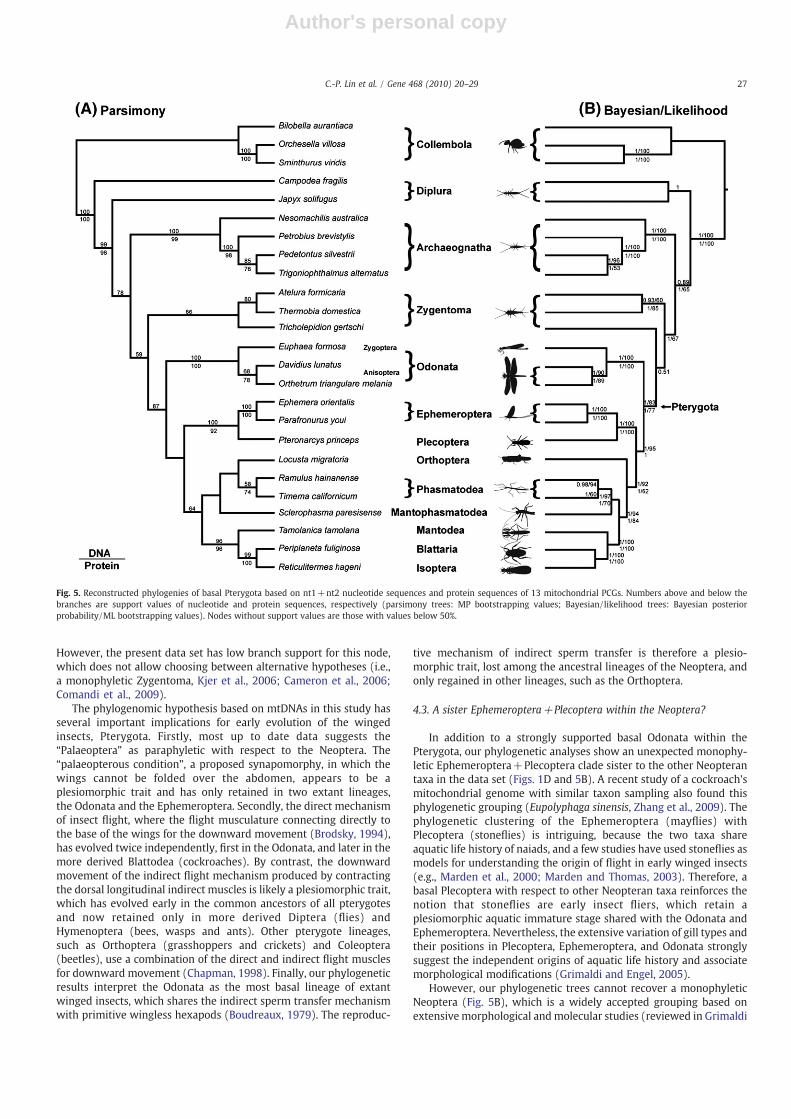
Saturation test results indicated that both the pairwise transi-tional and transversional differences in the nt3 codon positionsshow marked saturation early in sequence divergence. They wereexcluded from the subsequent analyses of nucleotide sequences toremove the phylogenetic noise from saturated changes in the nt3codon positions. Parsimony analyses of nt1 and nt2 codon positionsfound the most parsimonious tree (length=25,151), which recov-ered the same relationships as the parsimony bootstrap consensustree, except for E. formosa being sister to D. lunatus (Fig. 5A). Boththe most parsimonious and bootstrap consensus tree indicated themonophyly of the Odonata (PB=100%), and the Pterygota(PB=87%) and basal position of the Odonata within the Pterygota(PB b50%), followed by the Ephemeroptera+ Plecoptera(PB=100%). The resultant tree from the BI and ML analyses alsoshowed strong support for a monophyletic Pterygota (BPP=1,LB=83%), with a basal Odonata (BPP=1, LB=95%) and a sisterrelationship of the Ephemeroptera+Plecoptera (BPP=1,LB=100%) (Fig. 5B). Protein sequence analyses revealed largelythe same topology with high support values as that of nucleotidesequences (Fig. 5A and B), except that the most parsimonious treesof protein sequences did not recover a monophyletic Pterygota.Overall, the tree topologies of the parsimony and ML/BI analysesare similar except for the non-monophyletic Diplura (parsimony)
Fig. 2.Genemap and organization of themitochondrial genome of E. formosa. Transfer RNA genes on the genemap are labeled by the one-letter amino acid code corresponding to thetRNA (trn) designation in the table on the right; inc, intergenic nucleotides. Negative inc values are overlapping nucleotide sequences of different genes. The incomplete stop codonsare labeled with parentheses. The question mark represents doubtful start codon for nd1 gene. s1–s4, intergenic spacers.
24 C.-P. Lin et al. / Gene 468 (2010) 20–29
Author's personal copy
and Zygentoma (ML/BI), and the placement of the Orthoptera.Compared with the ML/BI analyses, the parsimony analyses ofprotein sequences in general lack bootstrap supports. Therefore, thephylogenetic relationships of the basal Pterygota based on the ML/BI trees (Fig. 5B) are discussed since they were supported by higherbootstrap values and posterior probability. Table 2 summarizes theresults of the phylogenetic hypotheses testing using the maximumlikelihood and tree topology constraints. All tests (AU, KH, SH, WKH,and WSH) significantly supported tree topology resulting from thisstudy, but failed to reject the Chiastomyaria hypothesis. Whereasthe statistical analyses rejected the hypotheses of Palaeoptera andMetapterygota, except the SH test for the Palaeoptera (Table 2).
4. Discussion
4.1. Mitochondrial genomes of the Odonata
The newly sequenced E. formosamt genome in the present study issimilar in gene number, gene arrangement, and nucleotide compo-sition compared to that of the other two available odonate species, aswell as to the mtDNA of the presumed ancestral hexapod (Figs. 2 and3) (Boore, 1999; Simon et al., 1994, 2006; Yamauchi et al., 2004).However, we found the presence of a unique spacer s1 in E. formosa(Zygoptera) and a s5 shared by O. triangulare melania and D. lunatus(Anisoptera) (Fig. 2), suggesting that the presence and absence ofintergenic spacers may contain potentially useful phylogeneticmarkers in resolving suborder relationships within the Odonata(e.g., Salvato et al., 2008). To investigate whether these spacers aretruly synapomorphies for the Zygoptera and Anisoptera, the phylo-
genetic range over which these intergenic spacers occur needs to bedetermined with additional odonate taxa, in particular the specieswithin the Zygoptera and Anisozygoptera. Previous analyses of insectnuclear rRNA genes showed an excessively slow nucleotide substitu-tion rate within the Odonata compared to other insect lineages, suchas Diplura and Diptera (Kjer et al., 2006; Misof et al., 2007; Whitfieldand Kjer, 2008). The present study found that the gene arrangement,nucleotide composition, and pattern of codon usage in mt genomesare similar across three odonate species of two suborders and threefamilies (Fig. 3), suggesting the conservation of mitochondrialgenome evolution within the Odonata. In contrast, other insectlineages frequently showed substantial intraordinal variation in genenumber or order (e.g., Shao et al., 2001, 2003; Dowton et al., 2003;Cameron et al., 2007; reviewed in Cameron et al., 2006). The relativelyslow rate of evolution in nuclear genes and conserved mt genomeevolution in odonates as compared to other insect lineages are likelylinked to lineage-specific purifying selective forces, life historycharacteristics, or demographic histories (Rand, 1994; Ballard andRand, 2005). However, this analysis is preliminary due to the lack ofmitochondrial genomes in other major odonate lineages.
4.2. Support for a Basal Odonata within the Pterygota
Resolving the long-standing “Palaeoptera problem” of the basalpterygotes is essential for interpreting the evolution of insect wingsand their subsequent rapid diversification in winged insect lineages.The mitochondrial nucleotide and protein sequences of thirteenPCGs employed in this study provide useful characters for resolvingphylogenetic relationships in the basal Pterygota. Our phylogenetic
Fig. 3. Codon usage in the three odonate mtDNAs. A. Total codon distribution, x-axis shows the codon families and y-axis refers to the total number of the codon; CDspT, codons perthousand codons. B. The Relative Synonymous Codon Usage (RSCU), the codon families are listed on the x-axis.
25C.-P. Lin et al. / Gene 468 (2010) 20–29
Author's personal copy
and statistical analyses cannot support the three existing phyloge-netic hypotheses of the basal Pterygota (Palaeoptera, Metapterygotaand Chiastomyaria). In contrast, the results of the present data setindicate an alternative hypothesis of a basal Odonata and a sisterrelationship of the Ephemeroptera+Plecoptera (Figs. 1D and 5).The basal Odonata within the Pterygota is strongly supported by LBand BPP of both nucleotide and protein sequences, and is consistentwith recent analyses of twenty-two basal hexapods based on twelvePCGs of mtDNAs (Zhang et al., 2009). However, our phylogeneticresult differs from an earlier mitogenomic analysis of the basal
pterygote insects that supported the Metapterygota (Zhang et al.,2008). Because the phylogenetic reconstruction methods used inour study and the study by Zhang et al., 2008 are comparable, thediscrepancy between the two data sets is most likely a result ofdifferences in sampled taxa or genes (twelve PCGs in Zhang et al.,2008). Our phylogenetic analyses also recovered a sister relation-ship between Tricholepidion gertschi (family Lepidotrichidae) andthe Pterygota (Fig. 5B). This phylogenetic placement of T. gertschiimplies a paraphyletic Zygentoma, a hypothesis suggested byanalyses of 18S rDNA sequences (Yoshizawa and Johnson, 2005).
Fig. 4. Putative secondary structures for the 22 tRNA genes of the E. formosa mtDNA. Black dots indicate mismatches of base pairs.
26 C.-P. Lin et al. / Gene 468 (2010) 20–29
Author's personal copy
However, the present data set has low branch support for this node,which does not allow choosing between alternative hypotheses (i.e.,a monophyletic Zygentoma, Kjer et al., 2006; Cameron et al., 2006;Comandi et al., 2009).
The phylogenomic hypothesis based on mtDNAs in this study hasseveral important implications for early evolution of the wingedinsects, Pterygota. Firstly, most up to date data suggests the“Palaeoptera” as paraphyletic with respect to the Neoptera. The“palaeopterous condition”, a proposed synapomorphy, in which thewings cannot be folded over the abdomen, appears to be aplesiomorphic trait and has only retained in two extant lineages,the Odonata and the Ephemeroptera. Secondly, the direct mechanismof insect flight, where the flight musculature connecting directly tothe base of the wings for the downward movement (Brodsky, 1994),has evolved twice independently, first in the Odonata, and later in themore derived Blattodea (cockroaches). By contrast, the downwardmovement of the indirect flight mechanism produced by contractingthe dorsal longitudinal indirect muscles is likely a plesiomorphic trait,which has evolved early in the common ancestors of all pterygotesand now retained only in more derived Diptera (flies) andHymenoptera (bees, wasps and ants). Other pterygote lineages,such as Orthoptera (grasshoppers and crickets) and Coleoptera(beetles), use a combination of the direct and indirect flight musclesfor downward movement (Chapman, 1998). Finally, our phylogeneticresults interpret the Odonata as the most basal lineage of extantwinged insects, which shares the indirect sperm transfer mechanismwith primitive wingless hexapods (Boudreaux, 1979). The reproduc-
tive mechanism of indirect sperm transfer is therefore a plesio-morphic trait, lost among the ancestral lineages of the Neoptera, andonly regained in other lineages, such as the Orthoptera.
4.3. A sister Ephemeroptera+Plecoptera within the Neoptera?
In addition to a strongly supported basal Odonata within thePterygota, our phylogenetic analyses show an unexpected monophy-letic Ephemeroptera+Plecoptera clade sister to the other Neopterantaxa in the data set (Figs. 1D and 5B). A recent study of a cockroach'smitochondrial genome with similar taxon sampling also found thisphylogenetic grouping (Eupolyphaga sinensis, Zhang et al., 2009). Thephylogenetic clustering of the Ephemeroptera (mayflies) withPlecoptera (stoneflies) is intriguing, because the two taxa shareaquatic life history of naiads, and a few studies have used stoneflies asmodels for understanding the origin of flight in early winged insects(e.g., Marden et al., 2000; Marden and Thomas, 2003). Therefore, abasal Plecoptera with respect to other Neopteran taxa reinforces thenotion that stoneflies are early insect fliers, which retain aplesiomorphic aquatic immature stage shared with the Odonata andEphemeroptera. Nevertheless, the extensive variation of gill types andtheir positions in Plecoptera, Ephemeroptera, and Odonata stronglysuggest the independent origins of aquatic life history and associatemorphological modifications (Grimaldi and Engel, 2005).
However, our phylogenetic trees cannot recover a monophyleticNeoptera (Fig. 5B), which is a widely accepted grouping based onextensivemorphological andmolecular studies (reviewed in Grimaldi
Fig. 5. Reconstructed phylogenies of basal Pterygota based on nt1+nt2 nucleotide sequences and protein sequences of 13 mitochondrial PCGs. Numbers above and below thebranches are support values of nucleotide and protein sequences, respectively (parsimony trees: MP bootstrapping values; Bayesian/likelihood trees: Bayesian posteriorprobability/ML bootstrapping values). Nodes without support values are those with values below 50%.
27C.-P. Lin et al. / Gene 468 (2010) 20–29
Author's personal copy
and Engel, 2005; Whitfield and Kjer, 2008). In this data set, the treebranch leading to the monophyly of the Ephemeroptera and allNeopteran taxa has low LB values on the protein sequences (Fig. 5B),suggesting that the non-monophyly of the Neoptera cannot bestrongly supported and needs further investigation. We suggest thatthe sister Ephemeroptera+Plecoptera clade recovered in this studymay be a result of taxon sampling at the base of the pterygotes.Sufficient and broad taxon sampling is an important factor inphylogenetic analyses of insect mitochondrial genomes. One usefulsampling approach is to increase the number of representative specieswithin the target taxa, and to exclude the highly divergent genomeswith variable genome rearrangements, elevated substitution rates, orbase compositional bias, which likely cause long branch attraction(Cameron et al., 2006). The unexpected phylogenetic hypothesis of asister Ephemeroptera+Plecoptera clade requires extended analyseswith additional mitochondrial genome sampling not only within thetargeted Ephemeroptera and Plecoptera, but also at the base of theNeoptera, particularly the missing intermediate mt genomes of thePolyneopteran, such as the Dermaptera (earwigs), Embioptera (webspinners), and Zoraptera (angel insects). Earlier studies of these insecttaxa have shown their phylogenetic affinity with the Plecoptera(Yoshizawa and Johnson, 2005; Kjer et al., 2006; Misof et al., 2007).
Supplementarymaterials related to this article can be found onlineat doi:10.1016/j.gene.2010.08.001.
Acknowledgments
Financial support for this study came from research grants of theNational Science Council of Taiwan to C-P. Lin (NSC 95-2311-B-029-002, and NSC 96-2311-B-029-002). We would like to thank J.G. Zhangand two anonymous reviewers for their helpful comments thatgreatly improved the manuscript.
References
Abascal, F., Zardoya, R., Posada, D., 2005. ProtTest: selection of best-fit models of proteinevolution. Bioinformatics 21, 2104–2105.
Abascal, F., Posada, D., Zardoya, R., 2007. MtArt: a newmodel of amino acid replacementfor Arthropoda. Mol. Biol. Evol. 24, 1–5.
Avise, J.C., 2004. Molecular Markers, Natural History, and Evolution. Sinauer Associates,Sunderland, MA, p. 684.
Ballard, J.W.O., Rand, D.M., 2005. The population biology of mitochondrial DNA and itsphylogenetic implications. Annu. Rev. Ecol. Evol. Syst. 36, 621–642.
Bechly, G., Brauckmann, C., Zessin, W., Gröning, E., 2001. New results concerning themorphology of the most ancient dragonflies (Insecta: Odonatoptera) from theNamurian of Hagen–Vorhalle (Germany). J. Zool. Syst. Evol. 39, 209–226.
Boore, J.L., 1999. Animal mitochondrial genomes. Nucleic Acids Res. 27, 1767–1780.Börner, C., 1904. Zur Systematik der Hexapoden. Zool. Anz. 27, 511–533.Boudreaux, H.B., 1979. Arthropod Phylogeny with Special Reference to Insects. Wiley,
New York, NY.Brodsky, A.K., 1994. The Evolution of Insect Flight. Oxford University Press, Oxford.Cameron, S.L., Whiting, M.F., 2007. Mitochondrial genomic comparisons of the
subterranean termites from the Genus Reticulitermes (Insecta: Isoptera: Rhino-termitidae). Genome 50, 188–202.
Cameron, S.L., Miller, K.B., D'Haese, C.A., Whiting, M.F., Barker, S.C., 2004. Mitochondrialgenome data alone are not enough to unambiguously resolve the relationships ofEntognatha, Insecta and Crustacea sensu lato (Arthropoda). Cladistics 20, 534–557.
Cameron, S.L., Beckenbach, A.T., Dowton, M., Whiting, M.F., 2006. Evidence frommitochondrial genomics on interordinal relationships in insects. Arthropod System.Phylogeny 64, 27–34.
Cameron, S.L., Johnson, K.P., Whiting, M.F., 2007. The mitochondrial genome of thescreamer louse Bothriometopus (Phthiraptera: Ischnocera): effects of extensivegene rearrangements on the evolution of the genome. J. Mol. Evol. 65, 589–604.
Carapelli, A., Nardi, F., Dallai, R., Boore, J.L., Lio, P., Frati, F., 2005. Relationships betweenhexapods and crustaceans based on four mitochondrial genes. Crustacea ArthropodRelat. 16, 295–306.
Carapelli, A., Nardi, F., Dallai, R., Frati, F., 2006. A review of molecular data for thephylogeny of basal hexapods. Pedobiologia 50, 191–204.
Carapelli, A., Liò, P., Nardi, F., van der Wath, E., Frati, F., 2007. Phylogenetic analysis ofmitochondrial protein coding genes confirms the reciprocal paraphyly of Hexapodaand Crustacea. BMC Evol. Biol. 7 (Suppl 2), S8.
Caterino, M.S., Cho, S., Sperling, F.A.H., 2000. The current state of insect molecularsystematics: a thriving Tower of Babel. Annu. Rev. Entomol. 45, 1–54.
Chapman, R.F., 1998. The Insects: Structure and Function. Cambridge University Press,Cambridge, UK.
Comandi, S., Carapelli, A., Podsiadlowski, L., Nardi, F., Frati, F., 2009. The completemitochondrial genome of Atelura formicaria (Hexapoda: Zygentoma) and thephylogenetic relationships of basal insects. Gene 439, 25–34.
Cook, C.E., Yue, Q., Akam, M., 2005. Mitochondrial genomes suggest that hexapods andcrustaceans are mutually paraphyletic. Proc. Biol. Sci. 272, 1295–1304.
Corbet, P.S., 1999. Dragonflies: Behavior and Ecology of Odonata. Cornell UniversityPress, Ithaca, NY.
Dowton, M., Castro, L.R., Campbell, S.L., Bargon, S.D., Austin, A.D., 2003. Frequentmitochondrial gene rearrangements at the hymenopteran nad3–nad5 junction. J.Mol. Evol. 56, 517–526.
Ellegren, H., 2008. Sequencing goes 454 and takes large-scale genomics into the wild.Mol. Ecol. 17, 1629–1631.
Engel, M.S., Grimaldi, D.A., 2004. New light shed on the oldest insect. Nature 427,627–630.
Feijao, P.C., Neiva, L.S., de Azeredo-Espin, A.M., Lessinger, A.C., 2006. AMiGA: thearthropodan mitochondrial genomes accessible database. Bioinformatics 22,902–903.
Fenn, J.D., Song, H., Cameron, S.L., Whiting, M., 2008. A preliminary mitochondrialgenome phylogeny of Orthoptera (Insecta) and approaches to maximizingphylogenetic signal found within mitochondrial genome data. Mol. Phylogenet.Evol. 49, 59–68.
Flook, P.K., Rowell, C.H., Gellissen, G., 1995. The sequence, organization, and evolutionof the Locusta migratoria mitochondrial genome. J. Mol. Evol. 41, 928–941.
Galtier, N., Nabholz, B., Glemin, S., Hurst, G.D.D., 2009. Mitochondrial DNA as a markerof molecular diversity: a reappraisal. Mol. Ecol. 18, 4541–4550.
Giribet, G., Ribera, C., 2000. A review of arthropod phylogeny: new data based onribosomal DNA sequences and direct character optimization. Cladistics 16, 204–223.
Gray, M.W., Burger, G., Lang, B.F., 1999. Mitochondrial evolution. Science 283,1476–1481.
Grimaldi, D.A., Engel, M.S., 2005. Evolution of the insects. Cambridge University Press,New York.
Guindon, S., Gascuel, O., 2003. A simple, fast, and accurate algorithm to estimate largephylogenies by maximum likelihood. Syst. Biol. 52, 696–704.
Harrison, R.G., 1989. Mitochondrial DNA as a genetic marker in population andevolutionary biology. Trends Ecol. Evol. 4, 6–11.
Hassanin, A., Léger, N., Deutsch, J., 2005. Evidence for multiple reversals ofasymmetric mutational constraints during the evolution of the mitochondrialgenome of Metazoa, and consequences for phylogenetic inferences. Syst. Biol. 54,277–298.
Hennig, W., 1981. Insect Phylogeny. John Wiley & Sons Press, New York, NY.Hovmöller, R., Pape, T., Källersjö, M., 2002. The Palaeoptera problem: basal pterygote
phylogeny inferred from 18S and 28S rDNA sequences. Cladistics 18, 313–323.Hua, J., Li, M., Dong, P., Cui, Y., Xie, Q., Bu, W., 2008. Comparative and phylogenomic
studies on the mitochondrial genomes of Pentatomomorpha (Insecta: Hemiptera:Heteroptera). BMC Genomics 9, 610.
Huelsenbeck, J.P., Ronquist, F.R., 2001. MrBayes: Bayesian inference of phylogeny.Biometrics 17, 754–755.
Kjer, K.M., 2004. Aligned 18S and insect phylogeny. Syst. Biol. 53, 506–514.Kjer, K.M., Carle, F.L., Litman, J., Ware, J., 2006. A molecular phylogeny of Hexapoda.
Arthropod System. Phylogeny 64, 35–44.Kristensen, N.P., 1981. Phylogeny of insect orders. Annu. Rev. Entomol. 26, 135–157.Kristensen, N.P., 1991. Phylogeny of extant hexapods. In: Naumann, I.D., Lawrence, J.F.,
Nielsen, E.S., Spradberry, J.P., Taylor, R.W., Whitten, M.J., Littlejohn, M.J. (Eds.), TheInsects of Australia: a Textbook for Students and Researcher Workers. CSIRO,Melbourne University Press, Melbourne, pp. 125–140.
Kukalová-Peck, J., 1991. Fossil history and the evolution of hexapod structures. In:Naumann, I.D., Lawrence, J.F., Nielsen, E.S., Spradberry, J.P., Taylor, R.W., Whitten,M.J., Littlejohn, M.J. (Eds.), The Insects of Australia: a Textbook for Students andResearcher Workers. CSIRO, Melbourne University Press, pp. 141–179.
Lee, W., et al., 2009. IMGD: an integrated platform supporting comparative genomicsand phylogenetics of insect mitochondrial genomes. BMC Genomics 10, 148.
Lee, E.M., et al., 2010. The complete mitogenome sequences of the palaeopteran insectsEphemera orientalis (Ephemeroptera: Ephemeridae) and Davidius lunatus (Odo-nata: Gomphidae). Genome 52, 810–817.
Lin, C.-P., Danforth, B.N., 2004. How do insect nuclear and mitochondrial genesubstitution patterns differ? Insights from Bayesian analyses of combined data sets.Mol. Phylogenet. Evol. 30, 686–702.
Lin, C.-P., Wood, T.K., 2002. Molecular phylogeny of the North American Enchenopa binotata(Homoptera: Membracidae) species complex. Ann. Entomol. Soc. Am. 95, 162–171.
Maddison, W.P., Maddison, D.R., 2000. MacClade, version 4.06. Sinauer Associates,Sunderland, MA.
Marden, J.H., Thomas, M.A., 2003. Rowing locomotion by a stonefly that possesses theancestral pterygote condition of co-occurring wings and abdominal gills. Biol. J.Linn. Soc. 79, 341–349.
Marden, J.H., O'Donnell, B.C., Thomas, M.A., Bye, J.Y., 2000. Surface-skimming stonefliesand mayflies: the taxonomic and mechanical diversity of two-dimensionalaerodynamic locomotion. Physiol. Biochem. Zool. 73, 751–764.
Martynov, A.V., 1925. Über zwei Grundtypen der Flügel bei den Insekten und ihreEvolution. Z. Morphol. Ökol. Tiere 4, 465–501.
Matsuda, R., 1970. Morphology and evolution of the insect thorax. Mem. Entomol. Soc.Can. 76, 1–431.
Misof, B., Niehuis, O., Bischoff, I., Rickert, A., Erpenbeck, D., Staniczek, A., 2007. Towardsan 18S phylogeny of hexapods: accounting for group-specific character covariancein optimized mixed nucleotide/doublet models. Zoology 110, 409–429.
Nardi, F., Spinsanti, G., Boore, J.L., Carapelli, A., Dallai, R., Frati, F., 2003. Hexapod origins:monophyletic or paraphyletic? Science 299, 1887–1889.
28 C.-P. Lin et al. / Gene 468 (2010) 20–29
Author's personal copy
Ogden, T.H., Whiting, M.F., 2003. The problemwith “the Paleoptera problem” sense andsensitivity. Cladistics 19, 432–442.
Podsiadlowski, L., 2006. Themitochondrial genome of the bristletail Petrobius brevistylis(Archaeognatha: Machilidae). Insect Mol. Biol. 15, 253–258.
Podsiadlowski, L., et al., 2006. The mitochondrial genomes of Campodea fragilis andCampodea lubbocki (Hexapoda: Diplura): high genetic divergence in a morpho-logically uniform taxon. Gene 381, 49–61.
Posada, D., Crandall, K.A., 1998. MODELTEST: testing the model of DNA substitution.Bioinformatics 14, 817–818.
Rand, D.M., 1994. Thermal habit, metabolic rate and the evolution of mitochondrialDNA. TREE 9, 125–131.
Rubinoff, D., 2006. Utility of Mitochondrial DNA barcodes in species conservation.Conserv. Biol. 20, 1026–1033.
Salvato, P., Simonato, M., Battisti, A., Negrisolo, E., 2008. The complete mitochondrialgenome of the bag-shelter moth Ochrogaster lunifer (Lepidoptera, Notodontidae).BMC Genomics 9, 331.
Schorr, M., Lindeboom, M., Paulson, D.R., 2008. World Odonata List. http://www.ups.edu/x6140.xml (ver. September 2008).
Schwanwitsch, B.N., 1943. Subdivision of Insecta Pterygota into subordinate groups.Nature 152, 727–728.
Shao, R., Campbell, N.J.H., Schmidt, E.R., Barker, S.C., 2001. Increased rate of generearrangement in the mitochondrial genomes of insects in three hemipteroidorders. Mol. Biol. Evol. 18, 1828–1832.
Shao, R., Dowton, M., Murrell, A., Barker, S.C., 2003. Rates of gene rearrangement andnucleotide substitution are correlated in the mitochondrial genomes of insects.Mol. Biol. Evol. 20, 1612–1619.
Shimodaira, H., Hasegawa, M., 2001. CONSEL: for assessing the confidence ofphylogenetic tree selection. Bioinformatics 17, 1246–1247.
Sikes, D.S., Lewis, P.O., 2000. PAUP Ratchet. University of Connecticut, Storrs, CT.Simon, C., Frati, F., Beckenbach, A., Crespi, B., Liu, H., Flook, P., 1994. Evolution,
weighting, and phylogenetic utility of mitochondrial gene sequences and acompilation of conserved polymerase chain reaction primers. Ann. Entomol. Soc.Am. 87, 651–701.
Simon, C., Buckley, T.R., Frati, F., Stewart, J.B., Beckenbach, A.T., 2006. Incorporatingmolecular evolution into phylogenetic analysis, and a new compilation ofconserved polymerase chain reaction primers for animal mitochondrial DNA.Ann. Rev. Ecol. Evol. Syst. 37, 545–579.
Simon, S., Strauss, S., von Haeseler, A., Hadrys, H., 2009. A phylogenomic approach toresolve the basal pterygote divergence. Mol. Biol. Evol. 26, 2719–2730.
Stamatakis, A., 2006. RAxML-VI-HPC: maximum likelihood-based phylogenetic analyseswith thousands of taxa and mixed models. Bioinformatics 22, 2688–2690.
Staniczek, A.H., 2000. The mandible of silverfish (Insecta: Zygentoma) and mayflies(Ephemeroptera): its morphology and phylogenetic significance. Zool. Anz. 239, 147–178.
Stewart, J.B., Beckenbach, A.T., 2006. Insect mitochondrial genomics 2: the completemitochondrial genome sequence of a giant stonefly, Pteronarcys princeps,asymmetric directional mutation bias, and conserved plecopteran A+T-regionelements. Genome 49, 815–824.
Swofford, D.L., 1998. PAUP*, version 4.0b10. Sinauer Associates, Sunderland, MA.Wheeler, W.C., Whiting, M.F., Wheeler, Q.D., Carpenter, J.C., 2001. Phylogeny of the
extant hexapod orders. Cladistics 17, 113–169.Whitfield, J.B., Kjer, K.M., 2008. Ancient rapid radiations of insects: challenges for
phylogenetic analysis. Annu. Rev. Entomol. 53, 449–472.Whiting, M.F., Carpenter, J.C., Wheeler, Q.D., Wheeler, W.C., 1997. The Strepsiptera
problem: phylogeny of the Holometabolous insect orders inferred from 18S and28S ribosomal DNA sequences and morphology. Syst. Biol. 46, 1–68.
Wyman, S.K., Jansen, R.K., Boore, J.L., 2004. Automatic annotation of organellar genomeswith DOGMA. Bioinformatics 20, 3252–3255.
Xia, X., Xie, Z., 2001. DAMBE: software package for data analysis in molecular biologyand evolution. J. Hered. 92, 371–373.
Yamauchi, M.M., Miya, M., Nishida, M., 2004. Use of a PCR-based approach for sequencingwhole mitochondrial genomes of insects: two examples (cockroach and dragonfly)based on the method developed for decapod crustaceans. Insect Mol. Biol. 13, 435–442.
Yoshizawa, K., Johnson, K.P., 2005. Aligned 18S for Zoraptera (Insecta): phylogeneticposition and molecular evolution. Mol. Phylogenet. Evol. 37, 572–580.
Zhang, J., Zhou, C., Gai, Y., Song, D., Zhou, K., 2008. The complete mitochondrial genomeof Parafronurus youi (Insecta: Ephemeroptera) and phylogenetic position of theEphemeroptera. Gene 424, 18–24.
Zhang, Y.-Y., Xuan, W.-J., Zhao, J.-L., Zhu, C.-D., Jiang, G.-F., 2009. The completemitochondrial genome of the cockroach Eupolyphaga sinensis (Blattaria: Poly-phagidae) and the phylogenetic relationships within the Dictyoptera. Mol. Biol.Rep. 37, 3509–3516.
Zwickl, D.J., 2006. Genetic algorithm approaches for the phylogenetic analysis of largebiological sequence datasets under the maximum likelihood criterion. Ph.D.dissertation, The University of Texas at Austin.
29C.-P. Lin et al. / Gene 468 (2010) 20–29