
ASTA Consumer and Agency Trends for International Members
55
1 Consumer and Agency Trends for International Members Melissa Teates ASTA’s Director of Research December 10, 2014
-
Upload
american-society-of-travel-agents -
Category
Travel
-
view
221 -
download
4
Transcript of ASTA Consumer and Agency Trends for International Members
1
Consumer and Agency Trends for International Members
Melissa Teates ASTA’s Director of Research December 10, 2014

2
What am I Covering?
U.S. Marketplace
Domestic Member Demographics & Trends
International Member Demographics
Highlights from ASTA’s Working with International Members Survey
International Travel Trends
Consumer Demographics &Trends
Tools for International Members
Finding ASTA Data
© ASTA 2014

3 © ASTA 2014
U.S. Marketplace
4
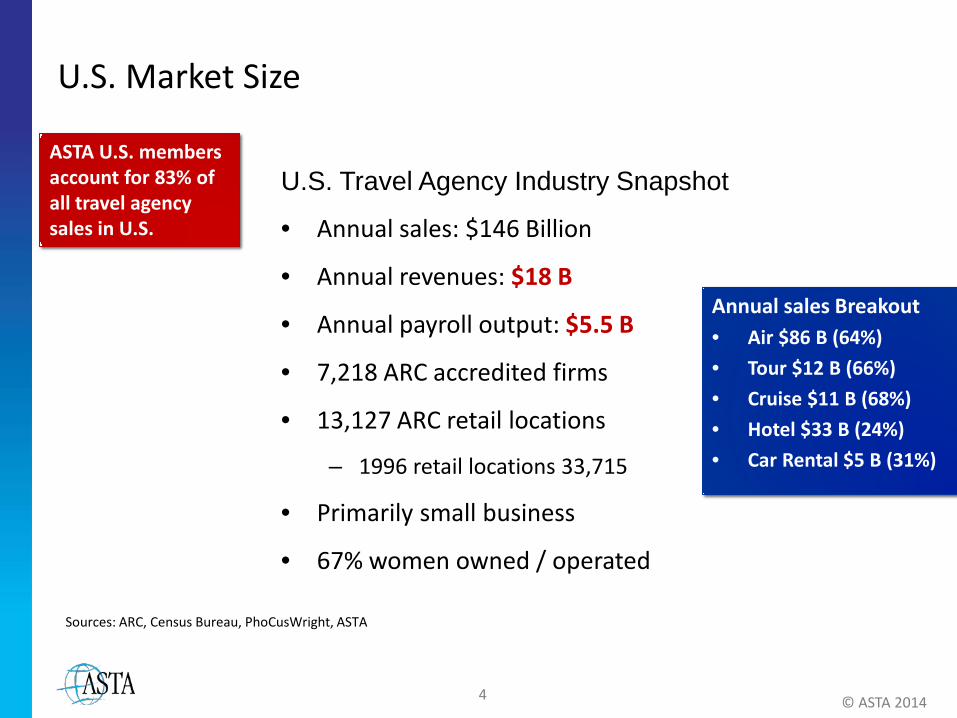
U.S. Market Size
Annual sales Breakout • Air $86 B (64%) • Tour $12 B (66%) • Cruise $11 B (68%) • Hotel $33 B (24%) • Car Rental $5 B (31%)
U.S. Travel Agency Industry Snapshot
• Annual sales: $146 Billion
• Annual revenues: $18 B
• Annual payroll output: $5.5 B
• 7,218 ARC accredited firms
• 13,127 ARC retail locations
– 1996 retail locations 33,715
• Primarily small business
• 67% women owned / operated
ASTA U.S. members account for 83% of all travel agency sales in U.S.
Sources: ARC, Census Bureau, PhoCusWright, ASTA
© ASTA 2014
5
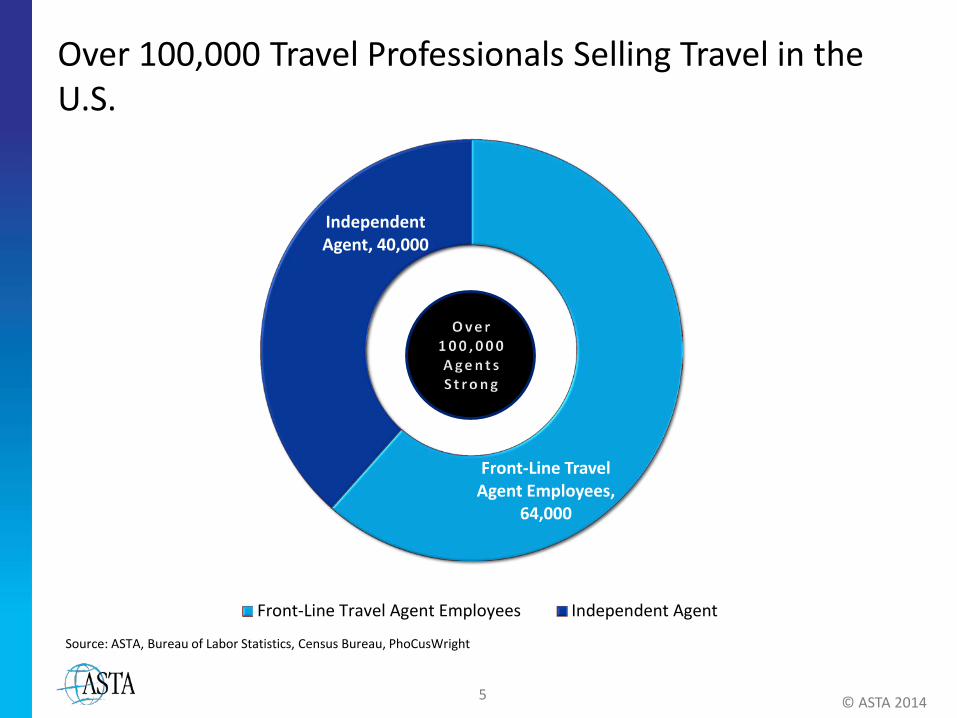
Over 100,000 Travel Professionals Selling Travel in the U.S.
Front-Line Travel Agent Employees,
64,000
Independent Agent, 40,000
Front-Line Travel Agent Employees Independent Agent
Source: ASTA, Bureau of Labor Statistics, Census Bureau, PhoCusWright
© ASTA 2014
6
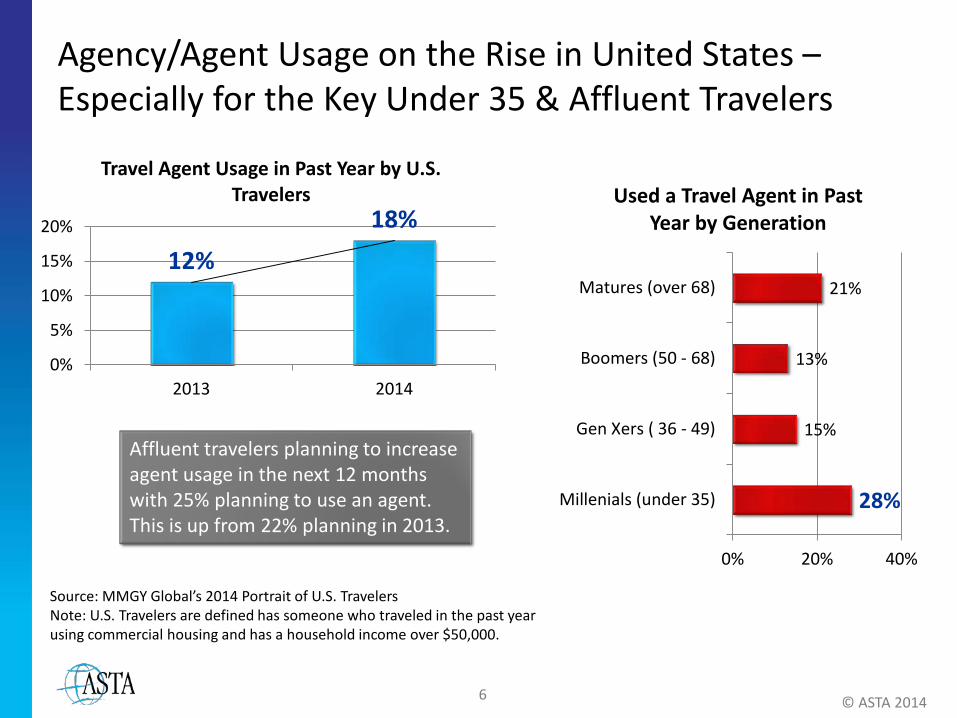
Agency/Agent Usage on the Rise in United States –Especially for the Key Under 35 & Affluent Travelers
12% 18%
0%
5%
10%
15%
20%
2013 2014
Travel Agent Usage in Past Year by U.S. Travelers
Source: MMGY Global’s 2014 Portrait of U.S. Travelers Note: U.S. Travelers are defined has someone who traveled in the past year using commercial housing and has a household income over $50,000.
28%
15%
13%
21%
0% 20% 40%
Millenials (under 35)
Gen Xers ( 36 - 49)
Boomers (50 - 68)
Matures (over 68)
Used a Travel Agent in Past Year by Generation
Affluent travelers planning to increase agent usage in the next 12 months with 25% planning to use an agent. This is up from 22% planning in 2013.
© ASTA 2014

7 © ASTA 2014
Domestic Member Demographics & Trends

8
Three Basic Business Models in the U.S.
16%
27%
13% 4%
35%
6%
Independent Agent (incl. ICs)
Airline
Cruise
Hotel
Car rental
Tour/Packages
Other
Source: ASTA Agency Profile
19%
29%
8% 3%
37%
5%
Retail Leisure Agency (70%+)
Airline
Cruise
Hotel
Car rental
Tour/Packages
Other
61%
8%
15%
6%
9%
1%
Corporate Agency (70%+)
Airline
Cruise
Hotel
Car rental
Tour/Packages
Other
© ASTA 2014
% of Sales per Travel Category

9
Importance of International Keeps Growing for U.S. Agencies
Domestic
International
0%
10%
20%
30%
40%
50%
60%
70%
80%
90%
100%
2004% Share
2005% Share
2006% Share
2007% Share
2008% Share
2009% Share
2010% Share
2011% Share
2012% Share
2013% Share
2014% Share
% S
hare
of T
rave
l Sal
es
Domestic International
Source: Agency Profile
© ASTA 2014
10
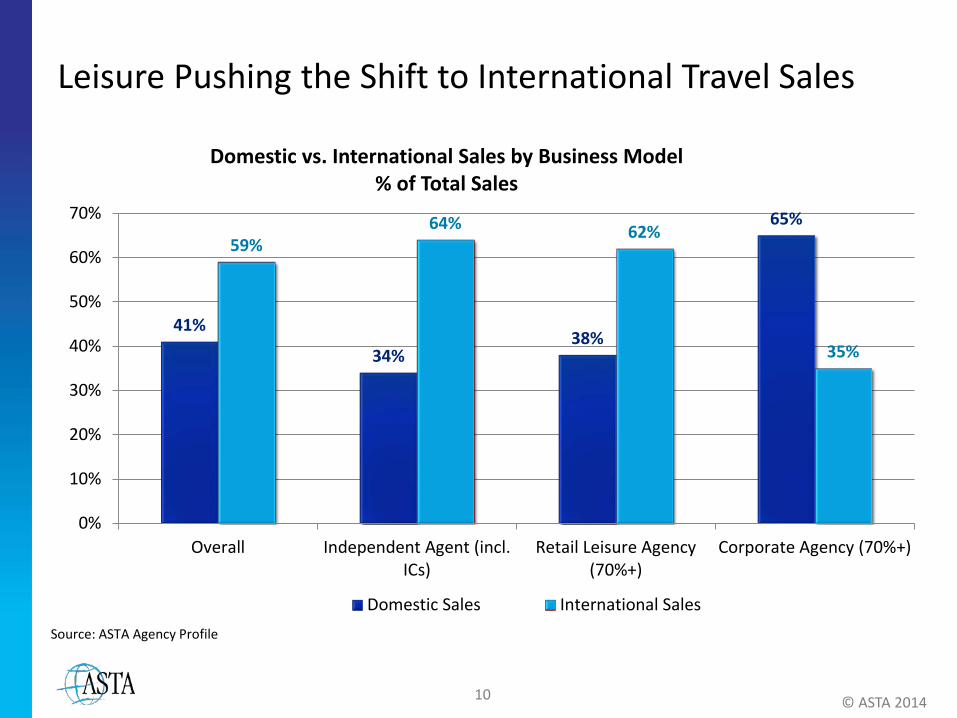
Leisure Pushing the Shift to International Travel Sales
41%
34% 38%
65% 59%
64% 62%
35%
0%
10%
20%
30%
40%
50%
60%
70%
Overall Independent Agent (incl.ICs)
Retail Leisure Agency(70%+)
Corporate Agency (70%+)
Domestic vs. International Sales by Business Model % of Total Sales
Domestic Sales International SalesSource: ASTA Agency Profile
© ASTA 2014

11
ASTA Domestic Members Are International Travelers Themselves
Average: 5 Countries Lifetime Average: 57 Countries
25%
25% 19%
21%
10%
Number of Countries Visited by ASTA Agents Last year
0-1 countries
2-3 countries
4-5 countries
5-10 countries
More than 10countries
10%
25%
24%
25%
16%
Number of Countries Visited by ASTA Agents in Lifetime
1-10 countries
10-25 countries
25-50 countries
50-100 countries
More than 100countries
Source: Agency Profile
© ASTA 2014

12
ASTA Agents Pointed All Over the World When Asked about the Hottest Travel Spots They Booked for 2014 Africa Buenos Aires East Africa Japan Peru St. Lucia Amman Cabo San Lucus Edinburgh Jerusalem Philippines Sweden Amsterdam Caernarfon, Wales England Johannesburg Playa del Carmen Switzerland Argentina Cambodia Europe Kenya Port of Spain (Trinidad) Sydney Aruba Canada Europe River Cruises Kuwait Portugal Tahiti Asia Cancun Florence London Prague Tanzania Asian Cruise Caribbean France Madrid Puerto Rico Taormina, Sicily Athens Caribbean Cruises Frankfurt Manila Puerto Vallarta Tel Aviv Australia Castries Galapagos Mediterranean Punta Cana Thailand Baghdad Cefalù, Sicily Germany Mediterranean Cruise Riviera Maya Tokyo Bahamas Central America Ghana Mexico Rome Turkey Baja Chilean Alps Great Britain Montego Bay Russia Turks & Caicos Bali Chile Greece Moscow San Juan United Kingdom Baltic China Guam Mumbai San Sebastian-Donostia Vancouver Barcelona Colombia Guatemala City, Guatemala Munich Santiago Venice Beijing Copenhagen Hawaii Nassau Scandinavia Vienna Belfast Costa Rica Helsinki Nepal Scotland Vietnam Belize Costa Rico Hong Kong New Zealand Seattle Virgin Isles Berlin Cozumel India Nigeria Seychelles Yerevan, Armenia Bermuda Croatia Indochina Northern Europe Sidney Bhutan Cruise Ireland Palermo, Sicily South Africa Botswana Dominican Republic Israel Pamplona South America Brazil Dubai Istanbul Panama South Pacific Islands British Isles Dublin Italy Paris Southeast Asia Budapest Dubrovnik, Croatia Jamaica Perth Spain
Source: ASTA’s Annual Hot Spots Survey
© ASTA 2014

13
Largest Group of Travel Agencies Report an Increase in Revenue, Transactions and Number of Clients
Revenue Transactions Number of ClientsTotal Decrease 26% 26% 17%Same 27% 30% 40%Total Increase 47% 45% 43%
26% 26%
17%
27% 30%
40%
47% 45% 43%
0%5%
10%15%20%25%30%35%40%45%50%
% S
hare
of R
espo
nses
Agency's 1st Half 2014 Compared to 1st Half 2013 for Revenue, Transactions and Number of Clients
Total Decrease Same Total IncreaseSource: ASTA’s ASTA Agency Sales & Revenue Trends Report
© ASTA 2014

14 © ASTA 2014
International Members Demographics
15
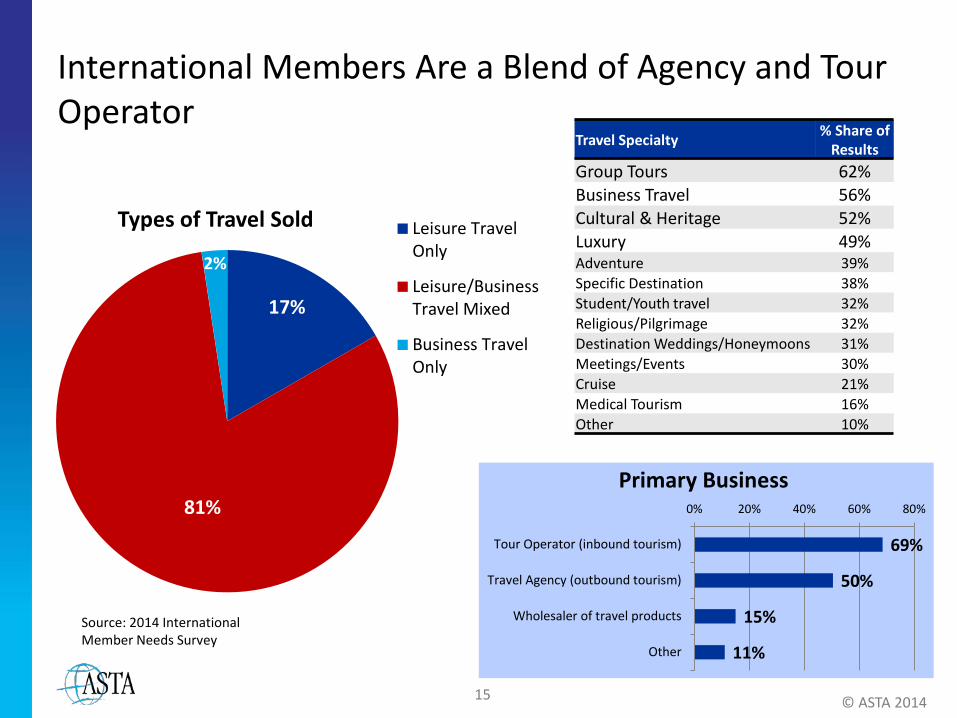
International Members Are a Blend of Agency and Tour Operator
17%
81%
2%
Types of Travel Sold Leisure TravelOnly
Leisure/BusinessTravel Mixed
Business TravelOnly
69%
50%
15%
11%
0% 20% 40% 60% 80%
Tour Operator (inbound tourism)
Travel Agency (outbound tourism)
Wholesaler of travel products
Other
Primary Business
Travel Specialty % Share of Results
Group Tours 62% Business Travel 56% Cultural & Heritage 52% Luxury 49% Adventure 39% Specific Destination 38% Student/Youth travel 32% Religious/Pilgrimage 32% Destination Weddings/Honeymoons 31% Meetings/Events 30% Cruise 21% Medical Tourism 16% Other 10%
Source: 2014 International Member Needs Survey
© ASTA 2014

16
International Members Mostly Reporting Positive Sales for 2013 and 2014 so far
62%
21%
17%
Sales in 2013
Sales Increased in 2013
Sales remained the Same 2013
Sales Decreased in 2013
53% 34%
13%
Sales in 1st Half of 2014
Sales have Increased in 2014 so far
Sales remained the Same 2014 sofar
Source: 2014 International Member Needs Survey
© ASTA 2014

17 © ASTA 2014
Highlights from ASTA’s Working with International Members Survey
18
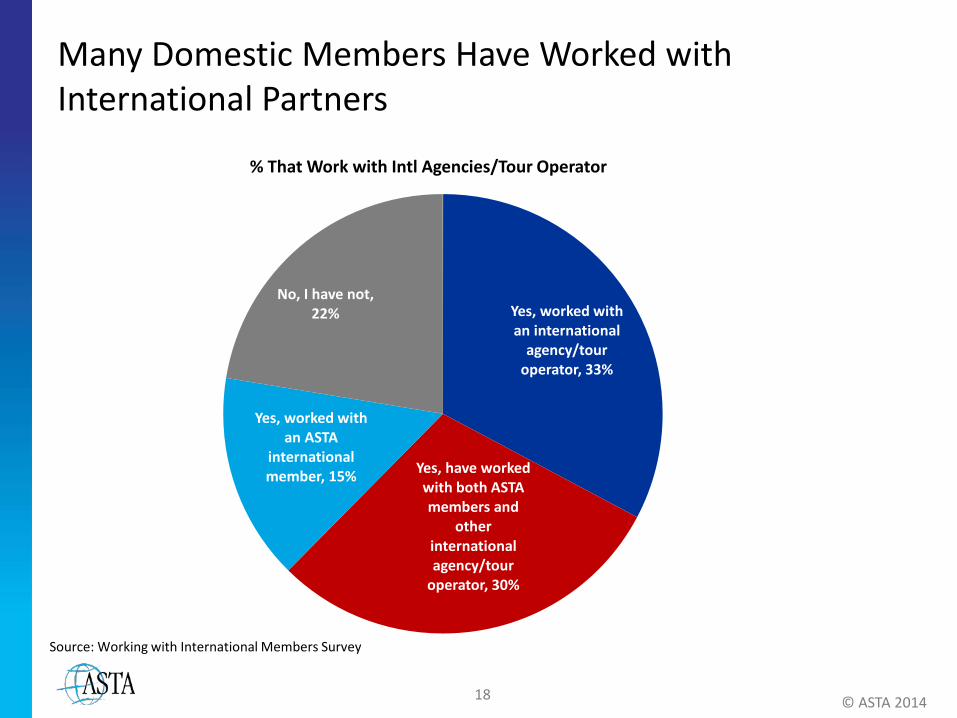
Many Domestic Members Have Worked with International Partners
© ASTA 2014
Yes, worked with an international
agency/tour operator, 33%
Yes, have worked with both ASTA members and
other international agency/tour
operator, 30%
Yes, worked with an ASTA
international member, 15%
No, I have not, 22%
% That Work with Intl Agencies/Tour Operator
Source: Working with International Members Survey
19
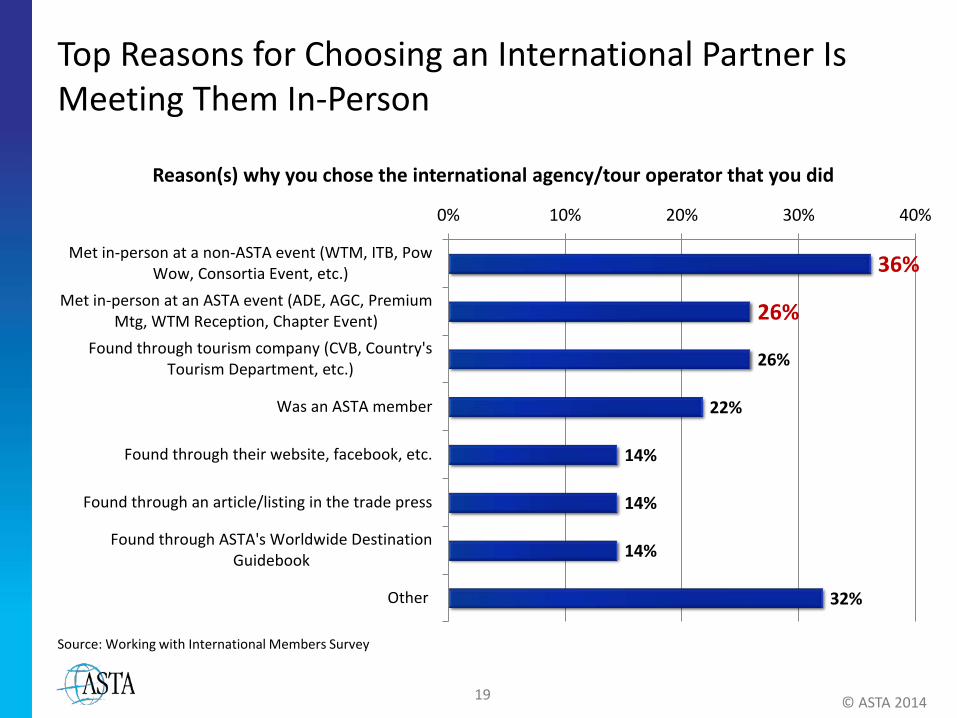
Top Reasons for Choosing an International Partner Is Meeting Them In-Person
© ASTA 2014
Source: Working with International Members Survey
36%
26%
26%
22%
14%
14%
14%
32%
0% 10% 20% 30% 40%
Met in-person at a non-ASTA event (WTM, ITB, PowWow, Consortia Event, etc.)
Met in-person at an ASTA event (ADE, AGC, PremiumMtg, WTM Reception, Chapter Event)
Found through tourism company (CVB, Country'sTourism Department, etc.)
Was an ASTA member
Found through their website, facebook, etc.
Found through an article/listing in the trade press
Found through ASTA's Worldwide DestinationGuidebook
Other
Reason(s) why you chose the international agency/tour operator that you did

20
Response Time and “Understanding of American Travelers” Important Features
© ASTA 2014
Source: Working with International Members Survey
88%
81% 68%
66%
55%
51%
51%
42%
40%
30%
15%
0% 20% 40% 60% 80% 100%
Reasonable response time to requests
Understanding of American travelers (air-conditioning,…
Contacts for 24 hour service issues (phone and email)
Can process credit cards securely
Having E&O insurance
References from other ASTA members
Written agreement on revenue sharing from commissions,…
Signed contract once agreement has been made
Disclosure of any past civil, criminal or regulatory issues
800 number
Other
Minimum features needed to work with an international agency/tour operator

21 © ASTA 2014
International Travel Trends
22
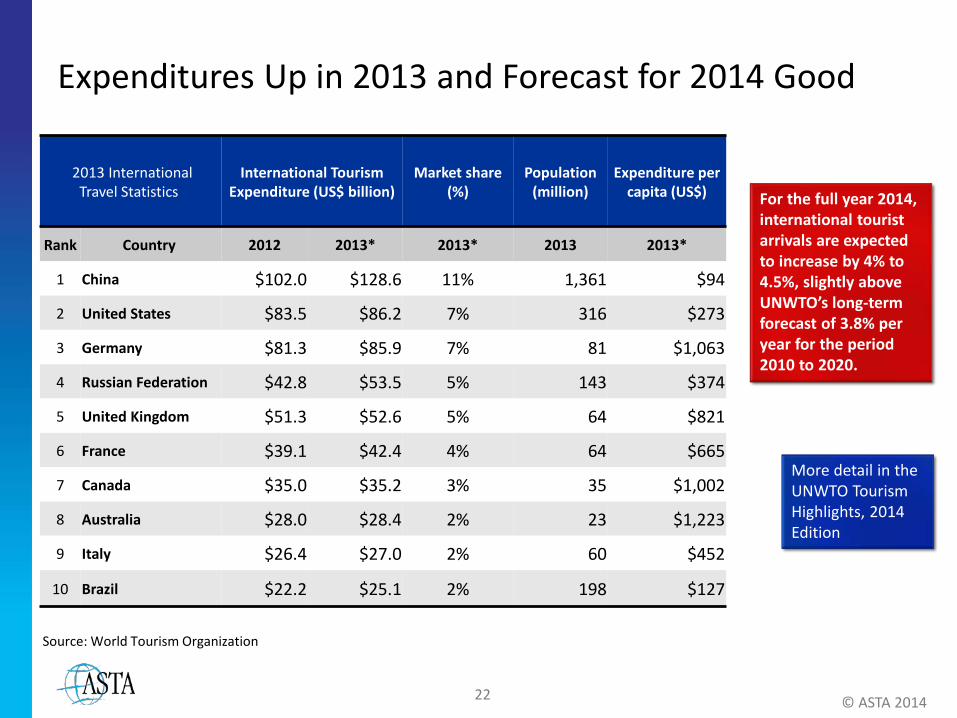
Expenditures Up in 2013 and Forecast for 2014 Good
2013 International Travel Statistics
International Tourism Expenditure (US$ billion)
Market share (%)
Population (million)
Expenditure per capita (US$)
Rank Country 2012 2013* 2013* 2013 2013*
1 China $102.0 $128.6 11% 1,361 $94
2 United States $83.5 $86.2 7% 316 $273
3 Germany $81.3 $85.9 7% 81 $1,063
4 Russian Federation $42.8 $53.5 5% 143 $374
5 United Kingdom $51.3 $52.6 5% 64 $821
6 France $39.1 $42.4 4% 64 $665
7 Canada $35.0 $35.2 3% 35 $1,002
8 Australia $28.0 $28.4 2% 23 $1,223
9 Italy $26.4 $27.0 2% 60 $452
10 Brazil $22.2 $25.1 2% 198 $127
For the full year 2014, international tourist arrivals are expected to increase by 4% to 4.5%, slightly above UNWTO’s long-term forecast of 3.8% per year for the period 2010 to 2020.
More detail in the UNWTO Tourism Highlights, 2014 Edition
© ASTA 2014
Source: World Tourism Organization

23
Europe, Caribbean & Asia Top Overseas Destinations for U.S. Travelers
2013 U.S. Resident Traveler Characteristics
All U.S. Travelers
For Vacation & Visiting Friends & Relatives
For Business & Convention
Total Number of Travelers 29,015,000 23,850,000 4,875,000 International Destinations Visited: Europe 35% 35% 39% United Kingdom 9% 9% 12% France 7% 7% 6% Italy 6% 7% 4% Germany 6% 6% 9% Spain 4% 4% 3% Ireland 3% 3% 1% Caribbean 25% 27% 13% Jamaica 6% 7% 2% South America 7% 7% 8% Peru 2% 2% 1% Central America 7% 7% 7% Africa 3% 3% 3% South Africa 1% 1% 1% Middle East 6% 6% 5% Israel 2% 2% 1% Asia 19% 17% 27% P.R. of China 4% 3% 8% India 4% 4% 3% Japan 3% 2% 5% Oceania 2% 2% 2%
Number of International Trips in the Past 12 Months Average Number of Trips: 2.6 Median Number of Trips: 2.0
© ASTA 2014
Source: Profile of U.S. Resident Travelers Visiting Overseas Destinations: 2013 Outbound (U.S. Department of Commerce)
24
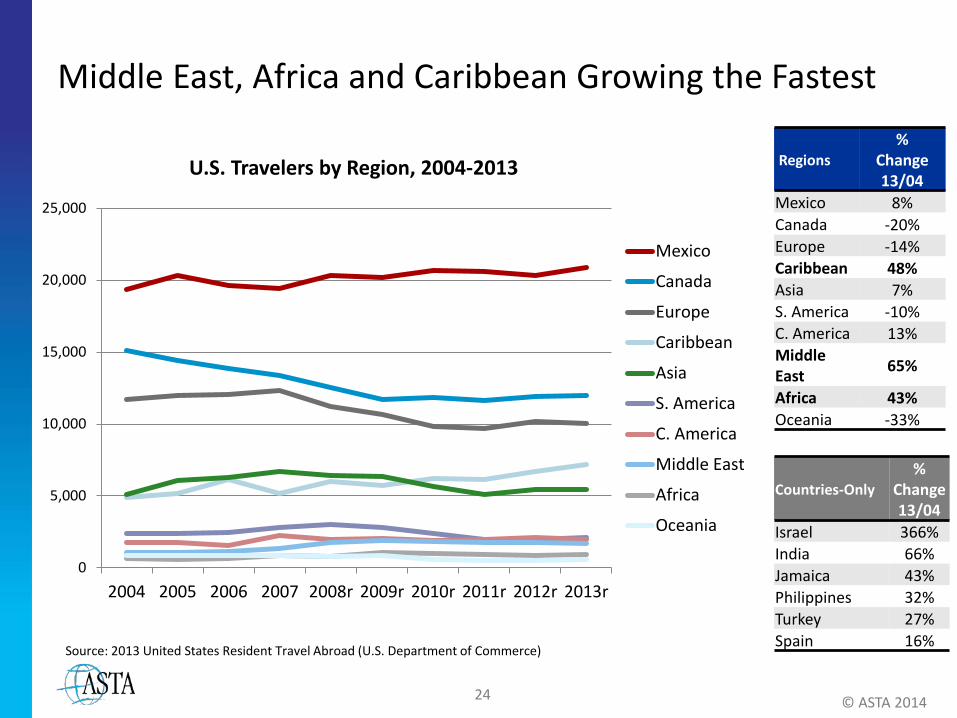
Middle East, Africa and Caribbean Growing the Fastest
© ASTA 2014
Source: 2013 United States Resident Travel Abroad (U.S. Department of Commerce)
0
5,000
10,000
15,000
20,000
25,000
2004 2005 2006 2007 2008r 2009r 2010r 2011r 2012r 2013r
U.S. Travelers by Region, 2004-2013
Mexico
Canada
Europe
Caribbean
Asia
S. America
C. America
Middle East
Africa
Oceania
Regions %
Change 13/04
Mexico 8% Canada -20% Europe -14% Caribbean 48% Asia 7% S. America -10% C. America 13% Middle East 65%
Africa 43% Oceania -33%
Countries-Only %
Change 13/04
Israel 366% India 66% Jamaica 43% Philippines 32% Turkey 27% Spain 16%

25
U.S. Travelers Mostly Travel for Vacation
U.S. Resident Traveler Characteristics All U.S. Travelers For Vacation & VFR For Business & Conv.
Main Purpose of Trip: Vacation/Holiday 50% 61% 4% Visit Friends/Relatives 27% 33% 4% Business 11% 2% 70% Education 5% 2% 1% Convention/Conference/Trade Show 3% 1% 21% Religion/Pilgrimages 2% 1% 0% Health Treatment 1% 0% 0% Type of Accommodations: Hotel, Motel 64% 61% 81% Average Number of Nights 10.4 8.9 10.3 Median Number of Nights 7.0 7.0 6.0 Private Home 41% 45% 22% Average Number of Nights 21.3 19.2 19.3 Median Number of Nights 13.0 12.0 9.0 Other 7% 7% 7% Mean Number of Nights 15.8 14.6 15.0 Median Number of Nights 7.0 7.0 8.0
© ASTA 2014
Source: Profile of U.S. Resident Travelers Visiting Overseas Destinations: 2013 Outbound (U.S. Department of Commerce)

26
Average Nights Overseas Are 18 days and Visiting 1.8 Destinations
2013 U.S. Resident Traveler Characteristics
All U.S. Travelers
For Vacation & Visiting Friends & Relatives
For Business & Convention
Nights Outside the U.S.: Average Number of Nights 18.1 16.6 15.5 Number of Countries Visited:
One Country 83% 82% 80% Two Countries 12% 12% 15% Three or More Countries 6% 6% 5% Average (Countries) 1.2 1.2 1.2 Number of Destinations Visited: One Destination 55% 54% 57% Two Destinations 24% 24% 26% Three or More Destinations 20% 22% 18% Average (No. of Destinations) 1.8 1.9 1.7
Source: Profile of U.S. Resident Travelers Visiting Overseas Destinations: 2013 Outbound (U.S. Department of Commerce)
© ASTA 2014

27
Sightseeing & Shopping Tops Leisure/Recreational Activities for U.S. Travelers
U.S. Resident Traveler Characteristics
All U.S. Travelers For Vacation & VFR For Business &
Conv. Sightseeing 79% 81% 70% Shopping 76% 78% 66% Small Towns/Countryside 43% 46% 27% Experience Fine Dining 40% 41% 41% Historical Locations 40% 41% 28% Guided Tours 37% 39% 21% Art Galleries/Museums 32% 33% 26% Cultural/Ethnic Heritage Sights 31% 33% 23% National Parks/Monuments 28% 30% 20% Nightclubbing/Dancing 24% 25% 19% Water Sports 20% 22% 9% Concert/Play/Musical 14% 14% 11% Casino/Gamble 10% 11% 6% Amusement/Theme Parks 9% 10% 6% Camping/Hiking 7% 8% 4% Environmental/Ecological Excursions 7% 7% 4% Sporting Event 7% 6% 5% Golfing/Tennis 4% 5% 5% Hunting/Fishing 4% 4% 3% Snow Sports 1% 1% 1%
© ASTA 2014
Source: Profile of U.S. Resident Travelers Visiting Overseas Destinations: 2013 Outbound (U.S. Department of Commerce)
28
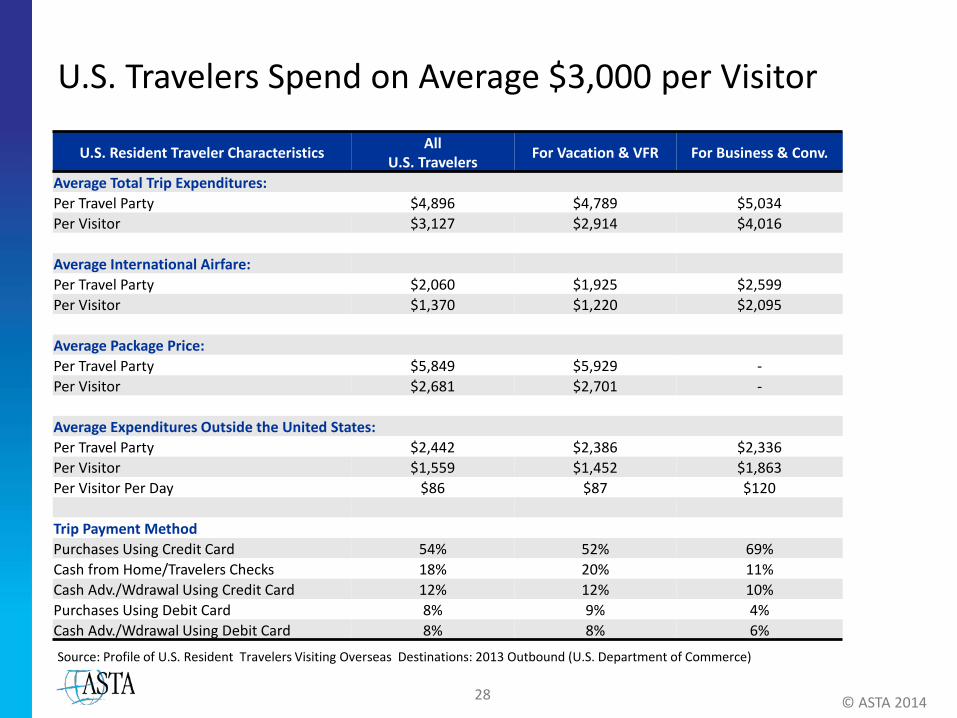
U.S. Travelers Spend on Average $3,000 per Visitor
U.S. Resident Traveler Characteristics All U.S. Travelers For Vacation & VFR For Business & Conv.
Average Total Trip Expenditures: Per Travel Party $4,896 $4,789 $5,034 Per Visitor $3,127 $2,914 $4,016 Average International Airfare: Per Travel Party $2,060 $1,925 $2,599 Per Visitor $1,370 $1,220 $2,095 Average Package Price: Per Travel Party $5,849 $5,929 - Per Visitor $2,681 $2,701 - Average Expenditures Outside the United States: Per Travel Party $2,442 $2,386 $2,336 Per Visitor $1,559 $1,452 $1,863 Per Visitor Per Day $86 $87 $120 Trip Payment Method Purchases Using Credit Card 54% 52% 69% Cash from Home/Travelers Checks 18% 20% 11% Cash Adv./Wdrawal Using Credit Card 12% 12% 10% Purchases Using Debit Card 8% 9% 4% Cash Adv./Wdrawal Using Debit Card 8% 8% 6%
© ASTA 2014
Source: Profile of U.S. Resident Travelers Visiting Overseas Destinations: 2013 Outbound (U.S. Department of Commerce)
29
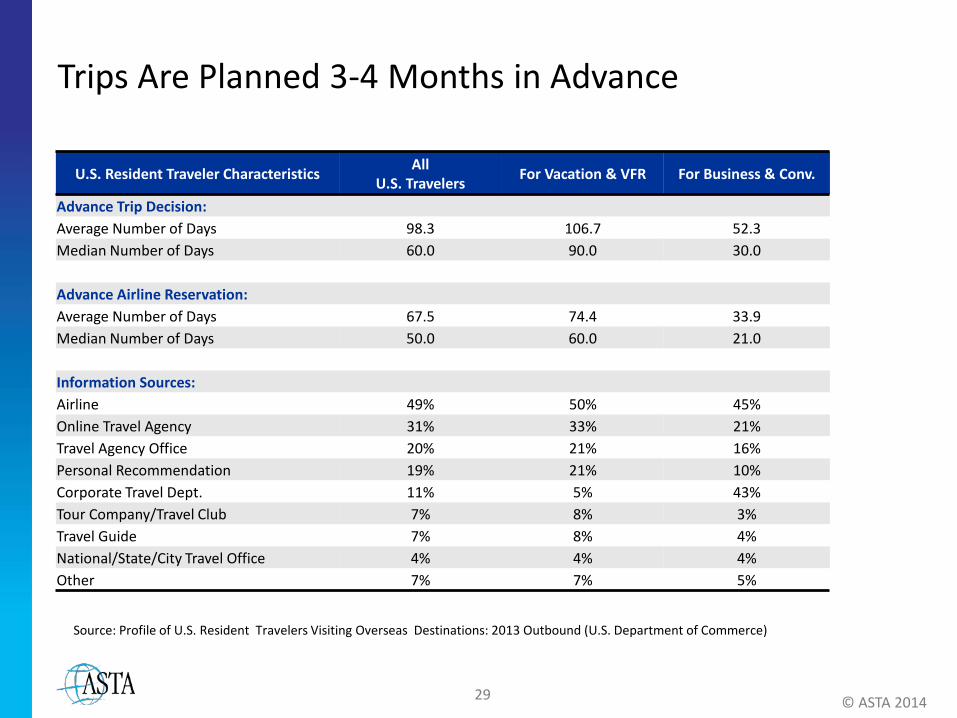
Trips Are Planned 3-4 Months in Advance
U.S. Resident Traveler Characteristics All U.S. Travelers For Vacation & VFR For Business & Conv.
Advance Trip Decision: Average Number of Days 98.3 106.7 52.3 Median Number of Days 60.0 90.0 30.0 Advance Airline Reservation: Average Number of Days 67.5 74.4 33.9 Median Number of Days 50.0 60.0 21.0 Information Sources: Airline 49% 50% 45% Online Travel Agency 31% 33% 21% Travel Agency Office 20% 21% 16% Personal Recommendation 19% 21% 10% Corporate Travel Dept. 11% 5% 43% Tour Company/Travel Club 7% 8% 3% Travel Guide 7% 8% 4% National/State/City Travel Office 4% 4% 4% Other 7% 7% 5%
© ASTA 2014
Source: Profile of U.S. Resident Travelers Visiting Overseas Destinations: 2013 Outbound (U.S. Department of Commerce)
30
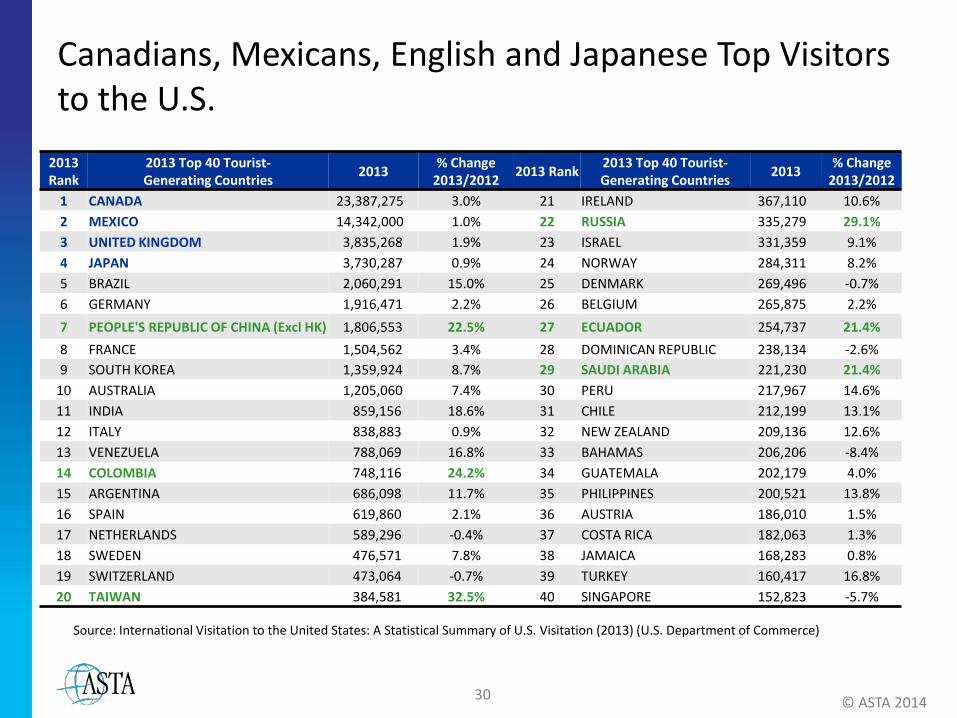
Canadians, Mexicans, English and Japanese Top Visitors to the U.S.
2013 Rank
2013 Top 40 Tourist- Generating Countries 2013 % Change
2013/2012 2013 Rank 2013 Top 40 Tourist- Generating Countries 2013 % Change
2013/2012 1 CANADA 23,387,275 3.0% 21 IRELAND 367,110 10.6% 2 MEXICO 14,342,000 1.0% 22 RUSSIA 335,279 29.1% 3 UNITED KINGDOM 3,835,268 1.9% 23 ISRAEL 331,359 9.1% 4 JAPAN 3,730,287 0.9% 24 NORWAY 284,311 8.2% 5 BRAZIL 2,060,291 15.0% 25 DENMARK 269,496 -0.7% 6 GERMANY 1,916,471 2.2% 26 BELGIUM 265,875 2.2%
7 PEOPLE'S REPUBLIC OF CHINA (Excl HK) 1,806,553 22.5% 27 ECUADOR 254,737 21.4% 8 FRANCE 1,504,562 3.4% 28 DOMINICAN REPUBLIC 238,134 -2.6% 9 SOUTH KOREA 1,359,924 8.7% 29 SAUDI ARABIA 221,230 21.4%
10 AUSTRALIA 1,205,060 7.4% 30 PERU 217,967 14.6% 11 INDIA 859,156 18.6% 31 CHILE 212,199 13.1% 12 ITALY 838,883 0.9% 32 NEW ZEALAND 209,136 12.6% 13 VENEZUELA 788,069 16.8% 33 BAHAMAS 206,206 -8.4% 14 COLOMBIA 748,116 24.2% 34 GUATEMALA 202,179 4.0% 15 ARGENTINA 686,098 11.7% 35 PHILIPPINES 200,521 13.8% 16 SPAIN 619,860 2.1% 36 AUSTRIA 186,010 1.5% 17 NETHERLANDS 589,296 -0.4% 37 COSTA RICA 182,063 1.3% 18 SWEDEN 476,571 7.8% 38 JAMAICA 168,283 0.8% 19 SWITZERLAND 473,064 -0.7% 39 TURKEY 160,417 16.8% 20 TAIWAN 384,581 32.5% 40 SINGAPORE 152,823 -5.7%
© ASTA 2014
Source: International Visitation to the United States: A Statistical Summary of U.S. Visitation (2013) (U.S. Department of Commerce)

31 © ASTA 2014
Consumer Demographics & Trends

32 © ASTA 2014
Leisure Travelers
33
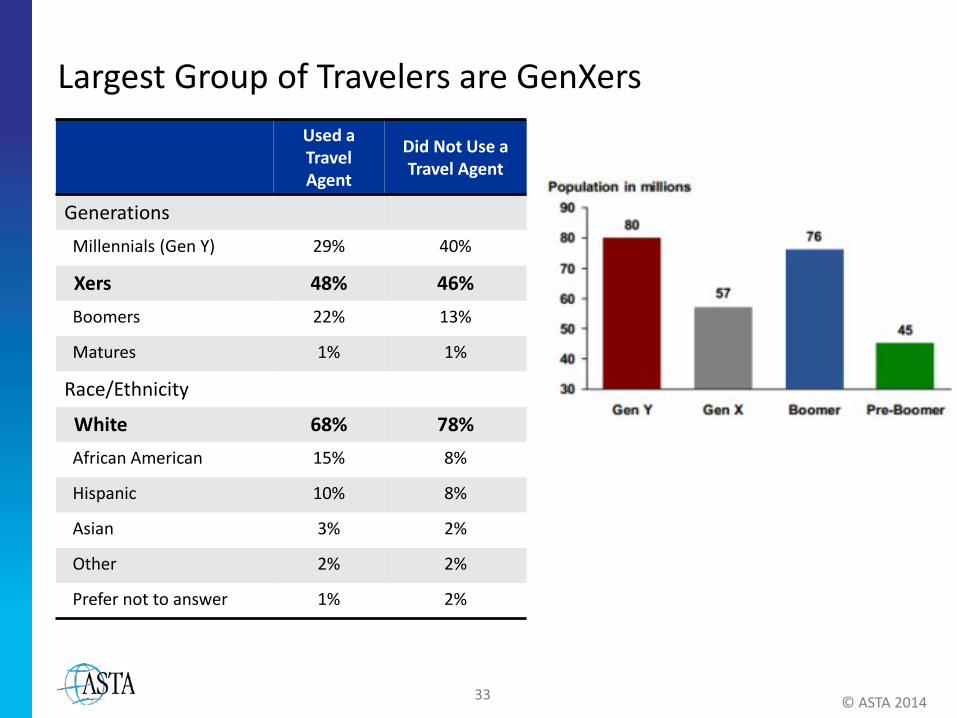
Largest Group of Travelers are GenXers
Used a Travel Agent
Did Not Use a Travel Agent
Generations Millennials (Gen Y) 29% 40%
Xers 48% 46% Boomers 22% 13%
Matures 1% 1%
Race/Ethnicity
White 68% 78% African American 15% 8%
Hispanic 10% 8%
Asian 3% 2%
Other 2% 2%
Prefer not to answer 1% 2%
© ASTA 2014

34
Travelers Are Mostly Married and in the Lower Incomes Used a Travel Agent Did Not Use a Travel Agent
Household Income $50,000 - $74,999 25% 30% $75,000 -$99,000 26% 25% $100,000 - $124,999 19% 18%
$125,000 - $149,999 11% 11%
$150,000 - $249,999 13% 12%
$250,000 - $499,999 4% 4%
$500,000 or more 2% 1%
Marital Status Married 70% 69% Separated 1% 1% Divorced 9% 9% Widowed 4% 2% Unmarried couple living together 4% 8% Never married 12% 11%
Children currently in household Yes 31% 36%
© ASTA 2014
35
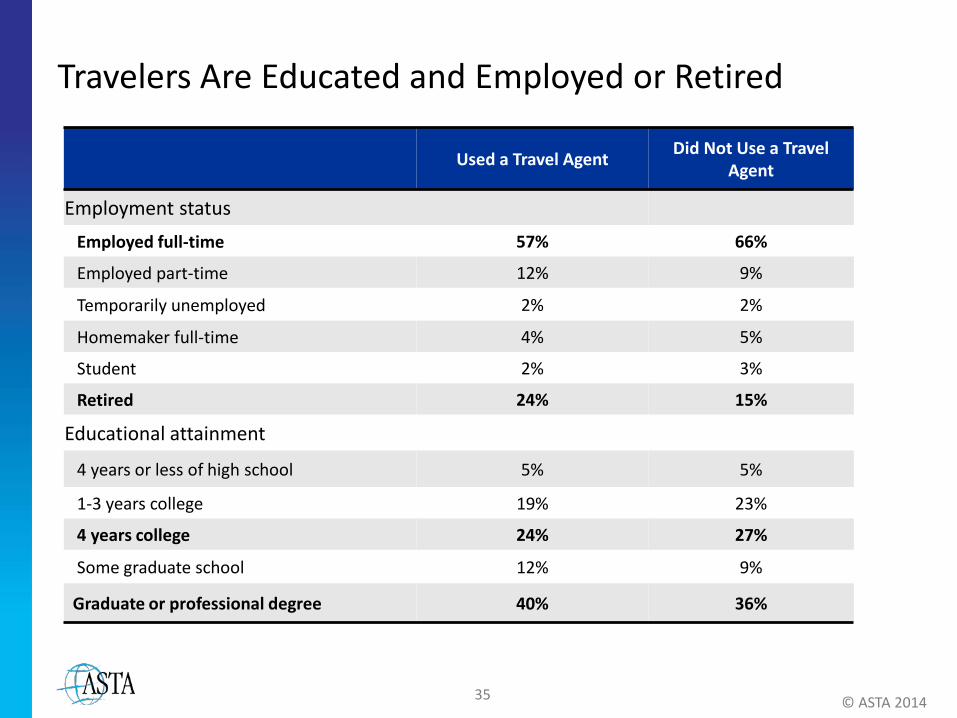
Travelers Are Educated and Employed or Retired
Used a Travel Agent Did Not Use a Travel Agent
Employment status
Employed full-time 57% 66%
Employed part-time 12% 9%
Temporarily unemployed 2% 2%
Homemaker full-time 4% 5%
Student 2% 3%
Retired 24% 15%
Educational attainment
4 years or less of high school 5% 5%
1-3 years college 19% 23%
4 years college 24% 27%
Some graduate school 12% 9%
Graduate or professional degree 40% 36%
© ASTA 2014
36
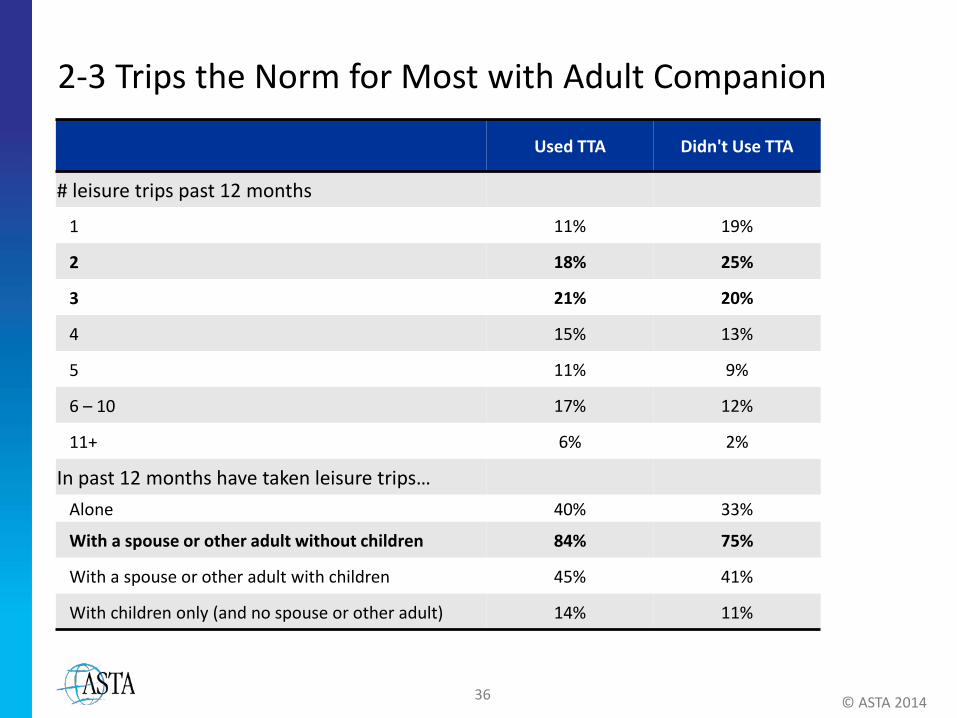
2-3 Trips the Norm for Most with Adult Companion
Used TTA Didn't Use TTA
# leisure trips past 12 months
1 11% 19%
2 18% 25%
3 21% 20%
4 15% 13%
5 11% 9%
6 – 10 17% 12%
11+ 6% 2%
In past 12 months have taken leisure trips… Alone 40% 33%
With a spouse or other adult without children 84% 75%
With a spouse or other adult with children 45% 41%
With children only (and no spouse or other adult) 14% 11%
© ASTA 2014

37
Top Attributes Remain the Same for All Three Generations Desirable vacation attributes Millennials Xers Boomers
Safety of the destination 88% 93% 88% A place I have never visited before 84% 87% 88% Overall ease of getting to the destination 82% 87% 82% Guided tours with access to local experiences that would otherwise be unknown or inaccessible 78% 84% 83% A beach experience 77% 71% 50% Participation in unique guest experiences that reflect local culture 76% 79% 75% An all-inclusive resort package (one that includes accommodations, food, beverage and recreation) 71% 67% 50% Guided tours that allow you to experience local cuisine and customs 71% 71% 74% An opportunity to eat different and unusual cuisines 70% 76% 70% Nightlife and entertainment 54% 52% 41% Going to a destination spa that offers complete spa and wellness programs 52% 40% 23% Hiking/climbing or other outdoor adventure 50% 41% 28% Learning a new skill or activity 48% 45% 35% Going to theme parks 47% 32% 16% Attending performing arts events 44% 64% 66% A place I have visited before 31% 39% 37% Casino gambling 25% 24% 22% Snow skiing/snowboarding 19% 11% 7% Playing golf 11% 18% 15%
© ASTA 2014
38
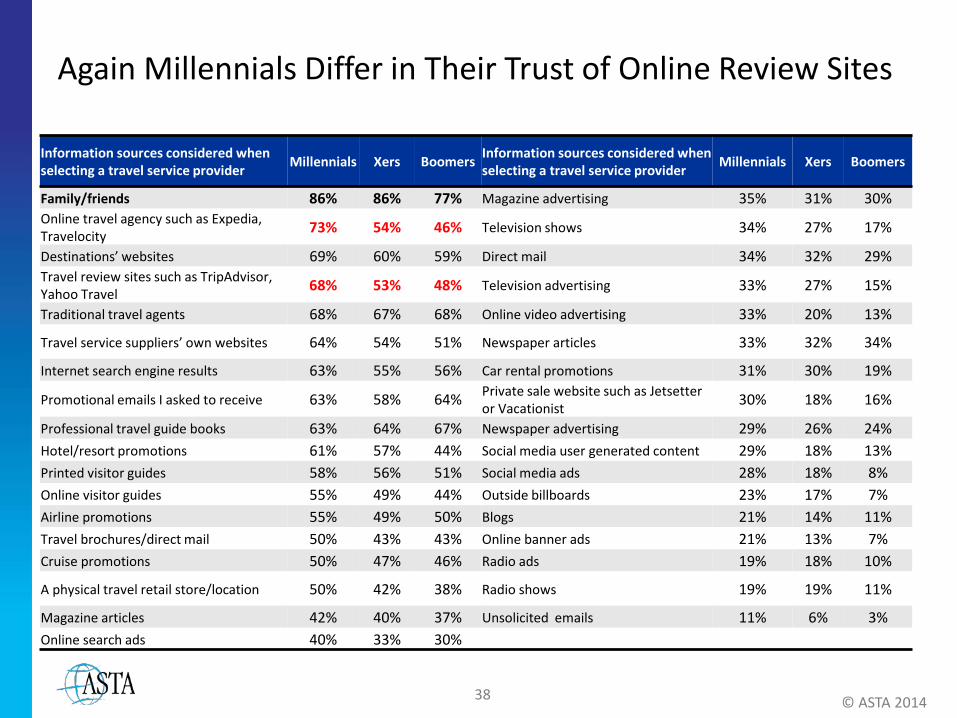
Again Millennials Differ in Their Trust of Online Review Sites
Information sources considered when selecting a travel service provider Millennials Xers Boomers Information sources considered when
selecting a travel service provider Millennials Xers Boomers
Family/friends 86% 86% 77% Magazine advertising 35% 31% 30% Online travel agency such as Expedia, Travelocity 73% 54% 46% Television shows 34% 27% 17%
Destinations’ websites 69% 60% 59% Direct mail 34% 32% 29% Travel review sites such as TripAdvisor, Yahoo Travel 68% 53% 48% Television advertising 33% 27% 15%
Traditional travel agents 68% 67% 68% Online video advertising 33% 20% 13%
Travel service suppliers’ own websites 64% 54% 51% Newspaper articles 33% 32% 34%
Internet search engine results 63% 55% 56% Car rental promotions 31% 30% 19%
Promotional emails I asked to receive 63% 58% 64% Private sale website such as Jetsetter or Vacationist 30% 18% 16%
Professional travel guide books 63% 64% 67% Newspaper advertising 29% 26% 24% Hotel/resort promotions 61% 57% 44% Social media user generated content 29% 18% 13% Printed visitor guides 58% 56% 51% Social media ads 28% 18% 8% Online visitor guides 55% 49% 44% Outside billboards 23% 17% 7% Airline promotions 55% 49% 50% Blogs 21% 14% 11% Travel brochures/direct mail 50% 43% 43% Online banner ads 21% 13% 7% Cruise promotions 50% 47% 46% Radio ads 19% 18% 10%
A physical travel retail store/location 50% 42% 38% Radio shows 19% 19% 11%
Magazine articles 42% 40% 37% Unsolicited emails 11% 6% 3% Online search ads 40% 33% 30%
© ASTA 2014

39 © ASTA 2014
Business Travelers
40
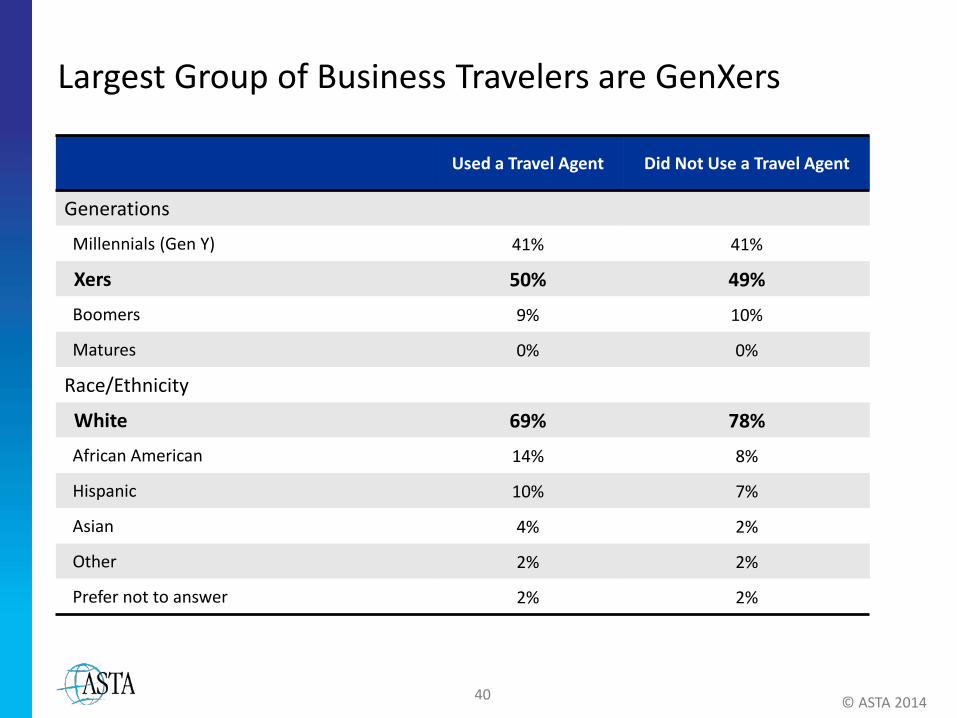
Largest Group of Business Travelers are GenXers
Used a Travel Agent Did Not Use a Travel Agent
Generations
Millennials (Gen Y) 41% 41%
Xers 50% 49%
Boomers 9% 10%
Matures 0% 0%
Race/Ethnicity
White 69% 78%
African American 14% 8%
Hispanic 10% 7%
Asian 4% 2%
Other 2% 2%
Prefer not to answer 2% 2%
© ASTA 2014

41
Business Travelers Are Mostly Married and in the Middle Income Levels
Used a Travel Agent Did Not Use a Travel Agent
Household Income $50,000 - $74,999 18% 25%
$75,000 -$99,000 19% 23% $100,000 - $124,999 19% 19% $125,000 - $149,999 11% 13%
$150,000 - $249,999 22% 15% $250,000 - $499,999 8% 5% $500,000 or more 3% 1%
Marital Status Married 69% 69% Separated 1% 1% Divorced 8% 10% Widowed 3% 2% Unmarried couple living together 8% 8% Never married 11% 10% Children currently in household Yes 39% 37%
© ASTA 2014
42
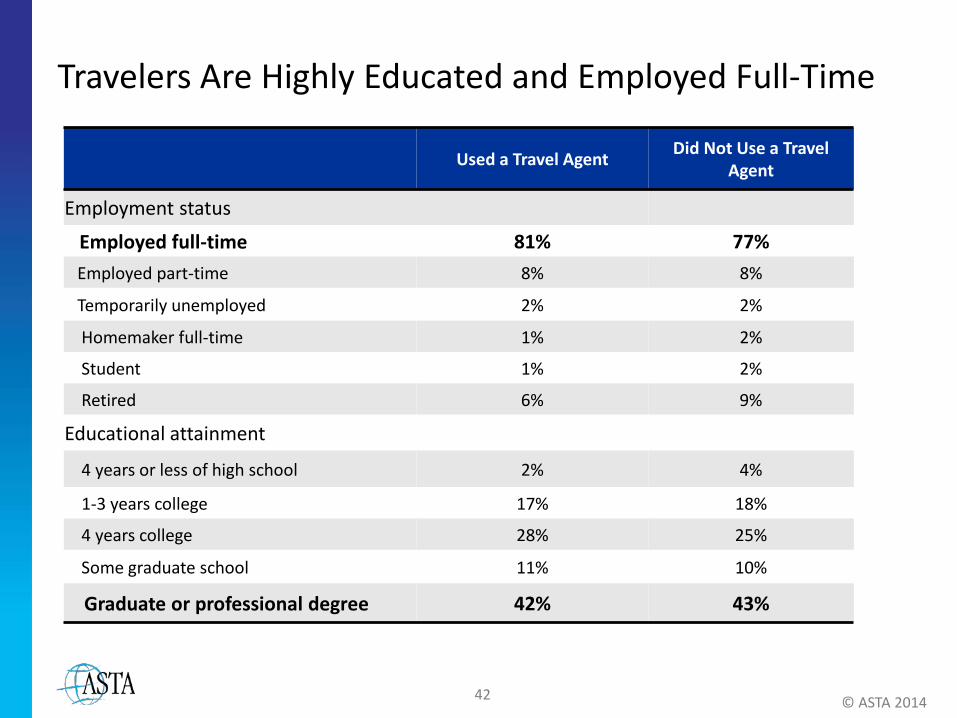
Travelers Are Highly Educated and Employed Full-Time
Used a Travel Agent Did Not Use a Travel Agent
Employment status
Employed full-time 81% 77% Employed part-time 8% 8%
Temporarily unemployed 2% 2%
Homemaker full-time 1% 2%
Student 1% 2%
Retired 6% 9%
Educational attainment
4 years or less of high school 2% 4%
1-3 years college 17% 18%
4 years college 28% 25%
Some graduate school 11% 10%
Graduate or professional degree 42% 43%
© ASTA 2014

43
1-2 Trips the Norm for Most Business Travelers
Used TTA Didn't Use TTA
# business trips past 12 months
1 24% 32%
2 21% 25%
3 13% 13%
4 10% 7%
5 5% 6%
6 – 10 13% 11%
11+ 14% 6%
© ASTA 2014
Average Number of Trips for those using an Agent
All Respondents Millennials Xers Boomers
5.8 5.4 6.4 7.0
44
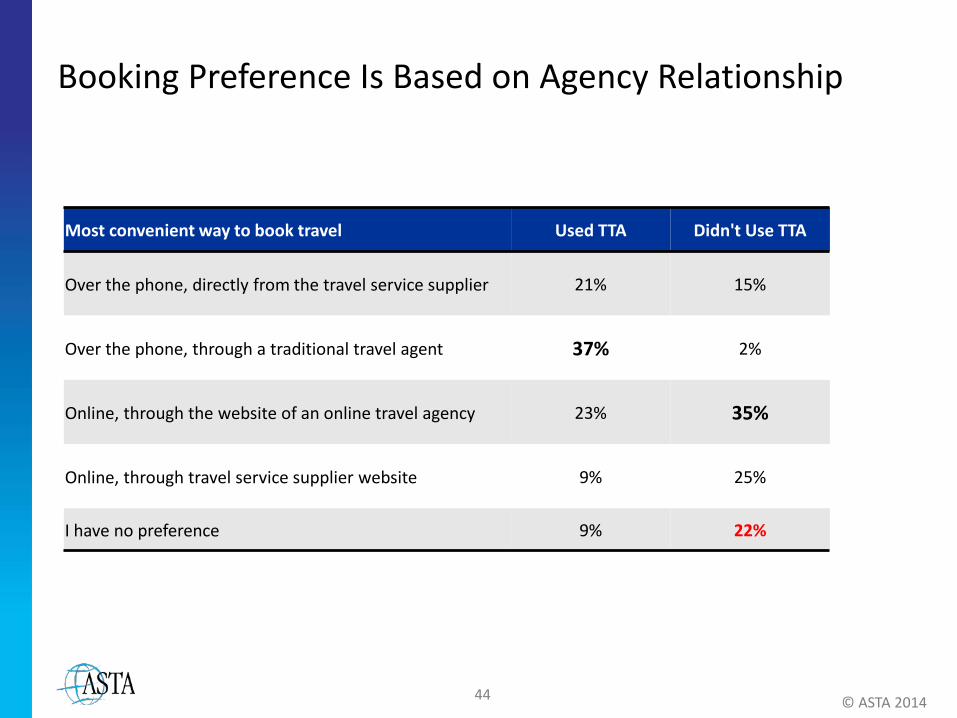
Booking Preference Is Based on Agency Relationship
© ASTA 2014
Most convenient way to book travel Used TTA Didn't Use TTA
Over the phone, directly from the travel service supplier 21% 15%
Over the phone, through a traditional travel agent 37% 2%
Online, through the website of an online travel agency 23% 35%
Online, through travel service supplier website 9% 25%
I have no preference 9% 22%

45
Want More Detail on Value of Travel Agents?
© ASTA 2014
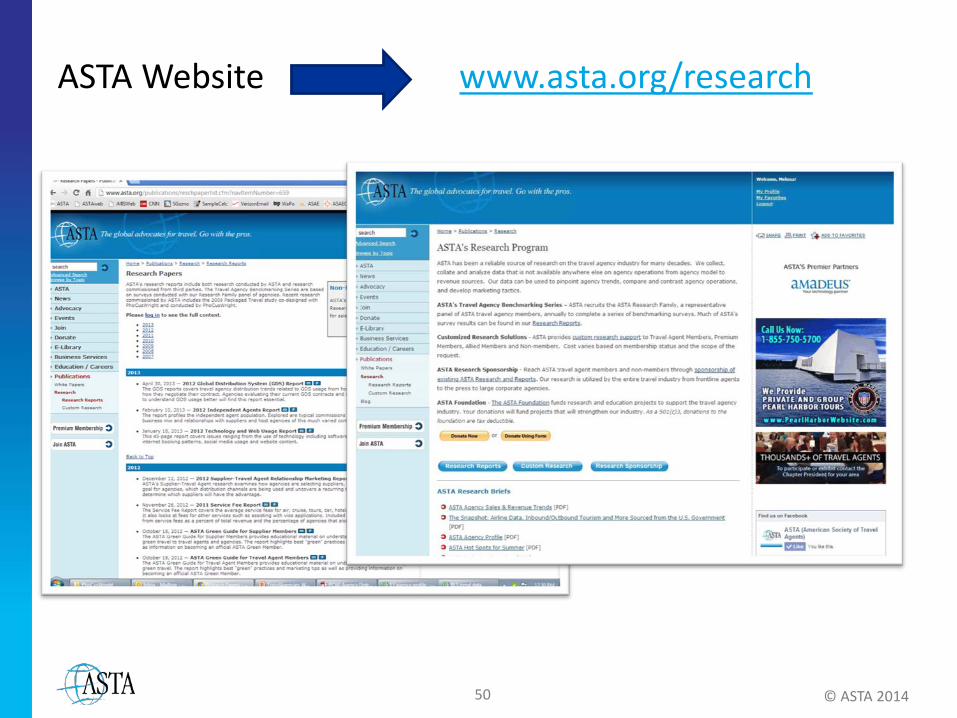
Available on the ASTA research report page at www.asta.org/research
46 © ASTA 2014
Tools for International Members
47
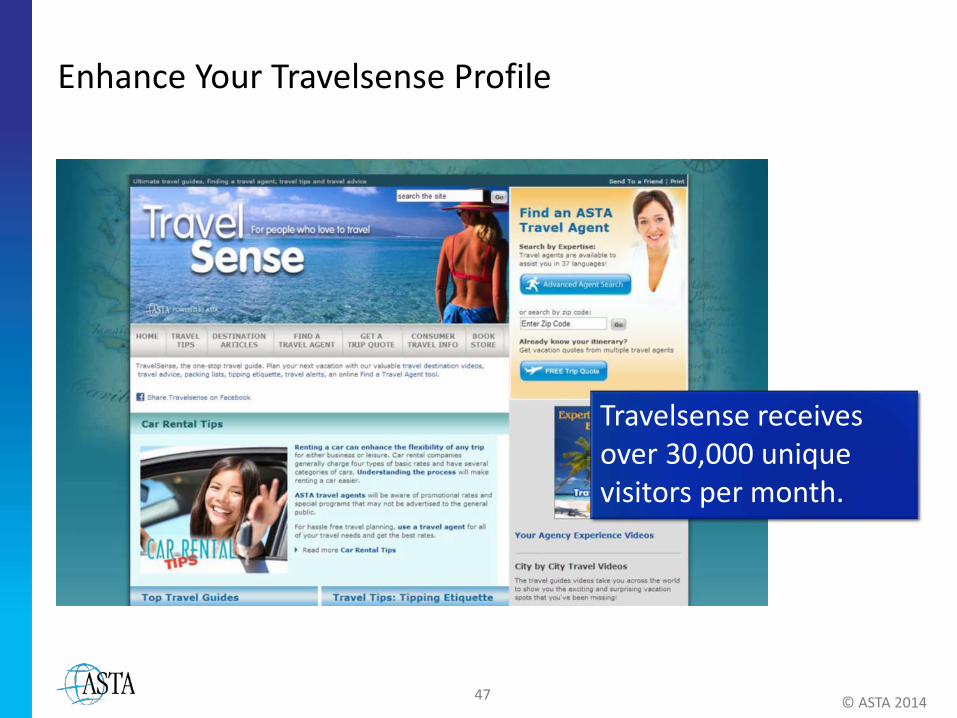
Enhance Your Travelsense Profile
© ASTA 2014
Travelsense receives over 30,000 unique visitors per month.
48
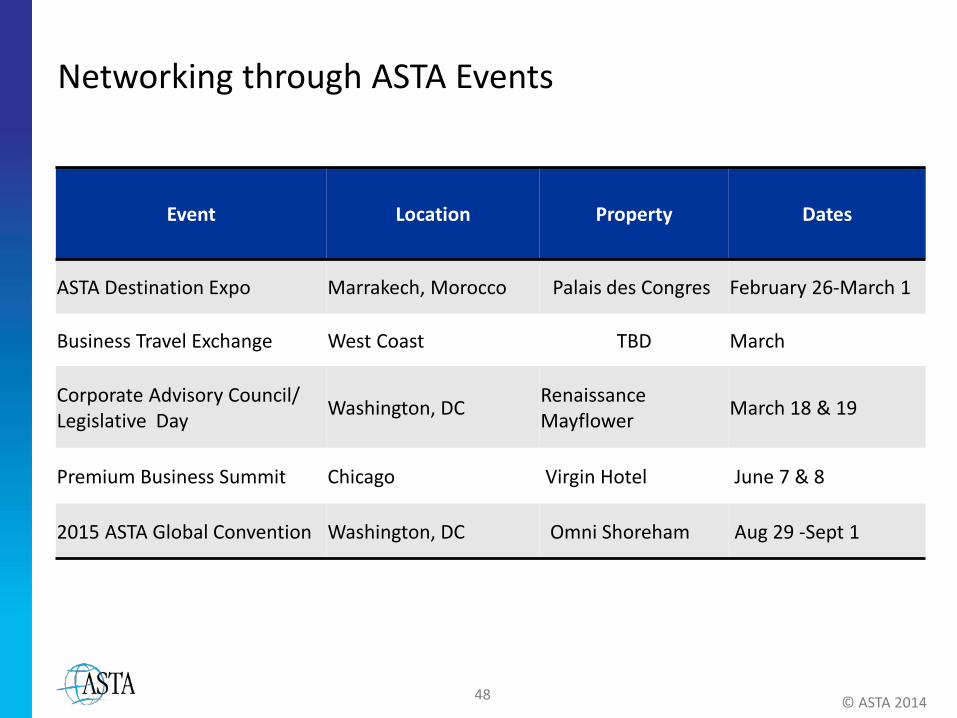
Networking through ASTA Events
Event Location Property Dates
ASTA Destination Expo Marrakech, Morocco Palais des Congres February 26-March 1
Business Travel Exchange West Coast TBD March
Corporate Advisory Council/ Legislative Day Washington, DC Renaissance
Mayflower March 18 & 19
Premium Business Summit Chicago Virgin Hotel June 7 & 8
2015 ASTA Global Convention Washington, DC Omni Shoreham Aug 29 -Sept 1
© ASTA 2014

49 © ASTA 2014
Finding ASTA data
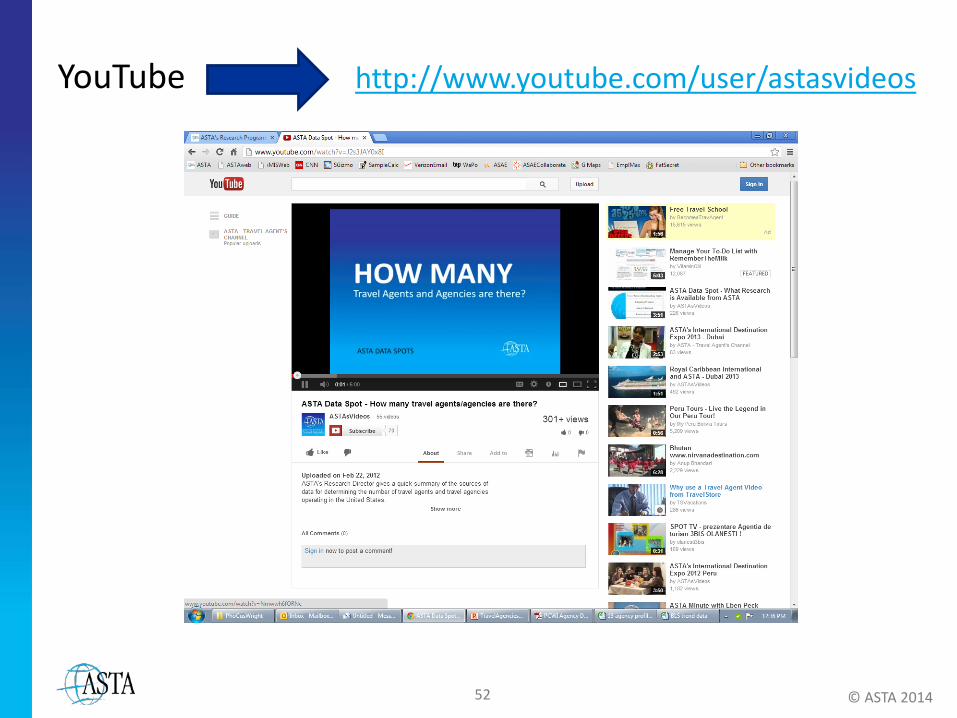
52
YouTube http://www.youtube.com/user/astasvideos
© ASTA 2014

54
Dateline ASTA Weekly
© ASTA 2014

55 © ASTA 2014
For Follow-up Questions: Melissa Teates 703-739-6983 [email protected] You can also contact me on LinkedIn.