AR2014
80
BUILDING ON A LEGACY Annual Report 2014 BONNEVILLE POWER ADMINISTRATION
-
Upload
sarah-smith -
Category
Documents
-
view
199 -
download
0
Transcript of AR2014

buildingon a legacy Annual Report 2014
B O N N E V I L L E P O W E R A D M I N I S T R A T I O N

FRONT AND BAck cOVER PhOTOS: BuREAu OF REcLAmation

Financial Highlights 3administrator’s letter 4year in Review 7Performance Target Results 24Financial Section 27executives 76Offices 77
bPa PRoFile The Bonneville Power Administration is a federal nonprofit power marketing administration based in the Pacific Northwest. Although BPA is part of the U.S. Department of Energy, it is self-funding and covers its costs by selling its products and services. BPA markets wholesale electrical power from 31 federal hydro projects in the Columbia River Basin, one nonfederal nuclear plant and several small nonfederal power plants. The dams are operated by the U.S. Army Corps of Engineers and the Bureau of Reclamation. About 30 percent of the electric power used in the Northwest comes from BPA. BPA’s resources — primarily hydroelectric — make its power nearly carbon-free.
BPA also operates and maintains about three-fourths of the high-voltage transmission in its service territory. BPA’s service territory includes Idaho, Oregon, Washington, western Montana and small parts of eastern Montana, California, Nevada, Utah and Wyoming.
BPA promotes energy efficiency, renewable resources and new technologies that improve its ability to deliver on its mission. BPA also funds regional efforts to protect and enhance fish and wildlife populations affected by hydropower development in the Columbia River Basin.
BPA is committed to public service and seeks to make its decisions in a manner that provides opportunities for input from stakeholders. In its vision statement, BPA dedicates itself to providing high system reliability, low rates consistent with sound business principles, environmental stewardship and accountability.


CREDIT RATINgS
Moody’s Aa1 with a stable outlook
Standard & Poor’s AA- with a stable outlook
Fitch AA with a stable outlook
ADjUSTED NET REvENUESmillions of dollars
2014
2013
2012
0 $50 $100 $150 $200 $250
FEDERAL COLUMBIA RIvER POWER SYSTEM thousands of dollars
Total operating revenues $ 3,600,346
Total operating expenses 2,896,696
Net operating revenues 703,650
Net interest expense 260,138
Net revenues $ 443,512
Adjusted net revenues $ 236,136
FiScal yeaR 2014

The Bonneville Power Administration maintained its focus on value and service to the Pacific Northwest in 2014. As we have done at many pivotal points in our history, we built on our legacy of marketing low-cost, reliable and nearly emission-free electricity to the region while also addressing necessary improvements within our own organization.
Favorable water conditions and stable power prices contributed to strong financial performance this year, with net revenues of $444 million and adjusted net revenues of $236 million.
We were proud to uphold our commitment to taxpayers by making our Treasury payment of $991 million on time and in full for the 31st consecutive year. We maintained our commitment to keep our rates as low as possible consistent with sound business principles, thanks to innovative debt management tools and constructive input from customers.
Preserving and enhancing the unique value of the region’s federal energy assets lies at the heart of our mission. In fiscal year 2014, BPA and its ratepayers invested nearly $1 billion in this vital work:
• As the owner and operator of the backbone of the region’s high-voltage transmission system, BPA is improving the reach and reliability of the electrical grid, providing open access to all types of resources, including renewable energy.
• The engineering marvel of the Federal Columbia River Power System has reached an era of needed renewal, with equipment at the 31 federal dams now averaging 55 years old. With our federal partners, we are overhauling or replacing an array of hydroelectric equipment, revitalizing the nation’s largest carbon-free energy source for the future.
• With our public power partners, we are funding energy efficiency infrastructure to meet the ambitious regional goals of the Northwest Power and Conservation Council, and using energy efficiency as our priority resource to meet the load growth of our customers.
• Survival rates of endangered fish in the Columbia Basin continue their positive trends as BPA and its partners restore habitat and make successful modifications in structures and operations to improve fish passage at FCRPS dams. In 2014, the Columbia River experienced its best salmon and steelhead runs in 75 years, with returns totaling 2.3 million past Bonneville Dam.
Whether funding the overhaul of one of the world’s most powerful hydroelectric turbines at Grand Coulee Dam, building the new Central Ferry-Lower Monumental transmission line
in Washington state, testing the latest smart-grid technology with cities and industry, or working with states, tribes and federal agencies to help salmon flourish around the Columbia Basin, BPA was actively engaged in work of value to the Northwest in 2014.
We celebrated other forward-looking achievements this year, such as winning our first Platts Global Energy Award in New York City for our one-of-a-kind synchrophasor network. These devices, which capture 137,000 measurements per second from points across the transmission system, allow us to better anticipate and respond to problems on the grid, heightening the reliability of electricity service.
To help pioneer other promising technologies that will make the power and transmission system more reliable, we joined the Department of Energy and other partners in the nation’s largest smart grid demonstration project, now moving into its final phase. BPA sponsored a regional business case, which shows overall promise for smart grid investments. Smart grid technology, including demand response tools, will help us respond to emerging regulatory requirements, growing renewable resources and climate-change mitigation.
We laid the internal groundwork this year for another tool to create a better-coordinated, more efficient system — 15-minute transmission scheduling, which we introduced early in fiscal year 2015.
We also made progress in our important work with the Northwest Power Pool Members’ Market Assessment and Coordination Committee. The effort by diverse public and investor-owned utilities is exploring ways of optimizing generation and transmission resources across the footprint of the regional power pool, including the potential of an automated within-hour energy market.
For BPA, leveraging the collective strengths we’ve developed over 77 years of service requires not just vision, collaboration and sustained work, but also honest self-assessment and a commitment to ongoing improvement. The resilience to respond to challenges and new conditions has been one of Bonneville’s defining strengths, and we tapped that quality again in 2014. Even as we celebrated achievements, we acknowledged responsibility for some significant shortcomings and committed to do whatever it takes to ensure all of our practices are best in class. Two key areas received intensive focus: hiring practices and safety.
We devoted major attention throughout 2014 to fixing serious shortcomings in our Human Capital Management (HCM) practices of 2010 to 2013. We have taken proper
Administrator’s Letter

corrective actions to remedy all cases where applicants, including veterans, may have been disadvantaged. In collaboration with DOE headquarters and the Office of Personnel Management, our team finished this extremely demanding process under budget and three months ahead of schedule. After 13 months of work to restore a fully compliant, highly effective HCM organization within BPA, DOE reinstated our delegated human resources authorities in September. I believe these positive results honor our commitment to the individuals who were impacted by our hiring practices, and we will continue to work closely with our colleagues in Washington, D.C., to ensure sustained compliance.
Over the past two years, we recognized that BPA’s safety program was in need of significant modernization. We are now taking thoughtful steps on the long road to meaningful improve- ment and lasting change. In fiscal year 2014, we elevated safety to our highest core value, invited DOE to review our program, hosted a summit with executives from top-performing safety programs across the nation, adminis-tered an employee safety perception survey, and instituted full fall-protection for our pole-climbers and substation staff, with much more to be done.
Throughout the successes and challenges of my first year as administrator, I have been tremendously impressed by the caliber and commitment of BPA’s workforce. I continue to draw energy and inspiration from employees’ dedication to our public service mission. It will serve us well as we move ahead in finding common interests and new solutions to the increasingly complex regional objectives of the future.
Elliot Mainzer Administrator and CEO 5

HE
atH
mo
FFat
t P
Ho
to

Finance 8
Power Services 10
EnergyEfficiency 12
Transmission 16
Fish and Wildlife 18
Renewable energy 20
year in Review
BPA linemen perform a long-line aerial rescue during annual emergency-response training in Pasco, Wash.

The financial performance of the Bonneville Power Administration, which markets wholesale hydro-power from the 31 federal dams and one nuclear plant in the Columbia River Basin, is closely tied to regional weather patterns.in fiscal year 2014, the Pacific northwest enjoyed its fourth year in a row of average or above precipitation, with the total volume of water in the Columbia River passing the Dalles, ore., measuring 104 percent of average.
BPa’s business lines benefited from two components of a favorable water year in 2014: sufficiency and timeliness of the fuel of the hydroelectric system. as spring unfolded, the generous snowpack in the Canadian Rockies melted and made its way through the Columbia Basin in an orderly sequence. the quantity of water, coupled with timely runoff, favored power revenues, system flexibility and operations to support endangered fish.
Plentiful streamflows and steady power prices strengthened the net revenue picture for BPa. We finished the year solidly in the black with Federal Columbia River Power System net revenues of $444 million and adjusted net revenues of $236 million, an increase in net revenues of $478 million from the rate case and $497 million from the start-of-year forecast, on total operating revenues of $3.6 billion. adjusted net revenues is a non-GaaP metric that removes the effect of certain debt-management actions.
among the year’s accomplishments: BPa made its treasury payment of $991 million on time and in full for the 31st con-secutive year. that sum included an additional $321 million appropriations payment as a benefit of the refinancing of regional cooperation debt in 2014. We also were able to increase our financial reserves for risk — defined as total financial reserves minus amounts received and held for specific purposes — as well as reaffirm our credit ratings.
Power Services achieved net revenues of $474 million and power modified net revenues of $96 million, a $465 million increase in net revenues from the rate case level of $9 million. Power modified net revenues is also a non-GaaP metric that removes the effect of certain debt-management actions. at $2.81 billion, total operating revenues continued to be strong due to the availability of water and stable electricity prices.

at $2.34 billion, total expenses ran below projections. the primary driver was the $321 million reduction in Energy northwest debt service from refinancing regional cooperation debt associated with Projects 1 and 3. this debt serves as a regional financial resource, providing debt management opportunities to lower costs of power for the benefit of the Pacific northwest.
transmission Services finished the year with net revenues of $140 million, a $12 million increase from the rate case. total operating revenues of $1.05 billion continued to be strong due to favorable hydro conditions. total expenses were $912 million. increased revenues and lower interest expense drove net revenues higher than rate case and start-of-year forecasts.
BPa financial reserves were $1.22 billion. of that, reserves for risk were $784 million, an increase of $143 million from the previous year.
capital investment Review and integrated Program Review thanks to its abundance of renewable hydroelectric resources, the northwest has traditionally enjoyed among the most affordable electricity rates in the nation. Low-cost, competitive and stable power and transmission rates are of vital importance to the region and BPa.
Keeping rates low while addressing the diverse demands on the Federal Columbia River Power and transmission System remains a challenge. Every two years, BPa invites the region to study and discuss the programmatic factors that drive its rates. in 2014, entering the cycle leading up to rate-setting for the fiscal 2016–2017 period, we shared detailed information on our program costs with customers, stakeholders and the public.
these public processes, called the Capital investment Review and integrated Program Review, provide key inputs for the rates process and allow the region to review and comment before the initial power and transmission rate proposals are presented in December.
the Capital investment Review examines long-term asset strategies and investment prioritization. the strategies are directed at modernizing and maintaining asset performance. two years ago, BPa began a leading-practice-based approach to prioritizing investments. the new process seeks to optimize the investment portfolio while recognizing rate, capital,
labor and other constraints. to date, it has been directed at prioritizing large projects that add transmission capacity and other BPa capabilities. the first results were presented during the 2014 CiR. BPa will continue to refine the methodology and extend it to more investments in the future.
the integrated Program Review process focuses on setting program spending levels and costs. in 2014, BPa changed the way it developed spending levels for the iPR, replacing a widely used method known as incremental budgeting with a more strategic approach. the new method takes into account factors such as past budget execution and the relative priority of programs. this methodology produced spending levels that were $13 million lower than they would have been under the previous method.
Early in october, BPa issued its close-out letter for the 2014 integrated Program Review with final proposed program costs for the fiscal year 2016–2017 rate period, which begins oct. 1, 2015.
debt management maximizing the long-term operational and economic value of FCRPS assets is an important strategic objective for BPa. During the Capital investment Review process, BPa engaged stakeholders in the hard decisions involved in maintaining low rates while making the investments needed by an aging federal power and transmission system.
to assure adequate funding for needed investments, BPa continued to make strides in its strategy to provide reliable access to cost-effective sources of capital over a rolling 10-year period. after a public process that started in october 2013, BPa’s Finance organization discussed different plans to continue to extend the availability of low-cost sources of capital and to lower costs for the existing debt portfolio.
BPa, Energy northwest and regional stakeholders identified an opportunity to refinance regional cooperation debt, originally issued by Energy northwest, the not-for-profit Washington state joint agency that owns and operates the Columbia Generating Station nuclear plant. in fiscal year 2014, BPa and En successfully completed the first of a series of refinancing actions that are expected to extend BPa’s access to capital beyond the 10-year goal and through 2025. the refinancing of regional cooperation debt is expected to result in significant interest savings while providing other benefits to BPa’s overall debt portfolio.
BPa also continued to take debt-management actions on the federal portion of the portfolio. During fiscal year 2014, we refinanced more than $1.18 billion of federal bonds. these debt management actions generate interest savings that benefit BPa customers and ratepayers across the region.
bond ratings in 2014, the nation’s three major investment credit-rating agencies affirmed their confidence in BPa’s solid financial footing. Fitch rated BPa-backed bonds aa with a stable outlook. moody’s investors Service also called BPa’s financial outlook stable with an aa1 rating. Standard & Poor’s issued the third stable outlook, assigning BPa-backed financial bonds an aa- rating.
9

Working together on shared challenges is deeply engrained in BPA culture. Collaboration brings better solutions, and that guiding principle drove an array of activities for BPA’s Power Services business line in 2014.Whether working with federal agencies to overhaul the largest hydroelectric turbines in the world, with utilities to test the latest smart grid and demand response tools, or with customers to develop new products to integrate renewable resources, BPa’s partnerships fueled progress.
FcRPS infrastructure after decades of reliable, low-cost service, the Columbia Basin’s 31 federal dams have reached the era of needed renewal. the average age of the hydroelectric infrastructure that supplies one-third of the electricity consumed in the Pacific northwest — with a zero carbon footprint — is 55 years old.
BPa’s ratepayers fund the power-related improvements and maintenance needed to pre- serve the long-term value of this complex and invaluable infrastructure. in fiscal 2014, BPa funded approximately $173 million in hydropower capital improvements and $361 million in operations and maintenance costs.
BPa and the dams’ owners, the U.S. army Corps of Engineers and Bureau of Reclamation, share decision-making for capital investments in the system. the FCRPS partners evaluate the condition, criticality, cost and risk of failure for thousands of pieces of equipment. this data
informs strategic priorities and helps ensure the right investment at the right place at the right time.
Perhaps the most dramatic example of such work unfolded in rural northeast Washington state, where a two-year mechanical overhaul of one of the three largest hydroelectric turbines in the world passed its midpoint in 2014. the refurbishment of the 805-megawatt unit at Grand Coulee Dam, performed in partnership with the Bureau of Reclamation and its contractors, sets the stage for a project that will continue for more than a decade. in that span, each of the six massive turbines in the dam’s third Power Plant will be overhauled in sequence to provide up to 40 more years of service to the region. BPa expects to spend approximately $690 million in direct costs.
other capital projects funded by BPa are preserving the reliability of facilities around the FCRPS. at the second-largest hydropower plant in the United States, Chief Joseph Dam near Bridgeport, Wash., the army Corps of Engineers and its contractors continued work on a decade-long project to replace 16 aging turbine runners with more efficient models. a runner is the part of the turbine that spins with the force of the river to generate power. BPa is funding the $164 million project to upgrade the half-century-old turbines and expects to receive about 6 percent more energy from the same amount of water flow.
at the Corps’ mcnary Dam, near Umatilla, ore., BPa is funding:
• new stator windings — the copper coil that transforms the mechanical power and torque of the turbine runner into electrical power — in 10 generators;
• new digital controls for 14 governors, the equipment that guides the generator to respond to shifts in load;
• upgrades to the electrical distribution system of two station-service generators, which power the operations of the plant.
meanwhile, an innovative project with great regional promise moved ahead in 2014 at nearby ice Harbor Dam, on the
A rotor is lifted during replacement of stator windings at McNary Dam.
u.S
. A
RM
y c
OR
PS
OF
EN
gIN
EE
RS

BPA is partnering to develop turbines that are safer for fish at Ice Harbor Dam, owned and operated by the U.S. Army Corps of Engineers.
11
lower Snake River near the tri-Cities in Washington. a team of government agencies and a private contractor is developing the next generation of turbines designed to be safer for downstream passage of young fish. installation and testing of the first unit is expected in 2015. if the new fish-friendly turbine designs live up to their promise after extensive testing, they would be available for use in other plants awaiting turbine replacement around the FCRPS.
columbia generating Station Columbia Generating Station, the northwest’s sole commercial nuclear energy facility, continues to play a valuable role in the FCRPS, providing safe, reliable, low-cost power to the Pacific northwest. the plant, operated by Energy northwest in Richland, Wash., generates approximately 1,170 megawatts of electricity for BPa at cost.
Columbia recently achieved significant milestones for efficiency and productivity. First, it met performance measures reflecting a top-quartile level of performance ranked against all commercial nuclear power plants in the nation.
Secondly, the plant set a generation record during its fiscal year, which ended June 30. Columbia generated a record 9.7 million megawatt-hours of electricity, eclipsing a fiscal year 2006 record of 9.5 million megawatt-hours, as well as a calendar year record of more than 9.3 million megawatt-hours in 2012.
Columbia Generating Station has operated for nearly five years without an unplanned shutdown, and Energy northwest recently surpassed 11.5 million work-hours without a lost-time injury to employees.
Southeast idaho load service in anticipation of the end of a longstanding exchange agreement with PacifiCorp, BPa prioritized arrangements for service after 2016 to six customer utilities in southeast idaho currently served by the South idaho Exchange. in 2012, we established a preferred option for future service to the area: participation in the proposed 500-kilovolt Boardman-to- Hemingway transmission project. Since then, BPa has worked closely with investor-owned utilities on permitting the 300-mile line between Boardman, ore., and melba, idaho.
Congress this year authorized us to construct a line, such as Boardman-to-Hemingway, to serve preference loads in southeast idaho.
BPa has also worked diligently to arrange for service to the customer utilities for the interim period between the end of the agreement in 2016 and completion of any new transmission. in 2014, BPa secured firm power for key months in the 2016 to 2021 period and obtained firm rights on multiple trans-mission paths to assure reliable service until a new line is built.
columbia River Treaty September 16, 2014, marked the 50th anniversary of the Columbia River treaty between the United States and Canada. this water-management agreement has been a model of international cooperation, marked by a remarkable level of collaboration between the two nations. For half a century, the treaty has served to share the value realized from the coordinated operation of the hydroelectric power system, while reducing the risk of flooding in the Pacific northwest.
the U.S. Entity, consisting of the BPa administrator and the U.S. army Corps of Engineers’ northwestern Division engineer, formulates and carries out the treaty’s operating arrange- ments. the treaty was written to allow either Canada or the United States to end most of its power provisions in 2024 with at least 10 years’ notice. the U.S. Entity led a three-year process of study, review and collaboration with a wide variety of interests in the Pacific northwest before sending a final regional recommendation concerning the future of the Columbia River treaty to the U.S. Department of State in December 2013.
the final recommendation submits that the Pacific northwest and the nation would benefit from modernization of the treaty after 2024. BPa, the Corps and other participants in the region’s treaty review believe the recommendation provides a balanced approach for modernizing the Columbia River treaty that is broadly supported by the people of the Pacific northwest.
after receiving the region’s final recommendation, the U.S. government is now conducting a formal interagency review of the treaty under the general direction of the national Security Council on behalf of the president.
u.S
. A
RM
y c
OR
PS
OF
EN
gIN
EE
RS
, B
y D
AV
ID g
. R
Igg

Using energy more efficiently extends the value of the Federal Columbia River Power System and its ability to continue to provide clean, affordable, reliable energy to the region’s residents and economy.Since Congress passed the Pacific northwest Electric Power Planning and Conservation act in 1980, more than half of the region’s new demand for electricity has been met through energy conservation. BPa and northwest publicly owned utilities have saved more than 5 average gigawatts of energy in all sectors of the economy, enough energy to power the city of Seattle four times over for a year.
Building the northwest’s second-largest resource doesn’t happen without coordinated and sustained effort. Whether providing incentives for energy-saving upgrades; developing and implementing cutting-edge programs; or advancing new technologies, codes and standards, collaboration is essential to achieving the region’s energy-saving goals. Last year, BPa and its public power partners exceeded the fiscal year 2013 target of 56 average megawatts set by the northwest Power and Conservation Council in its Sixth Power Plan by acquiring 72.5 amW of energy savings. this year, the estimated savings will exceed the cumulative 504 amW goal for the 2010 to 2014 period.
Post-2011 Review a 2014 review of BPa’s energy efficiency program provided another example of regionwide collaboration. after modifying our energy efficiency programs in 2012, we conducted a public review of our implementation program. During the year-long evaluation, staff from BPa, northwest publicly owned utilities and other stakeholders collaborated to refine and improve the post-2011 framework.
Saving energy in the agricultural sector

The Energy Efficiency Exchange, co-hosted by BPA and the Northwest Energy Efficiency Alliance, has quickly become the largest such event in the region.
the funds have allowed the testing of new two-way communi- cation technologies intended to increase cost savings and make more efficient use of existing resources. Led by Battelle memorial institute, the collaborative effort involves 11 public and private utility participants in five states, five technology partners, two universities and 60,000 metered customers. the project has deployed $79 million in smart grid technologies throughout the northwest, increasing energy productivity and services in the region.
in addition, BPa is sponsoring a smart grid regional business case to identify the highest sources of potential value for BPa, its customers and regional utilities. the study is the first assessment to account for the interactions of various technologies, as well as to quantify issues and risks of regional smart grid investments.
Demand response in the Pacific northwest continues to evolve from simply reducing peak loads to addressing multiple needs. one example is a project with the City of Port angeles — a municipal utility on Washington’s olympic Peninsula — and nippon Paper industries USa. the project explored how the pulp and paper mill could perform as a resource for supplying within-hour balancing capacity and evaluated the commercial arrangements for utilities and their customers in future load-reduction scenarios.
as part of another project sponsored by BPa’s technology innovation office, BPa and the Eugene Water & Electric Board put an oregon wastewater plant through a series of tests, which revealed that it could substantially reduce its energy consumption within 10 minutes in periods of high demand and limited flexibility on the regional electric power system. northwest wastewater facilities, numbering more than a thousand, represent a significant group of potential demand response assets for the region.
the feedback resulted in a suite of policy changes widely supported by customers and interested stakeholders. the modifications should make energy efficiency easier to imple- ment, while staying true to the values of equity and local control.
emerging technology Bonneville actively works to fill the pipeline with the energy- saving technologies of the future. BPa’s Energy Efficiency Emerging technology team researches promising new appliances and devices to understand how they perform under the real-world conditions of the northwest climate. BPa’s support of new, advanced heat pump technology is one current example. in February, the Electric Power Research institute recognized BPa and engineer mira Vowles with a technology transfer award for leading a project designed to better understand the performance of a type of variable capacity heat pump used in commercial buildings. these systems are up to three times more efficient than electric furnaces, baseboards and wall heaters, as well as quieter and more efficient than traditional heat pumps.
advanced rooftop control units might be the next success story. Smarter controls on rooftop heating, ventilating and air conditioning units can cut the amount of electricity needed for heating and cooling in half. Based on the research by our emerging tech team, including tests at malls, grocery stores and other buildings, BPa is now providing incentives for advanced control units.
energy Smart industrial in December 2013, BPa’s Energy Efficiency group was proud to be a finalist for the Platts Global Energy awards in new York City. BPa’s Energy Smart industrial program, which has significantly increased the participation of utilities and their industrial customers, was among eight energy suppliers’ programs to make it to the finals for the Stewardship award in Efficiency initiative. available to industrial retail customers served by public power in idaho, montana, oregon and Washington, Energy Smart industrial has helped more than 500 companies to reduce costs and increase energy efficiency in such market segments as pulp and paper, wood products, food processing, high-tech, water/wastewater and mining.
Smart grid and demand response new interactive technologies hold the promise of enhancing grid operations and helping solve energy industry challenges. at the center of this effort is the Department of Energy’s $178 million Pacific northwest Smart Grid Demonstration Project, the largest in the nation. the five-year project, funded by the american Recovery and Reinvestment act of 2009, nears completion in 2014. BPa is contributing $10 million, matched by DoE.
13Jim maDDRY/nEEa

BPA crews that joined the effort to repair power lines after the largest fire in Washington history got first-hand proof of the impact of their work on residents of Okanogan County.
“They said it was amazing to see people overjoyed and shouting in the street, ‘The power is back, the power is back!’” said Ron Alexander, BPA’s acting Sickler District manager. “We’ve done a good thing today.”
More than two dozen BPA linemen, substation operators and electricians responded to help restore power to the towns of Winthrop, Twisp, Pateros and Brewster in july. Ignited by lightning strikes, the Carlton Complex fires burned nearly 400 square miles and destroyed more than 300 homes, as well as critical infrastructure for the county’s agricultural communities.
The Okanogan PUD reported that its electric system was almost a complete loss — with burned power poles and tangled distribution lines scattered about “like a big bunch of spaghetti,” PUD spokesman Dan Boettger told the Methow valley News. The PUD requested BPA’s help to restore service to nearly 3,600 of its customers.

“In times of crisis, utilities have a longstanding tradition of coming together to provide assistance,” said BPA Administrator Elliot Mainzer. “The work of these 22 linemen and members of our substation crew reflects BPA’s proud heritage of service to the Northwest and engenders goodwill among customers and the region.”
BPA’s response spanned its Transmission Services organization and the state of Washington. Alexander got the first call just as BPA’s work week was winding down. But BPA executives, account executives, cost analysts and supply chain personnel worked through the weekend to ensure aid was on the way, including poles and hardware from BPA’s vancouver warehouse.
When they were done, BPA line crews working in ashy conditions had teamed to repair 26 structures on Okanogan PUD’s 115-kilovolt Brewster-Pateros line.
“They’ve been awesome,” Boettger told the Omak Chronicle.
Added Alexander: “It was a lot of hard work from BPA personnel on both sides of the mountains. Everyone involved not only lived up to our core values, but also had great care and concern for the communities we are a part of.”
15

Whether developing high-profile transmission expansion projects or high-tech tools that improve awareness of the state of the grid, BPa continued to build on its legacy as the leader in high-voltage transmission in the northwest in 2014.
central Ferry-lower Monumental line BPa took its latest step in facilitating the growth of renewable resources with the may 2014 start of construction on a new 500-kilovolt transmission project in Washington. the 38-mile Central Ferry-Lower monumental transmission line will connect the new Central Ferry Substation in Garfield County to the existing Lower monumental Substation in Walla Walla County. the line will be able to carry more than 800 additional megawatts of renewable wind energy from areas east of the Cascade mountains to heavily populated areas to the west. that’s enough to power about half a million northwest homes when the wind is blowing. the Central Ferry-Lower monumental line is expected to be energized by December 2015, in time to serve the next wave of renewable power.
big eddy-Knight projectanother key project to add transmission capacity resumed in 2014. the Big Eddy-Knight transmission Project is intended to serve requests from large generators, including wind projects, for interconnection with BPa’s high-voltage transmission system.
BPa suspended work on the 500-kilovolt project in the fall of 2013 after completing almost half of the construction. By June 2014, progress on land acquisitions and consultation on cultural resource issues enabled construction to resume on the 28-mile line, which will connect substations in Wasco County, ore., to Klickitat County, Wash. BPa expects to complete construction in winter 2015.
Synchrophasors in December 2013, BPa earned its first Platts Global Energy award, the most coveted honor in the energy industry. Competing with nine other finalists, the synchrophasor program won Platts’ industry Leadership award for Grid optimization.
Synchrophasors are high-speed representations of voltage and current, time-aligned with GPS satellites. the shoebox- sized electronic devices used to measure and report synchrophasors, called Phasor measurement Units or PmUs, also measure frequency, active and reactive power. after working to advance this technology for 20 years, BPa launched a program to build an operational synchrophasor network in 2010, with significant support from its office of technology innovation.
in 2013, Bonneville completed the installation of 126 PmUs at substations and large wind generation sites throughout the northwest — part of a five-year, $32 million investment. the new PmUs stream measurements 60 times per second to BPa’s control centers, providing grid operators with an unprecedented view of the power system’s dynamic state.
in addition, BPa is the largest contributor to the Western interconnection Synchrophasor Program, in which 19 utilities have partnered with the Department of Energy to provide real-time visibility of the western power system, covering 14 states, two Canadian provinces and a portion of the Baja Peninsula in mexico. through a dedicated, secure network, BPa shares real-time data with 10 utilities, furthering the understanding of the condition of the interconnection well beyond our area.
For more than 75 years, BPA has been the major developer of high-voltage transmission infrastructure in the Pacific Northwest. Electric utilities and power consumers depend on BPA to maintain reliable transmission service at low rates and to meet changing demands for electricity.

BPA began work on the 500-kilovolt Central Ferry-Lower Monumental line, which will move more than 800 megawatts of renewable energy across Washington state.
in June, BPa synchrophasor expert Dmitry Kosterev, an electrical engineer in transmission Planning, became one of 12 federal employees in the nation to receive the arthur S. Flemming award in Washington, D.C. the award honors employees who make exceptional contributions to the govern- ment. the work by Kosterev and dozens of other Bonneville employees not only has enhanced the stability and reliability of the grid, it’s helping to advance the integration of carbon-free renewable resources that benefit the Pacific northwest.
PacificDirectCurrentIntertieDuring the summer of 2014, construction began on the upgrade of the Pacific Direct Current intertie. one of the world’s longest and highest-capacity transmission lines, the intertie
delivers renewable northwest hydropower and wind energy to California, as well as carrying electricity north to meet peak demand in the northwest. the 500-kilovolt line runs 846 miles from BPa’s Celilo Converter Station in the Dalles, ore., to Sylmar, Calif., near Los angeles. BPa owns the 265-mile segment from near the Columbia River to the oregon- nevada border.
the $428 million project to upgrade the four-decade-old equipment will increase intertie capacity from 3,100 megawatts to at least 3,220 megawatts, as well as strengthen the line against weather and other threats to reliability and performance. Work on the project is expected to continue through november 2016.
17

In 2014, the region cele- brated record-setting returns on its investment to renew endangered runs of salmon and steelhead. Altogether, more than 2.3 million salmon and steelhead came back to the Columbia Basin, the highest total in 75 years.once again, fall chinook and sockeye salmon returned in record numbers past Bonneville Dam, with fall chinook setting a one-day record of 67,521 fish on Sept. 8. and at Lower Granite, eight dams up the river, Snake River sockeye returns were higher than in any year since the dam was built in 1978.
the impressive returns demonstrated that conditions are good for salmon and steelhead. Certainly ocean conditions were favorable, but credit should also go to an expansive program of dam improvements, habitat actions and hatchery conservation programs that BPa funds and implements with its many federal, state and tribal partners. the team effort for fish is the largest restoration project of its kind in the nation.
the Snake River sockeye, for instance, were the product of a very successful hatchery conservation program, which returned a record number of adult fish this year. Funded by BPa since 1991 and operated by the idaho Department of Fish and Game, the hatchery program has brought this species back from the brink of extinction, when less than a
handful of fish returned each year. today, many of the sockeye returning to idaho’s Redfish Lake to spawn were actually born in the wild.
new studies in 2014 also confirmed the substantial survival benefits from improving habitat on which salmon and steel-head depend during their first year of life:
• in idaho’s Lemhi River, researchers found that survival of juvenile chinook salmon more than doubled after tributary habitat actions restored the natural characteristics of Little Springs Creek.
• a project in the John Day River’s Bridge Creek in Eastern oregon helped to stabilize beaver dams, creating pools and collecting wood where insects and other food for fish naturally gather. Scientists measured a 50 percent increase in survival and 160 percent increase in abundance of steelhead following the improvements.
• in Washington’s methow River watershed, scientists found that a river’s side channels can play an important role in juvenile salmon growth and survival. BPa is working with the Bureau of Reclamation and others to sponsor extensive work to restore more natural floodplains in the methow River watershed and the Columbia River estuary.
actions like these are taking place throughout the region, funded by BPa and carried out by our state and tribal partners on a huge scale. Because these projects can help keep water cool and clean, they are an important hedge against the longer-term effects of climate change.
biological opinion in January, national oceanic and atmospheric administration Fisheries released its 2014 Supplemental Biological opinion for operation of the federal hydro system to conserve anadromous fish stocks listed under the Endangered Species act. in the new Biop, noaa Fisheries confirmed that a wide-ranging and extensive suite of conservation actions was on track and the federal agencies’ actions were ensuring the survival of salmon and steelhead well into the future.
Under the Biop, BPa supported the lead role of the U.S. army Corps of Engineers in continuing major improvements for

More than 1,450 sockeye salmon made the 900-mile journey back to Idaho’s Redfish Lake in 2014, a modern record for a run that faced extinction less than two decades ago.
19
passing juvenile fish at federal dams. in 2014, the Corps conducted studies in both spring and summer at mcnary Dam and in the summer at John Day Dam. the Biop calls for an average dam survival rate of 96 percent for spring-migrating juvenile fish and 93 percent for those migrating in summer. Study results currently show that dams on the lower Columbia and Snake rivers are on track to achieve these standards by 2018.
Surface passage routes at the dams, which create more natural conditions attractive to fish, are key to achieving these ambitious goals. Surface spill uses less water and is often safer for fish than conventional spill. Surface passage is now in operation at all eight federal lower Columbia and Snake river dams.
a U.S. Geological Survey study published in 2014 found that the surface passage at Lower Granite Dam diverted juvenile steelhead from the turbines and passed fish more quickly than any of the other routes at the dam. the study also found that the survival of the young steelhead was 95 to 100 percent, confirming the findings from the Corps’ own rigorous testing of the past four years. overall, surface spill, which is providing higher fish survival and faster fish travel times, has been key to achieving the federal goals of 93 and 96 percent survival.
dworshak hatchery project in april, nearly 100 leaders from tribes, states and federal agencies gathered at Dworshak Dam and national Fish Hatchery in north-central idaho to acknowledge a unique project that enabled the hatchery to roughly double the number of fish it raises while using about half the water and energy. BPa’s energy efficiency program funded $600,000 in improvements that included better pumps, more incubation trays and water-use measures that save energy and water while increasing fish health. the project earned the Department of interior’s Environmental achievement award for 2013, as well as the U.S. Fish and Wildlife Service’s Hatchery of the Year honors.
idaho habitat agreement in September, BPa signed a 10-year wildlife mitigation agreement with the State of idaho that will ultimately protect more than 8,500 acres of wildlife habitat, in addition to the 8,722 acres already managed by idaho for wildlife as mitigation for FCRPS dams in southern idaho. the new agreement also provides a stewardship fund for the idaho Department of Fish and Game to invest and use for perpetual maintenance of conservation values once the properties are purchased. the habitat acquisitions will provide benefits for fish and other natural resources, as well as public use.

BPA and its utility customers reached mutual agreement in September 2014 to move ahead with another two years of shared exploration and policy development in support of renewable power.the partial settlement of the BP-16 rate case covers ancillary and control area services, such as balancing services for wind generation and load.
the parties’ willingness to settle these issues before the rate case reflects a growing interest in developing long-term, regionwide strategies. By setting aside differences to come to an agreement, BPa and its customers saved valuable staff time and supported a focus on broader efforts, such as the northwest Power Pool members’ market assessment and Coordination Committee initiative.
a partial settlement of the BP-14 rate case outlined a set of actions BPa and customers would take during the 2014–2015 rate period. We completed those actions this year. the accomplishments include gaining valuable information about the capacity market in the northwest and developing the ability to acquire capacity from nonfederal resources. access to such capacity is a key component of BPa’s strategy for providing balancing services over the next decade as the federal hydro system becomes more constrained.
the September 2014 settlement will become the initial Proposal for fiscal year 2016–2017 ancillary and control area services rates in the BP-16 rate proceeding. the BPa administrator is expected to issue a decision on the settlement in the final record of decision for those rates in July 2015.
By launching a new cross-agency process to acquire nonfederal capacity, BPa was able to reduce the number of wind generation curtailments necessary in fiscal year 2014 when hydropower operations became constrained and BPa had to temporarily reduce its own supply of balancing reserves.
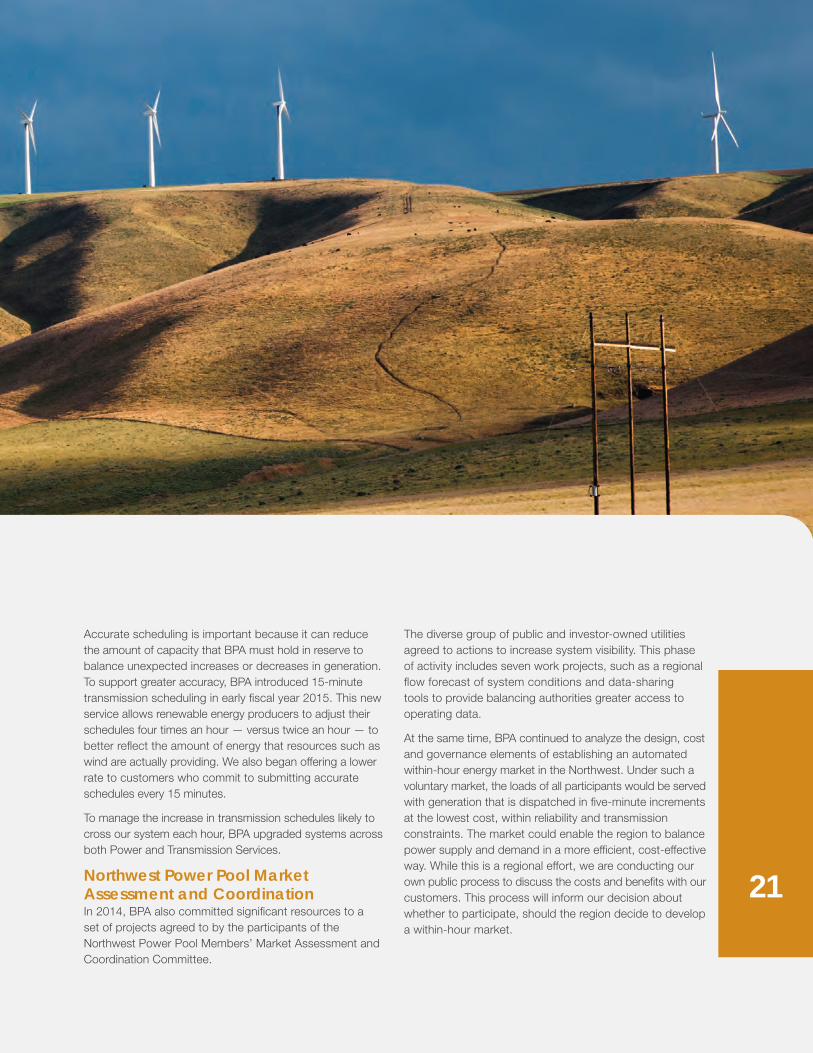
accurate scheduling is important because it can reduce the amount of capacity that BPa must hold in reserve to balance unexpected increases or decreases in generation. to support greater accuracy, BPa introduced 15-minute transmission scheduling in early fiscal year 2015. this new service allows renewable energy producers to adjust their schedules four times an hour — versus twice an hour — to better reflect the amount of energy that resources such as wind are actually providing. We also began offering a lower rate to customers who commit to submitting accurate schedules every 15 minutes.
to manage the increase in transmission schedules likely to cross our system each hour, BPa upgraded systems across both Power and transmission Services.
northwest Power Pool Market assessment and coordination in 2014, BPa also committed significant resources to a set of projects agreed to by the participants of the northwest Power Pool members’ market assessment and Coordination Committee.
the diverse group of public and investor-owned utilities agreed to actions to increase system visibility. this phase of activity includes seven work projects, such as a regional flow forecast of system conditions and data-sharing tools to provide balancing authorities greater access to operating data.
at the same time, BPa continued to analyze the design, cost and governance elements of establishing an automated within-hour energy market in the northwest. Under such a voluntary market, the loads of all participants would be served with generation that is dispatched in five-minute increments at the lowest cost, within reliability and transmission constraints. the market could enable the region to balance power supply and demand in a more efficient, cost-effective way. While this is a regional effort, we are conducting our own public process to discuss the costs and benefits with our customers. this process will inform our decision about whether to participate, should the region decide to develop a within-hour market.
21

BPA is engaged in an array of important projects across the four-state region. But one focus stood well above the rest this year — improving our safety practices.
In 2014, Bonneville initiated a comprehensive review and overhaul of its safety framework. BPA elevated safety to its No. 1 core value and initiated a program review by the Department of Energy’s Office of Enforcement and Oversight. The review from DOE headquarters affirmed a number of key issues BPA was aware of, as well as identifying unanticipated areas for improvement. The findings will help further strengthen the safety management program.
BPA took many early strides toward building a best-in-class safety program in 2014, including:
• Benchmarking with 15 utilities, four non-utilities and other branches of DOE, as well as establishing con-tinuous benchmarking with Edison Electric Institute;
• Completing an agency-level risk assessment;
• Hosting a summit for safety executives from best-in-class companies to share their journey to sustained safety performance with the BPA executive team;
• Administering a safety perception survey of all BPA employees and contract personnel;
• Expanding training in the use of new fall-restricting and rescue devices to substation workers;
• Preparing to train and outfit crews with new equipment to better protect linemen climbing steel towers.
In moving from gathering information to redesigning the overall framework, all BPA employees will have input on how best to make lasting changes in safety.
“Workers’ direct involvement has proven to be a successful model that we aim to replicate in upcoming safety initiatives,” said BPA Chief Operating Officer Claudia Andrews. “In my trips to the field, the level of broad-based commitment to safe work practices is readily apparent and very inspirational. We can’t help but be successful when we are all focused and working together.”
The ultimate goal is to ensure that everyone who works at Bonneville gets home safely every day. “We are taking this on and we are going to do it right,” said Administrator Elliot Mainzer.

23

For several years, BPA has set key agency targets that the organization as a whole is responsible for achieving in the specified year. These targets serve as indicators of BPA’s annual performance.
Stakeholder Perspective EnErgy EfficiEncy Target Met. BPa and public utility energy efficiency programs are estimated to have achieved over 54.8 average megawatts of new conservation savings against a target range of 48 to 56 average megawatts and did so for $77.6 million of capital against a target of $83.5 million. BPa completed the close-out of the post-2011 review process in September 2014.
TrAnsMission sysTEM opErATions pErforMAncE Target Met. BPa achieved high transmission system perfor- mance for availability of 97.97 percent against a target of 97.39 percent. BPa did not have any involuntary curtailments of firm loads and met its reliability targets for outage duration and outage frequency. Flowgate performance was within established control limits.
fEdErAL hydro pErforMAncE Target Met. BPa met the equivalent availability factor target of 74.2 percent with a result of 76.3 percent. BPa met the forced outage factor target of 3.9 percent or less with a factor of 3.4 percent, and met targets in the following areas: generation reliability compliance, hydro generation safety and fleet cost performance.
coLuMbiA gEnErATing sTATion pErforMAncE And cosT Target Met. the cost of power at Columbia Generating Station nuclear plant was $36.96 per megawatt-hour, below the targeted range of $38.38 to $42.42 or less per megawatt-hour. the Columbia Generating Station overall performance index indicator was 96.2 points, above the target of 92.76 or greater.
coLuMbiA rivEr TrEATy rEviEw Target Met. the U.S. Entity completed the regional recom- mendation on a future course of action for the treaty and provided it to the U.S. Department of State in December 2013
for consideration after consulting with the State Department, regional sovereigns and stakeholders. the U.S. Entity, con-sisting of the BPa administrator and the U.S. army Corps of Engineers’ northwestern Division engineer, also collaborated with the State Department to help define and support a clear path forward with the department, the region and Canada.
EndAngErEd spEciEs AcT coMpLiAncE Target Met. BPa met 2014 measures and its responsibilities under the 2010 Supplemental FCRPS Biological opinion by accomplishing hydro, tributary habitat and estuary habitat targets. BPa collaborated with its partner agencies and the national oceanic and atmospheric administration to finalize the 2014 FCRPS Biological opinion.
bpA bALAncing cApAbiLiTiEs And rEsourcEs Target Met. BPa advanced efforts to expand BPa and customer access to cost-effective non-federal balancing resources to maintain system reliability and fulfill BPa’s balancing authority obligations. this was achieved through customer dialogue in the ancillary and Control area Services Generation inputs Workshops to collaboratively identify durable long-term solutions, as well as through active support to advance the evaluation and possible development of collaborative tools to share and optimize resources across the northwest Power Pool’s footprint.
consTiTuEnT sATisfAcTion Target Met. Survey results showed a constituent satisfaction rating of 7.6 against a target of 7.0 or greater.
cusToMEr sATisfAcTion Target Met. Survey results showed a customer satisfaction rating of 7.9 against a target of 7.0 or greater.
TribAL govErnMEnT sATisfAcTion Target not Met. Survey results showed a tribal Government satisfaction rating of 6.5 against a target of 7.0 or greater.

Financial Perspective cApiTAL AccEss sTrATEgy Target met. BPa held debt management workshops with customers and stakeholders and advanced its capital access strategy. BPa and Energy northwest worked closely to establish and implement an integrated debt management approach to their combined total debt portfolios, the debt service of which is borne by BPa ratepayers. this enables lower interest expense and also preserves and restores U.S. treasury borrowing capacity for making much-needed investments in FCRPS infrastructure. Utilizing this approach and other third-party financing, BPa demonstrated it will have access to cost-effective capital over a rolling 10-year period.
cApiTAL invEsTMEnT in rEviEw (cir) — inTEgrATEd progrAM rEviEw (ipr) Target Met. BPa concluded the CiR and iPR public processes that met the stakeholder and BPa objectives to establish fiscal year 2016–2017 expense and capital spending levels for the BP-16 rate case. objectives included enhancing understanding of drivers of long-term capital forecasts and potential power and transmission rate implications, as well as increasing transparency into the prioritization of capital projects.
bond rATing Target Met. BPa-backed bonds maintained ratings as affirmed by moody’s (aa1), Standard & Poor’s (aa-) and Fitch (aa).
AdjusTEd nET rEvEnuEs Target Met. BPa achieved adjusted net revenues of $236.1 million, exceeding the target of $95 million or greater.
cosT MAnAgEMEnT Target Met. BPa’s departmental expenses were $883.4 million, achieving the target of $920 million or less.
TrEAsury pAyMEnT Target Met. BPa’s fiscal year 2014 payment to the U.S. treasury of $991 million was made on time and in full for the 31st consecutive year. the payment consisted of $567 million for principal (including advanced repayment of $321 million), $333 million for interest, $53 million in irrigation assistance payments and $38 million for other obligations.
internal operations Perspective TrAnsMission sysTEM infrAsTrucTurE Target Met. BPa achieved system direct capital expenditures of $421 million, which is 89 percent of the start-of-year budget and within the target range of 80 percent to 100 percent. BPa met 90 percent of the cumulative in-service date milestones in the capital work plan, which met the minimum target of 90 percent. of BPa’s transmission projects, 81 of
99 major project milestones, or 81.8 percent, were on track to meet end-of-project completion targets for costs, schedule and scope, slightly exceeding the 80 percent target.
hydro gEnErATion sysTEM infrAsTrucTurE Target Met. BPa’s budget expenditure rate for the Federal Hydro Capital Program was 86.6 percent, within the target range of 85 to 100 percent and representing $164.8 million in investment. the fiscal year milestone completion rate for major projects was 92.9 percent, exceeding the target of 80 percent or greater. the end-of-project completion target for cost, schedule and scope was also met for 87.7 percent of projects against a target of 80 percent or greater.
grAnd couLEE MEchAnicAL ovErhAuL Target not Met. BPa met key milestones for a multi-year overhaul of a third Power Plant generating unit to preserve the long-term value of the federal hydro system. However, the schedule was delayed six months because a critical date was missed for installing a turbine runner.
rELiAbiLiTy coMpLiAncE Target not Met. two of the three sub-measures were not met (High Risk/Severity Violations and Non-Self-Reported Violations). Mitigation Plan Milestones was met.
cybEr sEcuriTy Target Met. BPa met cyber security targets aimed at monitoring and improving BPa’s overall cyber security posture. achievements included meeting targets pursuant to the it maturity model and analyzing requirements for a Cyber Security operations and analysis Center.
sMArT grid Target Met. BPa met 91 percent of its milestones for the Pacific northwest Smart Grid Demonstration Project, achieving the target of 80 percent or greater. BPa successfully created alignment with Battelle, DoE and project stakeholders. BPa completed an update to the Regional Smart Grid Business Case report.
People and culture Perspective TALEnT MAnAgEMEnT Target not Met. the sub-measure targets for advance Hiring Process and Strengthen internal talent were met. the third sub-measure target, Drive High Performance, was not met. the target was to sustain employees’ understanding of expectations as measured by an employee survey item and the target level was not achieved.
sAfETy Target Met. BPa achieved a recordable accident frequency rate of 1.1 per 200,000 hours worked, which is below the target rate of 1.5 or less.
25

hE
ATh
MO
FFA
TT
Ph
OT
O

Forward-looking information 28
Management’s 30 discussion & analysis
independent auditor’s Report 42
Financial Statements 44
notes to Financial Statements 48
Federal Repayment 73
FinancialSection

29
modernize aging system assets. In 2012, BPA began a leading-practice-based approach to prioritizing investments. The new prioritization process seeks to optimize the FCRPS investment portfolio within available rate, capital, labor and other constraints.
Together, the asset management strategies and the prioritization process are designed to ensure that assets operate efficiently and effectively, and provide the capacity and capabilities needed to meet reliability, availability, environmental, health and safety, security and other standards while minimizing costs over the long term.
The strategies and prioritization process have been thoroughly reviewed by BPA’s customers and other stakeholders, and they enjoy broad support. BPA plans to invest approximately $3.1 billion over the fiscal year 2015–2017 time frame.
Access to capital To fund a growing number of necessary infrastructure improvements, BPA updated its comprehensive Access to Capital Strategy in 2013. This plan provides for reliable access to cost-effective sources of capital over a rolling 10-year period, ensuring that the costs of these sources will be prudent and well controlled, and that the sources will be reliable and sufficient to meet capital investment priorities.
Absent other action, BPA may reach the limits of its revolving U.S. Treasury borrowing authority as early as 2017. The Access to Capital Strategy relies on tools such as lease-purchases, the power prepay program, conservation third-party financing, reserve and revenue financing, debt refinancing and rigorous prioritization of proposed capital investments to help make informed decisions on potential reductions or delays in capital investment as needed.
During fiscal year 2014, BPA and Energy Northwest worked closely to establish and implement an integrated debt management approach to their combined total debt portfolios, the debt service of which is borne by BPA ratepayers. Debt refinanced under this effort is called regional cooperation debt. In fiscal year 2014, this resulted in $321 million of regional cooperation debt associated with Projects 1 and 3 being refinanced
This forward-looking information contains statements which, to the extent they are not recitations of historical fact, constitute “forward-looking statements.” In this respect, words such as “forecast,” “project,” “anticipate,” “expect,” “intend,” “believe,” “plan” and similar expressions are intended to identify forward-looking statements. A number of important factors affecting the Federal Columbia River Power System’s (FCRPS) business and financial results could cause actual results to differ materially from those stated in the forward-looking statements. The BPA does not plan to issue updates or revisions to the forward-looking statements.
Rates BPA expects to devote much of the 2015 fiscal year to establishing power and transmission rates for fiscal years 2016 and 2017. The rate case, which begins in December 2014, will conclude in time to implement new rates on Oct. 1, 2015.
During fiscal year 2014, BPA worked with customers in the Integrated Program Review process to thoroughly examine program benefits and spending levels. After its release in December 2014, BPA’s initial rate proposal will be evaluated in a rate proceeding that allows customers and other parties to actively participate as BPA establishes rates to recover its costs. At the conclusion of the rate proceeding in July 2015, the BPA administrator will issue a final record of decision supporting the adoption of final rates for fiscal years 2016–2017. The rates and the accompanying record of decision will be submitted to the Federal Energy Regulatory Commission for confirmation and approval.
Infrastructure BPA has a strategic priority to preserve and enhance federal generation and transmission system assets and the economic, environmental and operational value they produce for the region. In recent years, FCRPS capital requirements have grown significantly with the need to replace and modernize aging infrastructure. BPA management anticipates the need for new capabilities to serve loads, bolster reliability, integrate new generation, improve operating efficiency and fulfill regional commitments for energy efficiency and fish and wildlife restoration.
In 2007, BPA and its federal partners began devel-oping long-term asset management strategies to set performance objectives, assess risks and plan work to
forward-looking information
28
29
with yields ranging from 2.64 to 2.91 percent and matur- ities ranging from July 1, 2025, through July 1, 2028. This restructuring freed up funds in the BPA Fund to fund the early repayment of the same amount of federal debt with interest rates greater than 7 percent. The Energy Northwest Executive Board has approved a motion of support for refunding future regional coop-eration debt of $1.425 billion maturing in fiscal years 2015 through 2018. BPA plans to use the cash flow freed up from extending the regional cooperation debt to early repay $1.425 billion of higher interest rate federal debt.
This enables the region to lower cost of service by lowering interest expense. It helps stabilize the capital- related revenue requirement. The net effect of the refinancing of this regional cooperation debt is that both the weighted-average interest rate and maturity of the overall debt portfolio will be reduced over the life of the proposal. It also preserves and restores U.S. Treasury borrowing capacity for making much-needed investments in our infrastructure.
Climate change Potential climate change resulting from greenhouse gas emissions has emerged as a matter of intense and growing concern across the region and around the world. In the Northwest, the Federal Columbia River Power System has a long history of cost-effective, climate-friendly generation.
The Pacific Northwest, including the FCRPS, produces less carbon dioxide per megawatt-hour than any other region in the United States. Even in low water years, the federal hydroelectric system produces about 7,000 average megawatts of electricity, allowing the region to sustain a relatively small carbon footprint.
While the direction of federal climate change and energy legislation remains uncertain, neighboring California has launched a cap-and-trade platform to put a price on greenhouse gas emissions. This development has already had an effect on California electricity prices.
Recent studies, including the latest information from the Intergovernmental Panel on Climate Change, agree that Columbia River Basin climate is likely to continue to warm. It is reasonable to expect that warming will cause more winter precipitation to fall as rain rather than snow, resulting in increased river flows in winter and early spring, reduced flows in summer and new challenges for river operations and planning.
Bonneville continues to study and evaluate the evolving understanding of climate change in the Northwest. In the near future, projected weather and streamflow changes caused by climate change are expected to be manageable under existing operational norms. However, new studies and additional modeling of scenarios,
accomplished with the support of its Office of Technology Innovation, will help Bonneville incorporate the risks of climate change into its ongoing, long-term planning efforts. BPA is well positioned to further understand and adapt to any changes to the FCRPS that might emerge.
Federal Columbia River Power System Biological Opinion Under the Endangered Species Act, the U.S. Army Corps of Engineers (Corps), the Bureau of Reclamation (Reclamation) and BPA must consult with the National Oceanic and Atmospheric Administration (NOAA) Fisheries to avoid the likelihood of jeopardizing 13 stocks of endangered and threatened salmon and steelhead in the Columbia Basin and to mitigate for the effects on fish of 14 federal hydroelectric dams of the FCRPS.
A NOAA Fisheries plan established in 2008 and supplemented in 2010 and 2014, called the FCRPS Biological Opinion (BiOp), guides operation of the system to protect these listed fish. In recent years, BPA and its partners in federal, state and tribal governments have improved the dams to make them safer for fish, rehabilitated long-degraded habitat across three states, and managed predation to ensure that millions more young salmon and steelhead migrate safely to the ocean. Since the time of their listing, more wild fish have returned to their home streams to spawn and rebuild their numbers.
In 2011, the U.S. District Court for the District of Oregon remanded the 2008/2010 BiOp and ordered that a new BiOp be issued, providing more specific identification of habitat restoration projects for the 2014 through 2018 period. NOAA Fisheries met court requirements and issued the 2014 Supplemental Federal Columbia River Power System BiOp in January 2014. BPA issued a record of decision to implement the Supplemental BiOp as did the other FCRPS Action Agencies (the Corps and Reclamation). The Action Agencies also produced an implementation plan for BiOp actions in 2014 through 2018.
As directed in the 2008 BiOp, the Action Agencies also produced a comprehensive evaluation of progress to date under the existing BiOp. The comprehensive evaluation, released in January of 2014, indicated that improvements at the dams, including spill and surface passage systems, have benefited fish survival, reduced travel time of fish through the system and showed that the agencies are on track to meet the performance standards and other requirements of the BiOp.
The 2014 BiOp and its predecessors, however, have been the subject of ongoing litigation in the U.S. District Court for the District of Oregon. If the outcome of this litigation were to result in a change to BiOp operations, BPA’s financial outlook could change accordingly.

management’s discussion & analysis
32
Results of operationsOperating revenuesFederal Columbia River Power SystemFor the years ended Sept. 30 (thousands of dollars)
2014 2013 2012Gross sales:
Power $ 2,572,332 $ 2,438,468 $ 2,450,595
Transmission 892,463 803,689 790,969
Bookouts (Power) (38,281) (66,587) (61,972)
Sales 3,426,514 3,175,570 3,179,592
U.S. Treasury credits for fish 103,853 84,092 76,983
Miscellaneous revenues:
Power 30,770 32,612 31,012
Transmission 39,209 54,007 30,263
Total operating revenues $ 3,600,346 $ 3,346,281 $ 3,317,850
Fiscal year 2014 revenues compared to fiscal year 2013For the fiscal year ended Sept. 30, 2014, consolidated gross sales for Power Services and Transmission Services, excluding the effects of bookouts, increased $223 million compared to fiscal year 2013. Power Services gross sales increased $134 million, or 5 percent.
• Power firm sales increased $118 million, or 6 percent, in fiscal year 2014 compared to 2013 due to a9 percent average wholesale power rate increase, which took effect beginning Oct. 1, 2013, and higher preference utility peak loads stemming from colder than average temperatures in October, December and February.
• January through July 2014 runoff volume at The Dalles Dam was 108 million acre feet (maf), an increase of 10 maf from the 98 maf for 2013. A typical metric to measure runoff is maf, an indicator of the amount of electricity the hydro system can produce. The full fiscal year 2014 volume finished at 135 maf, an increase of 5 maf from the 130 maf in fiscal year 2013, and close to the historical average of 133 maf since 1928.
• Secondary sales increased $16 million due to increased streamflows and slightly higher market prices.
• Gross power sales decreased slightly to 85,714,109 megawatt-hours in fiscal year 2014 from 85,965,165 megawatt-hours in fiscal year 2013.
• Bookouts decreased $28 million compared to 2013 due to fewer transactions eligible to be bookedout in 2014.
3130

33
Transmission Services sales increased $89 million, or 11 percent, in fiscal year 2014 compared to 2013. The primary driver of increased transmission sales was an 11 percent average transmission rate increase which also took effect Oct. 1, 2013.
Bookouts are presented on a net basis in the Combined Statements of Revenues and Expenses. When sales and purchases are scheduled with the same counterparty on the same path for the same hour, the power is typically booked out and not scheduled for physical delivery. The megawatt-hours that offset each other net to zero. The dollar values of these offsetting transactions are recorded as bookouts. The result is that revenues and expenses are presented on a net basis in the Combined Statements of Revenues and Expenses. Therefore, the accounting treatment for bookouts has no effect on net revenues, cash flows or margins.
U.S. Treasury credits for certain fish costs borne by BPA increased $20 million, or 23 percent, in fiscal year 2014 compared to 2013. The increase was primarily driven by higher replacement power purchases for fish and wildlife mitigation purposes made necessary by the lower than average Columbia River Basin runofffrom October through February and again in September.
Transmission miscellaneous revenues decreased by $15 million, or 27 percent, compared to fiscal year 2013. This decrease reflects the receipt in fiscal year 2013 of one-time revenues from Precedent Transmission Service Agreement terminations and fiscal year 2013 reimbursable work for Hurricane Sandy.
2013 revenues compared to 2012For the fiscal year ended Sept. 30, 2013, Power Services and Transmission Services consolidated gross sales, excluding the effects of bookouts, increased approximately $600 thousand from the prior fiscal year.
Power Services gross sales decreased $12 million, or less than 1 percent. Some key factors leading to this result include:
• Firm sales decreased $17 million in fiscal year 2013 compared to fiscal year 2012 due to lower demand and load shaping revenues.
• January through July 2013 runoff volume at The Dalles Dam was 98 maf, a decrease of 44 maf from the 142 maf for the same period in 2012. The full fiscal year 2013 volume finished at 130 maf, a decrease from the 159 maf in fiscal year 2012, and close to the historical average of 133 maf.
• Secondary sales increased approximately $5 million primarily due to higher market prices that offset decreased streamflows year-over-year.
• Power gross sales decreased to 85,965,165 megawatt-hours in fiscal year 2013 from 96,714,819 megawatt-hours in fiscal year 2012. Hydro conditions and Columbia Generating Station (CGS) scheduled refueling and maintenance resulted in decreased generation in fiscal year 2013.
Transmission Services gross sales increased $13 million, or 2 percent:
• Variable Energy Resource Balancing Service sales increased by $7 million due to additional installed wind generation facilities.
• Point-to-Point Long-Term sales increased by $5 million due to increased Conditional Firm sales and the effect of Network Open Season sales that began in fiscal year 2012.
U.S. Treasury credits for fish increased from $77 million in fiscal year 2012 to $84 million in fiscal year 2013, or approximately 9 percent. The fiscal year 2013 increase was primarily driven by higher energy prices and anincreased volume of power purchases made for fish and wildlife mitigation purposes.
Transmission miscellaneous revenues increased by $24 million mainly due to Hurricane Sandy reimbursable activity and terminations of Precedent Transmission Service Agreements.
31

Operations and maintenance Purchased power
Nonfederal projects Depreciation and amortization
Net interest
$2,000
1,500
1,000
500
0 2014 2013 2012
Mill
ions
of d
olla
rs
34
Operating and net interest expenses
2014 expenses compared to 2013For the fiscal year ended Sept. 30, 2014, operating expenses decreased $264 million compared tofiscal year 2013.
Operations and maintenance expense increased $57 million, or 3 percent, for fiscal year 2014 compared to fiscal year 2013.
• Transmission operations, maintenance and engineering increased $30 million primarily due to increased spending on power system control maintenance and control center support, substation and line maintenance, information technology and vegetation management.
• Decommissioning expenses increased year-over-year by $27 million primarily as a result of a credit in fiscal year 2013 for a settlement of spent fuel storage costs at the terminated Trojan nuclear facility.
• Federal hydro maintenance increased $26 million due to higher labor, materials, equipment and contract costs related to reliability needs for operations and maintenance, engineering support andproject planning and management.
• General and administrative costs increased $16 million due to increased spending to supportinformation technology applications and infrastructure and also various other activities to support Transmission and Power Services.
• Renewable generation increased $6 million primarily due to more abundant wind generation in fiscal year 2014.
The year-over-year increase in operations and maintenance was partially offset by the following factors:
• A $32 million reduction for Energy Northwest’s Columbia Generating Station nuclear power plant, as fiscal year 2014 was an off-year of the biennial refueling cycle, and higher maintenance was performed in fiscal year 2013.
• Reductions of $9 million for power marketing and operations and transmission reimbursable programs.
• A $7 million reduction in fish and wildlife program expenditures due to delays associated with permitting and environmental compliance for restoration actions and land acquisitions.
3332

35
Purchased power expense increased $45 million, or 29 percent, for fiscal year 2014 compared to fiscal year 2013. The increase in purchased power was driven mainly by below-average streamflows from October through February and September and reduced turbine capacity at Grand Coulee Dam to meet peak loads.
Nonfederal projects debt service expense decreased $377 million compared to fiscal year 2013. During fiscal year 2014, and consistent with a regional cooperation debt refinancing, Energy Northwest with BPA support undertook debt management actions for Projects 1 and 3, and reduced debt service and amortization of the related regulatory assets in fiscal year 2014 by $378 million from rate case estimates. These debt management actions increased the average remaining maturities of Energy Northwest outstanding debt for Projects 1 and 3, consistent with the originally expected useful lives of the related facilities. As a result of these actions, amounts otherwise collected in BPA’s current power rates were not used to fund scheduled Projects 1 and 3 principal payments as originally intended, and as included in rates, and were instead used to repay, before their maturity dates, $321 million of higher interest rate federal appropriations during fiscal year 2014. While these actions were cash flow neutral, they impacted reported expenses because principal payments on Energy Northwest debt are included in operating expenses as nonfederal projects expense. In connection with these actions, BPA’s administrator clarified prospective rate-making principles to specify that the debt service on the long-term refinancing bonds that Energy Northwest issued would be fully recovered in BPA’s future rates. Therefore, BPA reduced reported debt service expense for Energy Northwest’s Projects 1 and 3 by $378 million, which reduced amortization of the applicable regulatory assets and resulted in higher net revenues than would have otherwise been reported.
Depreciation and amortization expense increased $11 million, or 3 percent, primarily due to greatertransmission and generation completed plant.
Net interest expense decreased $30 million, or 10 percent, through the end of fiscal year 2014 as compared to fiscal year 2013.
• Interest expense decreased $23 million. During fiscal year 2014, BPA called $1.18 billion of previously issued U.S. Treasury borrowings prior to maturity and reissued $1.14 billion principal amount of shorter duration debt at lower interest rates, resulting in a non-cash gain of $36 million, which decreased interest expense.
• Allowance for funds used during construction (AFUDC), a reduction to interest expense, increased$13 million due to greater construction work-in-progress balances.
• Interest income decreased $6 million due to a lower cash balance with U.S. Treasury and lower interest rates earned on the balance.
2013 expenses compared to 2012For the fiscal year ended Sept. 30, 2013, operating expenses increased $172 million from fiscal year 2012,or 6 percent.
Operations and maintenance expense increased $47 million, or 3 percent, from the prior fiscal year, as reported in the Combined Statements of Revenues and Expenses primarily due to:
• Bureau of Reclamation costs increased by $38 million, primarily due to additional non-routine extraordinary maintenance work at Grand Coulee Dam associated with the Third Power Plant overhaul.
• CGS costs increased $38 million because of biennial refueling and maintenance work performed in fiscal year 2013.
• Transmission maintenance costs increased $11 million due to increased compliance activities and upgrades to BPA’s communication systems.
33

36
• Transmission reimbursable cost increased $7 million primarily as a result of Hurricane Sandy East Coast emergency response activity.
• These increases were offset in part by $28 million from a settlement for costs incurred to store spent fuel at the terminated Trojan nuclear facility. BPA also reduced spending on long-term and renewable generation projects by $7 million, transmission marketing and business support by $7 million, andtransmission acquisition and ancillary services by $5 million.
Purchased power expense increased $11 million, or 8 percent, from the prior fiscal year. The increase in purchased power was driven mainly by lower year-over-year hydro generation and reduced output of CGSdue to scheduled refueling and maintenance in fiscal year 2013, as previously discussed.
Nonfederal projects debt service expense increased $74 million, or 11 percent, for fiscal year 2013 compared to fiscal year 2012 due to increased scheduled debt payments for Energy Northwest’s Columbia GeneratingStation and terminated nuclear Projects 1 and 3. Since 1989, Energy Northwest debt service has been periodically restructured to achieve overall federal and nonfederal debt service objectives that reduced nonfederal projects expense. These debt management actions have created an uneven Energy Northwest debt service structure that can result in significant variances from year to year.
Depreciation and amortization expense increased $40 million, or 10 percent, from the prior fiscal year primarily due to higher transmission and generation completed plant.
Net interest expense increased $48 million, or 20 percent, for the year ended Sept. 30, 2013, from the comparable period a year before.
• Interest expense increased $25 million, or 7 percent, due to increased borrowing necessary to finance power-related construction projects and lease financed transmission construction projects, and to a one-time reduction in fiscal year 2012 of interest and other costs allocated to power purposes at Cougar Dam.
• Allowance for funds used during construction (AFUDC) decreased $8 million, or 18 percent, due to the completion of certain construction projects and a lower AFUDC rate.
• Interest income decreased $15 million, or 34 percent, as the result of interest income recognized in 2012 related to outstanding receivables and, to a lesser extent, a lower interest rate earned on a lower cash balance with U.S. Treasury.
Liquidity and capital resourcesCash and cash equivalents balance and BPA reservesAs of Sept. 30, 2014, the FCRPS ending Cash and cash equivalents balance on the Combined Balance Sheet was $859 million. BPA’s fiscal year-end cash and cash equivalents balance was $546 million, and the Corps and Reclamation combined fiscal year-end cash balance was $313 million.
BPA’s year-end financial reserves for fiscal years 2014, 2013 and 2012, were $1.22 billion, $1.27 billion and$1.02 billion, respectively. Financial reserves, a liquidity measure used by BPA management, consist of BPAcash, investments in U.S. Treasury market-based special securities and deferred borrowing. The U.S. Treasury market-based special securities reflect the market value as if securities were liquidated as of Sept. 30, 2014. Deferred borrowing represents amounts that BPA is authorized to borrow from the U.S. Treasury for capital expenditures that BPA has incurred but has not borrowed for as of Sept. 30, 2014.
3534

37
BPA borrowing authority from the U.S. TreasuryThe aggregate principal amount of debt BPA is authorized by Congress to have outstanding with theU.S. Treasury at any one time is $7.70 billion. The U.S. Treasury borrowing authority may be used to finance BPA’s capital programs. In addition, BPA and the U.S. Treasury have agreed to a liquidity facility for Pacific Northwest Electric Power Planning and Conservation Act expenses in the amount of $750 million. Use of the facility is subject to the $7.70 billion overall limit. For capital programs, the related U.S. Treasury debt is termlimited depending on the facilities financed: 50 years for Corps and Reclamation capital investments, 35 years for transmission facilities, 15 years for environment and fish and wildlife projects, 12 years for conservation projects and six years for corporate capital assets.
As of Sept. 30, 2014, BPA had $4.24 billion of bonds outstanding with the U.S. Treasury. All debt issued to the U.S. Treasury after April 30, 2008, has been issued with call options exercisable by BPA. As of Sept. 30, 2014, BPA had callable borrowings totaling $3.36 billion. The interest on BPA’s outstanding borrowings fromU.S. Treasury is set at rates comparable to the rates prevailing in the market for similar bonds issued by government corporations. As of Sept. 30, 2014, the interest rates on the outstanding U.S. Treasury borrowings ranged from 0.1 percent to 5.9 percent with a weighted-average interest rate of 3.1 percent.As of Sept. 30, 2014, BPA had $661 million in outstanding variable rate U.S. Treasury bonds at an averageweighted interest rate of 0.2 percent.
Lease-Purchase ProgramThe Lease-Purchase Program enables BPA to provide for continued investment in infrastructure to support a safe and reliable system for the transmission of power without using limited U.S. Treasury borrowing authority.Under this program, BPA acts as the construction agent and has entered into lease-purchase arrangements with third parties that issue bonds and other debt instruments to fund construction of specific transmission assets. These third parties include five special purpose entities, the Idaho Energy Resources Authorityand the Port of Morrow, Oregon. The special purpose entities are collectively referred to as the Northwest Infrastructure Financing Corporations (NIFCs) and are consolidated by BPA for financial statement reporting purposes. BPA’s lease payments secure repayment of the debt instruments, as the related transmission assets are not pledged as security for repayment of the related loans or bonds.
As of Sept. 30, 2014, BPA had outstanding lease-purchase debt of $735 million with the NIFCs and capital leases of $93 million with the Idaho Energy Resources Authority and $594 million with the Port of Morrow, Oregon. The lease-purchase agreements expire on various dates through 2042. The lease-purchaseagreements contain provisions that allow BPA to purchase the assets at any time during the related lease termfor a bargain purchase price plus the value of the related outstanding debt instruments.
Customer prepaid power purchasesDuring fiscal year 2013, BPA entered into agreements with four regional consumer-owned utilities for the advance payment of customer power purchases. Under this program, customers purchased prepaid power in blocks through fiscal year 2028. For each block purchased, BPA repays the prepayment, with interest, as monthly fixed credits on the customers’ power bills.
In March 2013, BPA received $340.0 million representing $474.3 million in scheduled credits for blocks purchased by customers. BPA accounts for the prepayment proceeds as a financing transaction and reports the value of the obligations associated with the fixed credits as a prepayment liability. Interest expense is recognized using a weighted-average effective interest rate of 4.5 percent. The prepaid liability is reduced as power is delivered and the credits are applied through fiscal year 2028.
35

38
Treasury paymentBPA made its U.S. Treasury payment of $991 million for fiscal year 2014. The 2014 payments included $567 million in principal and $333 million in interest for U.S. Treasury debt and for the appropriated federal investment in the FCRPS. This fiscal year’s principal payment included $321 million to repay federal appropriations to the U.S. Treasury in excess of the base payment calculated for FERC filings. BPA also paid the U.S. Treasury $53 million for irrigation assistance and $38 million for other FCRPS costs. Payments made in fiscal years 2013 and 2012 were $692 million and $886 million, including $56 million and $53 million, respectively, to repay federal appropriations and bonds issued to the U.S. Treasury in excess of the base payments calculated for FERC filings.
Fiscal year 2014 is the 31st consecutive year in which BPA has made its scheduled payments on time and in full.
Credit ratingsCredit ratings on nonfederal debt backed by BPA as of Sept. 30, 2014, were as follows:
• Moody’s at Aa1 with a stable outlook
• Standard & Poor’s at AA- with a stable outlook
• Fitch at AA with a stable outlook
Summary cash flowsFederal Columbia River Power System For the years ended Sept. 30 (thousands of dollars)
2014 2013 2012Cash and cash equivalents at beginning of year $1,010,128 $ 948,859 $ 892,125Cash flows from
Operating activities 697,602 568,645 648,023Investing activities (1,250,044) (897,713) (837,491)Financing activities 401,556 390,337 246,202
Net increase (decrease) in cash and cash equivalents (150,886) 61,269 56,734
Cash and cash equivalents at end of year $ 859,242 $ 1,010,128 $ 948,859
Operating activitiesAs a result of the factors previously discussed, particularly the non-cash effects of the fiscal year 2014 Energy Northwest Projects 1 and 3 debt management actions, the FCRPS had net revenues of $444 million for fiscal year 2014. By comparison, net expenses were $105 million for fiscal year 2013. Net cash provided by operating activities increased $129 million to $698 million for fiscal year 2014 when compared to the prior year, primarily as a result of higher net revenues associated with favorable water conditions and greater sales.During fiscal year 2014, BPA paid the remaining balance of $89 million to certain investor-owned utilities related to the 2008 Residential Exchange Program Interim Agreement true-up payments.
Cash flows from operating activities decreased $79 million to $569 million for fiscal year 2013, compared to fiscal year 2012. As a result of stable revenues, increased operations and maintenance and nonfederal projects debt service expense, the FCRPS incurred net expenses of $105 million for the fiscal year 2013. By comparison,net revenues were $87 million for the fiscal year ended Sept. 30, 2012. The year-over-year changes in operating cash flow activities reflect differences in the timing of collecting receivables and payments of accountspayable, and increases in depreciation and amortization. In fiscal year 2012 BPA received a cash paymentof $74 million for outstanding accounts receivable related to the West Coast energy crisis of 2000 and 2001.
3736

39
Investing activitiesNet cash used for investing activities increased $352 million to $1.25 billion for fiscal year 2014, when compared to fiscal year 2013. BPA continues to make significant investments in FCRPS utility plant with $843 million invested in 2014, an increase of $64 million from 2013.
The net incremental investment for market-based specials classified as investments on the Combined Balance Sheets was $142 million, an increase of $11 million over 2013. Under a banking arrangement with the U.S. Treasury, BPA agreed to invest an additional $100 million annually through 2018 or until the BPA fund is fully invested. Therefore, the balances for which BPA receives comparatively high interest repayment credits declines annually.
Fiscal year 2014 deposits to the Lease-Purchase Program restricted trust funds increased by $375 million as a result of entering into larger individual leases than in fiscal year 2013. These leases included Central Ferry-Lower Monumental and the Celilo-Sylmar line projects. Receipts from the restricted trust funds also increased by $97 million over fiscal year 2013 as the construction program continued to grow.
Net cash used for investing activities of the FCRPS increased $60 million to $898 million for fiscal year 2013, when compared to fiscal year 2012. Significant investment in FCRPS utility plant was made with $779 million invested in 2013, which was down $83 million from 2012. The net incremental investment for market-based specials classified as investments on the Combined Balance Sheets, purchases less maturities, for fiscal year 2013 was $131 million, which was an increase of $135 million over the comparative period in the prior year. The increase in 2013 was the result of $60 million of market-based specials that matured in 2012 and were reinvested in 2013, as well as an overall increase in net investment activity.
Financing activitiesNet cash provided by financing activities of the FCRPS was $402 million for the fiscal year ended Sept. 30, 2014, compared to $390 million for fiscal year 2013.
As described above, in fiscal year 2014 Energy Northwest took debt management actions associated with regional cooperation debt. These actions freed up cash in the Bonneville Fund, which enabled the prepayment of $321 million of federal appropriations repayment obligations.
BPA borrowings from the U.S. Treasury for fiscal year 2014 totaled $603 million, which was $29 million lowerthan in fiscal year 2013. Of the $603 million borrowed, $268 million bears interest at fixed rates and $335 million bears interest at variable rates. The proceeds funded investments of $371 million for transmission, $92 million for generation, $99 million for conservation and $41 million for fish and wildlife programs.
Nonfederal debt proceeds increased to $520 million in fiscal year 2014 from $489 million in fiscal year 2013, or an increase of $31 million. This increase was primarily due to greater proceeds in fiscal year 2014 for the Lease-Purchase Program offset by the one-time $340 million proceeds for the Customer Prepayment PowerPurchase Program received in fiscal year 2013. Nonfederal debt repayments decreased to $227 million in fiscal year 2014 from $499 million in 2013, primarily as a result of debt management actions previously discussed.
Net cash provided by financing activities of the FCRPS was $390 million for fiscal year 2013, compared to $246 million for 2012.
BPA borrowings from the U.S. Treasury for fiscal year 2013 were $632 million, or $174 million less than fiscal year 2012 borrowings. The $632 million was borrowed at fixed interest rates and was used to fund investments of $302 million for transmission, $220 million for generation, $56 million for conservation and $54 million for fish and wildlife programs. Nonfederal debt proceeds increased from $202 million in fiscal year 2012 to $489 million in fiscal year 2013. Of the $489 million, $340 million was for customer prepayment power purchases received in March 2013 and $149 million was for new Lease-Purchase Program arrangements with consolidatedspecial purpose corporations and an unconsolidated third party, the Port of Morrow, Oregon. Nonfederaldebt repayments increased from $364 million in fiscal year 2012 to $499 million for fiscal year 2013. The
37

40
$135 million increase was primarily due to higher principal payments for Energy Northwest’s Columbia Generating Station and terminated nuclear Energy Northwest Projects 1 and 3.
Contractual obligations and federal paymentsAmounts shown in the following table include interest expense or represent undiscounted cash flows and aretherefore higher than amounts for these line items reflected in the Combined Balance Sheets and describedin the Notes to Financial Statements — Note 4, Asset Retirement Obligations; Note 6, Federal Appropriations; Note 7, Borrowings from U.S. Treasury; Note 8, Nonfederal Financing; and Note 10, Residential Exchange Program. Irrigation assistance is treated as a distribution from accumulated net revenues when paid. Purchase power commitments are a period expense. Irrigation assistance and purchase power commitments are described in Note 14, Commitments and Contingencies.
CONTRACTUAL OBLIGATIONS AND FEDERAL PAYMENTSAs of Sept. 30 (thousands of dollars)
2015 2016 2017 2018 2019 2020+ Total
Federal appropriations $ 216,772 $ 216,772 $ 216,772 $ 216,772 $ 222,858 $ 9,413,731 $ 10,503,677
Nonfederal financing 1,103,724 1,093,301 833,996 1,143,169 807,440 4,316,013 9,297,643
Borrowings - U.S. Treasury 298,000 30,000 68,400 9,000 574,940 3,261,700 4,242,040
IOU exchange benefits 197,500 214,100 214,100 232,200 232,200 2,413,900 3,504,000
Irrigation assistance 52,204 61,066 51,482 27,612 57,317 305,206 554,887
REP Refund Amounts 76,538 76,537 76,538 76,537 76,538 -- 382,688
Purchase power commitments 24,656 32,337 70,446 74,834 77,563 77,580 357,416
Asset retirement obligations 4,605 4,653 4,808 4,908 5,045 197,180 221,199
Total $ 1,973,999 $ 1,728,766 $ 1,536,542 $ 1,785,032 $ 2,053,901 $ 19,985,310 $ 29,063,550
Off-balance sheet arrangementsThe FCRPS is not engaged in any off-balance sheet arrangements through unconsolidated limitedpurpose entities.
3938

41
Critical accounting policies and estimatesCertain accounting policies require management to make estimates and judgments concerning transactions that will be settled in the future. Amounts recognized in the financial statements from such estimates are based upon numerous assumptions involving varying and potentially significant degrees of judgment and uncertainty. Accordingly, certain amounts currently reflected in the financial statements will likely increase or decrease in the future as additional information becomes available.
Regulatory accountingBPA’s rates are designed to recover its cost of service. In connection with the rate-setting process, certain current costs or credits may be included in rates for recovery or refund over future periods. Under those circumstances, regulatory assets or liabilities are recorded in accordance with authoritative guidance for Regulated Operations. Such costs or credits are amortized during the periods they are scheduled in rates.
In order to apply regulatory accounting, an entity must have the statutory authority to establish rates that recover all costs, and rates so established must be charged to and collected from customers. If BPA’s rates should become market-based, any deferred costs and revenues would be recognized in the Combined Statement of Revenues and Expenses in that period. Since BPA’s rates are not structured to provide a rateof return, regulatory assets are recovered at cost without an additional rate of return. Amortization ofthese assets and liabilities is reflected in the Combined Statements of Revenues and Expenses.
RevenuesRevenues on sales of power and transmission are recognized either when the service is provided or the product is delivered. Operating revenues include estimates for unbilled power and transmission services thatwere delivered but not billed by the end of the fiscal year. Accrued unbilled revenues are estimated from forecasts based on multiple factors including streamflows, seasonality, weather, changes in electricity prices, and customer load and usage patterns. Consequently, the amount of accrued unbilled revenues can vary significantly from period to period.
At Sept. 30, 2014 and 2013, BPA had $283 million and $261 million, respectively, of accrued unbilled revenues.
Risk managementDue to the operational risk posed by fluctuations in river flows and electricity market prices, net revenues that result from underlying surplus or deficit energy positions are inherently uncertain. BPA’s TransactingRisk Management Committee has responsibility for the oversight of market risk and determines the transactional risk policy and control environment at BPA. Through simulation and analysis of the hydro supply system, experienced business and risk managers install market price risk measures to capture additional market-related risks, including credit and event risk.
Adjusted net revenuesIn fiscal year 2013, BPA developed a new Key Agency Target called Adjusted Net Revenues (ANR). ANR isnet revenues after removing the current year effects of certain debt management actions, in particular the Debt Service Reassignment, from prior years. Beginning in fiscal year 2014, ANR also removes the current year effects of certain debt management actions associated with Energy Northwest’s Projects 1 and 3 debt refinancing actions. These actions, including debt maturity extensions, now enable BPA to use amounts otherwise collected in its rates to repay Energy Northwest debt to instead repay a like amount of higher interest rate federal appropriations.
39

42
Debt Service Reassignment actions were implemented to increase available U.S. Treasury borrowing authority by extending Energy Northwest’s debt repayments and using the resultant freed-up cash to repayU.S. Treasury debt. With the Energy Northwest debt maturing and due, nonfederal projects expense would behigher, resulting in lower FCRPS net revenues.
In fiscal year 2014, debt management actions for Energy Northwest Projects 1 and 3 lowered nonfederal projects expense compared to what would have otherwise been reported and what was included for recovery in power rates. This effect resulted in higher reported net revenues.
The effects of these debt management actions are not considered to be related to ongoing FCRPS operations, and management has therefore determined that ANR is a better representation of FCRPS financial performance for the period. The table below presents the calculation for ANR.
ADJUSTED NET REVENUESFederal Columbia River Power SystemFor the fiscal year ended Sept. 30 (millions of dollars)
2014 2013 2012*Net revenues (expenses) $ 444 $ (105) $ 87Adjustments
Debt Service Reassignment 170 161 41Energy Northwest Projects 1 and 3debt management actions (378) -- --
Adjusted Net Revenues $ 236 $ 56 $ 128
*Fiscal year 2012 is presented for comparative purposes only, as BPA did not apply the concept of ANR until fiscal year 2013.
40

u.S. ARMy cORPS OF ENgINEERS, By DAVID LEWIS


3
Federal Columbia River Power SystemCombined Balance SheetsAs of September 30
2014 2013AssetsUtility plant
Completed plant 16,618,215$ 16,153,536$
Accumulated depreciation (5,941,078) (5,700,821)
Net plant 10,677,137 10,452,715
Construction work in progress 1,603,811 1,344,033
Net utility plant 12,280,948 11,796,748
Nonfederal generation 3,361,386 3,243,713
Current assetsCash and cash equivalents 859,242 1,010,128
Short-term investments in U.S. Treasury securities 465,756 388,914
Accounts receivable, net of allowance 24,321 29,540
Accrued unbilled revenues 283,377 260,757
Materials and supplies, at average cost 112,445 112,019
Prepaid expenses 32,443 40,458
Total current assets 1,777,584 1,841,816
Other assetsRegulatory assets 6,741,604 6,953,397
Investments in U.S. Treasury securities 94,542 34,961
Nonfederal nuclear decommissioning trusts 279,210 254,752
Deferred charges and other 396,876 146,682
Total other assets 7,512,232 7,389,792
Total assets 24,932,150$ 24,272,069$
The accompanying notes are an integral part of these statements.
(Thousands of Dollars)
4544
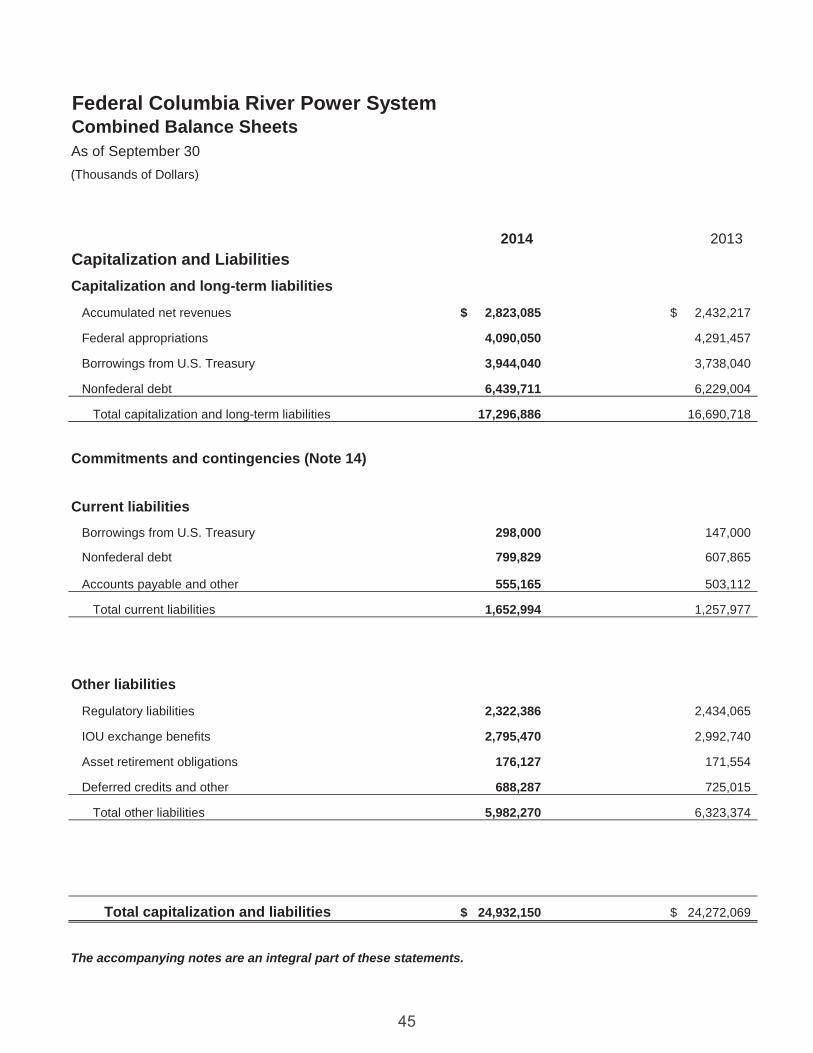
4
Federal Columbia River Power SystemCombined Balance SheetsAs of September 30
2014 2013Capitalization and LiabilitiesCapitalization and long-term liabilities
Accumulated net revenues 2,823,085$ 2,432,217$
Federal appropriations 4,090,050 4,291,457
Borrowings from U.S. Treasury 3,944,040 3,738,040
Nonfederal debt 6,439,711 6,229,004
Total capitalization and long-term liabilities 17,296,886 16,690,718
Commitments and contingencies (Note 14)
Current liabilities
Borrowings from U.S. Treasury 298,000 147,000
Nonfederal debt 799,829 607,865
Accounts payable and other 555,165 503,112
Total current liabilities 1,652,994 1,257,977
Other liabilities
Regulatory liabilities 2,322,386 2,434,065
IOU exchange benefits 2,795,470 2,992,740
Asset retirement obligations 176,127 171,554
Deferred credits and other 688,287 725,015
Total other liabilities 5,982,270 6,323,374
Total capitalization and liabilities 24,932,150$ 24,272,069$
The accompanying notes are an integral part of these statements.
(Thousands of Dollars)
45

5
Federal Columbia River Power SystemCombined Statements of Revenues and ExpensesFor the Years Ended September 30
2014 2013 2012Operating revenues
Sales 3,426,514$ 3,175,570$ 3,179,592$
U.S. Treasury credits for fish 103,853 84,092 76,983
Miscellaneous revenues 69,979 86,619 61,275
Total operating revenues 3,600,346 3,346,281 3,317,850
Operating expensesOperations and maintenance 1,901,288 1,843,972 1,796,902
Purchased power 199,056 154,173 143,119
Nonfederal projects 355,828 733,313 659,680
Depreciation and amortization 440,524 429,717 389,097
Total operating expenses 2,896,696 3,161,175 2,988,798
Net operating revenues 703,650 185,106 329,052
Interest expense and (income)Interest expense 333,820 356,337 331,732
Allowance for funds used during construction (50,236) (37,529) (45,845)
Interest income (23,446) (28,937) (43,587)
Net interest expense 260,138 289,871 242,300
Net revenues (expenses) 443,512 (104,765) 86,752
Accumulated net revenues at October 1 2,432,217 2,595,940 2,510,373
Irrigation assistance (52,644) (58,958) (1,185) Accumulated net revenues at September 30 2,823,085$ 2,432,217$ 2,595,940$
The accompanying notes are an integral part of these statements.
(Thousands of Dollars)
4746
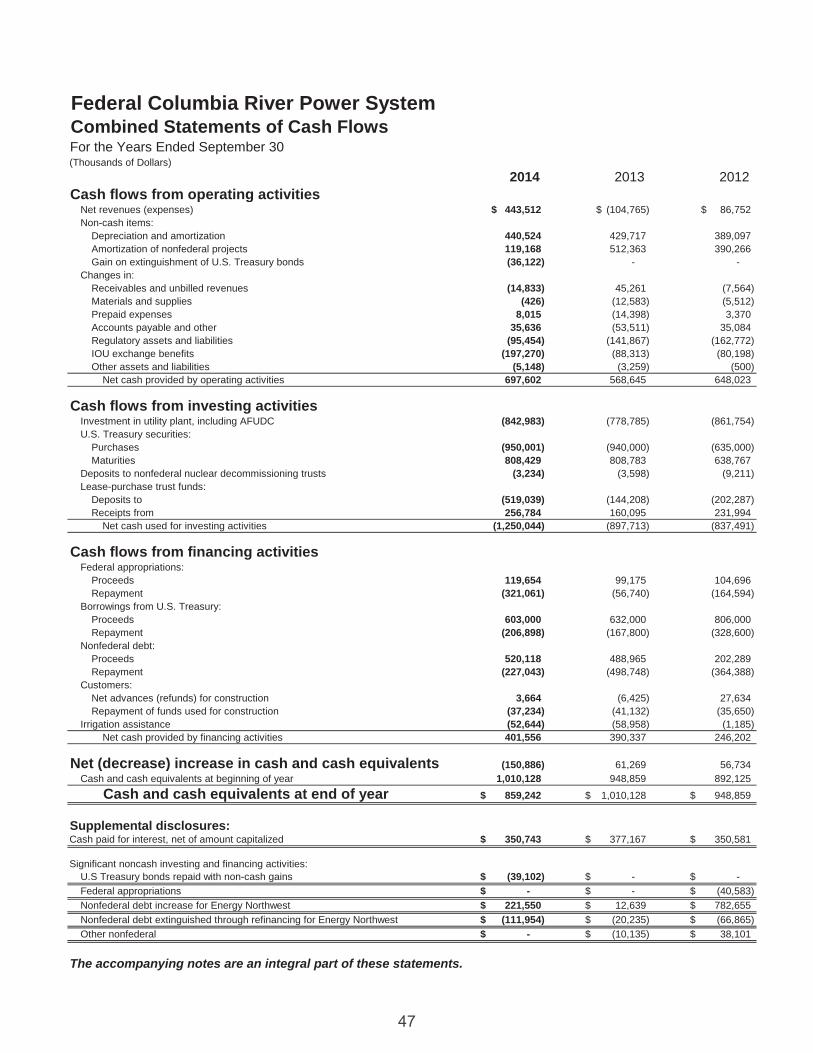
6
Federal Columbia River Power SystemCombined Statements of Cash FlowsFor the Years Ended September 30
2014 2013 2012Cash flows from operating activities
Net revenues (expenses) 443,512$ (104,765)$ 86,752$ Non-cash items:
Depreciation and amortization 440,524 429,717 389,097Amortization of nonfederal projects 119,168 512,363 390,266Gain on extinguishment of U.S. Treasury bonds (36,122) - -
Changes in:Receivables and unbilled revenues (14,833) 45,261 (7,564)Materials and supplies (426) (12,583) (5,512)Prepaid expenses 8,015 (14,398) 3,370Accounts payable and other 35,636 (53,511) 35,084Regulatory assets and liabilities (95,454) (141,867) (162,772)IOU exchange benefits (197,270) (88,313) (80,198)Other assets and liabilities (5,148) (3,259) (500)
Net cash provided by operating activities 697,602 568,645 648,023
Cash flows from investing activitiesInvestment in utility plant, including AFUDC (842,983) (778,785) (861,754)U.S. Treasury securities:
Purchases (950,001) (940,000) (635,000)Maturities 808,429 808,783 638,767
Deposits to nonfederal nuclear decommissioning trusts (3,234) (3,598) (9,211)Lease-purchase trust funds:
Deposits to (519,039) (144,208) (202,287)Receipts from 256,784 160,095 231,994
Net cash used for investing activities (1,250,044) (897,713) (837,491)
Cash flows from financing activitiesFederal appropriations:
Proceeds 119,654 99,175 104,696Repayment (321,061) (56,740) (164,594)
Borrowings from U.S. Treasury:Proceeds 603,000 632,000 806,000Repayment (206,898) (167,800) (328,600)
Nonfederal debt:Proceeds 520,118 488,965 202,289Repayment (227,043) (498,748) (364,388)
Customers:Net advances (refunds) for construction 3,664 (6,425) 27,634Repayment of funds used for construction (37,234) (41,132) (35,650)
Irrigation assistance (52,644) (58,958) (1,185)Net cash provided by financing activities 401,556 390,337 246,202
Net (decrease) increase in cash and cash equivalents (150,886) 61,269 56,734Cash and cash equivalents at beginning of year 1,010,128 948,859 892,125
Cash and cash equivalents at end of year 859,242$ 1,010,128$ 948,859$
Supplemental disclosures:Cash paid for interest, net of amount capitalized 350,743$ 377,167$ 350,581$
Significant noncash investing and financing activities:U.S Treasury bonds repaid with non-cash gains (39,102)$ -$ -$ Federal appropriations -$ -$ (40,583)$ Nonfederal debt increase for Energy Northwest 221,550$ 12,639$ 782,655$ Nonfederal debt extinguished through refinancing for Energy Northwest (111,954)$ (20,235)$ (66,865)$ Other nonfederal -$ (10,135)$ 38,101$
The accompanying notes are an integral part of these statements.
(Thousands of Dollars)
47

7
Notes to Financial Statements1. Summary of Significant Accounting PoliciesACCOUNTING PRINCIPLES
Combination and consolidation of entitiesThe Federal Columbia River Power System (FCRPS) financial statements combine the accounts of the Bonneville Power Administration (BPA), the accounts of the Pacific Northwest generating facilities of the U.S. Army Corps of Engineers (Corps) and the Bureau of Reclamation (Reclamation) as well as the operations and maintenance costs of the U.S. Fish and Wildlife Service for the Lower Snake River Compensation Plan facilities. Consolidated with BPA are “Special Purpose Corporations” known as Northwest Infrastructure Financing Corporations (NIFCs), from which BPA leases certain transmission facilities. (See Note 8, Nonfederal Financing.)
BPA is the power marketing administration that purchases, transmits and markets power for the FCRPS. Each of the combined entities is separately managed, but the facilities are operated as an integrated power system with the financial results combined as the FCRPS. While the costs of Corps and Reclamation projects serve multiple purposes, only the power portion of total project costs are assigned to the FCRPS through a cost allocation process. All intracompany and intercompany accounts and transactions have been eliminated from the combined financial statements.
FCRPS accounts are maintained in accordance with generally accepted accounting principles of the United States of America and the Uniform System of Accounts (USoA) prescribed for electric utilities by the Federal Energy Regulatory Commission (FERC). FCRPS accounting policies also reflect specific legislation and directives issued by U.S. government agencies. BPA is a separate and distinct entity within the U.S. Department of Energy; Reclamation and U.S. Fish and Wildlife Service are part of the U.S. Department of the Interior; and the Corps is part of the U.S. Department of Defense. U.S. government properties and income are tax exempt.
Use of estimatesThe preparation of financial statements in conformity with generally accepted accounting principles requires management to make estimates and assumptions that affect the reported amounts of assets and liabilities, the disclosure of contingent assets and liabilities at the date of the financial statements, and the reported amounts of revenues and expenses during the reporting period. Actual results could differ from those estimates.
Rates and regulatory authorityBPA establishes separate power and transmission rates in accordance with several statutory directives. Rates proposed by BPA are subject to an extensive formal hearing process, after which they are proposed by BPA and reviewed by FERC. FERC’s review is based on BPA statutes that include a requirement that rates must be sufficient to ensure repayment of the federal investment in the FCRPS over a reasonable number of years after first meeting BPA’s other costs. After the final FERC approval, BPA’s rates may be reviewed by the United States Court of Appeals for the Ninth Circuit (Ninth Circuit Court) if challenged by parties involved in the rate proceedings. Petitions seeking such review must be filed within 90 days of the final FERC approval. The Ninth Circuit Court may either confirm or reject a rate proposed by BPA. BPA’s rates are not structured to provide a rate of return on its assets.
In accordance with authoritative guidance for Regulated Operations, certain costs or credits may be included in rates for recovery or refund over a future period and are recorded as regulatory assets or liabilities. (See Note 3, Effects of Regulation.)
48

498
Utility plantUtility plant is stated at original cost and includes generation and transmission assets. Generation assets were $8.62 billion and $8.43 billion at Sept. 30, 2014, and 2013, respectively. Transmission assets were $7.99 billion and $7.72 billion, including assets under capital lease agreements of $150.7 million and $127.7 million, at Sept. 30, 2014, and 2013, respectively. The costs of substantial additions, major replacements and substantial betterments are capitalized. Costs include direct labor and materials; payments to contractors; indirect charges for engineering, supervision and similar overhead items; and an allowance for funds used during construction(AFUDC). Maintenance, repairs and replacements of items determined to be less than major units of property are charged to maintenance and operating expense as incurred. When utility plant is retired, the original cost and any net proceeds from the disposition are charged to accumulated depreciation.
Depreciation and amortizationDepreciation of the original cost of generation plant is computed using straight-line methods based on estimated service lives of the various classes of property, which average 75 years. For transmission plant, depreciation of original cost and estimated net cost of removal is computed primarily on the straight-line group life method based on estimated service lives of the various classes of property, which average 48 years. The estimated net cost of removal is included in depreciation.
In the event removal costs are expected to exceed salvage proceeds, a reclassification of this negative salvage is made from accumulated depreciation to a regulatory liability. As actual removal costs are incurred, the associated regulatory liability is reduced.
Amortization expense relates primarily to certain regulatory assets. (See Note 3, Effects of Regulation.)
Allowance for funds used during constructionAFUDC represents the estimated cost of interest on financing the construction of new assets. AFUDC is based on the construction work in progress balance and is charged to the capitalized cost of the utility plant asset. AFUDC is a reduction of interest expense.
AFUDC is capitalized at one rate for Corps and Reclamation construction funded by congressional appropriations and at another rate for construction funded substantially by BPA and the NIFCs. The rates for appropriated funds are provided each year to BPA by the U.S. Treasury, whereas the BPA rate is determined based on the weighted-average cost of borrowing for BPA and for the Lease-Purchase Program. The respective rates for appropriated and BPA funds were approximately 0.1 percent and 3.7 percent in fiscal year 2014, 0.1 percent and 3.6 percent in fiscal year 2013, and 0.1 percent and 4.1 percent in fiscal year 2012.
Nonfederal generation BPA contracted to acquire all of the generating capability of Energy Northwest’s Columbia Generating Station (CGS) nuclear power plant and Lewis County PUD’s Cowlitz Falls Hydroelectric Project. These contracts require BPA to meet all of the facilities’ operating, maintenance and debt service costs. Operations and maintenance and debt service expenses for these projects are recognized based upon total project cash funding requirements. The Nonfederal generation assets in the Combined Balance Sheets are amortized over the term of the outstanding debt, with the amortization expense included in Nonfederal projects on the Combined Statements of Revenues and Expenses. (See Note 8, Nonfederal Financing.)
Cash and cash equivalentsCash amounts include cash in the Bonneville Power Administration Fund (Bonneville Fund) with the U.S. Treasury and unexpended appropriations of the Corps and Reclamation. Cash equivalents consist of investments in non-marketable market-based special securities issued by the U.S. Treasury (market-based specials) with maturities of 90 days or less at the date of investment. The carrying value of cash and cash equivalents approximates fair value.

9
Concentrations of credit risksGeneral credit riskFinancial instruments that potentially subject the FCRPS to concentrations of credit risk consist primarily of BPA accounts receivable. Credit risk represents the loss that would be recognized if counterparties fail to perform as contracted.
BPA’s accounts receivable are spread across a diverse group of customers throughout the western United States and Canada, and include consumer-owned utilities (COUs), investor-owned utilities (IOUs), power marketers, wind generators and others. BPA’s accounts receivable exposure is generally from large and stable counterparties and does not represent a significant concentration of credit risk. During fiscal years 2014, 2013and 2012, BPA experienced no material losses as a result of any customer defaults or bankruptcy filings.
BPA mitigates credit risk by reviewing counterparties for creditworthiness, establishing credit limits andmonitoring credit exposure on a daily basis. In order to further manage credit risk, BPA obtains credit support, such as letters of credit, parental guarantees, and cash in the form of prepayments, deposits or escrow funds from some counterparties. BPA closely monitors counterparties for changes in financial condition and regularly updates credit reviews.
Allowance for doubtful accounts Management reviews accounts receivable on a monthly basis to determine if any receivable will potentially be uncollectible. The allowance for doubtful accounts includes amounts estimated through an evaluation of specific customer accounts, based upon the best available facts and circumstances of customers that may be unable to meet their financial obligations, and a reserve for all other customers based on historical experience. The balance is not material to the financial statements.
Derivative instrumentsDerivative instruments are measured at fair value and recognized on the Combined Balance Sheets as either an asset or liability unless the contract is eligible for the normal purchases and normal sales exception under Derivatives and Hedging accounting guidance. Forward electricity contracts are generally considered normal purchases and normal sales if they require physical delivery, are expected to be used or sold in the normal course of business and meet the derivative accounting definition of capacity. Recognition of these contracts in Sales or Purchased power in the Combined Statements of Revenues and Expenses occurs when the contracts settle.
The fair value of derivative instruments that do not qualify for the normal purchases and normal sales exception are recognized on the Combined Balance Sheets as deferred credits or deferred charges. Changes in fair value are not recognized in the Combined Statements of Revenues and Expenses but are deferred as either regulatory assets or regulatory liabilities in accordance with Regulated Operations accounting guidance. The FCRPS does not apply hedge accounting.
Fair valueCarrying amounts of current assets and current liabilities approximate fair value based on the short-term nature of these instruments. In accordance with authoritative guidance for Fair Value Measurements, fair value measurements are used to record adjustments to certain financial assets and liabilities and to determine fair value disclosures. When developing fair value measurements, it is FCRPS policy to use quoted market prices whenever available or to maximize the use of observable inputs and minimize the use of unobservable inputs when quoted market prices are not available. Fair values are primarily developed using industry standardmodels that consider various inputs including: (a) quoted forward prices for commodities; (b) time value; (c) volatility factors; (d) current market and contractual prices for underlying instruments; (e) market interest rates and yield curves; and (f) credit spreads, as well as other relevant economic measures. (See Note 12, Risk Management and Derivative Instruments and Note 13, Fair Value Measurements.)
50

5110
Revenues and net revenuesOperating revenues are recorded when power, transmission and related services are delivered and include estimated unbilled revenues. Net revenues over time are committed to payment of operational obligations, including debt for both operating and nonoperating nonfederal projects, debt service on bonds BPA issues to the U.S. Treasury, the repayment of federal appropriations in the FCRPS, and the payment of certain irrigation costs.
U.S. Treasury credits for fishUnder the Pacific Northwest Electric Power Planning and Conservation Act (Northwest Power Act), BPA makes expenditures for fish and wildlife protection, mitigation and enhancement for both power and nonpower purposes. Section 4(h)(10)(C) of the Northwest Power Act also specifies that consumers of electric power, through rates BPA establishes for power services, “shall bear the costs of measures designed to deal with adverse impacts caused by the development and operation of electric power facilities and programs only.” This provision of law ensures that the costs of mitigating these impacts are properly accounted for among the power-related and other purposes of the federal hydroelectric projects of the FCRPS. Power-related costs are recovered in BPA’s rates. Nonpower-related costs are recovered as a reduction to BPA’s cash payments to the U.S. Treasury and are shown as a component of Operating revenues in the Combined Statements of Revenues and Expenses.
Nonfederal projectsNonfederal projects expense represents the amortization of nonfederal generation assets and regulatory assets for terminated nonfederal nuclear and hydro facilities, as well as the interest expense on the debt related to those assets. This expense is recognized over the terms of the related outstanding debt.
Interest expenseInterest expense includes interest associated with the balance of federal appropriations for investments in the FCRPS, interest on bonds issued by BPA to the U.S. Treasury, and interest on certain nonfederal debt.Reductions to interest expense include the amortization of a capitalization adjustment regulatory liability andalso gains related to the repayment of certain U.S. Treasury bonds considered extinguished or modified after being called and reissued. Interest expense excludes interest on certain nonfederal debt that is insteadreported as a component of nonfederal projects expense.
Interest incomeInterest income includes earnings on balances in the Bonneville Fund including market-based specials andfrom other sources. BPA continues to earn interest offset credits on certain cash balances in the Fund that are not invested in market-based specials. These credits reduce some interest payments, associated with federallyappropriated investments in the FCRPS, in the amount of the interest earned. The interest offset credits are earned at the weighted-average interest rate of BPA’s outstanding U.S. Treasury borrowings. Interest earnings on U.S. Treasury market-based special investments are based on the stated rates of the individual securities.
Residential Exchange ProgramIn order to provide qualifying regional utilities, primarily IOUs, access to power benefits from the FCRPS, Congress established the Residential Exchange Program (REP) in Section 5(c) of the Northwest Power Act. Whenever a Pacific Northwest electric utility offers to sell power to BPA at the utility’s average system cost of resources, BPA purchases such power and offers, in exchange, to sell an equivalent amount of power at BPA’s priority firm exchange rate to the utility for resale to that utility’s residential and small farm consumers. REP costs are forecast for each year of the rate period and included in the revenue requirement for establishing rates. The cost of this program is collected through rates. Program costs are recognized when incurred.
In fiscal year 2011, the BPA administrator signed the 2012 Residential Exchange Program Settlement Agreement (2012 REP Settlement Agreement), resolving disputes related to the REP. The 2012 REP Settlement Agreement provides for fixed “Scheduled Amounts” payable to the IOUs, as well as fixed “Refund Amounts” payable to the COUs. The Refund Amounts do not reduce rates but are reflected as credits to

11
qualifying COUs’ bills as designated in the 2012 REP Settlement Agreement. (See Note 10, Residential Exchange Program.)
Pension and Other Postretirement BenefitsFederal employees associated with the operation of the FCRPS participate in either the Civil Service Retirement System or the Federal Employees Retirement System. Employees may also participate in the Federal Employees Health and Benefit Program and the Federal Employee Group Life Insurance Program. All such postretirement systems and programs are sponsored by the Office of Personnel Management; therefore, FCRPS does not record any accumulated plan assets or liabilities related to the administration of suchprograms. Contribution amounts are paid to the U.S. Treasury and are recorded as expense during the year to which the payment relates.
RECENT ACCOUNTING PRONOUNCEMENTS
Balance Sheet OffsettingIn January 2013, the Financial Accounting Standards Board (FASB) issued authoritative guidance that clarifiesthe scope of disclosure about offsetting assets and liabilities that are presented on a net or gross basis in the Combined Balance Sheets. The guidance requires additional qualitative and quantitative disclosures about financial instruments and derivative instruments subject to an enforceable master netting agreement or similar agreement. FCRPS adopted this guidance on October 1, 2013. This guidance enhanced disclosures in the notes to financial statements with no impact to BPA’s financial condition, results of operations or cash flows.
Revenue RecognitionIn May 2014, the FASB issued authoritative guidance that supersedes the existing revenue recognition guidance, including most industry-specific guidance. Management is evaluating the impact of adopting this guidance, which will be effective for fiscal year 2018.
SUBSEQUENT EVENTSManagement has performed an evaluation of events and transactions for potential FCRPS recognition or disclosure through Oct. 30, 2014, which is the date the financial statements were issued.
2. Investments in U.S. Treasury SecuritiesAs of Sept. 30 — thousands of dollars 2014 2013
Amortized cost Fair value Amortized cost Fair value
Short-term $ 465,756 $ 465,821 $ 388,914 $ 389,127
Long-term 94,542 94,693 34,961 34,972
Total $ 560,298 $ 560,514 $ 423,875 $ 424,099
BPA participates in the U.S. Treasury’s Federal Investment Program, which provides investment services to federal government entities that have funds on deposit with the U.S. Treasury and have statutory authority to invest those funds. Investments of the funds are generally restricted to market-based specials. Under its banking arrangement with the U.S. Treasury, BPA has agreed to invest at least $100 million annually in market-based specials, thereby increasing the amounts of market-based specials in the Bonneville Fund. At the earlier of the date that the Bonneville Fund is fully invested or Sept. 30, 2018, all balances in the Bonneville Fund will thereafter be invested through the Federal Investment Program.
Market-based specials held during fiscal years 2014 and 2013 had a weighted-average yield of 0.2 percent and 0.3 percent, respectively, and maturities of up to two years. The amounts shown in the preceding table exclude U.S. Treasury securities with maturities of 90 days or less at the date of investment, which are considered cash
52

5312
equivalents and are included in the Combined Balance Sheets as part of Cash and cash equivalents. For all other securities, FCRPS follows the authoritative guidance for Investments, Debt and Equity Securities. These investments are classified as held-to-maturity and reported at amortized cost. Investments with maturities that will be realized in cash within one year are classified as short-term investments. Long-term investments have stated maturities occurring in October 2015 and beyond.
3. Effects of RegulationREGULATORY ASSETS
As of Sept. 30 — thousands of dollars 2014 2013
REP Scheduled Amounts $ 2,795,470 $ 2,903,634
Terminated nuclear facilities 2,031,329 2,154,900
Columbia River Fish Mitigation 656,677 600,413
REP Refund Amounts 364,208 432,850
Conservation measures 340,854 319,082
Fish and wildlife measures 309,607 302,245
Legal claims and settlements 91,755 76,601
Spacer damper replacement program 50,006 46,563
Federal Employees’ Compensation Act 32,558 32,558
Trojan decommissioning and site restoration 24,039 24,431
Derivative instruments 16,304 27,108
Terminated hydro facilities 15,860 17,238
Other 12,937 15,774
Total $ 6,741,604 $ 6,953,397
Regulatory assets include the following items: “REP Scheduled Amounts” reflect the costs of REP Scheduled Amounts representing REP benefits payable under
the 2012 REP Settlement Agreement that will be recovered in rates through 2028. These amounts amortize to operations and maintenance expense. (See Note 10, Residential Exchange Program.)
“Terminated nuclear facilities” consist of the nonfederal debt for Energy Northwest Nuclear Projects 1 and 3. Theseassets are amortized to nonfederal projects expense over the term of the related outstanding debt. (See Note 8, Nonfederal Financing.)
“Columbia River Fish Mitigation” is the cost of research and development for fish bypass facilities funded through appropriations since 1989 in accordance with the Energy and Water Development Appropriations Act of 1989, Public Law 100-371. These costs are recovered in rates over 75 years and amortized to depreciation and amortization expense.
“REP Refund Amounts” are amounts that reduce the REP benefit payments through fiscal year 2019 and wereestablished in the 2012 REP Settlement Agreement. (See Note 10, Residential Exchange Program.) These amounts are recoverable in future rates and are equal to the regulatory liability for REP Refund Amounts to COUs.
“Conservation measures” consist of the costs of deferred conservation measures and are amortized to depreciation and amortization expense over periods from five to 20 years.
“Fish and wildlife measures” consist of deferred fish and wildlife project expenses and are amortized to depreciation and amortization expense over a period of 15 years.
“Legal claims and settlements” reflect accrued liabilities related to outstanding legal claims and settlement agreements. These costs will be recovered and amortized to operations and maintenance expense through future rates over a period established by the administrator.

13
“Spacer damper replacement program” consists of costs to replace deteriorated spacer dampers and are recovered in rates under the Spacer Damper Replacement Program. These costs are amortized to depreciation and amortization expense over a period of 25 or 30 years.
“Federal Employees’ Compensation Act” reflects the actuarial estimated amount of future payments for current recipients of BPA’s worker compensation benefits. This amount equals the associated liability.
“Trojan decommissioning and site restoration” reflects the amount to be recovered in future rates for funding the Trojan asset retirement obligation (ARO) liability. This amount equals the associated liability. (See Note 4, Asset Retirement Obligations.)
“Derivative instruments” reflect the unrealized losses from BPA's derivative portfolio. (See Note 12, Risk Management and Derivative Instruments.) These amounts are deferred over the corresponding underlying contract delivery months and equal the associated liability.
“Terminated hydro facilities” consist of the nonfederal debt for the terminated Northern Wasco hydro project, for which BPA terminated its participation. These assets are amortized to nonfederal projects expense over the term of the related outstanding debt. (See Note 8, Nonfederal Financing.)
REGULATORY LIABILITIES
As of Sept. 30 — thousands of dollars 2014 2013
Capitalization adjustment $ 1,407,081 $ 1,471,986
Accumulated plant removal costs 410,532 408,218
REP Refund Amounts to COUs 364,208 432,850
Decommissioning and site restoration 129,414 109,819
Other 11,151 11,192
Total $ 2,322,386 $ 2,434,065
Regulatory liabilities include the following items:“Capitalization adjustment” is the difference between appropriated debt before and after refinancing under the
BPA Refinancing Section of the Omnibus Consolidated Rescissions and Appropriations Act of 1996 (Refinancing Act), 16 U.S.C. 838(l). The adjustment is being amortized over the remaining original period of repayment so that total FCRPS net interest expense is equal to what it would have been in the absence of the Refinancing Act. Amortization of the capitalization adjustment as a reduction to interest expense was $64.9 million for fiscal years 2014, 2013 and 2012, respectively. (See Note 6, Federal Appropriations.)
“Accumulated plant removal costs” are the amounts previously collected through rates as part of depreciation. The liability will be reduced as actual removal costs are incurred. (See Note 1, Summary of Significant Accounting Policies.)
“REP Refund Amounts to COUs” are the amounts previously collected through rates that are owed to qualifying consumer-owned utilities and will be provided as credits on their future bills through 2019 as established in the 2012 REP Settlement Agreement. These amounts are equal to regulatory assets for REP Refund Amounts. (See Note 10, Residential Exchange Program.)
“Decommissioning and site restoration” is the amount previously collected through rates and invested in the related nonfederal nuclear decommissioning trusts in excess of the ARO balances for CGS decommissioning and site restoration as well as Energy Northwest Projects 1 and 4 sites. (See Note 4, Asset Retirement Obligations.)
54

5514
4. Asset Retirement Obligations As of Sept. 30 — thousands of dollars 2014 2013
Beginning Balance $ 171,554 $ 161,215
Activities:
Accretion 8,390 8,507Expenditures (1,601) (596)Revisions (2,216) 2,428
Ending Balance $ 176,127 $ 171,554
AROs are recognized based on the estimated fair value of the dismantlement and restoration costs associated with the retirement of certain tangible long lived assets. The liability is adjusted for any revisions, expendituresand the passage of time. The FCRPS also has tangible long-lived assets such as federal hydro projects and transmission assets without an associated ARO because no obligation exists to remove these assets.
AROs include the following items as of Sept. 30, 2014:
• CGS decommissioning and site restoration of $135.5 million;• Trojan decommissioning of $24.0 million; • Energy Northwest Projects 1 and 4 site restoration of $16.6 million.
NONFEDERAL NUCLEAR DECOMMISSIONING TRUSTS
As of Sept. 30 — thousands of dollars 2014 2013
Amortized cost Fair value Amortized cost Fair value
Equity index funds $ 85,550 $ 121,088 $ 87,723 $ 117,212
U.S. government obligation mutual funds 93,537 93,329 77,022 76,801
Corporate bond index funds 61,888 64,789 59,402 60,726
Cash and cash equivalents 4 4 13 13
Total $ 240,979 $ 279,210 $ 224,160 $ 254,752
These assets represent trust fund balances for decommissioning and site restoration costs. External trust funds for decommissioning and site restoration costs are funded monthly for CGS and are charged to operations and maintenance. The trust funds are expected to provide for decommissioning at the end of the project’s safe storage period in accordance with Nuclear Regulatory Commission (NRC) requirements. The NRC requires that this period be no longer than 60 years from the time the plant ceases operations. In May 2012, the NRC renewed CGS’s operating license for an additional 20 years, with the license now expiring in 2043. Trust fund requirements for CGS are based on an NRC decommissioning cost estimate and the license termination date. The trusts are funded and managed by BPA in accordance with the NRC requirements and site certification agreements.
The investment securities in the decommissioning and site restoration trust accounts are classified as available-for-sale and recorded at fair value in accordance with accounting guidance related to Investments, Debt and Equity Securities. Unrealized gains and losses on these investment securities are recognized as adjustments to the related regulatory liability, which represents the excess of the amount previously collected through rates over the current ARO balance. (See Note 3, Effects of Regulation.)
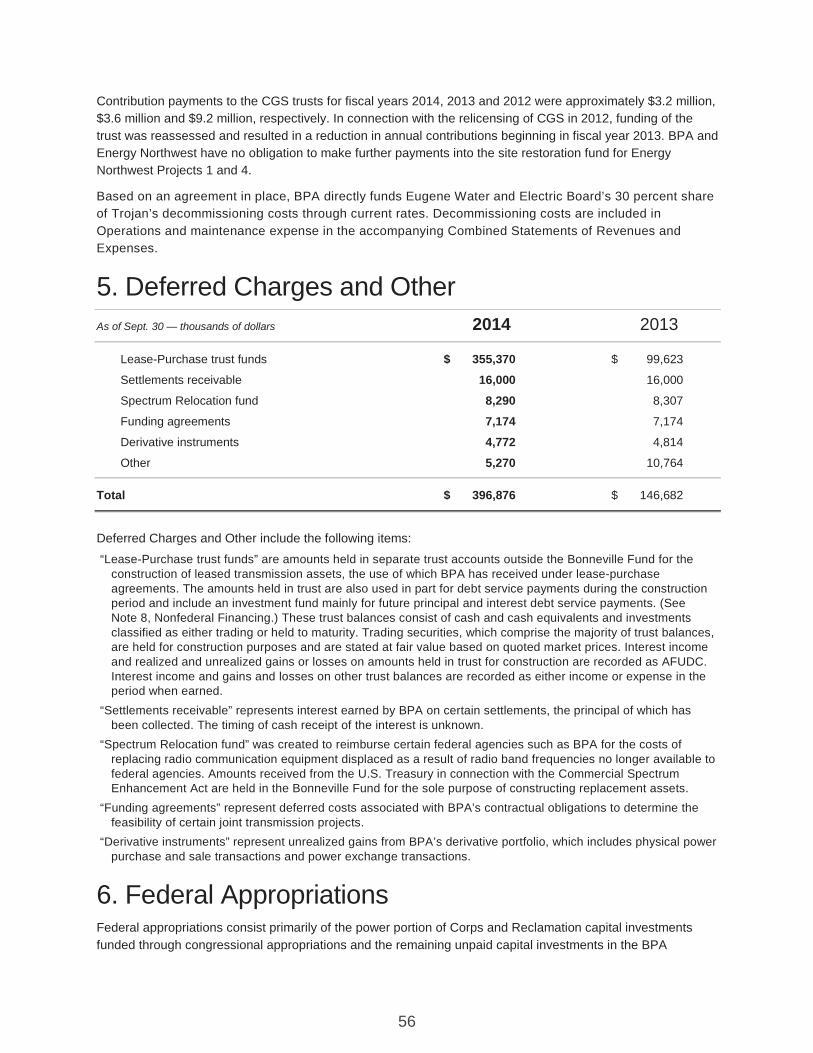
15
Contribution payments to the CGS trusts for fiscal years 2014, 2013 and 2012 were approximately $3.2 million, $3.6 million and $9.2 million, respectively. In connection with the relicensing of CGS in 2012, funding of the trust was reassessed and resulted in a reduction in annual contributions beginning in fiscal year 2013. BPA and Energy Northwest have no obligation to make further payments into the site restoration fund for Energy Northwest Projects 1 and 4.
Based on an agreement in place, BPA directly funds Eugene Water and Electric Board’s 30 percent share of Trojan’s decommissioning costs through current rates. Decommissioning costs are included in Operations and maintenance expense in the accompanying Combined Statements of Revenues and Expenses.
5. Deferred Charges and OtherAs of Sept. 30 — thousands of dollars 2014 2013
Lease-Purchase trust funds $ 355,370 $ 99,623
Settlements receivable 16,000 16,000
Spectrum Relocation fund 8,290 8,307
Funding agreements 7,174 7,174
Derivative instruments 4,772 4,814
Other 5,270 10,764
Total $ 396,876 $ 146,682
Deferred Charges and Other include the following items:“Lease-Purchase trust funds” are amounts held in separate trust accounts outside the Bonneville Fund for the
construction of leased transmission assets, the use of which BPA has received under lease-purchase agreements. The amounts held in trust are also used in part for debt service payments during the construction period and include an investment fund mainly for future principal and interest debt service payments. (See Note 8, Nonfederal Financing.) These trust balances consist of cash and cash equivalents and investments classified as either trading or held to maturity. Trading securities, which comprise the majority of trust balances,are held for construction purposes and are stated at fair value based on quoted market prices. Interest income and realized and unrealized gains or losses on amounts held in trust for construction are recorded as AFUDC.Interest income and gains and losses on other trust balances are recorded as either income or expense in the period when earned.
“Settlements receivable” represents interest earned by BPA on certain settlements, the principal of which has been collected. The timing of cash receipt of the interest is unknown.
“Spectrum Relocation fund” was created to reimburse certain federal agencies such as BPA for the costs of replacing radio communication equipment displaced as a result of radio band frequencies no longer available to federal agencies. Amounts received from the U.S. Treasury in connection with the Commercial Spectrum Enhancement Act are held in the Bonneville Fund for the sole purpose of constructing replacement assets.
“Funding agreements” represent deferred costs associated with BPA’s contractual obligations to determine the feasibility of certain joint transmission projects.
“Derivative instruments” represent unrealized gains from BPA’s derivative portfolio, which includes physical power purchase and sale transactions and power exchange transactions.
6. Federal Appropriations Federal appropriations consist primarily of the power portion of Corps and Reclamation capital investments funded through congressional appropriations and the remaining unpaid capital investments in the BPA
56

5716
transmission system prior to implementation of the Federal Columbia River Transmission System Act of 1974, 16 U.S.C. 838(j).
The Refinancing Act required that the outstanding balance of the FCRPS federal appropriations repayment balance be reset and assigned market rates of interest prevailing as of Oct. 1, 1996. This resulted in a determination that the principal amount of appropriations should be equal to the present value of the principal and interest that would have been paid to the U.S. Treasury in the absence of the Refinancing Act, plus $100 million. Appropriations in the amount of $6.69 billion were subsequently refinanced for $4.10 billion. This adjustment was recorded as a capitalization adjustment in regulatory liabilities and is being amortized over the remaining original period of repayment. (See Note 3, Effects of Regulation.)
Appropriations for federal generation and transmission plant investments are repaid to the U.S. Treasury withina specified repayment period, which is the reasonable expected service life of the facility, not to exceed50 years. Federal appropriations may be paid early without penalty. All outstanding federal appropriations are due in fiscal year 2019 and thereafter.
The weighted-average interest rate was 5.9 percent and 6.1 percent on outstanding appropriations as of Sept. 30, 2014, and 2013, respectively.
7. Borrowings from U.S. Treasury BPA is authorized by Congress to issue and sell to the U.S. Treasury, and have outstanding at any one time,up to $7.70 billion aggregate principal amount of bonds. Of the $7.70 billion in U.S. Treasury borrowing authority, $1.25 billion is available for electric power conservation and renewable resources, including capital investment at the Federal System hydroelectric facilities owned by the Corps and Reclamation, and $6.45 billion is available for BPA’s transmission capital program and to implement BPA’s authorities under the Northwest Power Act. Of the $7.70 billion, $750 million can be issued to finance Northwest Power Act related expenses. The interest on BPA’s outstanding bonds is set at rates comparable to rates on debt issued by other comparable federal government institutions at the time of issuance. Bonds can be issued with call options.
As of Sept. 30, 2014, of the total $4.24 billion of outstanding balance, none related to Northwest Power Act expenses. Outstanding bonds carrying a variable rate of interest were $661.0 million and $300.0 million at Sept. 30, 2014, and 2013, respectively. The weighted-average interest rate of BPA’s borrowings from the U.S. Treasury exceeds current rates. As a result, the fair value of BPA’s U.S. Treasury borrowings exceeded the carrying value by approximately $416.9 million and $297.2 million, based on discounted future cash flows using agency rates offered by the U.S. Treasury as of Sept. 30, 2014, and 2013, respectively, for similar maturities.
The weighted-average interest rate on outstanding U.S. Treasury borrowings was 3.1 percent and 3.8 percent as of Sept. 30, 2014, and 2013, respectively. As of Sept. 30, 2014, the outstanding bonds with a variable rate of interest carried an interest rate of 0.2 percent.
Of the outstanding U.S. Treasury borrowings, $218.8 million is not subject to redemption prior to their stated maturities. As of Sept. 30, 2014, $661.0 million are callable by BPA at par value and the remaining $3.36 billion are callable by BPA at a premium or discount, which is calculated based on the current government agency rates for the remaining term to maturity at the time the bond is called.
During fiscal year 2014, BPA called $1.18 billion principal amount of previously issued U.S. Treasury borrowings prior to maturity and reissued $1.14 billion principal amount of shorter-duration debt at lower interest rates. The result of these noncash transactions was a gain of $36.4 million for extinguished debt, which decreased interest expense immediately, as well as a gain of $3.4 million for modified debt, which is amortized to interest expense over the term of the new debt.
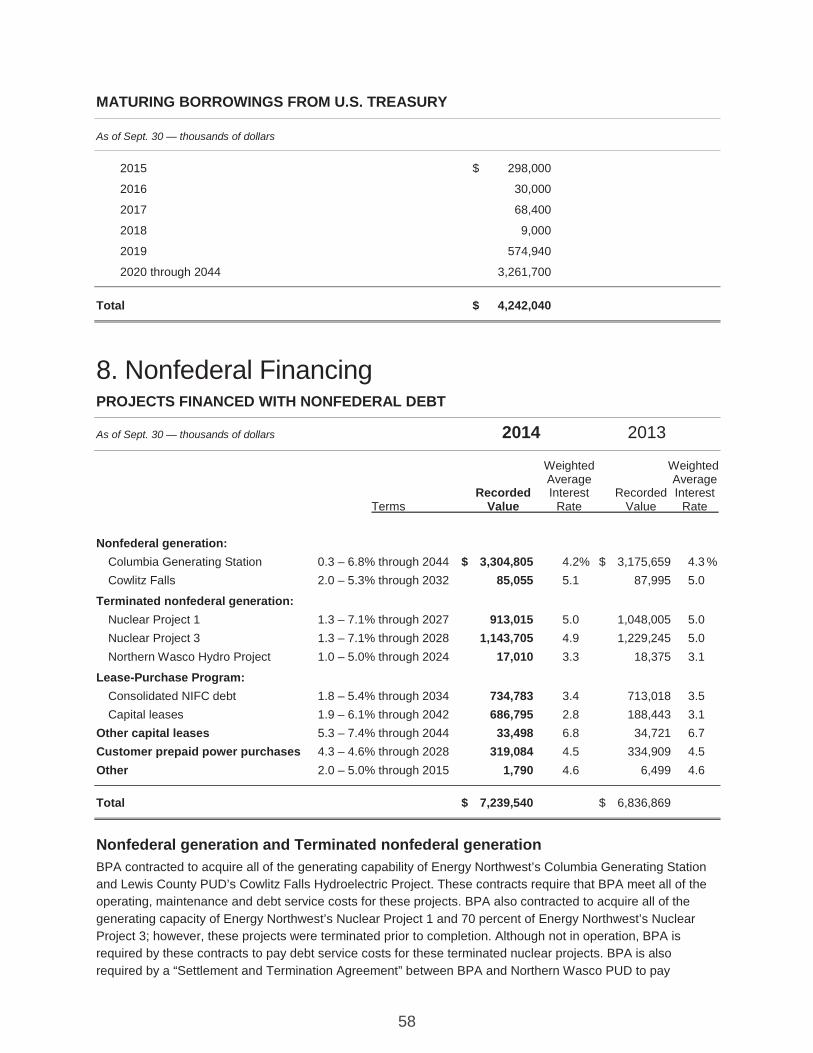
17
MATURING BORROWINGS FROM U.S. TREASURY
As of Sept. 30 — thousands of dollars
2015 $ 298,000
2016 30,000
2017 68,400
2018 9,000
2019 574,940
2020 through 2044 3,261,700
Total $ 4,242,040
8. Nonfederal FinancingPROJECTS FINANCED WITH NONFEDERAL DEBT
As of Sept. 30 — thousands of dollars 2014 2013
Weighted WeightedAverage Average
Recorded Interest Recorded InterestTerms Value Rate Value Rate
Nonfederal generation:Columbia Generating Station 0.3 – 6.8% through 2044 $ 3,304,805 4.2% $ 3,175,659 4.3 %Cowlitz Falls 2.0 – 5.3% through 2032 85,055 5.1 87,995 5.0
Terminated nonfederal generation:Nuclear Project 1 1.3 – 7.1% through 2027 913,015 5.0 1,048,005 5.0Nuclear Project 3 1.3 – 7.1% through 2028 1,143,705 4.9 1,229,245 5.0Northern Wasco Hydro Project 1.0 – 5.0% through 2024 17,010 3.3 18,375 3.1
Lease-Purchase Program:Consolidated NIFC debt 1.8 – 5.4% through 2034 734,783 3.4 713,018 3.5Capital leases 1.9 – 6.1% through 2042 686,795 2.8 188,443 3.1
Other capital leases 5.3 – 7.4% through 2044 33,498 6.8 34,721 6.7Customer prepaid power purchases 4.3 – 4.6% through 2028 319,084 4.5 334,909 4.5Other 2.0 – 5.0% through 2015 1,790 4.6 6,499 4.6
Total $ 7,239,540 $ 6,836,869
Nonfederal generation and Terminated nonfederal generationBPA contracted to acquire all of the generating capability of Energy Northwest’s Columbia Generating Station and Lewis County PUD’s Cowlitz Falls Hydroelectric Project. These contracts require that BPA meet all of the operating, maintenance and debt service costs for these projects. BPA also contracted to acquire all of the generating capacity of Energy Northwest’s Nuclear Project 1 and 70 percent of Energy Northwest’s Nuclear Project 3; however, these projects were terminated prior to completion. Although not in operation, BPA is required by these contracts to pay debt service costs for these terminated nuclear projects. BPA is also required by a “Settlement and Termination Agreement” between BPA and Northern Wasco PUD to pay
58

5918
amounts equal to annual debt service on the Northern Wasco Hydro Project under which BPA ceased its participation.
BPA recognizes expenses for these nonfederal generation and terminated nuclear generation projects based on total project cash funding requirements, which include debt service and operating and maintenance expenses. BPA recognized operating and maintenance expense for these projects of $301.1 million, $307.3 million and $298.3 million in fiscal years 2014, 2013 and 2012, respectively, which is included in Operations and maintenance in the accompanying Combined Statements of Revenues and Expenses. Debt service expense for all projects of $355.8 million, $733.3 million and $659.7 million for fiscal years 2014, 2013 and 2012, respectively, is reported as Nonfederal projects in the accompanying Combined Statements of Revenues and Expenses.
During fiscal year 2014, Energy Northwest took debt management actions for terminated Projects 1 and 3, which reduced debt service and amortization of the related regulatory assets in fiscal year 2014 by $378.1 million from rate case estimates. As a result of these debt management actions, amounts otherwise collected in BPA’s Power rates were not used to fund the Energy Northwest related principal payments as originally intended, and as included in rates, and were instead used to repay, before their maturity date, $320.6 million of higher interest rate federal appropriations during fiscal year 2014.
On the accompanying Combined Balance Sheets, related assets for operating projects are included in Nonfederal generation. Related assets for terminated generation are included in Regulatory assets. (See Note 3, Effects of Regulation.)
The underlying debt for the Energy Northwest obligations currently matures through 2044. Energy Northwest debt of $1.27 billion is callable, in whole or in part, at Energy Northwest’s option, on call dates between July 2015 and July 2024 at 100 percent of the principal amount.
The fair value of Energy Northwest debt exceeded recorded value by $591.2 million and $510.7 million as of Sept. 30, 2014, and 2013, respectively. The valuations are based on a market input evaluation pricing methodology using a combination of market observable data such as current market trade data, reported bid/ask spreads and institutional bid information.
Lease-Purchase Program and Other capital leasesUnder the Lease-Purchase Program, BPA consolidates five special purpose corporations, collectively referred to as Northwest Infrastructure Financing Corporations (NIFCs), which issued debt to and received advances from nonfederal sources. The combined NIFCs have issued $119.6 million in bonds and borrowed $615.2 million on lines of credit with various banks as of Sept. 30, 2014. The bonds bear interest at 5.4 percent and mature in 2034. All NIFC bonds outstanding are subject to redemption by the issuing NIFC, in whole or in part, at any date, at the higher of the principal amount of the bonds or the present value of the bonds discounted using the U.S. Treasury rate plus a premium of 12.5 basis points. The lines of credit become due in full at various dates ranging between April 1, 2015, and Jan. 1, 2019.
The fair value of the combined NIFC bonds and lines of credit, reported as capital leases, exceeded the recorded value by $23.6 million and $30.2 million as of Sept. 30, 2014, and 2013, respectively. The valuations are based on the discounted future cash flows using interest rates for similar debt that could have been issued at Sept. 30, 2014, and 2013, respectively.
Lease-purchases with entities that are not consolidated in the combined FCRPS financial statements are reported as capital leases. These include BPA’s lease-purchases with the Port of Morrow, a port district located in Morrow County, Oregon, and Idaho Energy Resources Authority (IERA) for transmission facilities, including lines, substations and general plant assets.
On the accompanying Combined Balance Sheets, the bonds and bank line of credit facilities are included in Nonfederal debt. The leased assets are included in Utility plant and Deferred charges and other for unspent funds held in trust.

19
Completed plant assets under capital lease agreements were $150.7 million and $127.7 million, and the accumulated depreciation was $22.7 million and $19.3 million, at Sept. 30, 2014, and 2013, respectively. The capital leases expire on various dates through 2044. Generally the capital lease agreements contain provisions that allow BPA to purchase the related assets at any time during each lease term for a bargain purchase price plus the value of the related outstanding debt instrument. Additionally one lease agreement includes a minimum lease payment escalation clause based on transmission usage.
Customer prepaid power purchasesDuring fiscal year 2013, BPA entered into agreements with four regional COUs for the advance payment of customer power purchases. Under this program, customers purchased prepaid power in blocks through fiscal year 2028. For each block purchased, BPA repays the prepayment, with interest, as monthly fixed credits on the customers’ power bills.
In March 2013, BPA received $340.0 million representing $474.3 million in scheduled credits for blocks purchased by customers. BPA accounts for the prepayment proceeds as a financing transaction and reports the value of the obligations associated with the fixed credits as a prepayment liability. Interest expense is recognized using a weighted-average effective interest rate of 4.5 percent. The prepaid liability is reduced as power is delivered and the credits are applied through fiscal year 2028.
MATURING FUTURE MINIMUMNONFEDERAL LEASE PAYMENTS
DEBT EXCLUDING UNDER CAPITALCAPITAL LEASES LEASES TOTAL
As of Sept. 30 — thousands of dollars
2015 $ 798,601 $ 24,408 $ 823,009
2016 817,904 24,343 842,247
2017 592,296 24,263 616,559
2018 929,292 24,243 953,535
2019 636,156 23,928 660,084
2020 and thereafter 2,744,998 856,079 3,601,077
Total $ 6,519,247 $ 977,264 $ 7,496,511
Less: Executory costs — 30,441 30,441
Less: Amount representing interest — 226,530 226,530
Present value of Nonfederal debt 6,519,247 720,293 7,239,540
Less: Current portion 798,601 1,228 799,829
Long-term Nonfederal debt $ 5,720,646 $ 719,065 $ 6,439,711
9. Variable Interest EntitiesA VIE is an entity that does not have sufficient equity at risk to finance its activities without additional financial support or whose equity investors lack characteristics of a controlling financial interest. An enterprise that has a controlling interest is known as the VIE’s primary beneficiary and is required to consolidate the VIE.
Management reviews executed power purchase agreements with counterparties that may be considered VIEs. These VIEs are typically legal entities structured to own and operate specific generating facilities, primarily wind farms. Because of their pricing arrangements, these agreements may provide that BPA absorb commodity
60
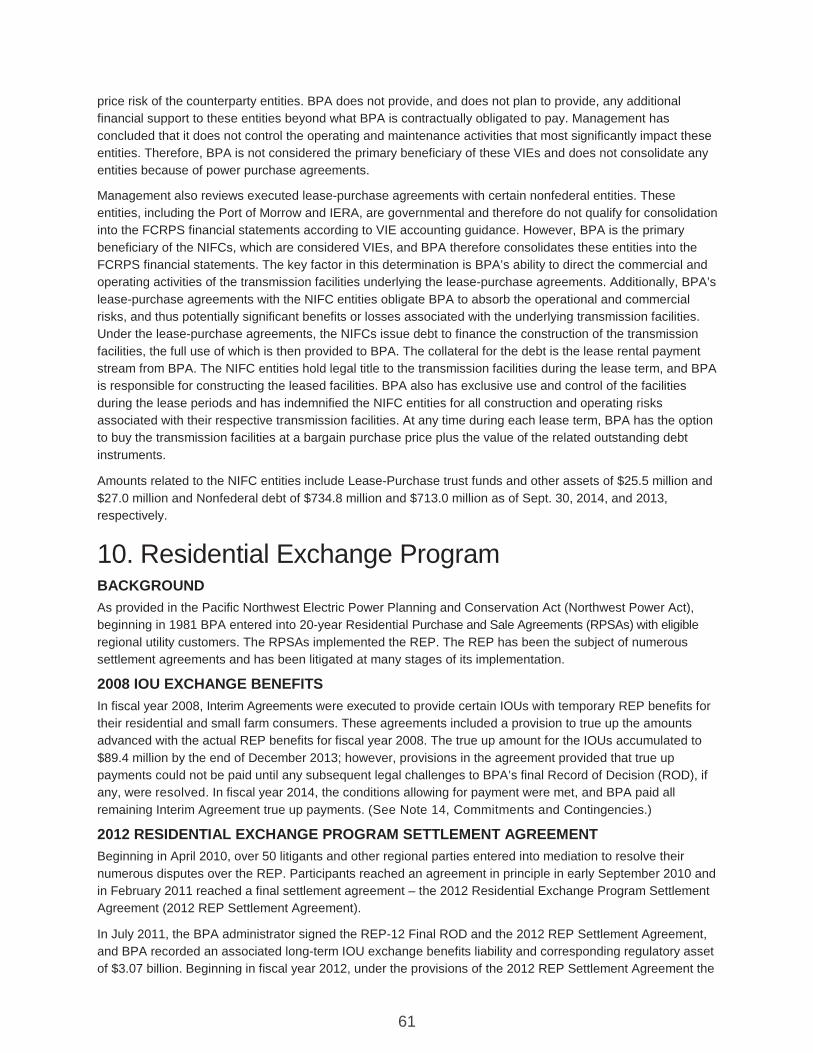
6120
price risk of the counterparty entities. BPA does not provide, and does not plan to provide, any additional financial support to these entities beyond what BPA is contractually obligated to pay. Management has concluded that it does not control the operating and maintenance activities that most significantly impact these entities. Therefore, BPA is not considered the primary beneficiary of these VIEs and does not consolidate any entities because of power purchase agreements.
Management also reviews executed lease-purchase agreements with certain nonfederal entities. These entities, including the Port of Morrow and IERA, are governmental and therefore do not qualify for consolidation into the FCRPS financial statements according to VIE accounting guidance. However, BPA is the primary beneficiary of the NIFCs, which are considered VIEs, and BPA therefore consolidates these entities into the FCRPS financial statements. The key factor in this determination is BPA’s ability to direct the commercial and operating activities of the transmission facilities underlying the lease-purchase agreements. Additionally, BPA’s lease-purchase agreements with the NIFC entities obligate BPA to absorb the operational and commercial risks, and thus potentially significant benefits or losses associated with the underlying transmission facilities.Under the lease-purchase agreements, the NIFCs issue debt to finance the construction of the transmission facilities, the full use of which is then provided to BPA. The collateral for the debt is the lease rental payment stream from BPA. The NIFC entities hold legal title to the transmission facilities during the lease term, and BPA is responsible for constructing the leased facilities. BPA also has exclusive use and control of the facilities during the lease periods and has indemnified the NIFC entities for all construction and operating risks associated with their respective transmission facilities. At any time during each lease term, BPA has the option to buy the transmission facilities at a bargain purchase price plus the value of the related outstanding debt instruments.
Amounts related to the NIFC entities include Lease-Purchase trust funds and other assets of $25.5 million and $27.0 million and Nonfederal debt of $734.8 million and $713.0 million as of Sept. 30, 2014, and 2013, respectively.
10. Residential Exchange Program BACKGROUNDAs provided in the Pacific Northwest Electric Power Planning and Conservation Act (Northwest Power Act), beginning in 1981 BPA entered into 20-year Residential Purchase and Sale Agreements (RPSAs) with eligibleregional utility customers. The RPSAs implemented the REP. The REP has been the subject of numerous settlement agreements and has been litigated at many stages of its implementation.
2008 IOU EXCHANGE BENEFITSIn fiscal year 2008, Interim Agreements were executed to provide certain IOUs with temporary REP benefits for their residential and small farm consumers. These agreements included a provision to true up the amounts advanced with the actual REP benefits for fiscal year 2008. The true up amount for the IOUs accumulated to $89.4 million by the end of December 2013; however, provisions in the agreement provided that true up payments could not be paid until any subsequent legal challenges to BPA’s final Record of Decision (ROD), if any, were resolved. In fiscal year 2014, the conditions allowing for payment were met, and BPA paid allremaining Interim Agreement true up payments. (See Note 14, Commitments and Contingencies.)
2012 RESIDENTIAL EXCHANGE PROGRAM SETTLEMENT AGREEMENTBeginning in April 2010, over 50 litigants and other regional parties entered into mediation to resolve their numerous disputes over the REP. Participants reached an agreement in principle in early September 2010 and in February 2011 reached a final settlement agreement – the 2012 Residential Exchange Program Settlement Agreement (2012 REP Settlement Agreement).
In July 2011, the BPA administrator signed the REP-12 Final ROD and the 2012 REP Settlement Agreement,and BPA recorded an associated long-term IOU exchange benefits liability and corresponding regulatory asset of $3.07 billion. Beginning in fiscal year 2012, under the provisions of the 2012 REP Settlement Agreement the

21
IOUs began to receive Scheduled Amounts annually starting at $182.1 million with increases over time to $286.1 million as the final payment in fiscal year 2028. The distribution of these payments is established in the 2012 REP Settlement Agreement that relies upon each IOU’s average system cost, BPA’s Priority Firm Exchange rates and exchange load. The settled Scheduled Amounts to be paid to the IOUs total $4.07 billion over the 17-year period through 2028, with remaining payments as of Sept. 30, 2014, totaling $3.50 billion. Amounts recorded of $2.80 billion at Sept. 30, 2014, represent the present value of future cash outflows for these exchange benefits.
REP SCHEDULED AMOUNTS
As of Sept. 30 — thousands of dollars
2015 $ 197,500
2016 214,100
2017 214,100
2018 232,200
2019 232,200
2020 through 2028 2,413,900
Total $ 3,504,000
In addition to Scheduled Amounts, the 2012 REP Settlement Agreement calls for Refund Amounts to be paid to COUs in the amount of $76.5 million each year from fiscal year 2012 through fiscal year 2019. The Refund Amounts were established as a regulatory asset and regulatory liability for the refunds that will be provided to BPA customers as credits on customer monthly bills. The 2012 REP Settlement Agreement established Refund Amounts totaling $612.3 million, with remaining refunds as of Sept. 30, 2014, totaling $382.7 million. Amounts recorded as a regulatory liability of $364.2 million at Sept. 30, 2014, represent the present value of future cash flows for the amounts to be refunded to COUs and collected from IOUs.
11. Deferred Credits and OtherAs of Sept. 30 — thousands of dollars 2014 2013
Customer reimbursable projects $ 220,165 $ 227,120
Generation interconnection agreements 196,183 219,510
Third AC Intertie capacity agreements 101,323 104,406
Legal claims and settlements 89,019 82,580
Federal Employees’ Compensation Act 32,558 32,558
Fiber optic leasing fees 24,821 27,004
Derivative instruments 16,304 27,108
Other 7,914 4,729
Total $ 688,287 $ 725,015
Deferred Credits and Other include the following items: “Customer reimbursable projects” consist of advances received from customers where either the customer or BPA
will own the resulting asset. If the customer will own the asset under construction, the revenue is recognized as
62

6322
the expenditures are incurred. If BPA will own the resulting asset, the revenue is recognized over the life of the asset once the corresponding asset is placed in service.
“Generation interconnection agreements” are generators’ advances held as security for requested new network upgrades and interconnection. These advances accrue interest and will be returned as cash or credits against future transmission service on the new or upgraded lines.
“Third AC Intertie capacity agreements” reflect unearned revenue from customers related to the Third AC Intertie capacity project. Revenue is recognized over an estimated 49-year life of the related assets.
“Legal claims and settlements” reflect amounts accrued for outstanding legal claims and settlements. (SeeNote 14, Commitments and Contingencies.)
“Federal Employees’ Compensation Act” reflects the actuarial estimated amount of future payments for current recipients of BPA’s worker compensation benefits.
“Fiber optic leasing fees” reflect unearned revenue related to the leasing of fiber optic cables. Revenue is recognized over the lease terms extending through 2024.
“Derivative instruments” reflect the unrealized loss of the derivative portfolio, which includes physical power purchase and sale transactions.
12. Risk Management and Derivative InstrumentsBPA is exposed to various forms of market risk including commodity price risk, commodity volumetric risk, interest rate risk, credit risk and event risk. Non-performance risk, which includes credit risk, is described in Note 13, Fair Value Measurements. BPA has formalized risk management processes in place to manage agency risks, including the use of derivative instruments. The following describes BPA’s exposure to and management of risks.
RISK MANAGEMENTDue to the operational risk posed by fluctuations in river flows and electricity market prices, net revenues that result from underlying surplus or deficit energy positions are inherently uncertain. BPA’s Transacting Risk Management Committee has responsibility for the oversight of market risk and determines the transactional risk policy and control environment at BPA. Through simulation and analysis of the hydro supply system, experienced business and risk managers install market price risk measures to capture additional market related risks, including credit and event risk.
COMMODITY PRICE RISK AND VOLUMETRIC RISKBPA has exposure to commodity price risk through fluctuations in electricity market prices that affect the value of energy bought and sold. Volumetric risk is the uncertainty of energy production from the hydro system. The combination of the two results in net revenue uncertainty. BPA routinely models commodity price risk and volumetric risk through parametric calculations, Monte Carlo simulations and general market observations to derive net revenues at risk, mark-to-market valuations, value at risk and other metrics as appropriate. These metrics capture the uncertainty around single point forecasts in order to monitor changes in the revenue riskprofile from changes in market price, market price volatility and forecasted hydro generation. BPA measures and monitors the output of these methods on a regular basis. In order to mitigate revenue uncertainty that is beyond the agency’s risk tolerance, BPA enters into short-term and long-term purchase and sale contracts by using instruments such as forwards, futures, swaps, and options.
CREDIT RISKCredit risk relates to the loss that might occur as a result of counterparty non-performance. BPA mitigates creditrisk by reviewing counterparties for creditworthiness, establishing credit limits and monitoring credit exposure on a daily basis. To further manage credit risk, BPA obtains credit support such as letters of credit, parentalguarantees, cash in the form of prepayment and/or deposit of escrow from some counterparties. BPA monitors counterparties for changes in financial condition and regularly updates credit reviews. BPA uses scoring models, publicly available financial information and external ratings from major credit rating agencies to determineappropriate levels of credit for its counterparties.

23
During fiscal year 2014, BPA experienced no material losses as a result of any customer defaults or bankruptcy filings. As of Sept. 30, 2014, BPA had $28.2 million in credit exposure to purchase and sale contracts after taking into account netting rights. BPA’s credit exposure, net of cash collateral, to sub-investment grade counterparties was less than one percent of total outstanding credit exposures.
INTEREST RATE RISK BPA has the ability to issue variable rate bonds or related instruments to the U.S. Treasury. BPA manages the interest rate risk presented by variable rate U.S. Treasury debt by holding a like amount of variable rate U.S. Treasury security investments with a similar maturity profile. These U.S. Treasury investments earn interest at a variable rate that is correlated, but not identical, to the interest rate paid on U.S. Treasury variable rate debt. (See Note 2, Investments in U.S. Treasury Securities and Note 7, Borrowings from U.S. Treasury.)
DERIVATIVE INSTRUMENTS
Commodity ContractsBPA’s forward electricity contracts are eligible for the normal purchases and normal sales exception if they require physical delivery, are expected to be used or sold by BPA in the normal course of business and meet the derivative accounting definition of capacity described in the Derivatives and Hedging accounting guidance. These transactions are not recorded at fair value in the financial statements. Recognition of these contracts in Sales or Purchased power in the Combined Statements of Revenues and Expenses occurs when the contracts are delivered and settled.
For derivative instruments not eligible for the normal purchases and normal sales exception, BPA recordsunrealized gains and losses in Regulatory assets and liabilities in the Combined Balance Sheets. Realized gains and losses are included in Sales and Purchased power in the Combined Statements of Revenues and Expenses as the contracts are delivered and settled.
When available, quoted market prices or prices obtained through external sources are used to measure a contract’s fair value. For contracts without available quoted market prices, fair value is determined based on internally developed modeled prices. (See Note 13, Fair Value Measurements.)
As of Sept. 30, 2014, the derivative commodity contracts recorded at fair value totaled 3.1 million MWh (gross basis) with delivery months extending to September 2019.
BPA has elected in the Combined Balance Sheets to report gross fair value amounts of derivative instruments subject to a master netting arrangement, excluding contracts designated as normal purchases or normal sales. In the event of default or termination, contracts with the same counterparty are offset and net settle through a single payment. BPA does not offset cash collateral against recognized derivative instruments with the same counterparty under the master netting arrangements.
If netted by counterparty, BPA’s derivative position would result in a liability of $16.1 million as of Sept. 30, 2014. As of Sept. 30, 2013, BPA’s derivative position resulted in a net asset of $0.1 million and a net liability of $27.1 million in other assets and other liabilities, respectively.
13. Fair Value Measurements BPA applies Fair Value Measurements and Disclosures accounting guidance to certain assets and liabilities including commodity derivative instruments, nuclear decommissioning trusts and other investments. BPA maximizes the use of observable inputs and minimizes the use of unobservable inputs when measuring fair value. Fair value is based on actively quoted market prices, if available. In the absence of actively quoted marketprices, BPA seeks price information from external sources, including broker quotes and industry publications. If pricing information from external sources is not available, BPA uses forward price curves derived from internal models based on perceived pricing relationships to major trading hubs.
64

6524
BPA also utilizes the following fair value hierarchy, which prioritizes the inputs to valuation techniques used to measure fair value, into three broad levels:
Level 1 – Quoted prices (unadjusted) in active markets for identical assets and liabilities that BPA has the ability to access at the measurement date. Instruments categorized in Level 1 primarily consist of financial instruments such as fixed income investments, equity mutual funds and money market funds.
Level 2 – Inputs other than quoted prices included within Level 1 that are either directly or indirectly observable for the asset or liability, including quoted prices for similar assets or liabilities in active markets, quoted prices for identical or similar assets or liabilities in inactive markets, inputs other than quoted prices that are observable for the asset or liability, and inputs that are derived from observable market data by correlation or other means. Instruments categorized in Level 2 include certain non-exchange traded commodity derivatives and certain agency, corporate and municipal securities as part of the Lease-Purchase trust funds investments. Fair value for certain non-exchange traded derivatives is based on forward exchange market prices and broker quotes adjusted and discounted. Lease-Purchase trust funds investments are based on a market input evaluation pricing methodology using a combination of observable market data such as current market trade data, reported bid/ask spreads, and institutional bid information.
Level 3 – Unobservable inputs for the asset or liability, including situations where there is little, if any, market activity for the asset or liability. Instruments categorized in Level 3 include long dated and modeled commodity contracts where inputs into the valuation are adjusted market prices from an active market, plus an adder.
The fair value hierarchy gives the highest priority to quoted prices in active markets (Level 1) and the lowest priority to unobservable data (Level 3). In some cases, the inputs used to measure fair value might fall in different levels of the fair value hierarchy. The lowest level input that is significant to a fair value measurement in its entirety determines the applicable level in the fair value hierarchy. Assessing the significance of a particular input to the fair value measurement in its entirety requires judgment, considering factors specific to the asset or liability.
BPA includes non-performance risk in calculating fair value measurements. This includes a credit risk adjustmentbased on the credit spreads of BPA’s counterparties when in an unrealized gain position, or on BPA’s own credit spread when in an unrealized loss position. BPA’s assessment of non-performance risk is generally derived from the credit default swap market and from bond market credit spreads. The impact of the credit risk adjustments for all outstanding derivatives was immaterial to the fair value calculation at Sept. 30, 2014, and2013.

25
ASSETS AND LIABILITIES MEASURED AT FAIR VALUE ON A RECURRING BASIS
As of Sept. 30, 2014 — thousands of dollarsLevel Level Level
1 2 3 Netting2 TotalAssetsNonfederal nuclear decommissioning trusts
Equity index funds $ 121,088 $ — $ — $ — $ 121,088U.S. government obligation mutual funds 93,329 — — — 93,329Corporate bond index funds 64,789 — — — 64,789Cash and cash equivalents 4 — — — 4
Derivative instruments 1Commodity contracts — 227 4,545 — 4,772
Lease-Purchase trust fundsU.S. government sponsored
enterprise obligations — 168,296 — — 168,296U.S. government obligations — 92,759 — — 92,759Corporate obligations — 27,274 — — 27,274Municipal obligations — 30,882 — — 30,882
Total $ 279,210 $319,438 $ 4,545 $ — $ 603,193
LiabilitiesDerivative instruments 1
Commodity contracts $ — $(16,304) $ — $ — $ (16,304)
Total $ — $(16,304) $ — $ — $ (16,304)
As of Sept. 30, 2013 — thousands of dollars
AssetsNonfederal nuclear decommissioning trusts
Equity index funds $ 117,212 $ — $ — $ — $ 117,212U.S. government obligation mutual funds 76,801 — — — 76,801Corporate bond index funds 60,726 — — — 60,726Cash and cash equivalents 13 — — — 13
Derivative instruments 1Commodity contracts — 630 4,747 (563) 4,814
Lease-Purchase trust fundsU.S. government sponsored
enterprise obligations — 50,265 — — 50,265U.S. government obligations — 21,676 — — 21,676
Total $ 254,752 $ 72,571 $ 4,747 $ (563) $ 331,507
LiabilitiesDerivative instruments 1
Commodity contracts $ — $(27,671) $ — $ 563 $ (27,108)
Total $ — $(27,671) $ — $ 563 $ (27,108)1 Derivative instruments assets and liabilities are included in Deferred charges and other and Deferred credits and other in the Combined Balance Sheets, respectively. (See Note 5, Deferred Charges and Other and Note 11, Deferred Credits and Other.) See Note 12, Risk Management and Derivative Instruments for more information related to BPA’s risk management strategy and use of derivative instruments.2 Netting represents a balance sheet adjustment for same counterparty master netting arrangements.
66

6726
Level 3 derivative commodity contracts are power contracts measured at fair value on a recurring basis using the California-Oregon Border (COB) forward price curve. COB does not have a sufficient number of transactions to be considered a liquid trading point. Therefore, COB prices are considered unobservable. Prices are considered a key component to COB contract valuations. All valuation pricing data is generated internally by BPA’s risk management organization.
The risk management organization constructs the COB forward price curve through the use of broker quotes and bid/offer spreads to a more liquid trading point. In periods where broker quotes are not available, the risk management organization derives monthly prices by applying seasonal shaping factors and/or models monthly prices based on historical broker quotes and spreads from a closely located major trading point. BPA management believes this approach maximizes the use of pricing information from external sources and is currently the best option for valuation.
The fair value of derivative commodity contracts transacted at COB was $4.5 million at Sept. 30, 2014. The volumes under these contracts will be physically delivered in various quantities through April 2016.
As of Sept. 30, 2014, forward prices for power to be delivered at COB through April 2016 varied as shown in the following table. All prices are presented in dollars per megawatt-hour.
COB Low High Weighted Average
On-Peak $33.90 $47.85 $41.64
Off-Peak $21.10 $41.20 $35.11
Forward power prices are influenced by, among other factors, seasonality, hydro forecasts, expectations of demand growth, planned changes in the regional generating plants, and the emergence of new marginal fuels for generation.
COMMODITY CONTRACTS
The following table presents the changes in the assets and liabilities measured at fair value on a recurring basis and included in the Level 3 fair value category.
As of Sept. 30 — thousands of dollars 2014 2013
Beginning Balance $ 4,747 $ 13,966
Changes in unrealized gains (losses)1 (202) (9,219)
Ending Balance $ 4,545 $ 4,747
1 Unrealized gains and losses are included in Regulatory assets and liabilities in the Combined Balance Sheets. Realized gains andlosses are included in Sales and Purchased power in the Combined Statements of Revenues and Expenses.
14. Commitments and ContingenciesINTEGRATED FISH AND WILDLIFE PROGRAM The Northwest Power Act directs BPA to protect, mitigate and enhance fish and wildlife resources to the extent they are affected by federal hydroelectric projects on the Columbia River and its tributaries. BPA makes expenditures and incurs other costs for fish and wildlife projects that are consistent with the Northwest Power Act and that are consistent with the Pacific Northwest Power and Conservation Council’s Columbia River Basin Fish and Wildlife Program. In addition, certain fish species are listed under the Endangered Species Act (ESA) as threatened or endangered. BPA is financially responsible for expenditures and other costs arising from conformance with the ESA and certain biological opinions (BiOp) prepared by the National Oceanic and Atmospheric Administration Fisheries Service and the U.S. Fish and Wildlife Service in furtherance of the ESA.
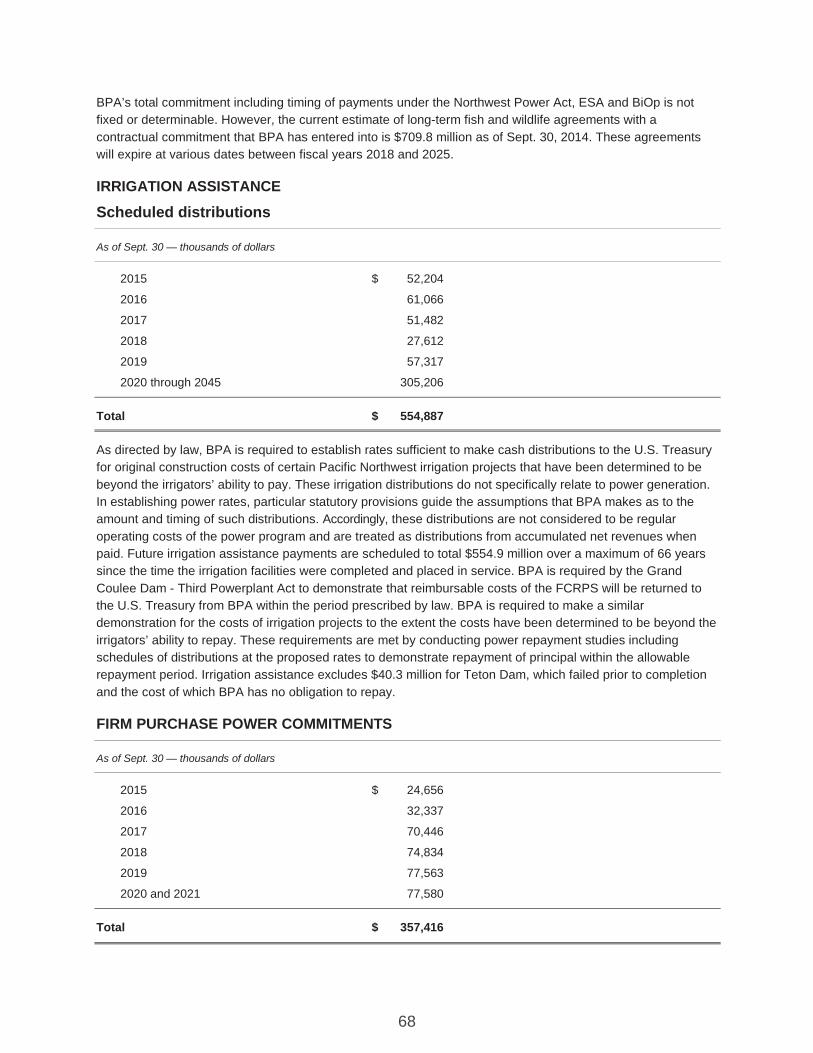
27
BPA’s total commitment including timing of payments under the Northwest Power Act, ESA and BiOp is not fixed or determinable. However, the current estimate of long-term fish and wildlife agreements with a contractual commitment that BPA has entered into is $709.8 million as of Sept. 30, 2014. These agreements will expire at various dates between fiscal years 2018 and 2025.
IRRIGATION ASSISTANCE
Scheduled distributions
As of Sept. 30 — thousands of dollars
2015 $ 52,204
2016 61,066
2017 51,482
2018 27,612
2019 57,317
2020 through 2045 305,206
Total $ 554,887
As directed by law, BPA is required to establish rates sufficient to make cash distributions to the U.S. Treasury for original construction costs of certain Pacific Northwest irrigation projects that have been determined to be beyond the irrigators’ ability to pay. These irrigation distributions do not specifically relate to power generation.In establishing power rates, particular statutory provisions guide the assumptions that BPA makes as to the amount and timing of such distributions. Accordingly, these distributions are not considered to be regular operating costs of the power program and are treated as distributions from accumulated net revenues when paid. Future irrigation assistance payments are scheduled to total $554.9 million over a maximum of 66 years since the time the irrigation facilities were completed and placed in service. BPA is required by the Grand Coulee Dam - Third Powerplant Act to demonstrate that reimbursable costs of the FCRPS will be returned to the U.S. Treasury from BPA within the period prescribed by law. BPA is required to make a similar demonstration for the costs of irrigation projects to the extent the costs have been determined to be beyond the irrigators’ ability to repay. These requirements are met by conducting power repayment studies including schedules of distributions at the proposed rates to demonstrate repayment of principal within the allowable repayment period. Irrigation assistance excludes $40.3 million for Teton Dam, which failed prior to completion and the cost of which BPA has no obligation to repay.
FIRM PURCHASE POWER COMMITMENTS
As of Sept. 30 — thousands of dollars
2015 $ 24,656
2016 32,337
2017 70,446
2018 74,834
2019 77,563
2020 and 2021 77,580
Total $ 357,416
68

6928
BPA periodically enters into long-term commitments to purchase power for future delivery. When BPA forecasts a resource shortage based on expected obligations and the historical water record for the Columbia River basin, BPA takes a variety of steps to cover the shortage including entering into power purchase commitments. Additionally, under BPA's current tiered rates structure, BPA's customers may request that BPA meet their power requirements in excess of their share of BPA's generation resources. BPA may meet these requests by entering into power purchase commitments. The preceding table includes firm purchase power agreements of known costs that are currently in place to assist in meeting expected future obligations under long-term power sales contracts. Included are 10 purchases made specifically to meet BPA’s commitments to sell power at Tier 2 rates in fiscal years 2015-2019 and two purchases to meet load obligations in Idaho. The expensesassociated with Tier 2 purchases were $4.9 million, $23.4 million and $8.5 million for fiscal years 2014, 2013and 2012, respectively. Idaho purchases do not commence until July 1, 2016, and extend through fiscal year 2021. BPA has several power purchase agreements with wind-powered and other generating facilities that are not included in the preceding table as payments are based on the variable amount of future energy generated and as there are no minimum payments required.
ENERGY EFFICIENCY PROGRAMBPA is required by the Northwest Power Act to meet the net firm power load requirements of its customers in the Pacific Northwest. BPA is authorized to help meet its net firm power load through the acquisition of electric conservation. BPA makes available a portfolio of initiatives and infrastructure support activities to its customers to ensure the conservation targets established in the Northwest Power and Conservation Council’s Sixth Power Plan are achieved. These initiatives and activities are often executed via conservation commitments made by BPA to its customers. These commitments are captured through $107.9 million of agreements with utility customers and contractors that provide support in the way of energy efficiency program research, development and implementation. The timing of the payments under these commitments is not fixed or determinable and these agreements will expire at various dates through fiscal year 2017.
1989 ENERGY NORTHWEST LETTER AGREEMENTIn 1989, BPA agreed with Energy Northwest that, in the event any participant shall be unable for any reason, or shall fail or refuse, to pay to Energy Northwest any amount due from such participant under its net billing agreement for which a net billing credit or cash payment to such participant has been provided by BPA, BPA will be obligated to pay the unpaid amount in cash directly to Energy Northwest.
NUCLEAR INSURANCE BPA is a member of the Nuclear Electric Insurance Limited (NEIL), a mutual insurance company established to provide insurance coverage for nuclear power plants. The insurance policies purchased from NEIL by BPA include: 1) Primary Property and Decontamination Liability Insurance; 2) Decontamination Liability, Decommissioning Liability and Excess Property Insurance; and 3) NEIL I Accidental Outage Insurance.
Under each insurance policy, BPA could be subject to a retrospective premium assessment in the event that a member insured loss exceeds reinsurance and reserves held by NEIL. The maximum assessment for the Primary Property and Decontamination Liability Insurance policy is $17.2 million. For the Decontamination Liability, Decommissioning Liability and Excess Property Insurance policy, the maximum assessment is$6.8 million. For the NEIL I Accidental Outage Insurance policy, the maximum assessment is $4.4 million.
As a separate requirement, BPA is liable under the Nuclear Regulatory Commission’s indemnity for public liability coverage under the Price-Anderson Act. In the event of a nuclear accident resulting in public liability losses exceeding $375.0 million, BPA could be subject to a retrospective assessment of up to $121.3 million limited to an annual maximum of $18.9 million. Assessments would be included in BPA’s costs and recovered through rates. As of Sept. 30, 2014, there have been no assessments to BPA under either of these programs.
ENVIRONMENTAL MATTERSFrom time to time there are sites for which BPA, the Corps or Reclamation may be identified as potential responsible parties. Costs associated with cleanup of sites are not expected to be material to the FCRPS’ financial statements. As such, no material liability has been recorded.

29
INDEMNIFICATION AGREEMENTSBPA has provided indemnifications of varying scope and terms in contracts with customers, vendors, lessors, trustees, and other parties with respect to certain matters, including, but not limited to, losses arising out of particular actions taken on behalf of BPA, electrical disturbances on specific projects, certain circumstances related to Energy Northwest Projects, and in connection with lease-purchases. Because of the absence of a maximum obligation in the provisions, management is not able to reasonably estimate the overall maximum potential future payments. Based on historical experience and current evaluation of circumstances, management believes that, as of September 30, 2014, the likelihood is remote that BPA would incur any significant costs with respect to such indemnities. No liability has been recorded in the financial statements with respect to these indemnification provisions.
LITIGATION
Southern California Edison Southern California Edison (SCE) filed two separate actions pending in the U.S. Court of Federal Claims against BPA related to a power sales and exchange agreement (Sale and Exchange Agreement) between BPA and SCE. The actions challenged: 1) BPA’s decision to convert the contract from a sale of power to an exchange of power as provided for under the terms of the contract (Conversion Claim); and 2) BPA’s termination of the Sales and Exchange Agreement due to SCE’s nonperformance (Termination Claim).
In 2006, BPA and SCE executed an agreement to settle the claims wherein BPA would make a payment of $28.5 million plus applicable interest to SCE if certain identified conditions were met, including a final resolution of BPA’s claims pending in the California refund proceedings and related litigation as discussed below. BPA has recorded a liability of $33.1 million, including interest, on the basis that all conditions have been met except the final resolution in the California refund proceedings and related litigation, which management considers probable. BPA established an offsetting regulatory asset, as the costs will be collected in future rates.
California parties’ refund claimsBPA was a party to proceedings at FERC that sought refunds for sales into markets operated by the California Independent System Operator (ISO) and the California Power Exchange (PX) during the California energy crisis of 2000-2001. BPA, along with a number of other governmental utilities, challenged FERC’s refund authority over governmental utilities. In BPA v. FERC, 422 F.3d 908 (9th Cir. 2005) the Ninth Circuit Court found that governmental utilities, like BPA, were not subject to FERC’s statutory refund authority. As a consequence of the Ninth Circuit Court’s decision, three California investor-owned utilities along with the State of California filed breach of contract claims in the United States Court of Federal Claims against BPA. The complaints, filed in 2007, alleged that BPA was contractually obligated to pay refunds on transactions where BPA received amounts in excess of mitigated market clearing prices established by FERC.
In May 2012, the Court of Federal Claims issued an opinion in the trial on liability issues and held that BPA breached its contracts with the California parties by failing to pay refunds for amounts owed in excess of the mitigated market clearing prices during the refund period. BPA estimates that such refund amounts, including interest, through Sept. 30, 2014, could approximate up to $55.9 million. While this ruling does not establish a specific liability in this matter, BPA recorded a liability in this amount.
The plaintiffs’ contractual breach claims were premised in part upon a November 2009 order where FERC found that as a consequence of establishing a new just and reasonable rate for the purpose of calculating refunds for jurisdictional utilities, it also retroactively reset the prices under the ISO and PX tariffs for all market participants. BPA separately appealed the November 2009 order to the Ninth Circuit Court. In August 2012, subsequent to the ruling of the Court of Federal Claims described above, the Ninth Circuit Court issued a decision on this appeal and held that establishing a new price for purposes of calculating refunds did not retroactively revise the rate for all market participants. The United States Department of Justice, representing BPA in this matter, filed a motion to reconsider the May 2012 decision of the Court of Federal Claims based upon this recent Ninth Circuit Court ruling. On April 2, 2013, the Court of Federal Claims denied the motion for reconsideration.
70

7130
In a separate proceeding at FERC as part of the California refund docket, an administrative law judge appointed by the FERC Commissioners conducted a hearing in 2012 to make certain findings related to three additional classes of transactions (“summer 2000, exchange, and multi-day”). On Feb. 15, 2013, the FERC administrative law judge issued the initial decision on the summer 2000, exchange, and multi-day transactions to the FERC Commissioners. As part of his findings, the FERC administrative law judge determined that BPA violated the tariff with 84 summer 2000 transactions and that prices charged for the exchange and multi-day transactions were unjust and unreasonable and are subject to refund. The initial decision has been appealed to the commissioners and is advisory to them. The FERC administrative law judge recommended BPA pay $15.1 million for multi-day transactions and $44.5 million for exchange transactions, plus interest. However, BPA liability for those amounts would not ripen unless the Commissioners adopt the initial decision and the related April 2, 2013, Court of Federal Claims order (mentioned below) stands. While the administrative lawjudge made findings of summer period tariff violations by BPA, he did not make any recommendation regarding refund amounts related to them. When the Commissioners established the hearing, they stated that when they receive the administrative law judge’s factual determinations regarding the summer period, they will decide the further steps to be taken. Management does not believe the initial decision is defensible and filed a Brief on Exceptions on April 11, 2013, in an effort to overturn it. FERC will consider all the parties’ arguments and issue a Final Decision.
The California parties filed separate motions with the Court of Federal Claims requesting a ruling on their declaratory relief claims for the summer 2000, exchange and multi-day transactions. On April 2, 2013, the Court of Federal Claims issued a Declaratory Judgment in favor of the California parties’ relief claims.
A new judge for the Court of Federal Claims was assigned to the claims, and on December 20, 2013, she vacated the May 2012 ruling that BPA breached its contracts with California parties. The judge conducted a hearing on June 5, 2014, for the parties to show cause why the court, on reconsideration, should not dismiss the cases, because of plaintiffs’ failure to establish the requirements of standing to sue on a government contract, thereby depriving the court of jurisdiction of the claims. BPA filed a motion to dismiss plaintiffs’ claims for breach of contract on July 1, 2014. BPA is awaiting a decision on the motion to dismiss. The plaintiffs willhave the opportunity to appeal if the cases are dismissed by the Court of Federal Claims. Management will reassess the probability of financial loss after the judge issues a ruling on the plaintiffs’ standing and the court’s jurisdiction over the claims, and will take into consideration the prospects of the matter on appeal, if appeals are filed.
BPA has not adjusted its liability for the California parties’ refund claims as a result of the events occurring at the Court of Federal Claims during fiscal year 2014 on the basis that management has determined that it is not probable that such events will ultimately result in a change in liabilities already recorded in connection with resolution of the California parties’ refund claims.
RatesBPA’s rates are frequently the subject of litigation. Most of the litigation involves claims that BPA’s rates are inconsistent with statutory directives, are not supported by substantial evidence in the record, or are arbitrary and capricious. It is the opinion of BPA’s general counsel that if any rate were to be rejected, the remedy accorded would be a remand to BPA to establish a new rate. BPA’s flexibility in establishing rates could be restricted by the rejection of a BPA rate, depending on the grounds for the rejection. BPA is unable to predict, however, what new rate it would establish if a rate were rejected. If BPA were to establish a rate that was lower than the rejected rate, a petitioner may be entitled to a refund in the amount overpaid; however, BPA is required by law to set rates to meet all of its costs. Thus, it is the opinion of BPA’s general counsel that BPA may be required to increase its rates to seek to recover the amount of any such refunds, if needed.
Currently pending before the Ninth Circuit Court are numerous challenges to the decisions BPA reached in the WP-07 Supplemental Rate Case and the WP-10 Rate Case. The petitioners in these cases challenge, among other issues, BPA’s calculation of certain refunds (referred to as "Lookback Amounts") associated with rates charged to BPA's preference customers from fiscal years 2002 through 2008. These refunds resulted from BPA's implementation of an REP settlement in fiscal years 2002 through 2008 that was later found unlawful

31
and from payment of REP benefits to BPA's investor-owned utility customers under that settlement. Following extensive negotiations, representatives from most of the region's consumer- and investor-owned utilities reached a proposed agreement on how BPA should establish REP benefits and recover the costs of those benefits through rates for the fiscal year period 2002 through 2028. BPA conducted a formal evidentiary hearing to review the proposed settlement agreement, which was signed by the BPA administrator inJuly 2011. In 2011, BPA and many COUs filed respective motions in the Ninth Circuit Court to dismiss pending litigation challenging BPA’s former decisions related to the REP. Those decisions were stayed pending a decision from the Ninth Circuit on the merits of the 2012 REP Settlement Agreement. On October 28, 2013, the Court affirmed the 2012 REP Settlement Agreement. In May 2014, BPA, the IOUs, and many COUs filed renewed motions to dismiss on the grounds that such challenges were moot due to the 2012 REP Settlement Agreement and the Court’s October 28, 2013 ruling. The Court has not ruled on these motions to date.
The cost of providing REP benefits will be recovered through future rates. BPA has recorded regulatory assets, a liability and a regulatory liability for the effects of the 2012 REP Settlement Agreement. (See Note 10, Residential Exchange Program.)
OTHERThe FCRPS may be affected by various other legal claims, actions and complaints, including litigation under the Endangered Species Act, which may include BPA as a named party. Certain of these cases may involve material amounts. Management is unable to predict whether the FCRPS will avoid adverse outcomes in these legal matters; however, management believes that disposition of pending matters will not have a materially adverse effect on the FCRPS’ financial position or results of operations for fiscal year 2014.
Judgments and settlements are included in FCRPS costs and recovered through rates. Except with respect to the SCE, California parties’ refund claims, and REP matters described above, no liability has been recorded for the above legal matters. (See Note 11, Deferred Credits and Other, for discussion of amounts accrued for outstanding legal claims and settlements.)
72
Revenue requirement study The submission of BPA’s annual report fulfills the reporting requirements of the Grand Coulee Dam — Third Powerplant Act, Public Law 89-448. The revenue requirement study demonstrates repayment of federal investment. It reflects revenues and costs consistent with BPA’s 2014 Final Wholesale Power and Transmission Rate Proposals of July 24, 2013, for fiscal years 2014 and 2015. (See BP-14-FS-BPA-02 for Power and BP-14-FS-BPA-08 for Transmission.) The final proposals filed with FERC contain the official amortization schedule for the rate periods. FERC granted final approval to the Power Rates Schedules and the Transmission, Ancillary and Control Area Services Rate Schedules on April 16, 2014.
Repayment demonstration BPA is required by Public Law 89-448 to demonstrate that reimbursable costs of the FCRPS will be returned to the U.S. Treasury from BPA net revenues within the period prescribed by law. BPA is required to make a similar demonstration for the costs of irrigation projects that are beyond the ability of irrigation water users to repay. These requirements are met by conducting power repayment studies including schedules of payments at the proposed rates to demonstrate repayment of principal within the allowable repayment period.
Since 1985, BPA has prepared separate repayment demonstrations for generation and transmission in accordance with an order issued by FERC on Jan. 27, 1984 (26 FERC 61,096).
Repayment policy BPA’s repayment policy is reflected in its generation and transmission revenue requirements and respective rate levels. This policy requires that FCRPS revenues be sufficient to:
1. Pay the cost of operating and maintaining the power system.
2. Pay the cost of obtaining power through purchase and exchange agreements (nonfederal projects) and transmission services that BPA is obtaining under capitalized lease-purchase agreements.
3. Pay interest on and repay outstanding U.S. Treasury borrowings to finance transmission system construction, conservation, environmental, direct-funded Corps and Reclamation improvements, and fish and wildlife projects.
4. Pay interest on the unrepaid investment in facilities financed with appropriated funds. (Federal hydroelectric projects all were financed with appropriated funds, as were BPA transmission facilities constructed before 1978.)
5. Pay, with interest, any outstanding deferral of interest expense.
6. Repay the power investment in each federal hydroelectric project with interest within 50 years after the project is placed in service (except for the Chandler project, which has a legislated repayment period of 66 years).
7. Repay each increment of the investment in the BPA transmission system financed with appropriated funds with interest within the average service life of the associated transmission plant (48 years).
8. Repay the appropriated investment in each replacement at a federal hydroelectric project within its service life.
9. Repay irrigation investment at federal reclamation projects assigned for payment from FCRPS revenues, after all other elements in the priority of payments are paid and within the same period established for irrigation water users to repay their share of construction costs. These periods range from 40 to 66 years, with 50 years being applicable to most of the irrigation payment assistance.
federal repayment
73

Investments bearing the highest interest rate will be repaid first, to the extent possible, while still completing repayment of each increment of investment within its prescribed repayment period.
Repayment obligation BPA’s rates must be designed to collect sufficient revenues to return separately the power and transmission costs of each FCRPS investment and each irrigation assistance obligation within the time prescribed by law.
If existing rates are not likely to meet this requirement BPA must reduce costs, adjust its rates, or both. However, irrigation assistance payments from projects authorized subsequent to Public Law 89-448 are to be scheduled to not require an increase in the BPA power rate level. Comparing BPA’s repayment schedule for the unrepaid capital appropriations and bonds with a “term schedule” demonstrates that the federal investment will be repaid within the time allowed. A term schedule represents a repayment schedule whereby each capitalized appropriation or bond would be repaid in the year it is due.
Reporting requirements of Public Law 89-448 are met so long as the unrepaid FCRPS investment and irrigation assistance resulting from BPA’s repayment schedule are less than or equal to the allowable unrepaid investment in each year. While the comparison is illustrated by the following graphs representing total FCRPS generation and total FCRPS transmission investment, the actual comparison is performed on an investment-by-investment basis.
Repayment of FCRPS investment The graphs for Unrepaid Federal Generation and Transmission Investment illustrate that unrepaid investment resulting from BPA’s generation and transmission repayment schedules is less than the allowable unrepaid investment. This demonstrates that BPA’s rates are sufficient to recover all FCRPS investment costs on or before their due dates.
The term schedule lines in the graphs show how much of the obligation can remain unpaid in accordance with the repayment periods for the generation and transmission components of the FCRPS. The BPA repayment schedule lines show how much of the obligation remains to be repaid according to BPA’s repayment schedules. In each year, BPA’s repayment schedule is ahead of the term schedule. This occurs because BPA plans repay-ment both to comply with obligation due dates and to minimize costs over the entire repayment study horizon (35 years for transmission, 50 years for generation). Repaying highest interest-bearing investments first, to the extent possible, minimizes costs. Consequently, some investments are repaid before their due dates while assuring that all other obligations are repaid by their due dates. These graphs include forecasts of system replacements during the repayment study horizon that are necessary to maintain the existing FCRPS generation and transmission facilities.
Unrepaid Federal Generation Investment — Includes Future Replacements
term schedule bpa repayment schedule
$8
6
4
2
0 2014 2019 2024 2029 2034 2039 2044 2049 2054 2059 2064
bil
lio
ns o
f d
ol
la
rs
74
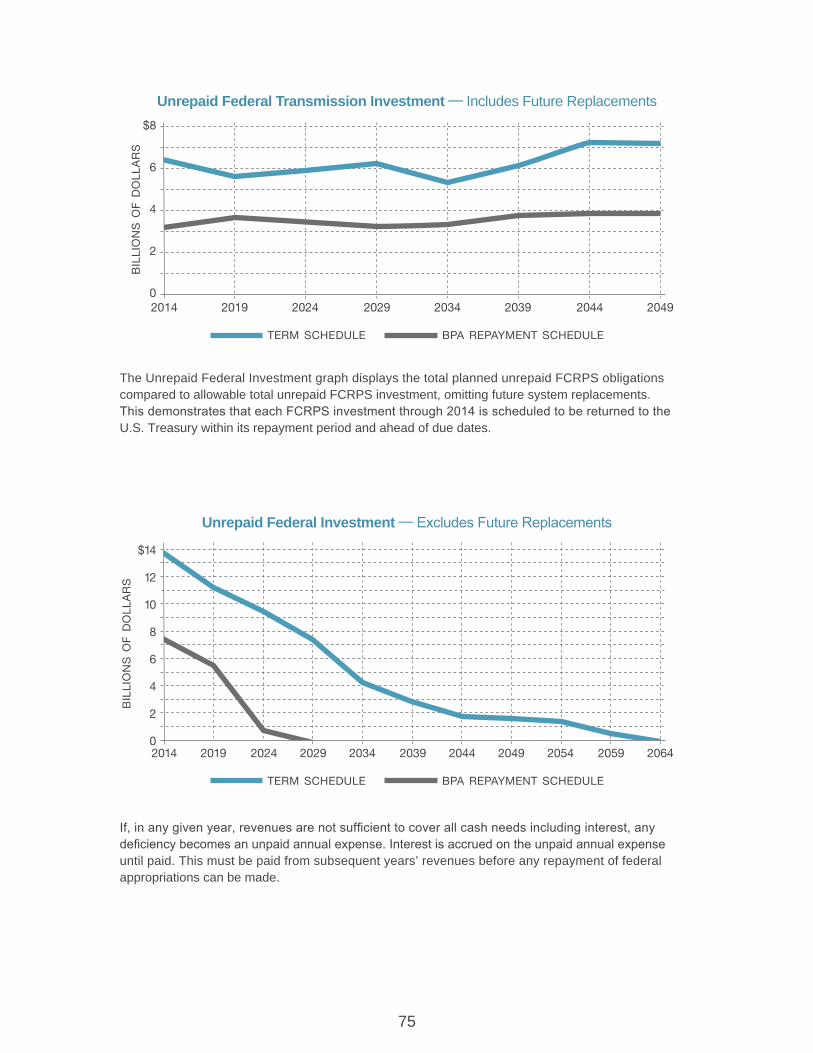
$14
12
10
8
6
4
2
0
Unrepaid Federal Investment — Excludes Future Replacements
The Unrepaid Federal Investment graph displays the total planned unrepaid FCRPS obligations compared to allowable total unrepaid FCRPS investment, omitting future system replacements. This demonstrates that each FCRPS investment through 2014 is scheduled to be returned to the U.S. Treasury within its repayment period and ahead of due dates.
If, in any given year, revenues are not sufficient to cover all cash needs including interest, any deficiency becomes an unpaid annual expense. Interest is accrued on the unpaid annual expense until paid. This must be paid from subsequent years’ revenues before any repayment of federal appropriations can be made.
term schedule bpa repayment schedule
2014 2019 2024 2029 2034 2039 2044 2049 2054 2059 2064
bil
lio
ns o
f d
ol
la
rs
Unrepaid Federal Transmission Investment — Includes Future Replacements
term schedule bpa repayment schedule
$8
6
4
2
0 2014 2019 2024 2029 2034 2039 2044 2049
bil
lio
ns o
f d
ol
la
rs
75

senior ExecutivesElliot E. Mainzer administrator and Chief Executive officer
gregory K. delwiche Deputy administrator
claudia r. Andrews Chief operating officer
Mary K. jensen, Acting Executive Vice President and General Counsel
nancy M. Mitman Executive Vice President and Chief Financial officer
Mark o. gendron Senior Vice President for Power Services
richard L. shaheen, Acting Senior Vice President for transmission Services
cathy L. Ehli Executive Vice President for Corporate Strategy
Executivesf. Lorraine bodi Vice President for Environment, Fish and Wildlife
Larry d. buttress Vice President and Chief information officer for information technology
sam d. cannady Chief Risk officer
peter T. cogswell, Acting Chief Public affairs officer
Kieran p. connolly Vice President for Generation asset management
suzanne b. cooper Vice President for Bulk marketing
robin r. furrer Vice President for transmission Field Services
richard b. génecé Vice President for Energy Efficiency
hardev s. juj Vice President for Planning and asset management
Michelle L. Manary, Acting Vice President for northwest Requirements marketing
Tom A. Mcdonald, Acting Chief Compliance officer
Mike p. Miller, Acting Vice President for Engineering and technical Services

officesbpA headquarters 905 n.E. 11th ave. P.o. Box 3621 Portland, oR 97208 503-230-3000
bpA visitor center 905 n.E. 11th ave. P.o. Box 3621 Portland, oR 97208 503-230-inFo [4636] • 800-622-4520
Power Servicesbend customer service center 1011 S.W. Emkay Drive, Suite 211 Bend, oR 97702 541-318-1680
burley customer service center 2700 overland ave. Burley, iD 83318 208-677-6760
Eastern Area customer service center P.o. Box 789 mead, Wa 99021 509-822-4613
Transmission ServicesTransmission services headquarters P.o. Box 491 Vancouver, Wa 98666-0491 800-282-3713 • 503-230-3000
EaSt REGion
idaho falls regional office 1350 Lindsay Blvd. idaho Falls, iD 83402 208-612-3100
Kalispell district 2520 U.S. Highway 2 East Kalispell, mt 59901 406-751-7800
spokane district 2410 E. Hawthorne Road mead, Wa 99201 509-468-3101
Tri-cities district 3404 Swallow ave. Pasco, Wa 99301 509-542-5459
SoUtH REGion
Eugene district 86000 Hwy. 99 S. Eugene, oR 97405 541-988-7401
Longview district 3750 memorial Park Drive Longview, Wa 98632 360-414-5602
redmond district 3655 S.W. Highland ave. Redmond, oR 97756 541-516-3230
salem district 2715 tepper Lane n.E. Keizer, oR 97303 503-304-5901
The dalles district 3920 Columbia View Drive East the Dalles, oR 97058 541-296-4694
noRtH REGion
covington district 28401 Covington Way S.E. Kent, Wa 98402 253-638-3704
olympia regional office 5240 trosper Road S.W. olympia, Wa 98512-5623 360-570-4351
snohomish district 914 avenue D Snohomish, Wa 98290 360-563-3694
wenatchee district 13294 Lincoln Park Road East Wenatchee, Wa 98802 509-886-6001
Montana customer service center P.o. Box 640 Ronan, mt 59864 406-676-2669
richland customer service center Kootenai Building, Room 214 north Power Plant Loop m/D 1399 P.o. Box 968 Richland, Wa 99352 509-372-5088
seattle customer service center 909 First ave., Suite 380 Seattle, Wa 98104-3636 206-220-6770
western Area customer service center 905 n.E. 11th ave. P.o. Box 3621 Portland, oR 97208 503-230-5204
77

www.bpa.govBONNEvILLE POWER ADMINISTRATION
doe/bP-4616 november 2014