ANNUAL REPORT 2017 - 東洋水産株式会社 · delivering the finest quality, ... Delicious food...
38
ANNUAL REPORT 2017 YEAR ENDED MARCH 31, 2017
-
Upload
truonghanh -
Category
Documents
-
view
213 -
download
0
Transcript of ANNUAL REPORT 2017 - 東洋水産株式会社 · delivering the finest quality, ... Delicious food...

ANNUAL REPORT2017YEAR ENDED MARCH 31, 2017

TO OUR SHAREHOLDERS /CONSOLIDATED FINANCIAL HIGHLIGHTS
REVIEW OF OPERATIONS
ENVIRONMENTAL AND SOCIAL CONTRIBUTION INITIATIVES
CORPORATE GOVERNANCE /CORPORATE GOVERNANCE STRUCTURE
CONSOLIDATED BALANCE SHEETS
CONSOLIDATED STATEMENTS OF INCOME
CONSOLIDATED STATEMENTS OF COMPREHENSIVE INCOME
CONSOLIDATED STATEMENTS OF CHANGES IN NET ASSETS
CONSOLIDATED STATEMENTS OF CASH FLOWS
NOTES TO CONSOLIDATED FINANCIAL STATEMENTS
INDEPENDENT AUDITOR’ S REPORT
CORPORATE DATA
Forward-looking Statements
In this annual report, statements other than historical facts are forward-looking statements that re�ect our plans and expectations. These forward-looking statements involverisks, uncertainties and other factors that may cause our actual results and achievements to differ materially from those anticipated in these statements.
01
02
04
05
06
08
09
10
11
12
34
35
CONTENTS
Since its debut in 1962, the Maruchan logo has become widely
recognized and loved as the symbol for Toyo Suisan’s processed foods
among every Japanese age group ranging from small children to the
elderly. In 1972, Toyo Suisan established a local subsidiary in the United
States and began manufacturing and selling products for North America.
Accordingly, products featuring the Maruchan label are highly acclaimed
for their flavor both domestically and overseas.
“Food that brings smiles to faces”—
is the message of the Maruchan logo and what the Toyo Suisan Group is all about:
delivering the finest quality, best-tasting food to dining tables everywhere.
Delicious food that brings smiles to faces, and with the same assurance of quality
every time.
“Smiles for All.” — in everything we do. That's the Toyo Suisan way.
About the Maruchan logo

TOYO SUISAN ANNUAL REPORT 2017 1
Millions of yenThousands of
U.S. dollars (Note 1)
2016 2017 2017
For the year: Net sales ¥383,277 ¥382,679 $3,410,990
Operating income 28,314 29,486 262,822
Net income attributable to owners of parent 18,364 20,837 185,730
At year-end: Total assets ¥345,397 ¥361,075 $3,218,424
Total net assets 266,200 281,795 2,511,766
Per share of common stock: Net income ¥179.8 ¥204.0 $1.82
(in yen and U.S. dollars) Cash dividends 60.0 60.0 0.53
Dollar amounts represent translations at the rate of ¥112.19 = US$1, the rate prevailing on March 31, 2017.
TO OUR SHAREHOLDERS /CONSOLIDATED FINANCIAL HIGHLIGHTS
REVIEW OF OPERATIONS
ENVIRONMENTAL AND SOCIAL CONTRIBUTION INITIATIVES
CORPORATE GOVERNANCE /CORPORATE GOVERNANCE STRUCTURE
CONSOLIDATED BALANCE SHEETS
CONSOLIDATED STATEMENTS OF INCOME
CONSOLIDATED STATEMENTS OF COMPREHENSIVE INCOME
CONSOLIDATED STATEMENTS OF CHANGES IN NET ASSETS
CONSOLIDATED STATEMENTS OF CASH FLOWS
NOTES TO CONSOLIDATED FINANCIAL STATEMENTS
INDEPENDENT AUDITOR’ S REPORT
CORPORATE DATA
Forward-looking Statements
In this annual report, statements other than historical facts are forward-looking statements that re�ect our plans and expectations. These forward-looking statements involverisks, uncertainties and other factors that may cause our actual results and achievements to differ materially from those anticipated in these statements.
01
02
04
05
06
08
09
10
11
12
34
35
CONTENTS
Since its debut in 1962, the Maruchan logo has become widely
recognized and loved as the symbol for Toyo Suisan’s processed foods
among every Japanese age group ranging from small children to the
elderly. In 1972, Toyo Suisan established a local subsidiary in the United
States and began manufacturing and selling products for North America.
Accordingly, products featuring the Maruchan label are highly acclaimed
for their flavor both domestically and overseas.
“Food that brings smiles to faces”—
is the message of the Maruchan logo and what the Toyo Suisan Group is all about:
delivering the finest quality, best-tasting food to dining tables everywhere.
Delicious food that brings smiles to faces, and with the same assurance of quality
every time.
“Smiles for All.” — in everything we do. That's the Toyo Suisan way.
About the Maruchan logo
During the fiscal year ended March 31, 2017, the Japanese economy continued its gradual recovery, despite a slowing
of improvement in some areas, but lack of clarity regarding the economic future still persisted owing to developments
such as the slowdown in economic growth centered on emerging nations in Asia and the issue of Britain’s departure
from the EU, which led to increasing uncertainty with regard to overseas economies.
Under these circumstances, the Toyo Suisan Group (hereafter, the “Group”), has remained committed to its mission
“to contribute to society through foods” and “to provide safe and secure foods and services to customers” under the
corporate slogan of “Smiles for All.” The Group continued to implement further cost reductions and promoted
aggressive sales activities in its efforts to face an increasingly competitive sales environment.
As a result, net sales were ¥382,679 million (down 0.2% year on year), operating profit was ¥29,486 million (up 4.1%
year on year), ordinary profit was ¥31,147 million (up 5.6% year on year), and profit attributable to owners of parent
was ¥20,837 million (up 13.5% year on year).
June 2017
Masanari Imamura
Representative Director and President
Operating results for the year ended March 2017
I would like to begin by expressing my sincere appreciation for our
shareholders’ continued support. We are pleased to report the
business results for Toyo Suisan Kaisha, Ltd., for the fiscal year
ended March 31, 2017.
In a severe operating environment, the Toyo Suisan Group seeks
to enhance its competitiveness for continued development and to
carry out swift reforms. We will also strive to maintain the support
and trust of our customers, improve corporate value, and boost
shareholder value.
TO OUR SHAREHOLDERS
CONSOLIDATED FINANCIAL HIGHLIGHTSTOYO SUISAN KAISHA, LTD. AND ITS SUBSIDIARIESYEARS ENDED MARCH 31, 2016 AND 2017

TOYO SUISAN ANNUAL REPORT 20172
In the Seafood Segment, due to the negative impact of the decrease in the haul of �sh and harsher sales competition in the domestic market including sales to convenience stores, segment sales were ¥31,414 million (down 5.0% year on year). Segment pro�t was ¥191 million (compared with a segment loss of ¥171 million in the previous �scal year), due to further improvements in the cost of some types of �sh such as �sh eggs and shrimp used as ingredients.
31,414Sales
million yen
73,036Sales
million yen
21,498Sales
million yen
16,875Sales
million yen
46,262Sales
million yen
126,069Sales
million yen
67,525Sales
million yen
DomesticInstant NoodlesSegment
Frozen andRefrigerated Foods Segment
DomesticInstant NoodlesSegment
ProcessedFoodsSegment
Cold-StorageSegment
Other BusinessSegment
SeafoodSegment
OverseasInstant NoodlesSegment
Seafood Segment
Overseas Instant Noodles Segment
Domestic Instant Noodles Segment
Frozen and Refrigerated Foods Segment
Processed Foods Segment
Cold-Storage Segment
Other Business Segment
8.21% 31,414 million yen
19.09% 73,036 million yen
32.94% 126,069 million yen
17.65% 67,525 million yen
5.62% 21,498 million yen
4.41% 16,875 million yen
12.09% 46,262 million yen
In the Domestic Instant Noodles Segment, cup-type noodle sales remained strong for the Japanese style noodle series, which is centered on key branded products Akai Kitsune Udon and Midori no Tanuki Ten Soba, and for Maruchan Seimen Cup. Meanwhile, sales of our s ignature product Menzukur i and open-pr iced product Gotsu Mor i a l so continued to be �rm. Total sales of bag-type noodles decreased, amidst a challenging overall market environment, despite efforts such as stimulating new demand through a campaign to celebrate the �fth anniversary of the Maruchan Se imen se r i e s and the introduction of new �avors. As a result, segment sales were ¥126,069 million (up
1.8% year on year). Segment pro�t was ¥10,048 million (up 0.4% year on year), due to the increase in sales combined with decreases mainly in raw ingredients costs and distribution costs, which outweighed increases in deprec iat ion fo l lowing the start of operations at the Kansai Plant, which was completed in August 2016, and in sales promotion expenses.
In the Frozen and Refrigerated Foods Segment, while sales of our signature fresh noodle product Maruchan Yakisoba (Three-Meal Package) se r ies remained s t rong, the microwavable food product Renji de men jyozu series and the new yakisoba product Kiwami Futomen series, which comes in a two-meal package, also remained strong. Among frozen and chilled foods, sales of our signature shumai (steamed dumpling) and wontons products increased, but sales from frozen foods decreased amid �ercer sales competition. As a result, segment sales were
¥67,525 million (down 0.7% year on year). Segment pro�t was ¥4,943 million (up 28.3% year on year), due to higher pro�ts resulting from sales growth for our signature products and fal l ing pr ices for raw ingredients, combined with efforts to enhance pro�ts through reassessment of unpro�table products and other means.
As for the Overseas Instant Noodles Segment, in the U.S. special sales in mass retailers and the launch of new products were carried out to stimulate demand, but sales declined due to a continued harsh sales environment. In Mexico, while the depreciation of the local currency continues, sales increased due to aggressive sales promotion activities mainly in mass retailers. As a result, segment sales were ¥73,036 million (down 5.5% year on year). Segment pro�t was ¥11,810 million (down
2.7% year on year), due to the additional sales promotion and personnel expenses, and despite the decrease in raw ingredients costs.
In the Cold-Storage Segment, segment sales were ¥16,875 million (up 4.1% year on year) as a result of the bene�cial effect of the start of operations at the Fukuoka Island-City Distribution Center in March 2016, and an increase in storage and delivery services for primarily new customers thanks to aggressive sales activities. Despite expenses related to the Fukuoka Island-City Distribution Center increasing, segment pro�t was ¥1,688 million
(up 2.0% year on year) mainly due to the contribution of an increase in sales and reduced motive utility costs, following efforts in energy-saving activities.
The Other Business Segment consists of mainly the packed lunch/deli food business. Segment sales were ¥46,262 million (up 2.9% year on year), while segment pro�t was ¥1,059 million (up 184.8% year on year).
TOTAL
382,679million yen
1
2
3
4
5
6
7
Net Sales by Segment
In the Processed Foods Segment, sales of core rice products and freeze-dried products remained strong. Sales of rice increased as a result of the implementation of aggressive sales promotion activities against a backdrop of increased meal opportunities due to increased demand for emergency supplies and l ifestyle changes in addition to greater awareness of quality. In sales of freeze-dried products, sales were strong for the �ve-meal packages of packet soup, a core product, at mass retailers, and products, centered on new products, were introduced at convenience
stores. As a result, segment sales were ¥21,498 million (up 8.7% year on year) and segment pro�t was ¥729 million (down 17.5% year on year) due to higher prices for raw rice.
REVIEW OF OPERATIONS

TOYO SUISAN ANNUAL REPORT 2017 3
In the Seafood Segment, due to the negative impact of the decrease in the haul of �sh and harsher sales competition in the domestic market including sales to convenience stores, segment sales were ¥31,414 million (down 5.0% year on year). Segment pro�t was ¥191 million (compared with a segment loss of ¥171 million in the previous �scal year), due to further improvements in the cost of some types of �sh such as �sh eggs and shrimp used as ingredients.
31,414Sales
million yen
73,036Sales
million yen
21,498Sales
million yen
16,875Sales
million yen
46,262Sales
million yen
126,069Sales
million yen
67,525Sales
million yen
DomesticInstant NoodlesSegment
Frozen andRefrigerated Foods Segment
DomesticInstant NoodlesSegment
ProcessedFoodsSegment
Cold-StorageSegment
Other BusinessSegment
SeafoodSegment
OverseasInstant NoodlesSegment
Seafood Segment
Overseas Instant Noodles Segment
Domestic Instant Noodles Segment
Frozen and Refrigerated Foods Segment
Processed Foods Segment
Cold-Storage Segment
Other Business Segment
8.21% 31,414 million yen
19.09% 73,036 million yen
32.94% 126,069 million yen
17.65% 67,525 million yen
5.62% 21,498 million yen
4.41% 16,875 million yen
12.09% 46,262 million yen
In the Domestic Instant Noodles Segment, cup-type noodle sales remained strong for the Japanese style noodle series, which is centered on key branded products Akai Kitsune Udon and Midori no Tanuki Ten Soba, and for Maruchan Seimen Cup. Meanwhile, sales of our s ignature product Menzukur i and open-pr iced product Gotsu Mor i a l so continued to be �rm. Total sales of bag-type noodles decreased, amidst a challenging overall market environment, despite efforts such as stimulating new demand through a campaign to celebrate the �fth anniversary of the Maruchan Se imen se r i e s and the introduction of new �avors. As a result, segment sales were ¥126,069 million (up
1.8% year on year). Segment pro�t was ¥10,048 million (up 0.4% year on year), due to the increase in sales combined with decreases mainly in raw ingredients costs and distribution costs, which outweighed increases in deprec iat ion fo l lowing the start of operations at the Kansai Plant, which was completed in August 2016, and in sales promotion expenses.
In the Frozen and Refrigerated Foods Segment, while sales of our signature fresh noodle product Maruchan Yakisoba (Three-Meal Package) se r ies remained s t rong, the microwavable food product Renji de men jyozu series and the new yakisoba product Kiwami Futomen series, which comes in a two-meal package, also remained strong. Among frozen and chilled foods, sales of our signature shumai (steamed dumpling) and wontons products increased, but sales from frozen foods decreased amid �ercer sales competition. As a result, segment sales were
¥67,525 million (down 0.7% year on year). Segment pro�t was ¥4,943 million (up 28.3% year on year), due to higher pro�ts resulting from sales growth for our signature products and fal l ing pr ices for raw ingredients, combined with efforts to enhance pro�ts through reassessment of unpro�table products and other means.
As for the Overseas Instant Noodles Segment, in the U.S. special sales in mass retailers and the launch of new products were carried out to stimulate demand, but sales declined due to a continued harsh sales environment. In Mexico, while the depreciation of the local currency continues, sales increased due to aggressive sales promotion activities mainly in mass retailers. As a result, segment sales were ¥73,036 million (down 5.5% year on year). Segment pro�t was ¥11,810 million (down
2.7% year on year), due to the additional sales promotion and personnel expenses, and despite the decrease in raw ingredients costs.
In the Cold-Storage Segment, segment sales were ¥16,875 million (up 4.1% year on year) as a result of the bene�cial effect of the start of operations at the Fukuoka Island-City Distribution Center in March 2016, and an increase in storage and delivery services for primarily new customers thanks to aggressive sales activities. Despite expenses related to the Fukuoka Island-City Distribution Center increasing, segment pro�t was ¥1,688 million
(up 2.0% year on year) mainly due to the contribution of an increase in sales and reduced motive utility costs, following efforts in energy-saving activities.
The Other Business Segment consists of mainly the packed lunch/deli food business. Segment sales were ¥46,262 million (up 2.9% year on year), while segment pro�t was ¥1,059 million (up 184.8% year on year).
TOTAL
382,679million yen
1
2
3
4
5
6
7
Net Sales by Segment
In the Processed Foods Segment, sales of core rice products and freeze-dried products remained strong. Sales of rice increased as a result of the implementation of aggressive sales promotion activities against a backdrop of increased meal opportunities due to increased demand for emergency supplies and l ifestyle changes in addition to greater awareness of quality. In sales of freeze-dried products, sales were strong for the �ve-meal packages of packet soup, a core product, at mass retailers, and products, centered on new products, were introduced at convenience
stores. As a result, segment sales were ¥21,498 million (up 8.7% year on year) and segment pro�t was ¥729 million (down 17.5% year on year) due to higher prices for raw rice.

TOYO SUISAN ANNUAL REPORT 20174
Domestic business operations (in total)
Overseas business operations (in total) (Manufacturing bases and of�ces in North/Central America and China)
Energy
4,571 TJ
Electric power
255,700 thousand kWh
Natural gas
31,858 thousand m3
Class A heavy oil
2,611 kl
CO2 discharged into atmosphere
210 thousand t
Energy
1,812 TJ
Electric power
61,408 thousand kWh
Natural gas
27,416 thousand m3
Diesel
164 kl
CO2 discharged into atmosphere
90 thousand t
1 2
3 4 5
Enhancing food education activities
�e Toyo Suisan Group pursues various educational activities to convey the importance and joy of food to children, who will lead the next generation. In �scal 2016, we held classes on the role and regional attributes of soup stock, as well as on making handmade udon and ramen noodles. We also held a class at an elementary school in Hachinohe City, Aomori Prefecture, on the topic of freeze-dried soup manufactured by Hachinohe Toyo Co., Ltd. At our head o�ce, meanwhile, we welcome students from junior and senior high schools to let them see our workplace. Around 400 students visited last year.
Tohoku Smile “food” project in 2016
Since �scal 2015, we have held soup recipe contests for students of agricultural and �sheries high schools to create food culture and promote community exchanges in the Tohoku area. �e winning recipe in �scal 2016 was “Honor of Akita,” produced by Kanaashi Agricultural High School in Akita Prefecture. During the year, in the Tohoku region we launched “Tsugaru-Made Rock Soup,” winner in �scal 2015, as a freeze-dried soup product.
Maruchan Cup Youth Judo Championships
Since 1986, we have held judo tournaments for elementary and junior high school students nationwide, based on our belief that children should be healthy and physically strong and have deep respect for courtesy and morals. In �scal 2016, we held tournaments in seven regions in Japan, with participation by 1,500 teams consisting of 10,000 individuals.
Factory tours
All of our factories o�er tours of their facilities to students of nearby schools and local residents. To facilitate such tours, we have erected special walkways at our Hokkaido and Kanto factories, which together attracted around 7,900 visitors in �scal 2016.
Release of young �sh
For the 18th time, personnel from our Tago Factory released �sh into the nearby ocean with the aims of protecting and nurturing marine resources and regional revitalization. Local residents and people at �sheries cooperatives joined us to release around 15,000 young scorpion �sh into Suruga Bay. We also held a class about katsuobushi (dried bonito �akes) and scorpion �sh at a certi�ed center for Early Childhood Education and Care.
Environmental data
Overview of Social Contribution Activities
Input
Input
Output
Output
ENVIRONMENTAL AND SOCIAL CONTRIBUTION INITIATIVES

TOYO SUISAN ANNUAL REPORT 2017 5
Representative Director and Chairman
Accountingauditor
Board of Directors
General Shareholders’ Meeting
Representative Director and President
Director in Charge
Internal Audit Department
Corporate Auditors’ Of�ce
Board of CorporateAuditors
16 Directors(including 3 Outside Directors)4 Corporate Auditors
(including 2 Outside Corporate Auditors)
Assistance
Cooperation
Cooperation
Cooperation
Cooperation
Report
Report
Report
Appointment and dismissal Appointment and dismissal
Advice and guidance
Appointment and dismissal
AuditAudit
Audit
Individual departments
Legal advisor
Reporting line
Legal Department
Toyo Suisan Kaisha, Ltd. recognizes that accurate and rapid decision making will affect the future growth of the company. We also recognize how important strengthening and enhancing corporate governance are to management, and think it is important to reinforce compliance and make the responsibilities of directors and the structure of responsibilities for the individual business segments explicit. We will continue to ensure management’s transparency and swift decision making and to strengthen and enhance corporate governance in the future as well.
Toyo Suisan’s Basic Approach to Corporate Governance
The Board of Directors serves as the Company’s decision-making body. The Board of Directors comprises sixteen directors, including three outside directors. The Board of Directors generally convenes once a month, and also as needed. It thoroughly debates issues from the perspective of the group as a whole. The Board of Directors receives reports on the execution of duties, monitors the execution of duties, and decides on matters, including those stipulated in the Companies Act. The term of directors has been set at one year to ensure a management structure that can respond flexibly to changes in the business environment. Outside directors have knowledge that is beneficial to the Company and fulfill a supervisory role from an independent perspective.
Board of Directors
The Company has adopted the corporate auditor system. The Board of Corporate Auditors consists of four auditors, two of whom are outside auditors. Each corporate auditor attends Board of Directors’ meetings and other important meetings and monitors the execution of duties by directors through such means as investigating the status of operations and assets, based on the audit policies, audit plans, and division of duties decided at Board of Corporate Auditors’ meetings.
Board of Corporate Auditors
CORPORATE GOVERNANCE
CORPORATE GOVERNANCE STRUCTURE

TOYO SUISAN ANNUAL REPORT 20176
Millions of yenThousands of
U.S. dollars (Note 1)
2016 2017 2017
Current assets:
Cash on hand and at banks (Notes 3 and 4) ¥ 73,565 ¥ 78,209 $ 697,112
Notes and accounts receivable - Trade (Note 4) 48,820 50,288 448,240
Amounts due from unconsolidated subsidiaries and affiliates 440 420 3,744
Other 926 1,129 10,063
Less: Allowance for doubtful accounts (490) (493) (4,394)
49,696 51,344 457,653
Securities (Notes 3, 4 and 5) 39,000 43,000 383,278
Inventories 20,723 21,395 190,703
Deferred tax assets (Note 12) 1,679 1,825 16,267
Other 2,426 1,541 13,736
Total current assets 187,089 197,314 1,758,749
Property, plant and equipment (Notes 7, 8 ,11 ,16 and 19):
Buildings and structures 136,326 141,418 1,260,522
Machinery and equipment 109,621 113,214 1,009,127
Leased assets 4,444 4,715 42,027
Other 5,768 5,998 53,463
256,159 265,345 2,365,139
Less: Accumulated depreciation (172,519) (173,113) (1,543,034)
83,640 92,232 822,105
Land 35,585 35,337 314,975
Construction in progress 5,716 1,787 15,928
Total property, plant and equipment 124,941 129,356 1,153,008
Intangible assets 3,055 2,429 21,651
Investments and other assets:
Investments in unconsolidated subsidiaries and affiliates (Note 4) 5,209 5,209 46,430
Investment securities (Notes 4 and 5) 22,896 24,480 218,201
Deferred tax assets (Note 12) 1,274 1,470 13,103
Asset for retirement benefits (Note 9) 65 73 651
Other 868 1,076 9,590
Less: Allowance for doubtful accounts — (332) (2,959)
Total investments and other assets 30,312 31,976 285,016
Total assets ¥345,397 ¥ 361,075 $ 3,218,424
The accompanying notes are an integral part of these consolidated financial statements.
ASSETS
CONSOLIDATED BALANCE SHEETSTOYO SUISAN KAISHA, LTD. AND ITS SUBSIDIARIESAS OF MARCH 31, 2016 AND 2017

TOYO SUISAN ANNUAL REPORT 2017 7
Millions of yenThousands of
U.S. dollars (Note 1)
2016 2017 2017
Current liabilities:
Short-term loans (Notes 4 and 8) ¥ 275 ¥ 268 $ 2,389
Current portion of long-term debt (Notes 4 and 8) 30 — —
Lease obligations (Notes 4 and 8) 216 244 2,175
Notes and accounts payable - Trade (Note 4) 22,714 22,978 204,813
Amounts due to unconsolidated subsidiaries and affiliates 1,261 1,361 12,131
Other 1,302 1,544 13,762
25,277 25,883 230,706
Deferred tax liabilities (Note 12) 2 3 27
Income taxes payable 3,515 3,068 27,346
Accrued expenses 19,506 19,713 175,711
Provision for removal cost of property, plant and equipment — 179 1,596
Other 1,668 861 7,674
Total current liabilities 50,489 50,219 447,624
Long-term liabilities:
Lease obligations (Notes 4 and 8) 3,958 3,956 35,262
Deferred tax liabilities (Note 12) 4,212 4,022 35,850
Reserve for retirement benefits for officers 227 213 1,899
Liability for retirement benefits (Note 9) 18,552 18,846 167,983
Asset retirement obligations 315 229 2,041
Other 1,444 1,795 15,999
Total long-term liabilities 28,708 29,061 259,034
Total liabilities 79,197 79,280 706,658
Contingent liabilities (Note 17)
Net assets (Notes 13 and 14):
Shareholders’ equity:
Common stock-
Authorized: 427,000,000 shares in 2016 and 2017
Issued: 110,881,044 shares in 2016 and 2017 18,969 18,969 169,079
Capital surplus 22,518 22,943 204,501
Retained earnings 213,568 228,277 2,034,736
Treasury stock, at cost
Held by the Company:
8,702,374 shares in 2016, 8,702,530 shares in 2017
Owned by consolidated subsidiaries and affiliates:
49,018 shares in 2016, 49,018 shares in 2017 (8,225) (8,226) (73,322)
Total shareholders’ equity 246,830 261,963 2,334,994
Accumulated other comprehensive income:
Net unrealized gain on investment securities, net of taxes (Note 5) 7,807 8,738 77,886
Net unrealized loss on hedging instruments, net of taxes (Note 6) (48) (6) (53)
Foreign currency translation adjustments 3,218 2,627 23,415
Accumulated adjustments for retirement benefits (Note 9) (2,377) (2,124) (18,932)
Total accumulated other comprehensive income 8,600 9,235 82,316
Non-controlling interests 10,770 10,597 94,456
Total net assets 266,200 281,795 2,511,766
Total liabilities and net assets ¥345,397 ¥361,075 $3,218,424
The accompanying notes are an integral part of these consolidated financial statements.
LIABILITIES AND NET ASSETS

TOYO SUISAN ANNUAL REPORT 20178
Millions of yenThousands of
U.S. dollars (Note 1)
2016 2017 2017
Net sales (Note 19) ¥383,277 ¥382,679 $3,410,990
Cost of sales (Note 10) 240,491 237,693 2,118,664
Gross profit 142,786 144,986 1,292,326
Selling, general and administrative expenses (Note 10) 114,472 115,500 1,029,504
Operating income (Note 19) 28,314 29,486 262,822
Non-operating income (expenses):
Interest and dividend income 835 1,280 11,409
Interest expenses (277) (266) (2,371)
Equity in earnings of affiliate accounted for under the equity method 106 117 1,043
Foreign exchange gain (loss), net (283) 192 1,711
Gain (Loss) on sales or disposal of property, plant and equipment, net 441 (707) (6,302)
Gain on sales of investments in securities (Note 5) 146 7 62
Provision of allowance for doubtful accounts (5) (335) (2,986)
Provision for removal cost of property, plant and equipment — (179) (1,596)
Loss on write-down of investments in unconsolidated subsidiaries and affiliates (31) (429) (3,824)
Impairment losses on fixed assets (Notes 11 and 19) (1,382) (783) (6,979)
Subsidy received 145 1,381 12,309
Other, net 797 699 6,232
Income before income taxes 28,806 30,463 271,530
Income taxes (Note 12):
Current 10,120 10,309 91,888
Deferred (533) (1,070) (9,537)
9,587 9,239 82,351
Net income 19,219 21,224 189,179
Net income attributable to non-controlling interests 855 387 3,449
Net income attributable to owners of parent ¥ 18,364 ¥ 20,837 $ 185,730
Yen U.S. dollars (Note 1)
2016 2017 2017
Amounts per share of common stock (Note 15):
Net income ¥179.8 ¥204.0 $1.82
Cash dividends applicable to the year 60.0 60.0 0.53
The accompanying notes are an integral part of these consolidated financial statements.
CONSOLIDATED STATEMENTS OF INCOMETOYO SUISAN KAISHA, LTD. AND ITS SUBSIDIARIESFOR THE YEARS ENDED MARCH 31, 2016 AND 2017

TOYO SUISAN ANNUAL REPORT 2017 9
Millions of yenThousands of
U.S. dollars (Note 1)
2016 2017 2017
Net income ¥19,219 ¥21,224 $189,179
Other comprehensive income (Note 18):
Net unrealized gain on investment securities, net of taxes 664 1,078 9,609
Net unrealized gain (loss) on hedging instruments, net of taxes (64) 42 374
Foreign currency translation adjustments (5,000) (591) (5,268)
Adjustments for retirement benefits (2,789) 301 2,683
Share of other comprehensive income of affiliate accounted for using the equity method (13) 19 170
Total other comprehensive income (7,202) 849 7,568
Comprehensive income ¥12,017 ¥22,073 $196,747
Total comprehensive income attributable to:
Owners of parent ¥11,342 ¥21,473 $191,399
Non-controlling interests 675 600 5,348
The accompanying notes are an integral part of these consolidated financial statements.
CONSOLIDATED STATEMENTS OF COMPREHENSIVE INCOMETOYO SUISAN KAISHA, LTD. AND ITS SUBSIDIARIESFOR THE YEARS ENDED MARCH 31, 2016 AND 2017

TOYO SUISAN ANNUAL REPORT 201710
Millions of yen
Shareholders’ equity Accumulated other comprehensive income
Non-controlling interests
Total net assets
Common stock
Capital surplus
Retained earnings
Treasury stock, at cost
Total shareholders'
equity
Net unrealized
gain on investment
securities, net of taxes
Net unrealized
gain (loss) on hedging
instruments, net of taxes
Foreign currency
translation adjustments
Accumulated adjustments
for retirement benefits
Total accumulated
other comprehensive
income
Balance at March 31, 2015 ¥18,969 ¥22,517 ¥200,821 ¥(8,220) ¥234,087 ¥7,050 ¥ 16 ¥8,218 ¥337 ¥15,621 ¥10,242 ¥259,950
Net income attributable to owners of parent — -— 18,364 — 18,364 — — — — — — 18,364
Cash dividends paid —- — (5,617) — (5,617) — — — — — — (5,617)
Change in treasury shares of parent arising from transactions with non-controlling shareholders
— 1 — 1 — — — — — (2) (1)
Acquisition of treasury stock — — — (5) (5) — — — — — — (5)
Net changes in items except shareholders' equity
— — — — — 757 (64) (5,000) (2,714) (7,021) 530 (6,491)
Balance at March 31, 2016 ¥18,969 ¥22,518 ¥213,568 ¥(8,225) ¥246,830 ¥7,807 ¥(48) ¥3,218 ¥(2,377) ¥ 8,600 ¥10,770 ¥266,200
Net income attributable to owners of parent — — 20,837 — 20,837 — — — — — — 20,837
Cash dividends paid — — (6,128) — (6,128) — — — — — — (6,128)
Change in treasury shares of parent arising from transactions with non-controlling shareholders
— 425 — 425 — — — — — (624) (199)
Acquisition of treasury stock — — — (1) (1) — — — — — — (1)
Net changes in items except shareholders' equity
— — — — — 931 42 (591) 253 635 451 1,086
Balance at March 31, 2017 ¥18,969 ¥22,943 ¥228,277 ¥(8,226) ¥261,963 ¥8,738 ¥ (6) ¥2,627 ¥(2,124) ¥ 9,235 ¥10,597 ¥281,795
Thousands of U.S. dollars (Note 1)
Shareholders’ equity Accumulated other comprehensive income
Non-controlling interests
Total net assets
Common stock
Capital surplus
Retained earnings
Treasury stock, at cost
Total shareholders'
equity
Net unrealized
gain on investment
securities, net of taxes
Net unrealized
gain (loss) on hedging
instruments, net of taxes
Foreign currency
translation adjustments
Accumulated adjustments
for retirement benefits
Total accumulated
other comprehensive
income
Balance at March 31, 2016 $169,079 $200,713 $1,903,628 $(73,313) $2,200,107 $69,588 $(427) $28,683 $(21,187) $76,657 $95,998 $2,372,762
Net income attributable to owners of parent — — 185,730 — 185,730 — — — — — — 185,730
Cash dividends paid — — (54,622) — (54,622) — — — — — — (54,622)
Change in treasury shares of parent arising from transactions with non-controlling shareholders
— 3,788 — — 3,788 — — — — — (5,562) (1,774)
Acquisition of treasury stock — — — (9) (9) — — — — — — (9)
Net changes in items except shareholders’ equity
— — — — — 8,298 374 (5,268) 2,255 5,659 4,020 9,679
Balance at March 31, 2017 $169,079 $204,501 $2,034,736 $(73,322) $2,334,994 $77,886 $ (53) $23,415 $(18,932) $82,316 $94,456 $2,511,766
The accompanying notes are an integral part of these consolidated financial statements.
CONSOLIDATED STATEMENTS OF CHANGES IN NET ASSETSTOYO SUISAN KAISHA, LTD. AND ITS SUBSIDIARIESFOR THE YEARS ENDED MARCH 31, 2016 AND 2017
TOYO SUISAN ANNUAL REPORT 2017 11
Millions of yenThousands of
U.S. dollars (Note 1)
2016 2017 2017
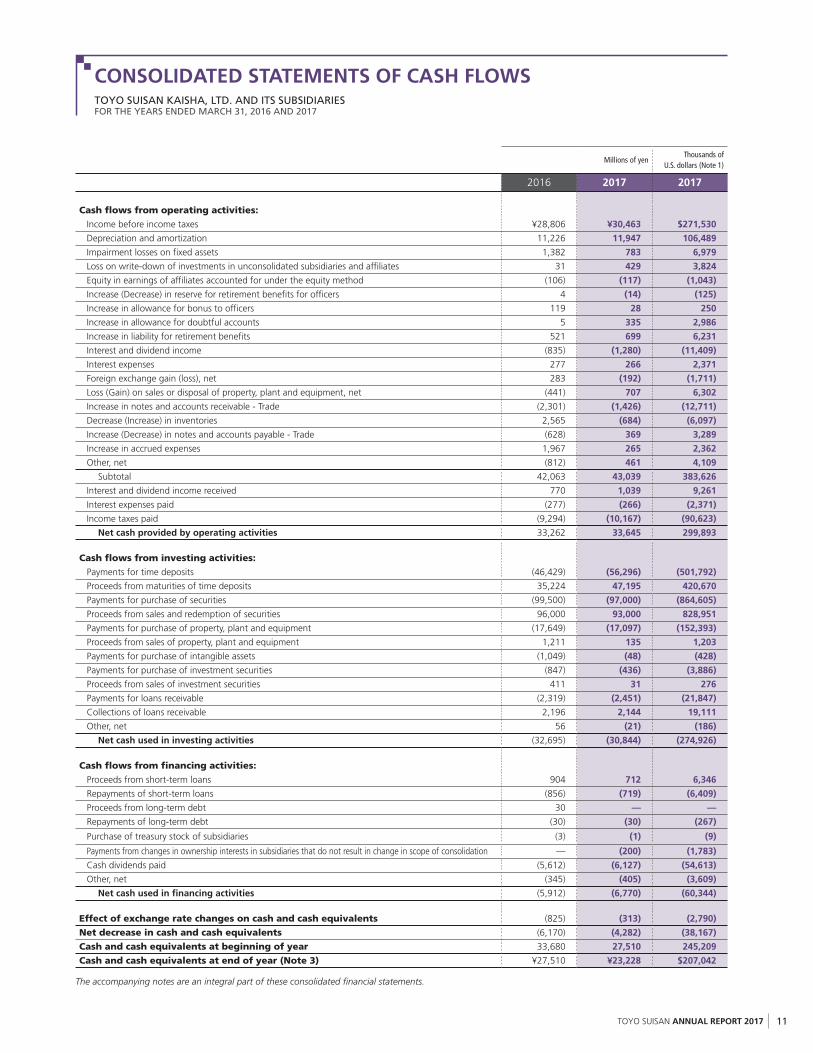
Cash flows from operating activities:
Income before income taxes ¥28,806 ¥30,463 $271,530
Depreciation and amortization 11,226 11,947 106,489
Impairment losses on fixed assets 1,382 783 6,979
Loss on write-down of investments in unconsolidated subsidiaries and affiliates 31 429 3,824
Equity in earnings of affiliates accounted for under the equity method (106) (117) (1,043)
Increase (Decrease) in reserve for retirement benefits for officers 4 (14) (125)
Increase in allowance for bonus to officers 119 28 250
Increase in allowance for doubtful accounts 5 335 2,986
Increase in liability for retirement benefits 521 699 6,231
Interest and dividend income (835) (1,280) (11,409)
Interest expenses 277 266 2,371
Foreign exchange gain (loss), net 283 (192) (1,711)
Loss (Gain) on sales or disposal of property, plant and equipment, net (441) 707 6,302
Increase in notes and accounts receivable - Trade (2,301) (1,426) (12,711)
Decrease (Increase) in inventories 2,565 (684) (6,097)
Increase (Decrease) in notes and accounts payable - Trade (628) 369 3,289
Increase in accrued expenses 1,967 265 2,362
Other, net (812) 461 4,109
Subtotal 42,063 43,039 383,626
Interest and dividend income received 770 1,039 9,261
Interest expenses paid (277) (266) (2,371)
Income taxes paid (9,294) (10,167) (90,623)
Net cash provided by operating activities 33,262 33,645 299,893
Cash flows from investing activities:
Payments for time deposits (46,429) (56,296) (501,792)
Proceeds from maturities of time deposits 35,224 47,195 420,670
Payments for purchase of securities (99,500) (97,000) (864,605)
Proceeds from sales and redemption of securities 96,000 93,000 828,951
Payments for purchase of property, plant and equipment (17,649) (17,097) (152,393)
Proceeds from sales of property, plant and equipment 1,211 135 1,203
Payments for purchase of intangible assets (1,049) (48) (428)
Payments for purchase of investment securities (847) (436) (3,886)
Proceeds from sales of investment securities 411 31 276
Payments for loans receivable (2,319) (2,451) (21,847)
Collections of loans receivable 2,196 2,144 19,111
Other, net 56 (21) (186)
Net cash used in investing activities (32,695) (30,844) (274,926)
Cash flows from financing activities:
Proceeds from short-term loans 904 712 6,346
Repayments of short-term loans (856) (719) (6,409)
Proceeds from long-term debt 30 — —
Repayments of long-term debt (30) (30) (267)
Purchase of treasury stock of subsidiaries (3) (1) (9)
Payments from changes in ownership interests in subsidiaries that do not result in change in scope of consolidation — (200) (1,783)
Cash dividends paid (5,612) (6,127) (54,613)
Other, net (345) (405) (3,609)
Net cash used in financing activities (5,912) (6,770) (60,344)
Effect of exchange rate changes on cash and cash equivalents (825) (313) (2,790)
Net decrease in cash and cash equivalents (6,170) (4,282) (38,167)
Cash and cash equivalents at beginning of year 33,680 27,510 245,209
Cash and cash equivalents at end of year (Note 3) ¥27,510 ¥23,228 $207,042
The accompanying notes are an integral part of these consolidated financial statements.
CONSOLIDATED STATEMENTS OF CASH FLOWSTOYO SUISAN KAISHA, LTD. AND ITS SUBSIDIARIESFOR THE YEARS ENDED MARCH 31, 2016 AND 2017
TOYO SUISAN ANNUAL REPORT 201712
The accompanying consolidated financial statements of Toyo Suisan
Kaisha, Ltd. (“the Company”) and its consolidated subsidiaries have
been prepared in accordance with the provisions set forth in the
Japanese Financial Instruments and Exchange Act and its related
accounting regulations, and in conformity with accounting principles
generally accepted in Japan (“Japanese GAAP”), which are different
in certain respects as to application and disclosure requirements
from International Financial Reporting Standards.
The accompanying consolidated financial statements have been
restructured and translated into English from the consolidated
financial statements of the Company prepared in accordance with
Japanese GAAP and filed with the appropriate Local Finance Bureau
of the Ministry of Finance as required by the Japanese Financial
Instruments and Exchange Act. Certain supplementary information
included in the statutory Japanese language consolidated financial
statements is not presented in the accompanying consolidated
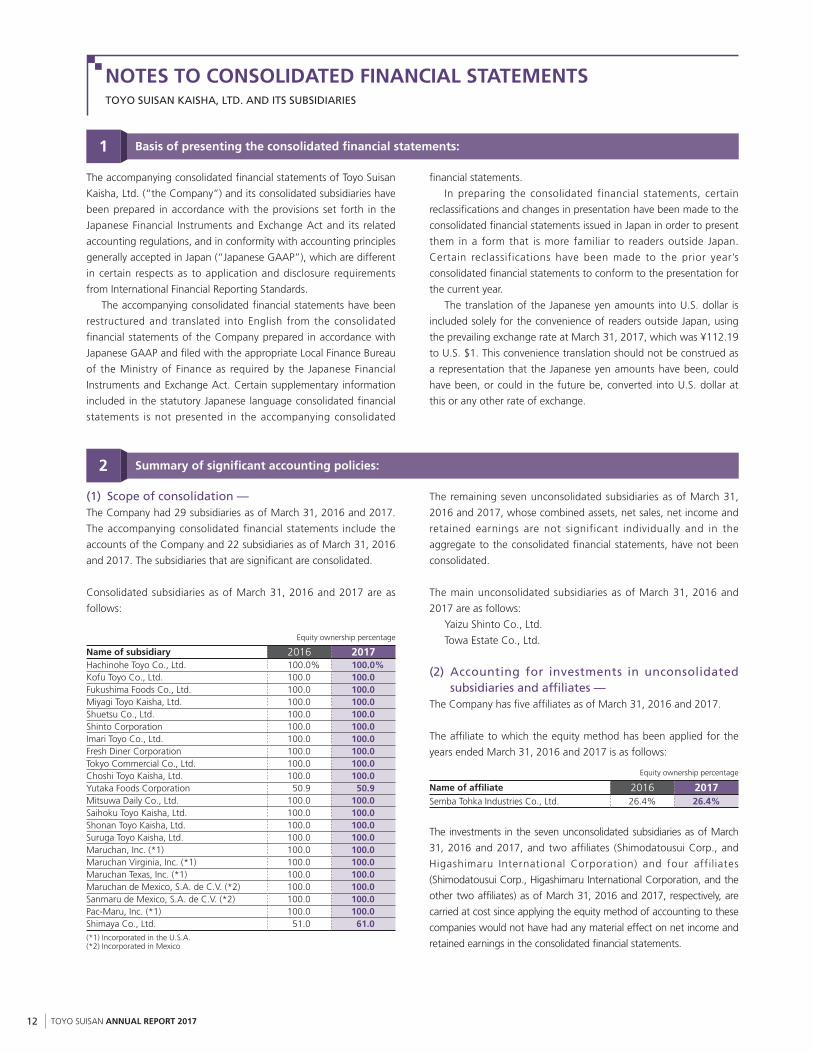
(1) Scope of consolidation —The Company had 29 subsidiaries as of March 31, 2016 and 2017.
The accompanying consolidated financial statements include the
accounts of the Company and 22 subsidiaries as of March 31, 2016
and 2017. The subsidiaries that are significant are consolidated.
Consolidated subsidiaries as of March 31, 2016 and 2017 are as
follows:
Equity ownership percentage
Name of subsidiary 2016 2017Hachinohe Toyo Co., Ltd. 100.0% 100.0%Kofu Toyo Co., Ltd. 100.0 100.0Fukushima Foods Co., Ltd. 100.0 100.0Miyagi Toyo Kaisha, Ltd. 100.0 100.0Shuetsu Co., Ltd. 100.0 100.0Shinto Corporation 100.0 100.0Imari Toyo Co., Ltd. 100.0 100.0Fresh Diner Corporation 100.0 100.0Tokyo Commercial Co., Ltd. 100.0 100.0Choshi Toyo Kaisha, Ltd. 100.0 100.0Yutaka Foods Corporation 50.9 50.9Mitsuwa Daily Co., Ltd. 100.0 100.0Saihoku Toyo Kaisha, Ltd. 100.0 100.0Shonan Toyo Kaisha, Ltd. 100.0 100.0Suruga Toyo Kaisha, Ltd. 100.0 100.0Maruchan, Inc. (*1) 100.0 100.0Maruchan Virginia, Inc. (*1) 100.0 100.0Maruchan Texas, Inc. (*1) 100.0 100.0Maruchan de Mexico, S.A. de C.V. (*2) 100.0 100.0Sanmaru de Mexico, S.A. de C.V. (*2) 100.0 100.0Pac-Maru, Inc. (*1) 100.0 100.0Shimaya Co., Ltd. 51.0 61.0(*1) Incorporated in the U.S.A.(*2) Incorporated in Mexico
financial statements.
In preparing the consolidated financial statements, certain
reclassifications and changes in presentation have been made to the
consolidated financial statements issued in Japan in order to present
them in a form that is more familiar to readers outside Japan.
Certain reclassifications have been made to the prior year’s
consolidated financial statements to conform to the presentation for
the current year.
The translation of the Japanese yen amounts into U.S. dollar is
included solely for the convenience of readers outside Japan, using
the prevailing exchange rate at March 31, 2017, which was ¥112.19
to U.S. $1. This convenience translation should not be construed as
a representation that the Japanese yen amounts have been, could
have been, or could in the future be, converted into U.S. dollar at
this or any other rate of exchange.
The remaining seven unconsolidated subsidiaries as of March 31,
2016 and 2017, whose combined assets, net sales, net income and
retained earnings are not significant individually and in the
aggregate to the consolidated financial statements, have not been
consolidated.
The main unconsolidated subsidiaries as of March 31, 2016 and
2017 are as follows:
Yaizu Shinto Co., Ltd.
Towa Estate Co., Ltd.
(2) Accounting for investments in unconsolidated subsidiaries and affiliates —
The Company has five affiliates as of March 31, 2016 and 2017.
The affiliate to which the equity method has been applied for the
years ended March 31, 2016 and 2017 is as follows:
Equity ownership percentage
Name of affiliate 2016 2017Semba Tohka Industries Co., Ltd. 26.4% 26.4%
The investments in the seven unconsolidated subsidiaries as of March
31, 2016 and 2017, and two affiliates (Shimodatousui Corp., and
Higashimaru International Corporation) and four affiliates
(Shimodatousui Corp., Higashimaru International Corporation, and the
other two affiliates) as of March 31, 2016 and 2017, respectively, are
carried at cost since applying the equity method of accounting to these
companies would not have had any material effect on net income and
retained earnings in the consolidated financial statements.
Basis of presenting the consolidated financial statements:1
Summary of significant accounting policies:2
NOTES TO CONSOLIDATED FINANCIAL STATEMENTSTOYO SUISAN KAISHA, LTD. AND ITS SUBSIDIARIES

TOYO SUISAN ANNUAL REPORT 2017 13
(3) Consolidation principles —The closing date of all consolidated subsidiaries and the affiliate to
which the equity method has been applied is March 31, which is in
agreement with the fiscal year end of the Company.
(4) Foreign currency translation —Foreign currency monetary assets and liabilities are translated into
Japanese yen at the exchange rates prevailing at the balance sheet
date. Resulting gains and losses are included in net profit or loss for
the period.
The assets and liabilities of foreign subsidiaries are translated
into Japanese yen at the exchange rates prevailing at the balance
sheet date. The shareholders’ equity, except for the profit or loss of
the current year, is translated into Japanese yen at the historical
rates. Profit or loss for the year is translated into Japanese yen using
the exchange rates prevailing at the balance sheet date. Differences
arising on translation are presented as foreign currency translation
adjustments in net assets.
(5) Cash and cash equivalents —Cash and cash equivalents in the consolidated statements of cash
flows consist of cash on hand and at banks able to be withdrawn
on demand and short-term investments with an original maturity of
three months or less and, which hold a minor risk of fluctuations in
value.
(6) Securities —Available-for-sale securities with a market value are stated at fair
value based on the market prices as of the balance sheet date with
any unrealized gains or losses, net of applicable taxes, reported as a
component of accumulated other comprehensive income. The cost
of securities sold is stated using the moving average cost. Available-
for-sale securities without a market value are mainly stated at
moving-average cost.
(7) Derivative financial instruments —Gains or losses arising from changes in the fair value of those
derivatives designated as ‘hedging instruments’ are deferred as a
component of accumulated other comprehensive income in the
consolidated balance sheet, and charged to income when the gains
and losses on the hedged items or transactions are recognized.
The Company and its consolidated subsidiaries hold derivative
financial instruments in the form of foreign exchange forward
contracts to hedge against fluctuations in foreign currency exchange
rates. The Company and its consolidated subsidiaries do not hold
derivatives for trading purposes and it is the Company’s policy to
use derivatives only for the purpose of mitigating market risk and
financing costs in accordance with internal criteria.
The Company and its consolidated subsidiaries do not anticipate
any losses resulting from default by the counter-parties, as these are
limited to major domestic financial institutions with sound
operational foundations.
In line with internal risk management policies, for receivables
and payables denominated in foreign currencies, the Company and
its consolidated subsidiaries enter into forward exchange contracts
denominated in the same currency, in the same amount and
executed on the same execution day as the hedged item. The
hedging relationships between the derivative financial instruments
and the hedged items are highly effective in offsetting changes in
foreign currency exchange rates.
(8) Allowance for doubtful accounts —The allowance for doubtful accounts is mainly calculated based on
the aggregate amount of estimated credit losses on doubtful
receivables and an amount for receivables other than doubtful
receivables calculated using a historical write-off ratio.
(9) Inventories —Inventories are stated at the lower of cost, principally calculated
based on the monthly moving-average method, and net realizable
value.
(10) Property, plant and equipment (excluding leased assets) —
Depreciation of property, plant and equipment (excluding leased
assets) of the Company and its domestic consolidated subsidiaries is
mainly computed using the declining balance method over the
estimated useful lives, except the straight line method is used for
buildings (excluding facilities attached to buildings), which were
acquired since April 1, 1998, and facilities attached to buildings and
structures, which were acquired since April 1, 2016.
The range of useful lives are summarized as follows:
Buildings and structures 15-50 yearsMachinery and equipment 4-12 years
The costs of property, plant and equipment retired or otherwise
disposed of and accumulated depreciation in respect thereof are
eliminated from the related accounts, and the resulting gain or loss
is included in income.
Normal repairs and maintenance, including minor renewals and
improvements, are charged to income as incurred.
(11) Intangible assets (excluding leased assets) —Amortization of intangible assets is mainly computed by the
straight-line method over the estimated useful lives of the assets.
Software for internal use owned by the Company and its domestic
consolidated subsidiaries is amortized over its expected useful life (5
years) by the straight-line method.
(12) Accounting for leases —Leased property under finance lease arrangements which transfer
ownership of the leased property to the lessee is depreciated by the
same method as the one applied to property, plant and equipment
owned by the Company.
Leased property under finance lease arrangements which do not
transfer ownership of the leased property to the lessee is capitalized
to recognize leased assets and corresponding lease obligations in
the consolidated balance sheet. The leased assets are depreciated
over the lease term of the respective assets.
Finance leases which commenced prior to April 1, 2008 and do
not transfer ownership of the leased property are accounted for as
operating leases, with disclosure of certain “as if capitalized”
information as permitted under the relevant accounting standard.

TOYO SUISAN ANNUAL REPORT 201714
Cash and cash equivalents as of March 31, 2016 and 2017 are as follows:
Millions of yenThousands of
U.S. dollars
2016 2017 2017
Cash on hand and at banks ¥73,565 ¥78,209 $697,112
Securities with an original maturity of 3 months or less — — —
Time deposits with deposit term of over 3 months (46,055) (54,981) (490,070)
Cash and cash equivalents ¥27,510 ¥23,228 $207,042
(13) Reserve for retirement benefits and pension plan —(a) Retirement benefits for employees
The benefit formula method is used to attribute retirement benefit
obligations to the period through the end of the fiscal year. Past
service costs that are yet to be recognized are amortized mainly over
ten years, which is within the average remaining service period of the
scheme participants, using the straight-line method from the year
they arose. Actuarial gains and losses that are yet to be recognized
are amortized mainly over ten years, which is within the average
remaining service period of the scheme participants, using the
straight-line method from the year following the year in which they
arose. Certain domestic consolidated subsidiaries apply a simplified
method in calculating retirement benefit obligations.
(b) Retirement benefits for officers
Certain domestic consolidated subsidiaries accrue the liabilities for
retirement benefits to officers based on an amount equivalent to
100% of such benefits which would be required to be paid if all
eligible officers retired at the year-end date. The payments of
retirement benefits to officers are subject to approval of shareholders’
meetings.
(14) Provision for removal cost of property, plant and equipment—
Provision for removal cost of property, plant and equipment is
recorded based on the estimated future removal cost of property,
plant and equipment at each year end.
(15) Net income and cash dividends per share of common stock —
Net income per share of common stock is based on the weighted
average number of shares of common stock outstanding during each
year. Cash dividends per share represent dividends declared as
applicable to the respective period.
(16) Accounting for consumption tax —The consumption tax withheld or paid by the Company and its
domestic consolidated subsidiaries on its sales and purchases is not
included in the amounts of the respective accounts in the
consolidated statements of income, but is recorded as an asset or a
liability as the case may be, and the net balance is included in other
current assets or other current liabilities on the consolidated balance
sheets.
(17) Change in accounting policies —(Adoption of Practical Solution on a Change in Depreciation Method
due to Tax Reform 2016)
Due to amendments to the Japanese Corporation Tax Act, the
Company and its domestic consolidated subsidiaries adopted
“Practical Solution on a change in depreciation method due to Tax
Reform 2016” (Practice Issue Task Force No.32, June 17, 2016
(hereinafter, “PITF No.32”)) from the year ended March 31, 2017 and
changed the depreciation method for facilities attached to buildings
and structures, which were acquired since April 1, 2016, from the
declining balance method to the straight line method. The effect of
this change on consolidated financial statements is immaterial.
(18) Additional information —(Adoption of Guidance on Recoverability of Deferred Tax Assets)
The Company and its domestic consolidated subsidiaries adopted
“Revised Implementation Guidance on Recoverability of Deferred Tax
Assets” (ASBJ Guidance No. 26, March 28, 2016) from the year
ended March 31, 2017.
Cash flow information:3
TOYO SUISAN ANNUAL REPORT 2017 15
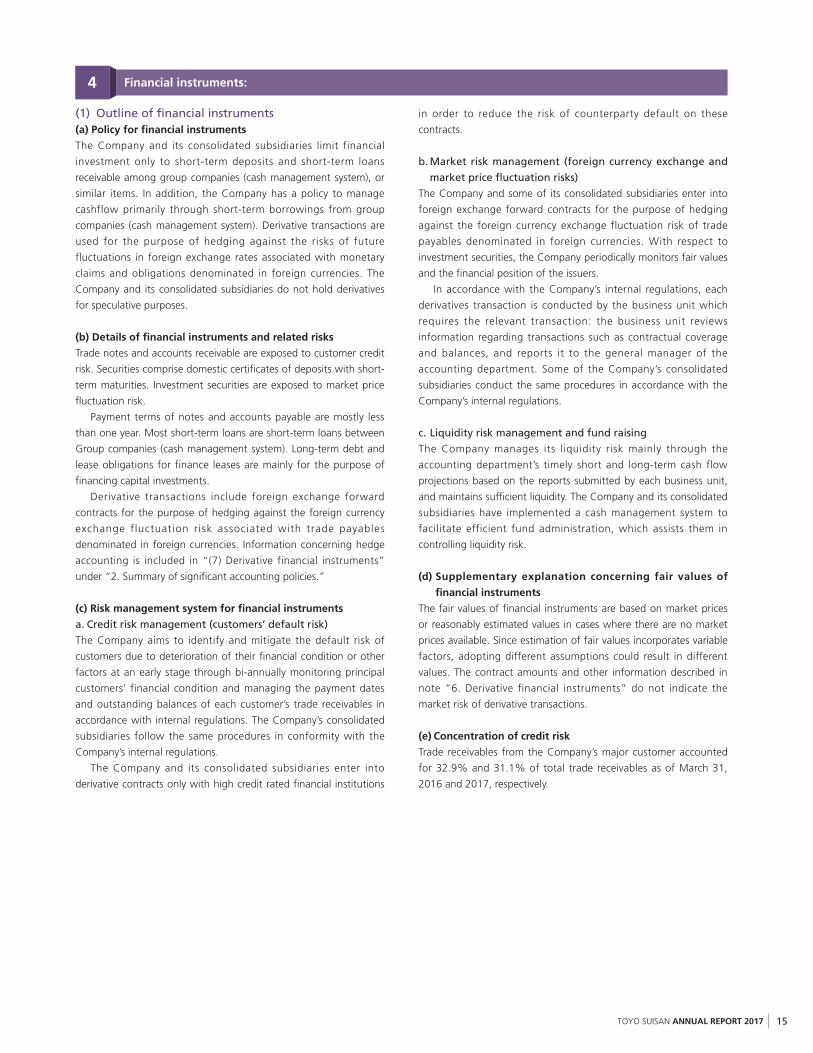
(1) Outline of financial instruments(a) Policy for financial instruments
The Company and its consolidated subsidiaries limit financial
investment only to short-term deposits and short-term loans
receivable among group companies (cash management system), or
similar items. In addition, the Company has a policy to manage
cashflow primarily through short-term borrowings from group
companies (cash management system). Derivative transactions are
used for the purpose of hedging against the risks of future
fluctuations in foreign exchange rates associated with monetary
claims and obligations denominated in foreign currencies. The
Company and its consolidated subsidiaries do not hold derivatives
for speculative purposes.
(b) Details of financial instruments and related risks
Trade notes and accounts receivable are exposed to customer credit
risk. Securities comprise domestic certificates of deposits with short-
term maturities. Investment securities are exposed to market price
fluctuation risk.
Payment terms of notes and accounts payable are mostly less
than one year. Most short-term loans are short-term loans between
Group companies (cash management system). Long-term debt and
lease obligations for finance leases are mainly for the purpose of
financing capital investments.
Derivative transactions include foreign exchange forward
contracts for the purpose of hedging against the foreign currency
exchange fluctuation risk associated with trade payables
denominated in foreign currencies. Information concerning hedge
accounting is included in “(7) Derivative financial instruments”
under “2. Summary of significant accounting policies.”
(c) Risk management system for financial instruments
a. Credit risk management (customers’ default risk)
The Company aims to identify and mitigate the default risk of
customers due to deterioration of their financial condition or other
factors at an early stage through bi-annually monitoring principal
customers’ financial condition and managing the payment dates
and outstanding balances of each customer’s trade receivables in
accordance with internal regulations. The Company’s consolidated
subsidiaries follow the same procedures in conformity with the
Company’s internal regulations.
The Company and its consolidated subsidiaries enter into
derivative contracts only with high credit rated financial institutions
in order to reduce the risk of counterparty default on these
contracts.
b. Market risk management (foreign currency exchange and
market price fluctuation risks)
The Company and some of its consolidated subsidiaries enter into
foreign exchange forward contracts for the purpose of hedging
against the foreign currency exchange fluctuation risk of trade
payables denominated in foreign currencies. With respect to
investment securities, the Company periodically monitors fair values
and the financial position of the issuers.
In accordance with the Company’s internal regulations, each
derivatives transaction is conducted by the business unit which
requires the relevant transaction: the business unit reviews
information regarding transactions such as contractual coverage
and balances, and reports it to the general manager of the
accounting department. Some of the Company’s consolidated
subsidiaries conduct the same procedures in accordance with the
Company’s internal regulations.
c. Liquidity risk management and fund raising
The Company manages its liquidity risk mainly through the
accounting department’s timely short and long-term cash flow
projections based on the reports submitted by each business unit,
and maintains sufficient liquidity. The Company and its consolidated
subsidiaries have implemented a cash management system to
facilitate efficient fund administration, which assists them in
controlling liquidity risk.
(d) Supplementary explanation concerning fair values of
financial instruments
The fair values of financial instruments are based on market prices
or reasonably estimated values in cases where there are no market
prices available. Since estimation of fair values incorporates variable
factors, adopting different assumptions could result in different
values. The contract amounts and other information described in
note “6. Derivative financial instruments” do not indicate the
market risk of derivative transactions.
(e) Concentration of credit risk
Trade receivables from the Company’s major customer accounted
for 32.9% and 31.1% of total trade receivables as of March 31,
2016 and 2017, respectively.
Financial instruments:4

TOYO SUISAN ANNUAL REPORT 201716
2016 Millions of yen
Carrying amount Fair value Unrealized gain (loss)
(1) Cash on hand and at banks ¥ 73,565 ¥ 73,565 ¥ —
(2) Notes and accounts receivable - Trade 48,820 48,820 —
(3) Securities 39,000 39,000 —
(4) Investments in unconsolidated subsidiaries and affiliates 2,298 1,383 (915)
(5) Investment securities Available-for-sale securities
22,282 22,282 —
Assets total ¥185,965 ¥185,050 ¥(915)
(1) Notes and accounts payable - Trade ¥ 22,714 ¥ 22,714 ¥—
(2) Short-term loans 275 275 —
(3) Long-term debt (*3) 30 30 0
(4) Lease obligations (*1) 4,174 4,283 109
Liabilities total ¥ 27,193 ¥ 27,302 ¥ 109
Derivative transactions (*2) ¥ (64) ¥ (64) ¥ —
2017 Millions of yen
Carrying amount Fair value Unrealized gain (loss)
(1) Cash on hand and at banks ¥ 78,209 ¥ 78,209 ¥ —
(2) Notes and accounts receivable - Trade 50,288 50,288 —
(3) Securities 43,000 43,000 —
(4) Investments in unconsolidated subsidiaries and affiliates 2,397 1,521 (876)
(5) Investment securities Available-for-sale securities
23,804 23,804 —
Assets total ¥197,698 ¥196,822 ¥(876)
(1) Notes and accounts payable - Trade ¥ 22,978 ¥ 22,978 ¥—
(2) Short-term loans 268 268 —
(3) Long-term debt (*3) — — —
(4) Lease obligations (*1) 4,200 4,278 78
Liabilities total ¥ 27,446 ¥ 27,524 ¥ 78
Derivative transactions (*2) ¥ (6) ¥ (6) ¥ —
(2) Fair values of financial instrumentsCarrying amount of the financial instruments included in the consolidated balance sheets and their fair values as of March 31, 2016 and 2017
are as follows:
Certain financial instruments are excluded from the following table as the fair values are not readily available.
TOYO SUISAN ANNUAL REPORT 2017 17
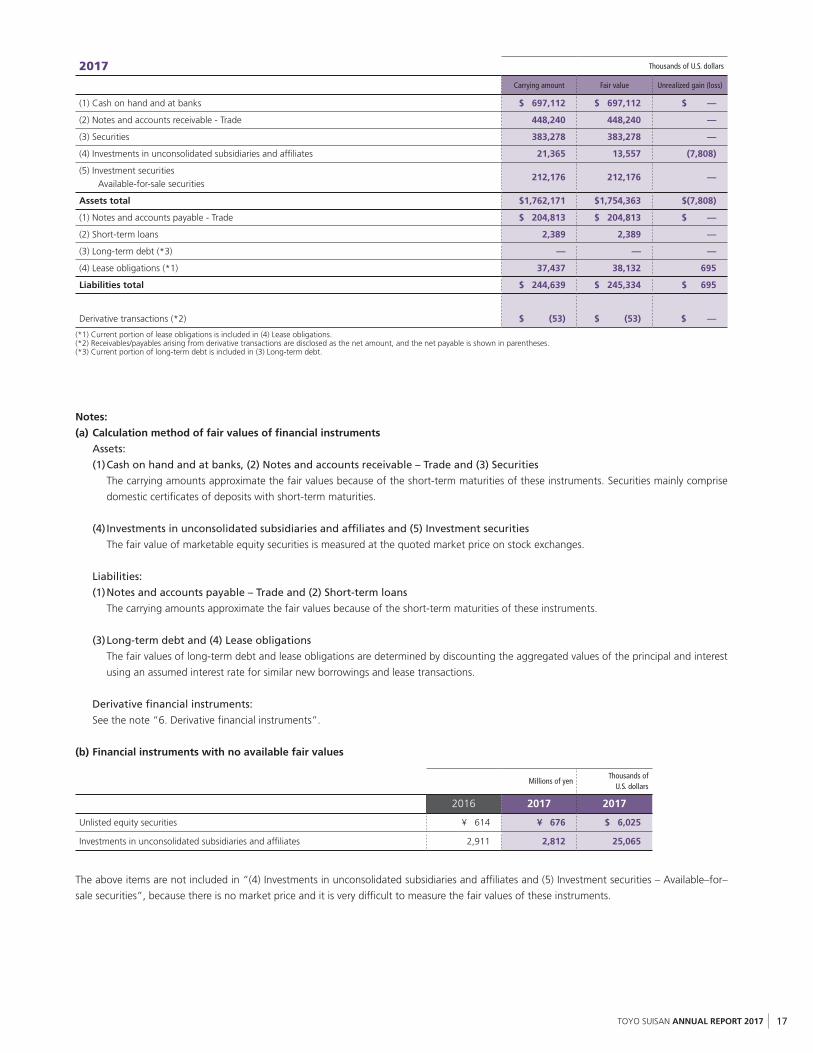
Notes:
(a) Calculation method of fair values of financial instruments
Assets:
(1) Cash on hand and at banks, (2) Notes and accounts receivable – Trade and (3) Securities
The carrying amounts approximate the fair values because of the short-term maturities of these instruments. Securities mainly comprise
domestic certificates of deposits with short-term maturities.
(4) Investments in unconsolidated subsidiaries and affiliates and (5) Investment securities
The fair value of marketable equity securities is measured at the quoted market price on stock exchanges.
Liabilities:
(1) Notes and accounts payable – Trade and (2) Short-term loans
The carrying amounts approximate the fair values because of the short-term maturities of these instruments.
(3) Long-term debt and (4) Lease obligations
The fair values of long-term debt and lease obligations are determined by discounting the aggregated values of the principal and interest
using an assumed interest rate for similar new borrowings and lease transactions.
Derivative financial instruments:
See the note “6. Derivative financial instruments”.
(b) Financial instruments with no available fair values
The above items are not included in “(4) Investments in unconsolidated subsidiaries and affiliates and (5) Investment securities – Available–for–
sale securities”, because there is no market price and it is very difficult to measure the fair values of these instruments.
2017 Thousands of U.S. dollars
Carrying amount Fair value Unrealized gain (loss)
(1) Cash on hand and at banks $ 697,112 $ 697,112 $ —
(2) Notes and accounts receivable - Trade 448,240 448,240 —
(3) Securities 383,278 383,278 —
(4) Investments in unconsolidated subsidiaries and affiliates 21,365 13,557 (7,808)
(5) Investment securitiesAvailable-for-sale securities
212,176 212,176 —
Assets total $1,762,171 $1,754,363 $(7,808)
(1) Notes and accounts payable - Trade $ 204,813 $ 204,813 $ —
(2) Short-term loans 2,389 2,389 —
(3) Long-term debt (*3) — — —
(4) Lease obligations (*1) 37,437 38,132 695
Liabilities total $ 244,639 $ 245,334 $ 695
Derivative transactions (*2) $ (53) $ (53) $ —
(*1) Current portion of lease obligations is included in (4) Lease obligations.(*2) Receivables/payables arising from derivative transactions are disclosed as the net amount, and the net payable is shown in parentheses.(*3) Current portion of long-term debt is included in (3) Long-term debt.
Millions of yenThousands of
U.S. dollars
2016 2017 2017
Unlisted equity securities ¥ 614 ¥ 676 $ 6,025
Investments in unconsolidated subsidiaries and affiliates 2,911 2,812 25,065

TOYO SUISAN ANNUAL REPORT 201718
2016 Millions of yen
Carrying amount Acquisition cost Difference
Securities with carrying amount (fair value) exceeding acquisition costs:Equity securities
¥22,082 ¥10,704 ¥11,378
Securities with carrying amount (fair value) not exceeding acquisition costs:Equity securities
200 215 (15)
Other 39,000 39,000 —
¥61,282 ¥49,919 ¥11,363
2016 Millions of yen
Within one year One to five years Over five to ten years Over ten years
Cash on hand and at banks ¥ 73,565 ¥— ¥— ¥—
Notes and accounts receivable - Trade 48,820 — — —
Securities Certificates of deposits
39,000 — — —
Total ¥161,385 ¥— ¥— ¥—
2017 Millions of yen
Within one year One to five years Over five to ten years Over ten years
Cash on hand and at banks ¥ 78,209 ¥— ¥— ¥—
Notes and accounts receivable - Trade 50,288 — — —
Securities Certificates of deposits
43,000 — — —
Total ¥171,497 ¥— ¥— ¥—
2017 Thousands of U.S. dollars
Within one year One to five years Over five to ten years Over ten years
Cash on hand and at banks $ 697,112 $— $— $—
Notes and accounts receivable - Trade 448,240 — — —
Securities Certificates of deposits
383,278 — — —
Total $1,528,630 $— $— $—
(c) Redemption schedule for financial assets with maturity dates subsequent to the year end
(d) Redemption schedule for lease obligations with maturity dates subsequent to March 31, 2017
See note “8. Short-term loans, long-term debt and lease obligations”.
(1) There were no held-to-maturity securities as of March 31, 2016 and 2017.
(2) Available-for-sale securities with a market value as of March 31, 2016 and 2017 are as follows:
Securities:5

TOYO SUISAN ANNUAL REPORT 2017 19
2016 Millions of yen
Transaction types Major hedged items Contract amountContract amount due
over one yearFair value (a)
Foreign exchange forward contracts:Buying U.S. dollar
Future purchase transactions denominated in foreign currency
¥1,923 ¥— ¥(64)
Foreign exchange forward contracts:Buying U.S. dollar (b)
Accounts payable 293 — —
Total ¥2,216 ¥— ¥(64)
2017 Millions of yen
Transaction types Major hedged items Contract amountContract amount due
over one yearFair value (a)
Foreign exchange forward contracts:Buying U.S. dollar
Future purchase transactionsdenominated in foreign currency
¥1,300 ¥— ¥(6)
Foreign exchange forward contracts:Buying U.S. dollar (b)
Accounts payable 411 — —
Total ¥1,711 ¥— ¥(6)
2016 Millions of yen
Sales proceeds Total gain on sale Total loss on sale
Equity securities ¥411 ¥146 ¥—
2017 Millions of yen
Sales proceeds Total gain on sale Total loss on sale
Equity securities ¥31 ¥7 ¥—
2017 Thousands of U.S. dollars
Sales proceeds Total gain on sale Total loss on sale
Equity securities $276 $62 $—
2017 Millions of yen
Carrying amount Acquisition cost Difference
Securities with carrying amount (fair value) exceeding acquisition costs:Equity securities
¥23,738 ¥10,871 ¥12,867
Securities with carrying amount (fair value) not exceeding acquisition costs:Equity securities
66 76 (10)
Other 43,000 43,000 —
¥66,804 ¥53,947 ¥12,857
2017 Thousands of U.S. dollars
Carrying amount Acquisition cost Difference
Securities with carrying amount (fair value) exceeding acquisition costs:Equity securities
$211,588 $ 96,898 $114,690
Securities with carrying amount (fair value) not exceeding acquisition costs:Equity securities
588 677 (89)
Other 383,278 383,278 —
$595,454 $480,853 $114,601
(3) Available-for-sale securities sold during the years ended March 31, 2016 and 2017 are as follows:
Contract amounts and fair values of derivative instruments for which hedge accounting is applied as of March 31, 2016 and 2017 are as
follows:
Derivative financial instruments:6

TOYO SUISAN ANNUAL REPORT 201720
Millions of yen
Book value Fair value
Balance at March 31, 2015 Increase / (Decrease) Balance at March 31, 2016 Balance at March 31, 2016
¥1,735 ¥(144) ¥1,591 ¥5,786
Millions of yen
Book value Fair value
Balance at March 31, 2016 Increase / (Decrease) Balance at March 31, 2017 Balance at March 31, 2017
¥1,591 ¥52 ¥1,643 ¥6,368
Thousands of U.S. dollars
Book value Fair value
Balance at March 31, 2016 Increase / (Decrease) Balance at March 31, 2017 Balance at March 31, 2017
$14,181 $464 $14,645 $56,761
2017 Thousands of U.S. dollars
Transaction types Major hedged items Contract amountContract amount due
over one yearFair value (a)
Foreign exchange forward contracts: Buying U.S. dollar
Future purchase transactions denominated in foreign currency
$11,588 $— $(53)
Foreign exchange forward contracts: Buying U.S. dollar (b)
Accounts payable 3,663 — —
Total $15,251 $— $(53)
Notes:
(a) The fair values of derivative transactions are based on prices provided by applicable financial institutions.
(b) When foreign exchange forward contracts meet certain conditions, the corresponding hedged items are translated at the forward exchange contract rates. The
fair values of such foreign exchange forward contracts are included in the fair value of the hedged accounts receivable or payable in note “4. Financial
Instruments”.
Notes:
(a) Book value represents acquisition cost less accumulated depreciation and accumulated impairment losses, if any.
(b) Fair values of properties are mainly calculated internally based on the main-street land prices for tax purposes.
The Company and certain subsidiaries hold rental properties and idle properties in Tokyo and other areas of Japan. Profit from those properties
for the years ended March 31, 2016 and 2017 were ¥138 million and ¥138 million ($1,230 thousand), respectively.
The book value, net changes during the year and the fair values of such properties as of March 31, 2016 and 2017 are as follows:
Investments and rental property:7
TOYO SUISAN ANNUAL REPORT 2017 21
Millions of yenThousands of
U.S. dollars
2016 2017 2017
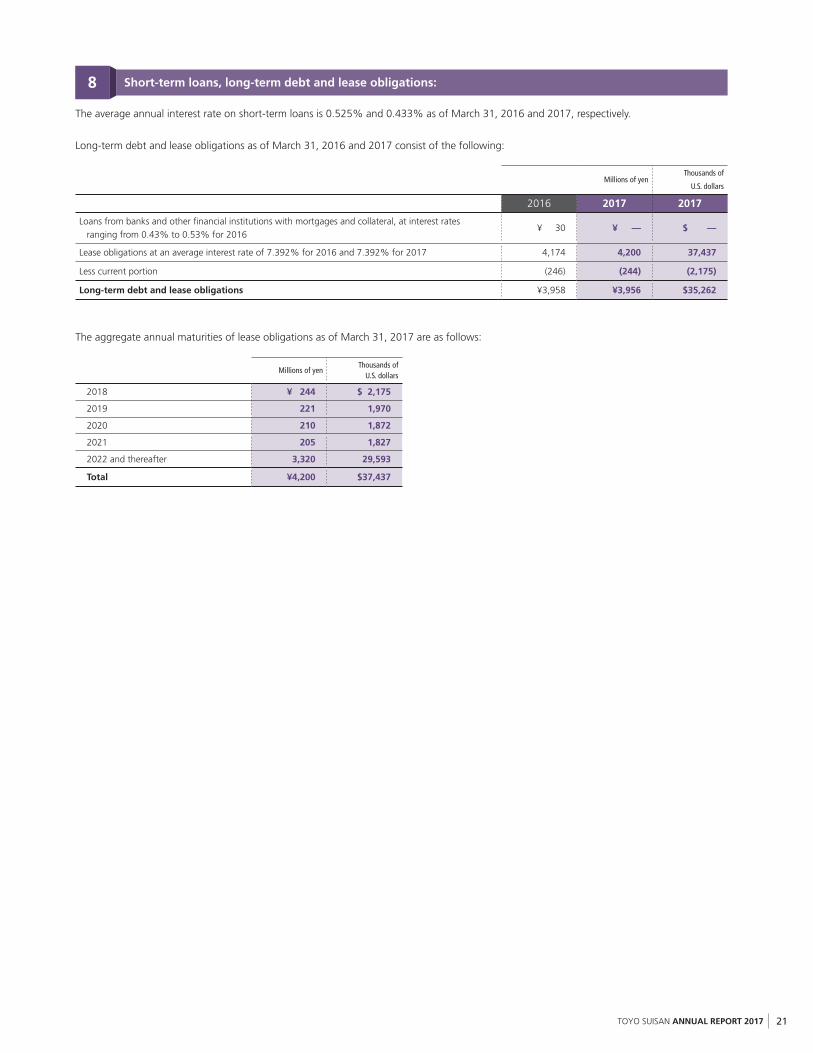
Loans from banks and other financial institutions with mortgages and collateral, at interest rates ranging from 0.43% to 0.53% for 2016
¥ 30 ¥ — $ —
Lease obligations at an average interest rate of 7.392% for 2016 and 7.392% for 2017 4,174 4,200 37,437
Less current portion (246) (244) (2,175)
Long-term debt and lease obligations ¥3,958 ¥3,956 $35,262
Millions of yenThousands of
U.S. dollars
2018 ¥ 244 $ 2,175
2019 221 1,970
2020 210 1,872
2021 205 1,827
2022 and thereafter 3,320 29,593
Total ¥4,200 $37,437
The average annual interest rate on short-term loans is 0.525% and 0.433% as of March 31, 2016 and 2017, respectively.
Long-term debt and lease obligations as of March 31, 2016 and 2017 consist of the following:
The aggregate annual maturities of lease obligations as of March 31, 2017 are as follows:
Short-term loans, long-term debt and lease obligations:8

TOYO SUISAN ANNUAL REPORT 201722
The Company and its consolidated subsidiaries have funded and unfunded defined benefit plans covering substantially all employees.
Funded defined benefit pension plans provide lump-sum or pension payments based on the current basic rate of payment and length of
service of employees. Unfunded lump-sum severance payment plans (provide lump-sum payments based on a point-based plan. Certain
consolidated subsidiaries apply a simplified method in computing liabilities for retirement benefits and retirement benefit costs for their defined
benefit pension plans. The tables below include plans to which the simplified method is applied.
Movements in retirement benefit obligations for the years ended March 31, 2016 and 2017 are as follows:
Movements in plan assets for the years ended March 31, 2016 and 2017 are as follows:
Millions of yenThousands of
U.S. dollars
2016 2017 2017
Balance at beginning of the year ¥31,577 ¥36,561 $325,885
Service cost 1,665 1,876 16,722
Interest cost 295 78 695
Actuarial loss 4,119 3 27
Benefits paid (1,095) (939) (8,370)
Balance at end of the year ¥36,561 ¥37,579 $334,959
Millions of yenThousands of
U.S. dollars
2016 2017 2017
Balance at beginning of the year ¥17,617 ¥18,074 $161,101
Expected return on plan assets 2 1 9
Actuarial loss (116) (33) (294)
Employer contributions 1,369 1,434 12,782
Benefits paid (798) (670) (5,972)
Balance at end of the year ¥18,074 ¥18,806 $167,626
Retirement benefits and pension plans:9
TOYO SUISAN ANNUAL REPORT 2017 23
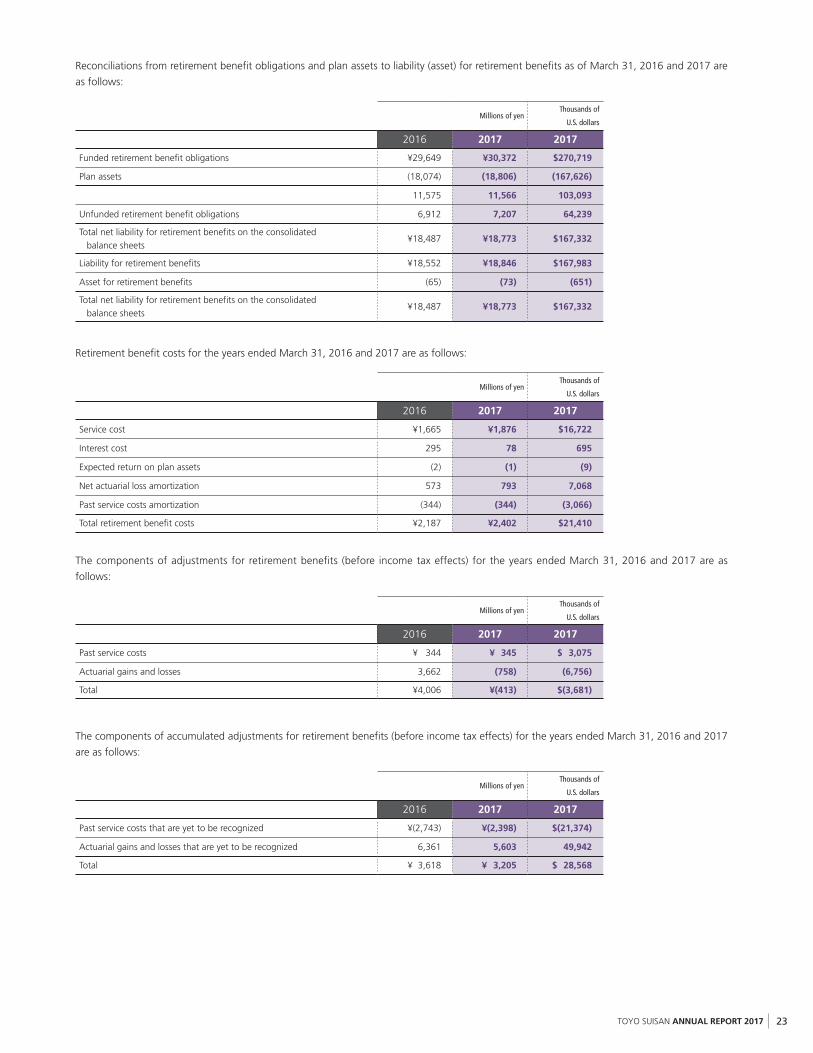
Reconciliations from retirement benefit obligations and plan assets to liability (asset) for retirement benefits as of March 31, 2016 and 2017 are
as follows:
Millions of yenThousands of
U.S. dollars
2016 2017 2017
Funded retirement benefit obligations ¥29,649 ¥30,372 $270,719
Plan assets (18,074) (18,806) (167,626)
11,575 11,566 103,093
Unfunded retirement benefit obligations 6,912 7,207 64,239
Total net liability for retirement benefits on the consolidated balance sheets
¥18,487 ¥18,773 $167,332
Liability for retirement benefits ¥18,552 ¥18,846 $167,983
Asset for retirement benefits (65) (73) (651)
Total net liability for retirement benefits on the consolidated balance sheets
¥18,487 ¥18,773 $167,332
Retirement benefit costs for the years ended March 31, 2016 and 2017 are as follows:
The components of adjustments for retirement benefits (before income tax effects) for the years ended March 31, 2016 and 2017 are as
follows:
The components of accumulated adjustments for retirement benefits (before income tax effects) for the years ended March 31, 2016 and 2017
are as follows:
Millions of yenThousands of
U.S. dollars
2016 2017 2017
Service cost ¥1,665 ¥1,876 $16,722
Interest cost 295 78 695
Expected return on plan assets (2) (1) (9)
Net actuarial loss amortization 573 793 7,068
Past service costs amortization (344) (344) (3,066)
Total retirement benefit costs ¥2,187 ¥2,402 $21,410
Millions of yenThousands of
U.S. dollars
2016 2017 2017
Past service costs ¥ 344 ¥ 345 $ 3,075
Actuarial gains and losses 3,662 (758) (6,756)
Total ¥4,006 ¥(413) $(3,681)
Millions of yenThousands of
U.S. dollars
2016 2017 2017
Past service costs that are yet to be recognized ¥(2,743) ¥(2,398) $(21,374)
Actuarial gains and losses that are yet to be recognized 6,361 5,603 49,942
Total ¥ 3,618 ¥ 3,205 $ 28,568

TOYO SUISAN ANNUAL REPORT 201724
2016 2017
Cash on hand and at banks 86% 86%
Life insurance general accounts 14 14
Other 0 0
Total 100% 100%
2016 2017
Discount rate 0.1-0.2% 0.2%
Long-term expected rate of return 0-1.0% 0-0.3%
Research and development expenses for the years ended March 31, 2016 and 2017 were ¥1,493 million and ¥1,552 ($13,834 thousand),
respectively.
For the years ended March 31, 2016 and 2017, the Company and its consolidated subsidiaries recognized impairment losses on fixed assets on
the following groups of assets.
Method for determining long-term expected rate of return
The long-term expected rate of return on plan assets is determined considering the current and expected distribution of plan assets and the
long-term rate of return derived from the various components of plan assets.
Significant assumptions used in determining the retirement benefit obligations for the years ended March 31, 2016 and 2017 are as follows:
The Company and its consolidated subsidiaries classify their fixed assets into groups based on the type of respective operations of each business
segment. Idle assets are assessed individually.
The book values of impaired business assets were reduced to the recoverable amounts due to reduced profitability. The recoverable value
was measured as the higher of (1) net realizable value based on amounts mainly determined by valuations made in accordance with real estate
appraisal standards or the value assessed for property tax purposes or (2) present value of the expected cash flows from the ongoing utilization
and subsequent disposition of the assets discounted at 5% for the year ended March 31, 2016. The recoverable value was measured as the
present value of the expected cash flows from the ongoing utilization of the assets for the year ended March 31, 2017. Since the future cash
flows are expected to be negative, they were measured at their memorandum value.
The book values of idle assets were reduced to recoverable amounts which were based on net selling prices in for the year ended March 31,
2016. The book values of idle assets were measured at their memorandum value at March 31, 2017 because they were expected to be
removed.
Millions of yenThousands of
U.S. dollars
Use Type of Assets 2016 2017 2017
Business assets Buildings, machinery and equipment, land ¥1,322 ¥529 $4,715
Idle assets Buildings, machinery and equipment 60 254 2,264
¥1,382 ¥783 $6,979
The components of plan assets for the years ended March 31, 2016 and 2017 are as follows:
Research and development expenses:10
Impairment losses on fixed assets:11

TOYO SUISAN ANNUAL REPORT 2017 25
The main components of deferred tax assets and liabilities as of March 31, 2016 and 2017 are as follows:
The income taxes applicable to the Company and its domestic consolidated subsidiaries include (1) corporation taxes, (2) enterprise taxes
(excluding the elements based on added value and capital) and (3) inhabitants’ taxes which, in the aggregate, resulted in the statutory tax rate
of approximately 33.1% and 30.9% for the years ended March 31, 2016 and 2017, respectively.
Millions of yenThousands of
U.S. dollars
2016 2017 2017
Deferred tax assets:
Liability for retirement benefits ¥ 5,626 ¥ 5,775 $ 51,475
Impairment losses on fixed assets 1,788 2,039 18,175
Tax loss carryforwards 1,412 1,295 11,543
Accrued bonuses 785 793 7,068
Loss on write-down of investments in unconsolidated subsidiaries and affiliates 533 665 5,927
Write-down of investment securities 322 264 2,353
Other 2,440 2,753 24,539
Gross deferred tax assets 12,906 13,584 121,080
Less: valuation allowance (4,476) (3,950) (35,208)
Total deferred tax assets 8,430 9,634 85,872
Deferred tax liabilities:
Net unrealized gain on investment securities (3,325) (3,741) (33,345)
Special reserves for deferred gains on fixed assets (3,316) (3,599) (32,080)
Depreciation of overseas consolidated subsidiaries (2,087) (1,985) (17,693)
Reserve for special depreciation (563) (388) (3,458)
Valuation differences of subsidiaries’ assets in consolidation (116) (116) (1,034)
Other (284) (535) (4,769)
Total deferred tax liabilities (9,691) (10,364) (92,379)
Net deferred tax liabilities ¥(1,261) ¥ (730) $ (6,507)
The main differences between the statutory tax rate and the effective tax rate for the years ended March 31, 2016 and 2017 are not disclosed
because the total differences are less than 5% of the statutory tax rates.
Under the Japanese Corporate law (“the law”), the entire amount paid for new shares is required to be designated as common stock. However,
a company may, by a resolution of the Board of Directors, designate an amount not exceeding one-half of the price of new shares as additional
paid-in capital, which is included in capital surplus.
The law requires that an amount equal to 10% of dividends must be appropriated as a legal earnings reserve (a component of retained
earnings) or as additional paid-in capital (a component of capital surplus), depending on the equity account charged upon payment of such
dividends, until the aggregate amount of the legal earnings reserve and additional paid-in capital equals 25% of common stock.
All additional paid-in-capital and legal earnings reserve may be transferred to other capital surplus and retained earnings, respectively, which
are potentially available for dividends upon resolution of the shareholders.
The maximum amount that the company can distribute as dividends is calculated based on the non-consolidated financial statements of the
Company in accordance with Japanese laws and regulations.
At the annual shareholders’ meeting held on June 29, 2017, the shareholders approved cash dividends amounting to ¥3,065 million ($27,320
thousand). These cash dividends have not been accrued in the consolidated financial statements as of March 31, 2017 because such
appropriations are recognized in the period in which they are approved by the shareholders.
Income taxes:12
Net assets:13

TOYO SUISAN ANNUAL REPORT 201726
Thousands of shares
Common stock outstanding 2016 2017
Balance at the beginning and end of the year 110,881 110,881
(1) Type and number of shares issued and outstanding for the years ended March 31, 2016 and 2017
(2) Dividends(a) Dividends paid in the current fiscal year
The Company resolved approval at the general meeting of shareholders held on June 29, 2016 as follows:
Dividends on Common stock
a. Total amount of dividends ……………… ¥3,065 million
b. Dividends per share ……………………… ¥30.0
c. Record date ……………………………… March 31, 2016
d. Effective date ……………………………… June 30, 2016
The Company resolved approval by the board of directors meeting held on October 31, 2016 as follows:
a. Total amount of dividends ……………… ¥3,065 million
b. Dividends per share ……………………… ¥30.0
c. Record date ……………………………… September 30, 2016
d. Effective date ……………………………… December 5, 2016
(b) Dividends with record date during the current fiscal year but to be effective in the following fiscal year
The Company resolved approval at the general meeting of shareholders held on June 29, 2017 as follows:
Dividends on Common stock
a. Total amount of dividends ……………… ¥3,065 million
……………………………………………… ($27,320 thousand)
b. Funds for dividends ……………………… Retained earnings
c. Dividends per share ……………………… ¥30.0
……………………………………………… ($0.27)
d. Record date ……………………………… March 31, 2017
e. Effective date ……………………………… June 30, 2017
Thousands of shares
Treasury stock outstanding 2016 2017
Balance at beginning of the year 8,751 8,751
Increase due to purchase of odd stock 0 1
Increase due to change in equity in an affiliate accounted for using the equity method
0 0
Balance at end of the year 8,751 8,752
Millions of yenThousands of
U.S. dollars
2016 2017 2017
Net income attributable to owners of parent ¥18,364 ¥ 20,837 $185,730
Net income attributable to owners of parent related to common stock 18,364 20,837 185,730
Weighted-average amount of common stock (unit: thousands of shares) 102,130 102,130
The basis of the calculation of per share data is as follows:
Notes to the consolidated statement of changes in net assets:14
Per share information:15
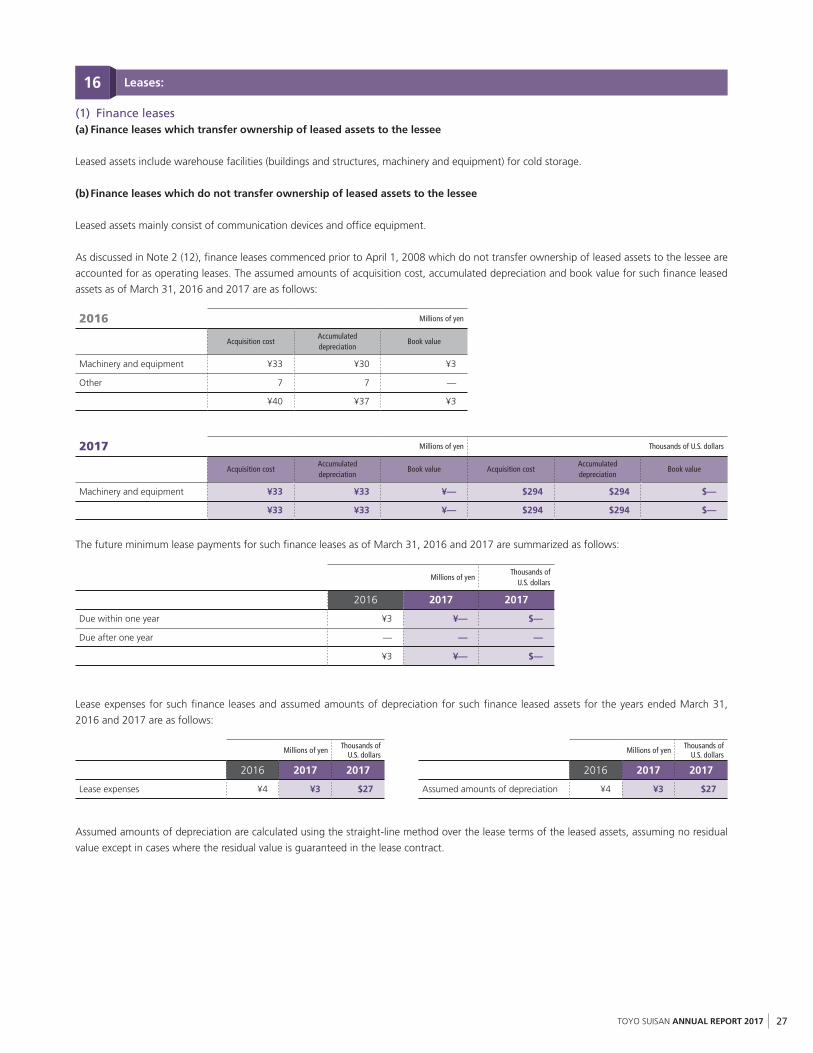
TOYO SUISAN ANNUAL REPORT 2017 27
(1) Finance leases(a) Finance leases which transfer ownership of leased assets to the lessee
Leased assets include warehouse facilities (buildings and structures, machinery and equipment) for cold storage.
(b) Finance leases which do not transfer ownership of leased assets to the lessee
Leased assets mainly consist of communication devices and office equipment.
As discussed in Note 2 (12), finance leases commenced prior to April 1, 2008 which do not transfer ownership of leased assets to the lessee are
accounted for as operating leases. The assumed amounts of acquisition cost, accumulated depreciation and book value for such finance leased
assets as of March 31, 2016 and 2017 are as follows:
Millions of yenThousands of
U.S. dollars
2016 2017 2017
Due within one year ¥3 ¥— $—
Due after one year — — —
¥3 ¥— $—
2016 Millions of yen
Acquisition costAccumulated depreciation
Book value
Machinery and equipment ¥33 ¥30 ¥3
Other 7 7 —
¥40 ¥37 ¥3
2017 Millions of yen Thousands of U.S. dollars
Acquisition costAccumulated depreciation
Book value Acquisition costAccumulated depreciation
Book value
Machinery and equipment ¥33 ¥33 ¥— $294 $294 $—
¥33 ¥33 ¥— $294 $294 $—
The future minimum lease payments for such finance leases as of March 31, 2016 and 2017 are summarized as follows:
Leases:16
Millions of yen Thousands of U.S. dollars
2016 2017 2017
Lease expenses ¥4 ¥3 $27
Millions of yen Thousands of U.S. dollars
2016 2017 2017
Assumed amounts of depreciation ¥4 ¥3 $27
Lease expenses for such finance leases and assumed amounts of depreciation for such finance leased assets for the years ended March 31,
2016 and 2017 are as follows:
Assumed amounts of depreciation are calculated using the straight-line method over the lease terms of the leased assets, assuming no residual
value except in cases where the residual value is guaranteed in the lease contract.

TOYO SUISAN ANNUAL REPORT 201728
Millions of yen Thousands of U.S. dollars
2016 2017 2017
Due within one year ¥ 58 ¥ 68 $ 606
Due after one year 349 388 3,459
¥407 ¥456 $4,065
(1) Reclassification adjustments on other comprehensive income for the years ended March 31, 2016 and 2017 are as follows:
Contingent liabilities as of March 31, 2016 and 2017 are as follows:
(2) Operating leasesThe minimum commitments under non-cancelable operating leases as of March 31, 2016 and 2017 are as follows:
Millions of yen Thousands of U.S. dollars
2016 2017 2017
Guarantees for indebtedness of employees ¥40 ¥25 $223
Millions of yenThousands of
U.S. dollars
2016 2017 2017
Net unrealized gain on investment securities:Losses arising during the year
¥ 885 ¥1,500 $13,370
Reclassification adjustments (147) (6) (53)
738 1,494 13,317
Net unrealized gain (loss) on hedging instruments:Gains (losses) arising during the year
(89) 58 517
(89) 58 517
Foreign currency translation adjustments:Adjustments arising during the year
(5,000) (591) (5,268)
(5,000) (591) (5,268)
Adjustments for retirement benefits:Adjustments arising during the year
(4,235) (36) (321)
Reclassification adjustments 229 449 4,002
(4,006) 413 3,681
Share of other comprehensive income of affiliate accounted for using the equity method:Gains (losses) arising during the year
(13) 19 170
(13) 19 170
Amount before income tax effects (8,370) 1,393 12,417
Income tax effects 1,168 (544) (4,849)
Total other comprehensive income, net of taxes ¥(7,202) ¥ 849 $ 7,568
Contingent liabilities:17
Comprehensive income:18

TOYO SUISAN ANNUAL REPORT 2017 29
(1) General information about reportable segmentsReportable segments of the Company are the business units for which separate financial information is available, which are reviewed regularly
at the Board of Directors’ meeting in order to determine distribution of management resources and evaluate business performance.
The Company and its consolidated subsidiaries have business units based on the type of products and services, and each business
headquarters plans a comprehensive strategy and engages in business activities relating to the products and services. “Overseas Instant
Noodles” business headquarters is composed of overseas subsidiaries that plan a comprehensive strategy and engage in business activities
relating to the products and services.
Accordingly, the Company and its consolidated subsidiaries consist of segments classified by product and region based on business units and
overseas subsidiaries. The Company has six reportable segments; “Seafood”, “Overseas Instant Noodles”, “Domestic Instant Noodles”, “Frozen
and Refrigerated Foods”, “Processed Foods”, and “Cold-Storage”.
“Seafood” processes and sells seafood. “Overseas Instant Noodles” manufactures and sells instant noodles overseas. “Domestic Instant
Noodles” manufactures and sells instant noodles in Japan. “Frozen and Refrigerated Foods” manufactures and sells frozen and chilled foods.
“Processed Foods” manufactures and sells processed foods (excluding instant noodles, frozen and chilled foods). “Cold-Storage” freezes and
stores food in cold warehouses.
(2) Basis of measurement of reportable segment net sales, income or loss and other material itemsAccounting policies for the reportable segment information are substantially the same as those described in note “2. Summary of significant
accounting policies”. Income or loss by reportable segment is based on operating income on the consolidated statements of income.
(Adoption of Practical Solution on a Change in Depreciation Method due to Tax Reform 2016)
As described in changes in accounting policies, due to amendments to the Japanese Corporation Tax Act, the Company and its domestic
subsidiaries changed the depreciation method for facilities attached to buildings and structures, which were acquired since April 1, 2016, from
the declining balance method to the straight line method. The Company and its domestic subsidiaries also changed the depreciation method in
operating segments in the same manner. The effect of this change on segment incomes is immaterial.
(2) Income tax effects on other comprehensive income for the years ended March 31, 2016 and 2017 are as follows:
Millions of yenThousands of
U.S. dollars
2016 2017 2017
Net unrealized gain on investment securities:Amount before income tax effects
¥ 738 ¥1,494 $13,317
Income tax effects (74) (416) (3,708)
Amount, net of taxes 664 1,078 9,609
Net unrealized gain (loss) on hedging instruments:Amount before income tax effects
(89) 58 517
Income tax effects 25 (16) (143)
Amount, net of taxes (64) 42 374
Foreign currency translation adjustments:Amount before income tax effects
(5,000) (591) (5,268)
Income tax effects — — —
Amount, net of taxes (5,000) (591) (5,268)
Adjustments for retirement benefits:Amount before income tax effects
(4,006) 413 3,681
Income tax effects 1,217 (112) (998)
Amount, net of taxes (2,789) 301 2,683
Share of other comprehensive income of affiliate accounted for using the equity method:Amount before income tax effects
(13) 19 170
Income tax effects — — —
Amount, net of taxes (13) 19 170
Total other comprehensive incomeAmount before income tax effects
(8,370) 1,393 12,417
Income tax effects 1,168 (544) (4,849)
Amount, net of taxes ¥(7,202) ¥ 849 $ 7,568
Segment information:19

TOYO SUISAN ANNUAL REPORT 201730
2016 Millions of yen
Reportable segment
Other Total Adjustments ConsolidatedSeafood
Overseas Instant Noodles
Domestic Instant Noodles
Frozen and Refrigerated
FoodsProcessed
Foods Cold-Storage Total
Net sales:Outside customers ¥33,076 ¥77,346 ¥123,874 ¥67,972 ¥19,782 ¥16,206 ¥338,256 ¥44,979 ¥383,235 ¥ 42 ¥383,277
Intersegment 902 — 12 — 0 928 1,842 488 2,330 (2,330) —
Total ¥33,978 ¥77,346 ¥123,886 ¥67,972 ¥19,782 ¥17,134 ¥340,098 ¥45,467 ¥385,565 ¥(2,288) ¥383,277
Segment income (loss) ¥ (171) ¥12,143 ¥ 10,011 ¥ 3,853 ¥ 883 ¥ 1,655 ¥ 28,374 ¥ 372 ¥ 28,746 ¥ (432) ¥ 28,314
Segment assets ¥14,703 ¥88,886 ¥ 57,705 ¥22,391 ¥ 8,311 ¥32,716 ¥224,712 ¥25,035 ¥249,747 ¥95,650 ¥345,397
Other items:Depreciation and
amortization¥ 317 ¥ 2,293 ¥ 3,085 ¥ 1,433 ¥ 243 ¥ 1,975 ¥ 9,346 ¥ 1,409 ¥ 10,755 ¥ 471 ¥ 11,226
Increase in property, plant and equipment and intangible assets
160 876 9,549 529 337 4,800 16,251 2,016 18,267 819 19,086
2017 Millions of yen
Reportable segment
Other Total Adjustments ConsolidatedSeafood
Overseas Instant Noodles
Domestic Instant Noodles
Frozen and Refrigerated
FoodsProcessed
Foods Cold-Storage Total
Net sales:Outside customers ¥31,414 ¥73,036 ¥126,069 ¥67,525 ¥21,498 ¥16,875 ¥336,417 ¥46,262 ¥382,679 ¥ — ¥382,679
Intersegment 1,010 — — — — 853 1,863 424 2,287 (2,287) —
Total ¥32,424 ¥73,036 ¥126,069 ¥67,525 ¥21,498 ¥17,728 ¥338,280 ¥46,686 ¥384,966 ¥(2,287) ¥382,679
Segment income ¥ 191 ¥11,810 ¥ 10,048 ¥ 4,943 ¥ 729 ¥ 1,688 ¥ 29,409 ¥ 1,059 ¥ 30,468 ¥ (982) ¥ 29,486
Segment assets ¥16,618 ¥93,711 ¥ 67,827 ¥21,641 ¥ 7,705 ¥34,077 ¥241,579 ¥21,519 ¥263,098 ¥97,977 ¥361,075
Other items:Depreciation and
amortization¥ 190 ¥ 2,362 ¥ 3,763 ¥ 1,343 ¥ 335 ¥ 2,197 ¥ 10,190 ¥ 1,215 ¥ 11,405 ¥ 542 ¥ 11,947
Increase in property, plant and equipment and intangible assets
126 1,626 12,137 504 327 3,821 18,541 543 19,084 715 19,799
2017 Thousands of U.S. dollars
Reportable segment
Other Total Adjustments ConsolidatedSeafood
Overseas Instant Noodles
Domestic Instant Noodles
Frozen and Refrigerated
FoodsProcessed
Foods Cold-Storage Total
Net sales:Outside customers $280,007 $651,003 $1,123,710 $601,881 $191,621 $150,414 $2,998,636 $412,354 $3,410,990 $ — $3,410,990
Intersegment 9,003 — — — — 7,603 16,606 3,779 20,385 (20,385) —
Total $289,010 $651,003 $1,123,710 $601,881 $191,621 $158,017 $3,015,242 $416,133 $3,431,375 $(20,385) $3,410,990
Segment income $ 1,703 $105,268 $ 89,562 $ 44,059 $ 6,498 $ 15,046 $ 262,136 $ 9,439 $ 271,575 $ (8,753) $ 262,822
Segment assets $148,124 $835,288 $ 604,573 $192,896 $ 68,678 $303,744 $2,153,303 $191,808 $2,345,111 $873,313 $3,218,424
Other items:Depreciation and
amortization$ 1,693 $ 21,054 $ 33,541 $ 11,971 $ 2,986 $ 19,583 $ 90,828 $ 10,830 $ 101,658 $ 4,831 $ 106,489
Increase in property, plant and equipment and intangible assets
1,123 14,493 108,183 4,492 2,915 34,058 165,264 4,840 170,104 6,373 176,477
(3) Information on reportable segment net sales, income or loss and other material items

TOYO SUISAN ANNUAL REPORT 2017 31
Notes:
(a) “Other” incorporates operations not included in reportable segments, mainly packed lunches/deli foods.
(b) The details of “Adjustments” are as follows:
1) The adjustment of ¥42 million in net sales for the year ended March 31, 2016 was due to differences in elimination methods used for the
reportable segment information and the consolidated financial statements.
2) The adjustment of ¥(432) million and ¥(982) million ($(8,753) thousand) in segment income (loss) for the years ended March 31, 2016
and 2017 include corporate expenses of ¥(1,035) million and ¥(1,224) million ($(10,910) thousand), respectively, which cannot be
allocated to each reportable segment. The corporate expenses are mainly general and administrative expenses which are not attributable
to any reportable segment. Other adjustments are mainly foreign currency translation adjustments resulting from elimination of know-
how payments or other transactions from overseas subsidiaries for the years ended March 31, 2016 and 2017.
3) The adjustment of ¥95,650 million and ¥97,977 million ($873,313 thousand) in segment assets as of March 31, 2016 and 2017 include
corporate assets of ¥95,344 million and ¥97,933 million ($872,921 thousand), respectively, which cannot be allocated to each reportable
segment. Corporate assets are mainly long-term investments (investments in securities) of the Company and assets of administrative
departments. Other adjustments are mainly due to application of the equity method.
4) The adjustments of ¥471 million and ¥542 million ($4,831 thousand) in depreciation and amortization for the years ended March 31,
2016 and 2017 include corporate expenses of ¥367 million and ¥515 million ($4,590 thousand), respectively.
5) The adjustments of ¥819 million and ¥715 million ($6,373 thousand) in increase in property, plant, and equipment and intangible assets
for the years ended March 31, 2016 and 2017, respectively, are corporate assets which cannot be allocated to each reportable segment.
(c) Segment income (loss) is reconciled with operating income on the consolidated statements of income.
(4) Information by geographic area(a) Net sales
Note:
1) Net sales are classified by countries or regions based on location of customers.
2) The major countries or regions in each classification are as follows:
Americas ………………… U.S.A., Mexico
Others …………………… China, Taiwan, Korea
(b) Property, plant and equipment
2016 Millions of yen
Japan Americas Other Consolidated
Net sales ¥305,338 ¥77,358 ¥581 ¥383,277
2016 Millions of yen
Japan Americas Consolidated
Property, plant and equipment ¥99,463 ¥25,478 ¥124,941
2017 Millions of yen
Japan Americas Other Consolidated
Net sales ¥309,187 ¥73,066 ¥426 ¥382,679
2017 Millions of yen
Japan Americas Consolidated
Property, plant and equipment ¥104,813 ¥24,543 ¥129,356
2017 Thousands of U.S. dollars
Japan Americas Other Consolidated
Net sales $2,755,923 $651,270 $3,797 $3,410,990

TOYO SUISAN ANNUAL REPORT 201732
2017 Thousands of U.S. dollars
Japan Americas Consolidated
Property, plant and equipment $934,245 $218,763 $1,153,008
(5) Information about major customers
(6) Information about impairment loss on fixed assets
(7) Information about amortization and unamortized balance of goodwill and negative goodwill by reportable segment
There was no amortization nor unamortized balances of goodwill and negative goodwill as of and for the years ended March 31, 2016 and
2017.
Sales
2016 Millions of yen
Name of major customer Related reportable segment
MITSUI & CO., LTD. ¥99,099 Domestic Instant Noodles Segment
Sales
2017 Millions of yenThousands of
U.S. dollars
Name of major customer Related reportable segment
MITSUI & CO., LTD. ¥96,620 $861,218 Domestic Instant Noodles Segment
2016 Millions of yen
Reportable segment
Other Adjustments ConsolidatedSeafood
Overseas Instant Noodles
Domestic Instant Noodles
Frozen and Refrigerated
FoodsProcessed
Foods Cold-Storage
Impairment loss ¥678 ¥— ¥— ¥2 ¥15 ¥284 ¥403 ¥— ¥1,382
2017 Millions of yen
Reportable segment
Other Adjustments ConsolidatedSeafood
Overseas Instant Noodles
Domestic Instant Noodles
Frozen and Refrigerated
FoodsProcessed
Foods Cold-Storage
Impairment loss ¥— ¥— ¥145 ¥616 ¥10 ¥— ¥12 ¥— ¥783
2017 Thousands of U.S. dollars
Reportable segment
Other Adjustments ConsolidatedSeafood
Overseas Instant Noodles
Domestic Instant Noodles
Frozen and Refrigerated
FoodsProcessed
Foods Cold-Storage
Impairment loss $— $— $1,292 $5,491 $89 $— $107 $— $6,979

TOYO SUISAN ANNUAL REPORT 2017 33
Millions of yen Thousands of U.S. dollars
Cash dividends (¥30.0 per share) ¥3,065 $27,320
The Company’s shareholders approved appropriation of retained earnings at the general meeting of shareholders held on June 29, 2017 as
follows:
Subsequent events:20
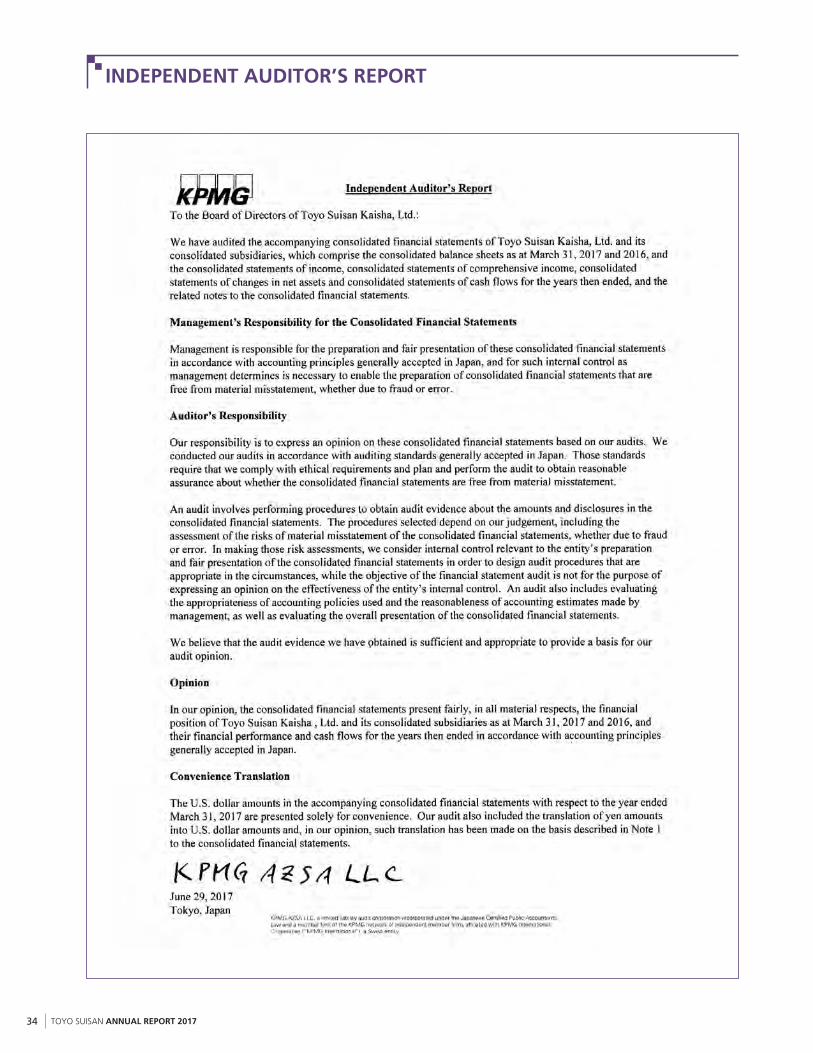
TOYO SUISAN ANNUAL REPORT 201734
INDEPENDENT AUDITOR’S REPORT
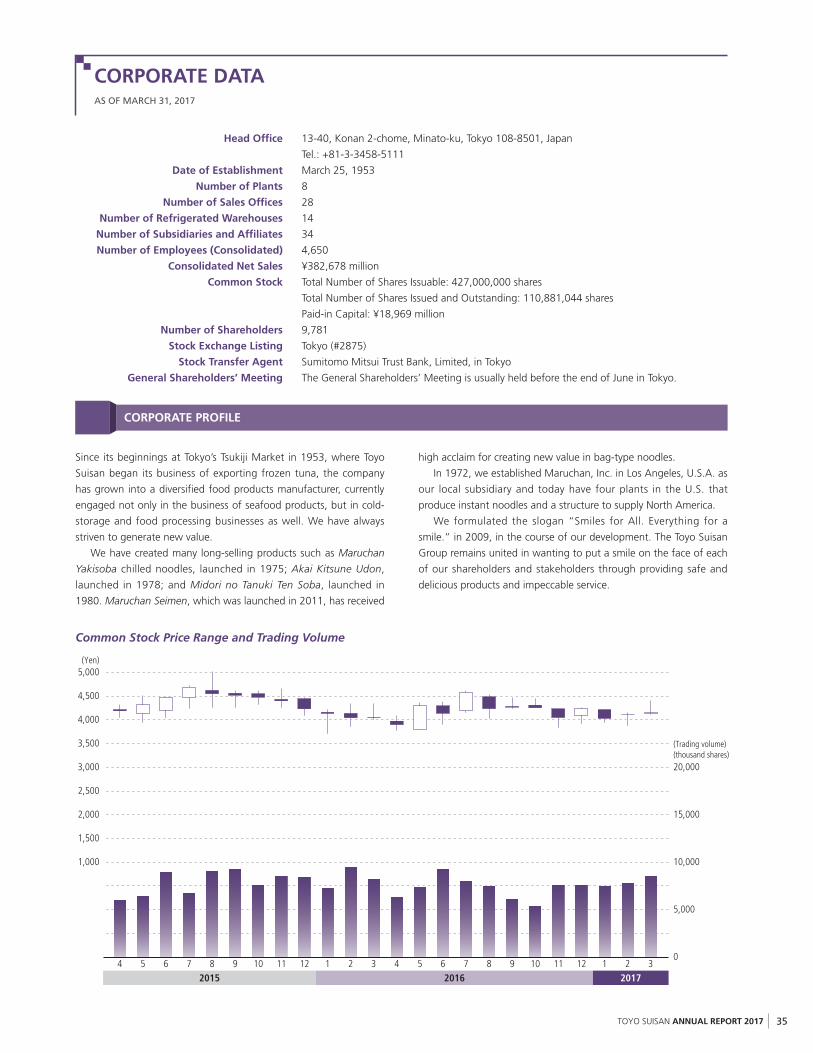
TOYO SUISAN ANNUAL REPORT 2017 35
Head Office 13-40, Konan 2-chome, Minato-ku, Tokyo 108-8501, Japan
Tel.: +81-3-3458-5111
Date of Establishment March 25, 1953
Number of Plants 8
Number of Sales Offices 28
Number of Refrigerated Warehouses 14
Number of Subsidiaries and Affiliates 34
Number of Employees (Consolidated) 4,650
Consolidated Net Sales ¥382,678 million
Common Stock Total Number of Shares Issuable: 427,000,000 shares
Total Number of Shares Issued and Outstanding: 110,881,044 shares
Paid-in Capital: ¥18,969 million
Number of Shareholders 9,781
Stock Exchange Listing Tokyo (#2875)
Stock Transfer Agent Sumitomo Mitsui Trust Bank, Limited, in Tokyo
General Shareholders’ Meeting The General Shareholders’ Meeting is usually held before the end of June in Tokyo.
Common Stock Price Range and Trading Volume
Since its beginnings at Tokyo’s Tsukiji Market in 1953, where Toyo
Suisan began its business of exporting frozen tuna, the company
has grown into a diversified food products manufacturer, currently
engaged not only in the business of seafood products, but in cold-
storage and food processing businesses as well. We have always
striven to generate new value.
We have created many long-selling products such as Maruchan
Yakisoba chilled noodles, launched in 1975; Akai Kitsune Udon,
launched in 1978; and Midori no Tanuki Ten Soba, launched in
1980. Maruchan Seimen, which was launched in 2011, has received
high acclaim for creating new value in bag-type noodles.
In 1972, we established Maruchan, Inc. in Los Angeles, U.S.A. as
our local subsidiary and today have four plants in the U.S. that
produce instant noodles and a structure to supply North America.
We formulated the slogan “Smiles for All. Everything for a
smile.” in 2009, in the course of our development. The Toyo Suisan
Group remains united in wanting to put a smile on the face of each
of our shareholders and stakeholders through providing safe and
delicious products and impeccable service.
(Trading volume)(thousand shares)
20,000
10,000
5,000
0
15,000
(Yen)
2,000
1,500
4,000
3,500
5,000
4,500
3,000
2,500
1,000
42015 2016 2017
5 6 7 8 9 10 11 12 1 2 3 4 5 6 8 9 10 11 12 1 2 37
CORPORATE PROFILE
CORPORATE DATAAS OF MARCH 31, 2017

ANNUAL REPORT2017YEAR ENDED MARCH 31, 2017