A value based method for measuring performance on … · those of public safety and criminal...
19
Gest. Prod., São Carlos, v. 24, n. 3, p. 538-556, 2017 http://dx.doi.org/10.1590/0104-530X2137-16 Resumo: Este artigo apresenta um método para medição de desempenho com base no valor que o serviço público de Perícia Criminal deve entregar, visando gerenciar e melhorar a operação do serviço. Esse serviço é o órgão do sistema de segurança pública e justiça criminal responsável no Brasil pela produção da prova material. Utiliza conhecimento científico e tecnologia e está intimamente ligado à promoção dos direitos humanos. O método foi desenvolvido e avaliado utilizando-se a metodologia Design Science Research, mostrando-se viável, haja vista que retorna respostas sobre o desempenho de forma simples e rápida para os gestores do serviço. O método proposto pode ser utilizado pelos gestores, para avaliar se a operação está entregando valor aos clientes e para direcionar ações de melhoria, e por agentes políticos, para formulação de políticas públicas de segurança, justiça e direitos humanos. Palavras-chave: Medição de valor; Medição de desempenho; Perícia Criminal. Abstract: This paper presents a method for measuring performance based on the value that Forensic Science Service must deliver to its main clients, in order to achieve a better management and improve its operation performance. The Forensic Science Service is the agency in charge of producing the material evidence at the public safety and criminal justice system, applying scientific knowledge and technology. It´s embedded with human rights promotion. The method was developed and evaluated using Design Science Research methodology and it was viable, once it gives a quick and simple response to service managers. The method might be used by managers to assess if the operation is delivering value to its clients, as well by politicians to make public policies on public safety, criminal justice and human rights. Keywords: Value measurement; Performance measurement; Forensic Science. A value based method for measuring performance on Forensic Science service Um método para medição de desempenho do serviço público de Perícia Criminal com base no valor Claudio Vilela Rodrigues 1,2 José Carlos de Toledo 3 1 Posto de Perícia Integrada – SPTC, Polícia Civil de Minas Gerais – PCMG, Av. Deputado Renato Azeredo, 1342, CEP 37410-000, Três Corações, MG, Brazil, e-mail: [email protected] 2 Faculdade Cenecista de Varginha, Rua Professor Felipe Tiago Gomes, 173, Vila Bueno, CEP 37006-020, Varginha, MG, Brazil 3 Departamento de Engenharia de Produção, Universidade Federal de São Carlos – UFSCar, Rod. Washington Luiz, Km 235, SP-310, CEP 13565-905, São Carlos, SP, Brazil, e-mail: [email protected] Received Dec. 04, 2015 - Accepted Apr. 09, 2016 Financial support: None. 1 Introduction Among the challenges of the Brazilian public sector is to improve its efficiency and at the same time the quality of services provided to society. As funders of public services, citizens aspire to good services as a return to taxes collected. Among the services that afflict the daily lives of citizens and has challenged several governments are those of public safety and criminal justice system. In this context, the agencies that integrate these systems need to adapt to the institutional changes in the country in order to improve the quality of services provided to society without increasing its costs. At the same time, production engineering should also expand its scope to service operations, including public services, otherwise it will be restricted to a ‘ghetto’, the manufacturing (Jesus & Costa, 2014; Slack, 2005; Starr, 2005; Cauliraux & Yuki, 2004). In Brazil, there are examples of publications that demonstrate the application of knowledge of production engineering in public safety, given the concern with operations efficiency, efficacy and effectiveness (Programa das Nações Unidas para o Desenvolvimento (PNUD) & Secretaria Nacional de Segurança Pública (Brasil, 2004; Cauliraux et al., 2004).
Transcript of A value based method for measuring performance on … · those of public safety and criminal...

Gest. Prod., São Carlos, v. 24, n. 3, p. 538-556, 2017http://dx.doi.org/10.1590/0104-530X2137-16
Resumo: Este artigo apresenta um método para medição de desempenho com base no valor que o serviço público de Perícia Criminal deve entregar, visando gerenciar e melhorar a operação do serviço. Esse serviço é o órgão do sistema de segurança pública e justiça criminal responsável no Brasil pela produção da prova material. Utiliza conhecimento científico e tecnologia e está intimamente ligado à promoção dos direitos humanos. O método foi desenvolvido e avaliado utilizando-se a metodologia Design Science Research, mostrando-se viável, haja vista que retorna respostas sobre o desempenho de forma simples e rápida para os gestores do serviço. O método proposto pode ser utilizado pelos gestores, para avaliar se a operação está entregando valor aos clientes e para direcionar ações de melhoria, e por agentes políticos, para formulação de políticas públicas de segurança, justiça e direitos humanos.Palavras-chave: Medição de valor; Medição de desempenho; Perícia Criminal.
Abstract: This paper presents a method for measuring performance based on the value that Forensic Science Service must deliver to its main clients, in order to achieve a better management and improve its operation performance. The Forensic Science Service is the agency in charge of producing the material evidence at the public safety and criminal justice system, applying scientific knowledge and technology. It´s embedded with human rights promotion. The method was developed and evaluated using Design Science Research methodology and it was viable, once it gives a quick and simple response to service managers. The method might be used by managers to assess if the operation is delivering value to its clients, as well by politicians to make public policies on public safety, criminal justice and human rights.Keywords: Value measurement; Performance measurement; Forensic Science.
A value based method for measuring performance on Forensic Science service
Um método para medição de desempenho do serviço público de Perícia Criminal com base no valor
Claudio Vilela Rodrigues1,2
José Carlos de Toledo3
1 Posto de Perícia Integrada – SPTC, Polícia Civil de Minas Gerais – PCMG, Av. Deputado Renato Azeredo, 1342, CEP 37410-000, Três Corações, MG, Brazil, e-mail: [email protected]
2 Faculdade Cenecista de Varginha, Rua Professor Felipe Tiago Gomes, 173, Vila Bueno, CEP 37006-020, Varginha, MG, Brazil3 Departamento de Engenharia de Produção, Universidade Federal de São Carlos – UFSCar, Rod. Washington Luiz, Km 235, SP-310,
CEP 13565-905, São Carlos, SP, Brazil, e-mail: [email protected] Dec. 04, 2015 - Accepted Apr. 09, 2016Financial support: None.
1 IntroductionAmong the challenges of the Brazilian public sector
is to improve its efficiency and at the same time the quality of services provided to society. As funders of public services, citizens aspire to good services as a return to taxes collected.
Among the services that afflict the daily lives of citizens and has challenged several governments are those of public safety and criminal justice system. In this context, the agencies that integrate these systems need to adapt to the institutional changes in the country in order to improve the quality of services provided to society without increasing its costs.
At the same time, production engineering should also expand its scope to service operations, including public services, otherwise it will be restricted to a ‘ghetto’, the manufacturing (Jesus & Costa, 2014; Slack, 2005; Starr, 2005; Cauliraux & Yuki, 2004). In Brazil, there are examples of publications that demonstrate the application of knowledge of production engineering in public safety, given the concern with operations efficiency, efficacy and effectiveness (Programa das Nações Unidas para o Desenvolvimento (PNUD) & Secretaria Nacional de Segurança Pública (Brasil, 2004; Cauliraux et al., 2004).
A value based method for measuring performance... 539
In the production chain of public safety and criminal justice services, one of the services that have a relevant role to play in criminal investigation and prosecution of crimes is Forensic Science. This service is responsible for applying Science to criminal investigation, with a decisive role in the resolution of crimes and the promotion of human rights.
However, despite the relevance of the service, one of the gaps of Forensic Science operations is the measurement of performance (Figueiredo & Pareschi, 2012; King & Maguire, 2009). From this observation, it is set as a research problem: how to measure and evaluate the performance of Forensic Science operations based on the value that the service must deliver?
Thus, the objective of this paper is to develop a method to measure and evaluate the Forensic Science Public Service performance based on the value to be delivered to its clients and for the use of managers and practitioners of Forensic Science agencies. The specific objectives are: (i) identify indicators that measure the performance of the operation; (ii) develop a method that measures the value that the service is delivering to its customers; (iii) to develop indicators that assist the Forensic Science agencies managers in the management of their operations and promote the necessary strategic alignment, as well as the politicians in the decision making on the allocation of resources and the formulation of public policies for the service.
In order to reach the proposed objective, the methodology Design Science Research (DSR) was used, which is appropriate to develop prescriptive methods for management (Dresch et al., 2015; Lacerda et al., 2013; Van Aken & Romme, 2009; Van Aken, 2004, 2005) which is compatible with the scope of academic performance and practice of production engineering and operations management (Dresch et al., 2015; Lacerda et al., 2013; Dresch, 2013).
The research is justified because there are 28 Forensic Science agencies in Brazil (26 States, Federal District and Union), of which 16 are autonomous agencies and others are still within the structure of the Bureaus of Investigation Police. The service presents managerial complexity and fragility in the management of its activities (Figueiredo & Pareschi, 2012; Koppl, 2005; Brasil, 2003). One of these weaknesses is the lack of systematized and consistent data and indicators (Figueiredo & Pareschi, 2012). King & Maguire (2009) emphasize that Forensic Science agencies play a vital and noble role in society and should measure the effectiveness of these organizations.
The paper presents, in addition to this introduction, the literature review, research method, artifact development, evaluation, discussion and conclusion, according to Gregor & Hevner (2013) structure for scientific papers, whose research method is DSR.
2 Literature reviewOperations management need some kind of
performance measurement in order to better manage the operation (Bourne et al., 2002; Pidd, 2007) and evaluate the value that is being delivered to customers (Neely, 1999). Even public organizations, whose mission and jurisdiction have already been defined in the legislation that created them, should be measured and evaluated (Behn, 2003). However, performance measurement in the public sector is complex because of the political interests involved and the number of stakeholders (Pidd, 2012), sometimes with conflicting interests (Johnston & Clark, 2005). The main reasons for measuring performance in public organizations are: (i) planning and improvement; (ii) monitoring and control; (iii) benchmarking; (iv) communication and accountability; (v) budgeting; and (vi) individual performance management (Pidd, 2012).
Performance Measurement System (PMS) is “[...] an articulated set of performance indicators that allows management to be conducted by monitoring and taking management actions [...]” (Paim et al., 2009, p. 72). The term “performance indicator” means “[...] the smallest element of a performance measurement system [...]” (Toledo et al., 2013, p. 351), which may be objective or subjective. Thus, it is sought to define Key Performance Indicators (KPIs) that are important to the organization and its mission (Pidd, 2012). The KPIs can be defined by unfolding the critical-to-quality (CTQ) of the operation (Lokkerbol et al., 2012), and/or based on the modeling of the operation processes (Paim et al., 2009).
It is relevant to distinguish between outputs, which are the products and/or services produced, quantifiable in a short term (Behn, 2003), and outcomes, which are the “ultimate impacts on the user” (Caulliraux & Yamashita, 2004, p. 56), or “[...] the consequences on the activities of the service client [...]” (Zarifian, 2001, p. 119). Poister (2003) recommends the use of both measures, which, according to Pidd (2012), should be interconnected.
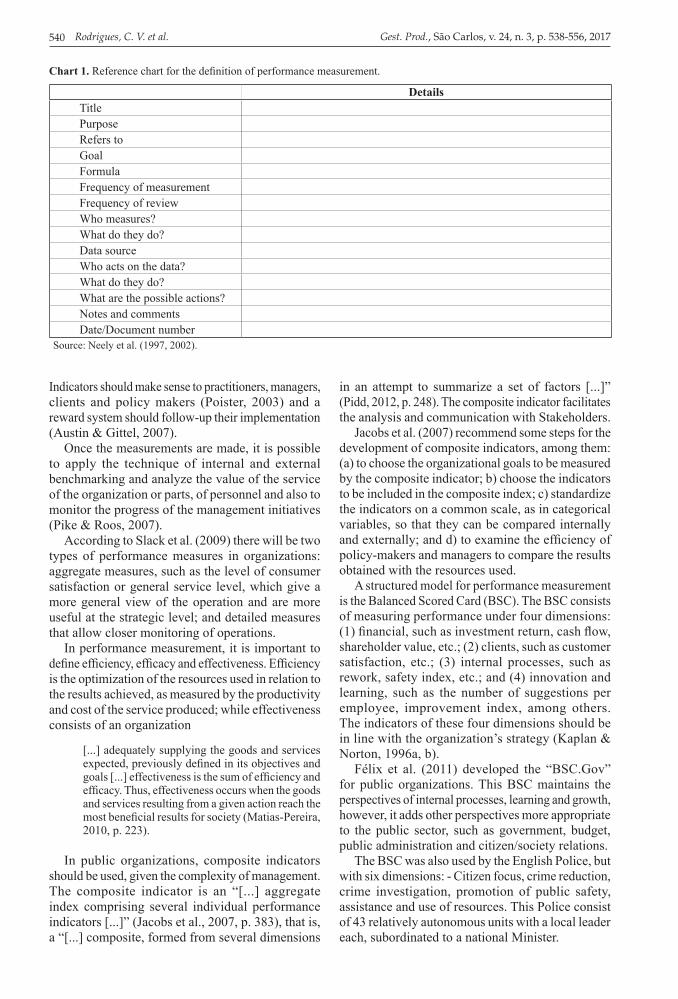
Neely et al. (1997, 2002) developed a “Performance Measure Record Sheet” (Chart 1) to assist managers in the development project of performance measures. Therefore, for each metric, there is a self-explanatory title; a purpose, justifying the measure; to which the measure refers in relation to the purpose of the operation; the definition of the goal; the metric calculation formula; frequency of measurement and review; who measures; the data sources; who is responsible for managing the process from which the metric derives and who acts on the respective data; what the metric makes possible; Comments; and registration date.
Neely et al. (2000) emphasize the need for discussions with managers and practitioners to obtain new insights that improve the measurement method.
Rodrigues, C. V. et al.540 Gest. Prod., São Carlos, v. 24, n. 3, p. 538-556, 2017
Indicators should make sense to practitioners, managers, clients and policy makers (Poister, 2003) and a reward system should follow-up their implementation (Austin & Gittel, 2007).
Once the measurements are made, it is possible to apply the technique of internal and external benchmarking and analyze the value of the service of the organization or parts, of personnel and also to monitor the progress of the management initiatives (Pike & Roos, 2007).
According to Slack et al. (2009) there will be two types of performance measures in organizations: aggregate measures, such as the level of consumer satisfaction or general service level, which give a more general view of the operation and are more useful at the strategic level; and detailed measures that allow closer monitoring of operations.
In performance measurement, it is important to define efficiency, efficacy and effectiveness. Efficiency is the optimization of the resources used in relation to the results achieved, as measured by the productivity and cost of the service produced; while effectiveness consists of an organization
[...] adequately supplying the goods and services expected, previously defined in its objectives and goals [...] effectiveness is the sum of efficiency and efficacy. Thus, effectiveness occurs when the goods and services resulting from a given action reach the most beneficial results for society (Matias-Pereira, 2010, p. 223).
In public organizations, composite indicators should be used, given the complexity of management. The composite indicator is an “[...] aggregate index comprising several individual performance indicators [...]” (Jacobs et al., 2007, p. 383), that is, a “[...] composite, formed from several dimensions
in an attempt to summarize a set of factors [...]” (Pidd, 2012, p. 248). The composite indicator facilitates the analysis and communication with Stakeholders.
Jacobs et al. (2007) recommend some steps for the development of composite indicators, among them: (a) to choose the organizational goals to be measured by the composite indicator; b) choose the indicators to be included in the composite index; c) standardize the indicators on a common scale, as in categorical variables, so that they can be compared internally and externally; and d) to examine the efficiency of policy-makers and managers to compare the results obtained with the resources used.
A structured model for performance measurement is the Balanced Scored Card (BSC). The BSC consists of measuring performance under four dimensions: (1) financial, such as investment return, cash flow, shareholder value, etc.; (2) clients, such as customer satisfaction, etc.; (3) internal processes, such as rework, safety index, etc.; and (4) innovation and learning, such as the number of suggestions per employee, improvement index, among others. The indicators of these four dimensions should be in line with the organization’s strategy (Kaplan & Norton, 1996a, b).
Félix et al. (2011) developed the “BSC.Gov” for public organizations. This BSC maintains the perspectives of internal processes, learning and growth, however, it adds other perspectives more appropriate to the public sector, such as government, budget, public administration and citizen/society relations.
The BSC was also used by the English Police, but with six dimensions: - Citizen focus, crime reduction, crime investigation, promotion of public safety, assistance and use of resources. This Police consist of 43 relatively autonomous units with a local leader each, subordinated to a national Minister.
Chart 1. Reference chart for the definition of performance measurement.
DetailsTitlePurposeRefers toGoalFormulaFrequency of measurementFrequency of reviewWho measures?What do they do?Data sourceWho acts on the data?What do they do?What are the possible actions?Notes and commentsDate/Document number
Source: Neely et al. (1997, 2002).
A value based method for measuring performance... 541
Thirty-six indicators were defined, of which 23 were final product measures (arrests, detentions, etc.) or consequences for service stakeholders. Performance benchmarking between units was promoted. There are also rewards and punishments that can come to intervention in case of poor performance, since performance measurement, besides being knowledge about performance, is a management and policy instrument, mainly to demonstrate the performance to the electorate (Collier, 2007, p. 379).
Chattergoon et al. (2014) report the experience of creating and delivering value based on building a culture of continuous improvement in a Canadian hospital. All initiatives started with the discussion about creating the correct metrics and processes for reporting the data at an appropriate time. They have also used visual management to publicize information and promote a strong culture of performance measurement.
2.1 Forensic Science operationsForensic Science integrates a production chain
of public security and criminal justice services. The crime scene examination by forensic scientists (or Crime Scene Investigators – CSIs) is obligatory in all criminal infractions that leave traces, under penalty of nullity of the criminal trial, and cannot be replaced even by the confession of the accused (Brasil, 1941, articles 158-9). The service is complex, since it has interfaces with the technical-scientific, police and legal spheres (Misse, 2006).
The process begins with the Patrol Police (Military Police) or Highway Patrol Police, which upon learning of an offense goes to the place, isolates it and calls the Investigation Police (Civilian Police),
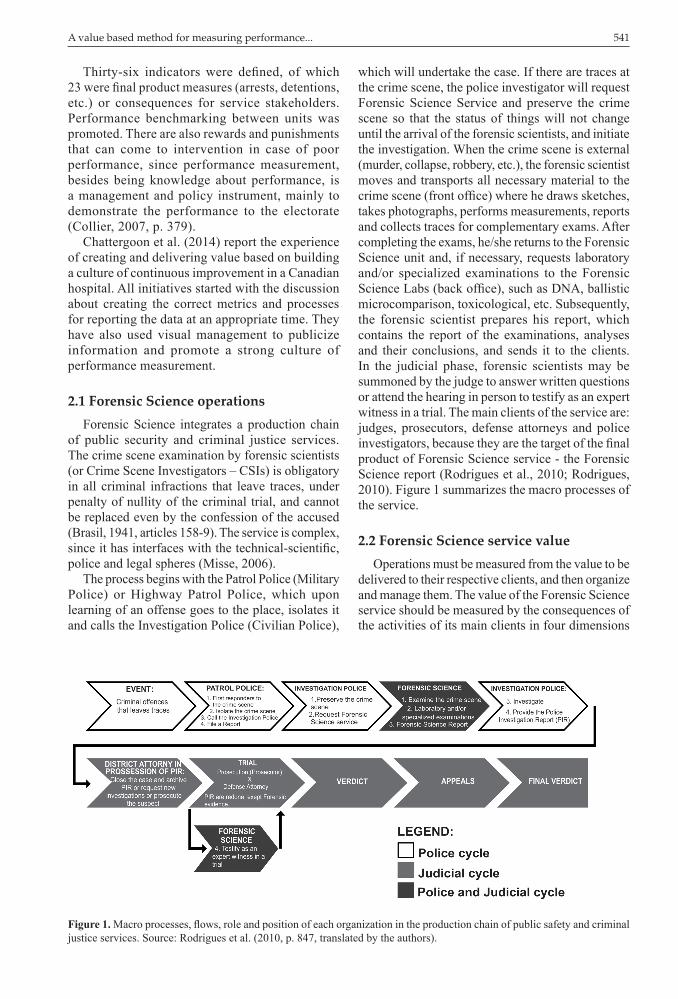
which will undertake the case. If there are traces at the crime scene, the police investigator will request Forensic Science Service and preserve the crime scene so that the status of things will not change until the arrival of the forensic scientists, and initiate the investigation. When the crime scene is external (murder, collapse, robbery, etc.), the forensic scientist moves and transports all necessary material to the crime scene (front office) where he draws sketches, takes photographs, performs measurements, reports and collects traces for complementary exams. After completing the exams, he/she returns to the Forensic Science unit and, if necessary, requests laboratory and/or specialized examinations to the Forensic Science Labs (back office), such as DNA, ballistic microcomparison, toxicological, etc. Subsequently, the forensic scientist prepares his report, which contains the report of the examinations, analyses and their conclusions, and sends it to the clients. In the judicial phase, forensic scientists may be summoned by the judge to answer written questions or attend the hearing in person to testify as an expert witness in a trial. The main clients of the service are: judges, prosecutors, defense attorneys and police investigators, because they are the target of the final product of Forensic Science service - the Forensic Science report (Rodrigues et al., 2010; Rodrigues, 2010). Figure 1 summarizes the macro processes of the service.
2.2 Forensic Science service valueOperations must be measured from the value to be
delivered to their respective clients, and then organize and manage them. The value of the Forensic Science service should be measured by the consequences of the activities of its main clients in four dimensions
Figure 1. Macro processes, flows, role and position of each organization in the production chain of public safety and criminal justice services. Source: Rodrigues et al. (2010, p. 847, translated by the authors).
Rodrigues, C. V. et al.542 Gest. Prod., São Carlos, v. 24, n. 3, p. 538-556, 2017
- utility, justice, solidarity and aesthetics - and of the resources used to provide them (Rodrigues, 2010).
Thus, the service must provide a utility value, which is to link the perpetrator to the crime scene (or to innocent someone wrongly accused) and/or to elucidate an event, using scientific knowledge and applied technological innovations, in order to not to subject those involved in an investigation to constraints (Rodrigues, 2010).
And, to be useful, this service must be made available in a time to assist its clients in their respective activities (Belluco & Pimenta, 2013; Gonçalves, 2013; Lima & Goldszmidt, 2013; Belluco, 2012).
The other dimension of value is justice. It consists in universalizing the service access, regardless of pre-existing conditions, such as ethnicity, socioeconomic level, religion, ideology, gender, sexual choice and political party (Rodrigues, 2010).
The third dimension is solidarity, which seeks social inclusion. For Forensic Science, it means exemption from the production of evidence and, consequently, the isonomic treatment given to prosecution and defense, and the investigation of violations of human rights and other crimes committed by State agents against citizens, such as torture (Jesus, 2009; Rogêdo, 2005).
This dimension - the need for exemption - is one of the main arguments in favor of becoming Forensic Science independent from police structures and its constitution as an autonomous agency (National Research Council, 2009; Giannelli, 2007; Koppl, 2005), a fact that already happens in 16 Brazilian states (Figueiredo & Pareschi, 2012). These two dimensions - access and exemption - relate to the promotion of human rights.
The aesthetic dimension consists in the beauty of the service, seeking a new way of solving crimes, using scientific knowledge and technological innovations.
The definition of resources is conditioned by the consequences to be generated in the activities of the clients of the service. The main resources used in providing the service are the competence of forensic scientists (engineers, physicists, chemists, pharmacists, accountants, biologists, dentists, etc.), while technological artifacts are ancillary resources. The competences are two: the technical and the communicative. The first is competence to find traces at crime scenes and turn them into evidence, as well as incorporate new technologies applied to the service; while the second is to establish a direct dialogical relationship with each of the clients. There are several technologies applied to Forensic Science, such as DNA exams, chemical powders, chromatographs, etc.
Therefore, the value of the service lies in its ability to help the police and justice to elucidate complex crimes, using science, respecting human rights.
2.3 Measuring performance in Forensic
Science operationsHouck et al. (2012) suggest to measure efficiency
through the average cost per case, resulting from the sum of the total costs incurred divided by the number of cases. As for internal processes or internal value chain, they suggest the measurement of inputs, such as number of cases, samples, items, required tests, and outputs, such as examined items, completed tests, and appearance in court. Thus, the following should be measured: the average number of days to attend the requisitions; the percentage of requests met within ‘X’ days; customer satisfaction based on surveys; and the backlog as a percentage of the number of cases; the number of errors; and the number of customer complaints.
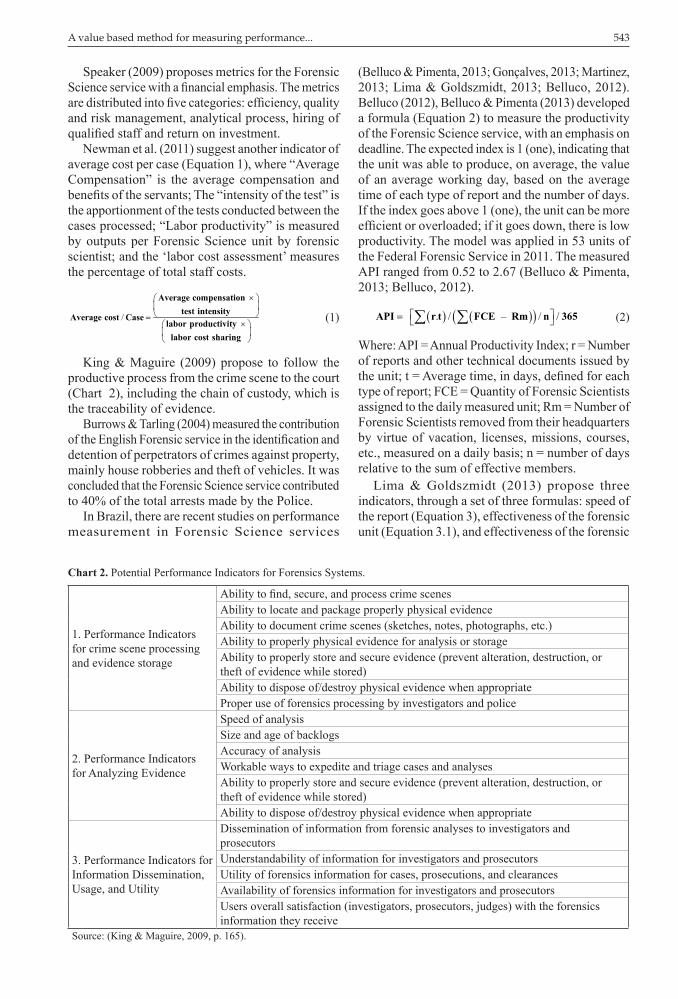
Kobus et al. (2011) propose a cost/production time matrix for the value of the exams (weight of the evidence produced) (Figure 2). For example, gunshot residue tests in the hands of suspects were labor-intensive and inaccurate, hence the examination was located in the lower right quadrant of the matrix (high cost, low value). Currently, using microscopes that analyze the energy dispersed by X-rays, the costs per examination are reduced, besides being precise, therefore, they are in the upper left quadrant. In the lower left quadrant of the matrix (low cost and low value) are the tests that depend only on the application of chemical reagents whose coloration acquired in contact with a narcotic substance, for example, indicates positive or negative presumption. In the upper right quadrant (high value and high cost, because they rely on manual analysis) is the survey of the crime scene conducted by the forensic scientist and the production of the respective forensic reports, which are critical operations, of high value and difficult to automate.
Figure 2. Observed relations between evidence value and time or cost analysis. Source: Kobus et al. (2011).
A value based method for measuring performance... 543
Speaker (2009) proposes metrics for the Forensic Science service with a financial emphasis. The metrics are distributed into five categories: efficiency, quality and risk management, analytical process, hiring of qualified staff and return on investment.
Newman et al. (2011) suggest another indicator of average cost per case (Equation 1), where “Average Compensation” is the average compensation and benefits of the servants; The “intensity of the test” is the apportionment of the tests conducted between the cases processed; “Labor productivity” is measured by outputs per Forensic Science unit by forensic scientist; and the ‘labor cost assessment’ measures the percentage of total staff costs.
/
×
=
×
Average compensationtest intensity
Average cost Caselabor productivity
labor cost sharing
(1)
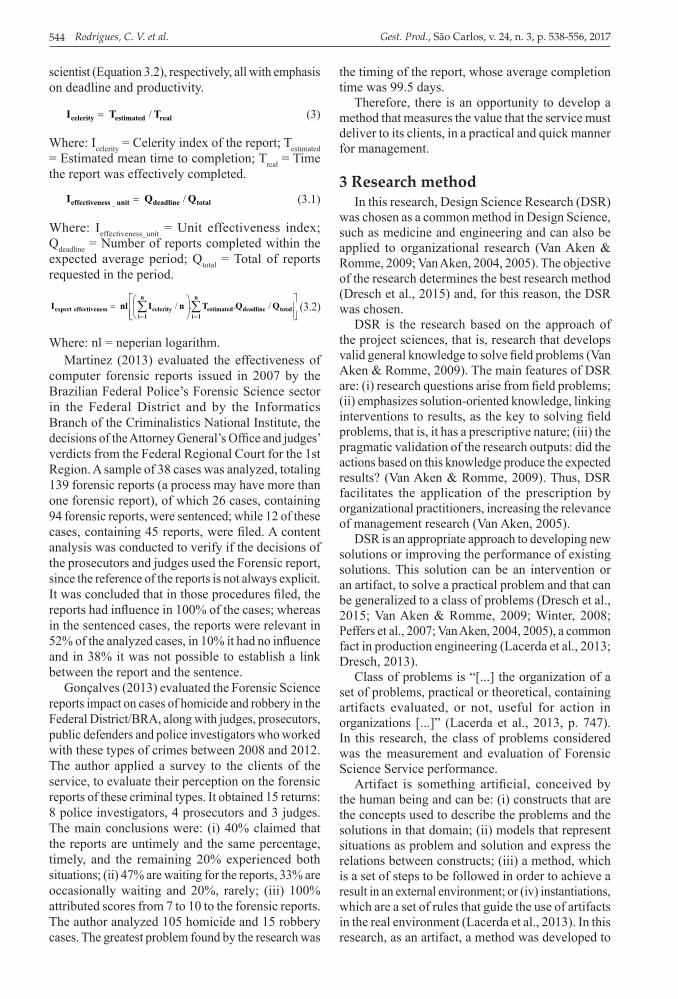
King & Maguire (2009) propose to follow the productive process from the crime scene to the court (Chart 2), including the chain of custody, which is the traceability of evidence.
Burrows & Tarling (2004) measured the contribution of the English Forensic service in the identification and detention of perpetrators of crimes against property, mainly house robberies and theft of vehicles. It was concluded that the Forensic Science service contributed to 40% of the total arrests made by the Police.
In Brazil, there are recent studies on performance measurement in Forensic Science services
(Belluco & Pimenta, 2013; Gonçalves, 2013; Martinez, 2013; Lima & Goldszmidt, 2013; Belluco, 2012). Belluco (2012), Belluco & Pimenta (2013) developed a formula (Equation 2) to measure the productivity of the Forensic Science service, with an emphasis on deadline. The expected index is 1 (one), indicating that the unit was able to produce, on average, the value of an average working day, based on the average time of each type of report and the number of days. If the index goes above 1 (one), the unit can be more efficient or overloaded; if it goes down, there is low productivity. The model was applied in 53 units of the Federal Forensic Service in 2011. The measured API ranged from 0.52 to 2.67 (Belluco & Pimenta, 2013; Belluco, 2012).
( ) ( )( ) . / – / / = ∑ ∑API r t FCE Rm n 365 (2)
Where: API = Annual Productivity Index; r = Number of reports and other technical documents issued by the unit; t = Average time, in days, defined for each type of report; FCE = Quantity of Forensic Scientists assigned to the daily measured unit; Rm = Number of Forensic Scientists removed from their headquarters by virtue of vacation, licenses, missions, courses, etc., measured on a daily basis; n = number of days relative to the sum of effective members.
Lima & Goldszmidt (2013) propose three indicators, through a set of three formulas: speed of the report (Equation 3), effectiveness of the forensic unit (Equation 3.1), and effectiveness of the forensic
Chart 2. Potential Performance Indicators for Forensics Systems.
1. Performance Indicators for crime scene processing and evidence storage
Ability to find, secure, and process crime scenesAbility to locate and package properly physical evidenceAbility to document crime scenes (sketches, notes, photographs, etc.)Ability to properly physical evidence for analysis or storageAbility to properly store and secure evidence (prevent alteration, destruction, or theft of evidence while stored)Ability to dispose of/destroy physical evidence when appropriateProper use of forensics processing by investigators and police
2. Performance Indicators for Analyzing Evidence
Speed of analysisSize and age of backlogsAccuracy of analysisWorkable ways to expedite and triage cases and analysesAbility to properly store and secure evidence (prevent alteration, destruction, or theft of evidence while stored)Ability to dispose of/destroy physical evidence when appropriate
3. Performance Indicators for Information Dissemination, Usage, and Utility
Dissemination of information from forensic analyses to investigators and prosecutorsUnderstandability of information for investigators and prosecutorsUtility of forensics information for cases, prosecutions, and clearancesAvailability of forensics information for investigators and prosecutorsUsers overall satisfaction (investigators, prosecutors, judges) with the forensics information they receive
Source: (King & Maguire, 2009, p. 165).
Rodrigues, C. V. et al.544 Gest. Prod., São Carlos, v. 24, n. 3, p. 538-556, 2017
scientist (Equation 3.2), respectively, all with emphasis on deadline and productivity.
/=celerity estimated realI T T (3)
Where: Icelerity = Celerity index of the report; Testimated = Estimated mean time to completion; Treal = Time the report was effectively completed.
_ /=effectiveness unit deadline totalI Q Q (3.1)
Where: Ieffectiveness_unit = Unit effectiveness index; Qdeadline = Number of reports completed within the expected average period; Qtotal = Total of reports requested in the period.
/ . . /= =
=
∑ ∑n n
expert effectiveness celerity estimated deadline totali 1 i 1
I nl I n T Q Q (3.2)
Where: nl = neperian logarithm.Martinez (2013) evaluated the effectiveness of
computer forensic reports issued in 2007 by the Brazilian Federal Police’s Forensic Science sector in the Federal District and by the Informatics Branch of the Criminalistics National Institute, the decisions of the Attorney General’s Office and judges’ verdicts from the Federal Regional Court for the 1st Region. A sample of 38 cases was analyzed, totaling 139 forensic reports (a process may have more than one forensic report), of which 26 cases, containing 94 forensic reports, were sentenced; while 12 of these cases, containing 45 reports, were filed. A content analysis was conducted to verify if the decisions of the prosecutors and judges used the Forensic report, since the reference of the reports is not always explicit. It was concluded that in those procedures filed, the reports had influence in 100% of the cases; whereas in the sentenced cases, the reports were relevant in 52% of the analyzed cases, in 10% it had no influence and in 38% it was not possible to establish a link between the report and the sentence.
Gonçalves (2013) evaluated the Forensic Science reports impact on cases of homicide and robbery in the Federal District/BRA, along with judges, prosecutors, public defenders and police investigators who worked with these types of crimes between 2008 and 2012. The author applied a survey to the clients of the service, to evaluate their perception on the forensic reports of these criminal types. It obtained 15 returns: 8 police investigators, 4 prosecutors and 3 judges. The main conclusions were: (i) 40% claimed that the reports are untimely and the same percentage, timely, and the remaining 20% experienced both situations; (ii) 47% are waiting for the reports, 33% are occasionally waiting and 20%, rarely; (iii) 100% attributed scores from 7 to 10 to the forensic reports. The author analyzed 105 homicide and 15 robbery cases. The greatest problem found by the research was
the timing of the report, whose average completion time was 99.5 days.
Therefore, there is an opportunity to develop a method that measures the value that the service must deliver to its clients, in a practical and quick manner for management.
3 Research methodIn this research, Design Science Research (DSR)
was chosen as a common method in Design Science, such as medicine and engineering and can also be applied to organizational research (Van Aken & Romme, 2009; Van Aken, 2004, 2005). The objective of the research determines the best research method (Dresch et al., 2015) and, for this reason, the DSR was chosen.
DSR is the research based on the approach of the project sciences, that is, research that develops valid general knowledge to solve field problems (Van Aken & Romme, 2009). The main features of DSR are: (i) research questions arise from field problems; (ii) emphasizes solution-oriented knowledge, linking interventions to results, as the key to solving field problems, that is, it has a prescriptive nature; (iii) the pragmatic validation of the research outputs: did the actions based on this knowledge produce the expected results? (Van Aken & Romme, 2009). Thus, DSR facilitates the application of the prescription by organizational practitioners, increasing the relevance of management research (Van Aken, 2005).
DSR is an appropriate approach to developing new solutions or improving the performance of existing solutions. This solution can be an intervention or an artifact, to solve a practical problem and that can be generalized to a class of problems (Dresch et al., 2015; Van Aken & Romme, 2009; Winter, 2008; Peffers et al., 2007; Van Aken, 2004, 2005), a common fact in production engineering (Lacerda et al., 2013; Dresch, 2013).
Class of problems is “[...] the organization of a set of problems, practical or theoretical, containing artifacts evaluated, or not, useful for action in organizations [...]” (Lacerda et al., 2013, p. 747). In this research, the class of problems considered was the measurement and evaluation of Forensic Science Service performance.
Artifact is something artificial, conceived by the human being and can be: (i) constructs that are the concepts used to describe the problems and the solutions in that domain; (ii) models that represent situations as problem and solution and express the relations between constructs; (iii) a method, which is a set of steps to be followed in order to achieve a result in an external environment; or (iv) instantiations, which are a set of rules that guide the use of artifacts in the real environment (Lacerda et al., 2013). In this research, as an artifact, a method was developed to
A value based method for measuring performance... 545
measure Forensic Science agencies performance and their professionals based on the value the service must deliver.
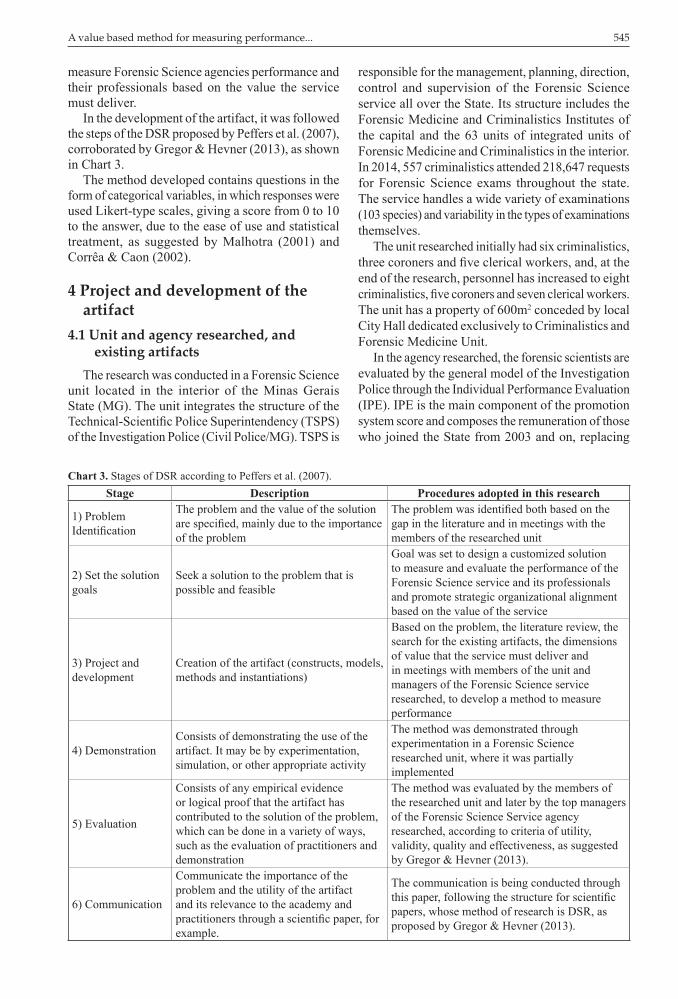
In the development of the artifact, it was followed the steps of the DSR proposed by Peffers et al. (2007), corroborated by Gregor & Hevner (2013), as shown in Chart 3.
The method developed contains questions in the form of categorical variables, in which responses were used Likert-type scales, giving a score from 0 to 10 to the answer, due to the ease of use and statistical treatment, as suggested by Malhotra (2001) and Corrêa & Caon (2002).
4 Project and development of the artifact
4.1 Unit and agency researched, and existing artifacts
The research was conducted in a Forensic Science unit located in the interior of the Minas Gerais State (MG). The unit integrates the structure of the Technical-Scientific Police Superintendency (TSPS) of the Investigation Police (Civil Police/MG). TSPS is
responsible for the management, planning, direction, control and supervision of the Forensic Science service all over the State. Its structure includes the Forensic Medicine and Criminalistics Institutes of the capital and the 63 units of integrated units of Forensic Medicine and Criminalistics in the interior. In 2014, 557 criminalistics attended 218,647 requests for Forensic Science exams throughout the state. The service handles a wide variety of examinations (103 species) and variability in the types of examinations themselves.
The unit researched initially had six criminalistics, three coroners and five clerical workers, and, at the end of the research, personnel has increased to eight criminalistics, five coroners and seven clerical workers. The unit has a property of 600m2 conceded by local City Hall dedicated exclusively to Criminalistics and Forensic Medicine Unit.
In the agency researched, the forensic scientists are evaluated by the general model of the Investigation Police through the Individual Performance Evaluation (IPE). IPE is the main component of the promotion system score and composes the remuneration of those who joined the State from 2003 and on, replacing
Chart 3. Stages of DSR according to Peffers et al. (2007).Stage Description Procedures adopted in this research
1) Problem Identification
The problem and the value of the solution are specified, mainly due to the importance of the problem
The problem was identified both based on the gap in the literature and in meetings with the members of the researched unit
2) Set the solution goals
Seek a solution to the problem that is possible and feasible
Goal was set to design a customized solution to measure and evaluate the performance of the Forensic Science service and its professionals and promote strategic organizational alignment based on the value of the service
3) Project and development
Creation of the artifact (constructs, models, methods and instantiations)
Based on the problem, the literature review, the search for the existing artifacts, the dimensions of value that the service must deliver and in meetings with members of the unit and managers of the Forensic Science service researched, to develop a method to measure performance
4) DemonstrationConsists of demonstrating the use of the artifact. It may be by experimentation, simulation, or other appropriate activity
The method was demonstrated through experimentation in a Forensic Science researched unit, where it was partially implemented
5) Evaluation
Consists of any empirical evidence or logical proof that the artifact has contributed to the solution of the problem, which can be done in a variety of ways, such as the evaluation of practitioners and demonstration
The method was evaluated by the members of the researched unit and later by the top managers of the Forensic Science Service agency researched, according to criteria of utility, validity, quality and effectiveness, as suggested by Gregor & Hevner (2013).
6) Communication
Communicate the importance of the problem and the utility of the artifact and its relevance to the academy and practitioners through a scientific paper, for example.
The communication is being conducted through this paper, following the structure for scientific papers, whose method of research is DSR, as proposed by Gregor & Hevner (2013).
Rodrigues, C. V. et al.546 Gest. Prod., São Carlos, v. 24, n. 3, p. 538-556, 2017
the 10% quinquennium every 5 years of service. The scores are posted on a computerized system, the form is printed to, and then archived. The evaluations are conducted by the immediate boss (or a commission), with at least two monitorings per year, and the evaluation can be appealed to the superior instance.
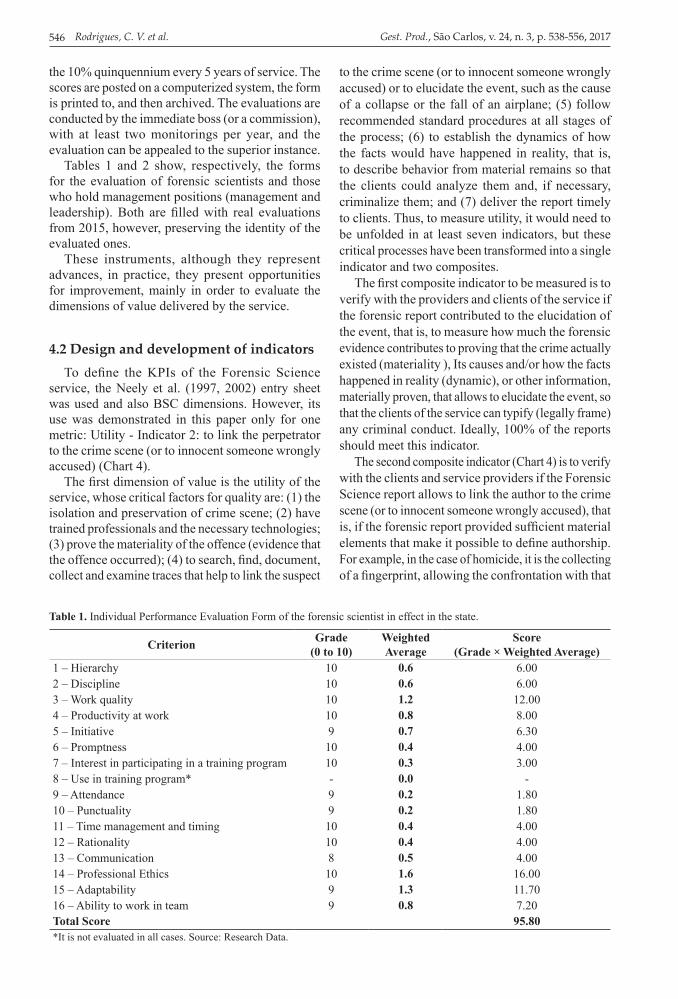
Tables 1 and 2 show, respectively, the forms for the evaluation of forensic scientists and those who hold management positions (management and leadership). Both are filled with real evaluations from 2015, however, preserving the identity of the evaluated ones.
These instruments, although they represent advances, in practice, they present opportunities for improvement, mainly in order to evaluate the dimensions of value delivered by the service.
4.2 Design and development of indicatorsTo define the KPIs of the Forensic Science
service, the Neely et al. (1997, 2002) entry sheet was used and also BSC dimensions. However, its use was demonstrated in this paper only for one metric: Utility - Indicator 2: to link the perpetrator to the crime scene (or to innocent someone wrongly accused) (Chart 4).
The first dimension of value is the utility of the service, whose critical factors for quality are: (1) the isolation and preservation of crime scene; (2) have trained professionals and the necessary technologies; (3) prove the materiality of the offence (evidence that the offence occurred); (4) to search, find, document, collect and examine traces that help to link the suspect
to the crime scene (or to innocent someone wrongly accused) or to elucidate the event, such as the cause of a collapse or the fall of an airplane; (5) follow recommended standard procedures at all stages of the process; (6) to establish the dynamics of how the facts would have happened in reality, that is, to describe behavior from material remains so that the clients could analyze them and, if necessary, criminalize them; and (7) deliver the report timely to clients. Thus, to measure utility, it would need to be unfolded in at least seven indicators, but these critical processes have been transformed into a single indicator and two composites.
The first composite indicator to be measured is to verify with the providers and clients of the service if the forensic report contributed to the elucidation of the event, that is, to measure how much the forensic evidence contributes to proving that the crime actually existed (materiality ), Its causes and/or how the facts happened in reality (dynamic), or other information, materially proven, that allows to elucidate the event, so that the clients of the service can typify (legally frame) any criminal conduct. Ideally, 100% of the reports should meet this indicator.
The second composite indicator (Chart 4) is to verify with the clients and service providers if the Forensic Science report allows to link the author to the crime scene (or to innocent someone wrongly accused), that is, if the forensic report provided sufficient material elements that make it possible to define authorship. For example, in the case of homicide, it is the collecting of a fingerprint, allowing the confrontation with that
Table 1. Individual Performance Evaluation Form of the forensic scientist in effect in the state.
Criterion Grade(0 to 10)
WeightedAverage
Score(Grade × Weighted Average)
1 – Hierarchy 10 0.6 6.002 – Discipline 10 0.6 6.003 – Work quality 10 1.2 12.004 – Productivity at work 10 0.8 8.005 – Initiative 9 0.7 6.306 – Promptness 10 0.4 4.007 – Interest in participating in a training program 10 0.3 3.008 – Use in training program* - 0.0 -9 – Attendance 9 0.2 1.8010 – Punctuality 9 0.2 1.8011 – Time management and timing 10 0.4 4.0012 – Rationality 10 0.4 4.0013 – Communication 8 0.5 4.0014 – Professional Ethics 10 1.6 16.0015 – Adaptability 9 1.3 11.7016 – Ability to work in team 9 0.8 7.20Total Score 95.80*It is not evaluated in all cases. Source: Research Data.

A value based method for measuring performance... 547
of a suspect, or physiological material, that allows to obtain a profile through DNA test.
Both indicators of utility (1 and 2) of the Forensic Science service are the end result of the seven major service processes listed above. Thus, the responses
of the service providers can be compared with those
of each client and analyze the results, seeking to
identify possible gaps between the evaluations of
these indicators.
Table 2. Performance Evaluation Form for occupants of management positions (direction and management).
CRITERION Dimension Grade(0 to 10)
WeightedAverage
Score(Grade ×
Weighted Average)
1 – Management Skills
Delegation of functions 10.00
0.8 48.00
Staff developing 10.00Flexibility 10.00Participative Management 10.00Planning 10.00Decision Making 10.00
2 – Technical Competence
Work knowledge 10.00
0.6 28.80Effectiveness 8.00Efficiency 10.00Quality and productivity 10.00Professional qualification 10.00
3 – Interpersonal CompetenceCommunication 10.00 0.5 10.00Initiative 10.00
4 – DisciplineAttendance 10.00
0.4 12.00Professional ethics 10.00Proper use of equipment and facilities 10.00
Total Individual Performance Score 98.80Source: Research data.
Chart 4. Utility - Indicator 2: To link the author to the crime scene (or to innocent someone wrongly accused).
DetailsTitle Contribution to definition of authorship
Purpose To measure how much the Forensic Science report contributed to link the suspect to the crime scene (or to innoccent someone wrongly accused) or to define the crime autorship
Refers to Critical utility of the Forensic Science service
Goal 100% of the forensic reports must contain some traces that allow to identify the true author of an offence or to innocent someone wrongly accused
Formula Does the Forensic Science report link the suspect to the crime scene (or innocent someone wrongly accused) or define the authorship? Likert nominal scale response
Frequency of measurement
Each report, or those considered as priorities by the Government and / or Forensic Science managers
Frequency of review AnnualWho measures? Clients (judge, prosecutor, police investigator and defense) and forensic scientists
What do they do?Measure how much the Forensic Science service contributes to the identification of the perpetrator of a crime (or to innocent someone wrongly accused), using the scientific knowledge and technologies applied to Forensic Science
Data source Forensic Science reportWho acts on the data? Forensic scientist responsible for the report
What do they do? They collect the traces, perform complementary and laboratory tests and prepare the final Forensic Science report
What are the possible actions? Constant staff training and investment in technological innovations
Notes and comments This is a critical KPI for Forensic Science serviceSource: Adapted from Neely et al. (1997).
Rodrigues, C. V. et al.548 Gest. Prod., São Carlos, v. 24, n. 3, p. 538-556, 2017
The third indicator of utility is to measure whether the Forensic Science report was provided timely to aid the criminal investigation, the trial and the verdict. The legal deadline for the conclusion of the Forensic Science report in Brazil is up to 10 days, but due to the complexity of the exams, the need for complementary examinations and the capacity deficit, it is difficult to comply with the legal deadline. In practice, the management should establish a deadline for each type of report, as recommended by Belluco & Pimenta (2013) and Lima & Goldszmidt (2013). These deadlines may vary from one forensic unit to another, depending on the particularities. In addition, each client has the need of the report at a certain time. For example, the police investigator needs the report on time to assist in the investigation, while the prosecutor, when reporting the suspect to Court or filing. Thus, it will be asked each client if the report was received timely for its respective activity. The time is measured in days from the date of the forensic examination request to the date of availability of the respective report. It should be measured the percentage of forensic reports in delay in relation to the defined deadline (backlog), by forensic scientist, by unit and by the whole Forensic Science agency.
Another dimension of value is Justice, which is the universalization of the service, that is, the accessibility of any citizen to the service. Critical factors for this dimension are: geographical coverage, number of forensic scientists and standardization of the service, so that all cases receive the same treatment, regardless of any pre-existing condition, such as ethnicity, socioeconomic level, religious belief, political views, among others.
Standardization consists of adopting standard operating procedures (SOPs) for each forensic examination, such as those published by SENASP/MJ within the “Safer Brazil Program” (Brasil, 2013), or another adopted by the Forensic Science agency. This evaluation should be conducted by the service managers and by clients who know the SOPs.
The measurement of the extent of the Forensic Science service exemption is difficult to obtain from a questioning to the forensic scientists themselves and to the clients, because it depends on the institutional design of the agency. So, to measure it, it was sought to evaluate the level of independence of the Forensic Science service, which critical factors are: to whom the maximum leader of the agency is subordinated, how his choice and appointment is made, if he has a term of fixed duration, if the service has an Internal Affairs office, training school and own budgets, among other variables, that allow to establish the level of independence of the service.
In Brazil, there are three institutional forms (Figueiredo & Pareschi, 2012): (i) Forensic Science Service integrate the structure of the Investigation
Police, which it is the case of the Union, ten States and the Federal District; (ii) the Forensic Science Service responds directly to the State Public Safety Departments, or similar, which it is the case of fifteen States; (iii) the Forensic Science Service responds directly to the State Governor, which it is only the case of Amapá/BRA State. This evaluation should be done with the managers of the service and analyzing the official documents that define the mission, institutional design and jurisdiction of the service, on a scale from zero (subordination to the Police, without any autonomy) to ten (financial, budgetary, functional and administrative independence, such as the District Attorney Office).
The aesthetic dimension is very subjective and will not be included in this proposal.
As for the value from the perspective of the resources needed to produce the consequences in the activities of the clients of the service, there are the forensic scientists (and possible clerical workers) and the technologies for service provision. As for the professionals, the results of the first dimension (utility) are that they will indicate possible technical and/or communicative deficiencies, aiming at future corrective actions.
As for resources, it is imperative to measure whether there are sufficient technological resources, updated and geographically distributed to meet both the utility dimension and the universalization of the service. In Brazil, it is observed that, especially in the interior units of the states, there are not all the necessary resources (Figueiredo & Pareschi, 2012). This indicator would measure the percentage of availability and distribution of technological resources in the presence of a list containing the minimum resources indispensable to the provision of the service.
It was also sought a cost measure (Equation 4) for the production of the service, for the use of political agents and managers. The indicator should measure the efficiency of the units and of the agencies as a whole by calculating the average cost per report (ACr), whose formula is:
( )
$ /
+
=∑ ∑
installationsACr cost of the inputs of the issued reports
staff (4)
Another indicator of efficiency of interest of the Politicians, Government Officials and managers of the service is the productivity. This indicator is measured in terms of percentage of forensic reports issued in relation to the number of examinations required (Figueiredo & Pareschi, 2012). It is given by the Equation 5:
/%
= ×
∑∑
of issued reportsProductivity 100
required exams (5)
Finally, the ‘number of complaints per year’ of the clients, by forensic scientist, per unit and for
A value based method for measuring performance... 549
the agency is defined as an indicator. Whenever there is a complaint, its root cause will be sought. These are considered complaints (service failures), the reiteration of the request for a report by a client, delay or non-attendance of a request or a crime scene, among others.
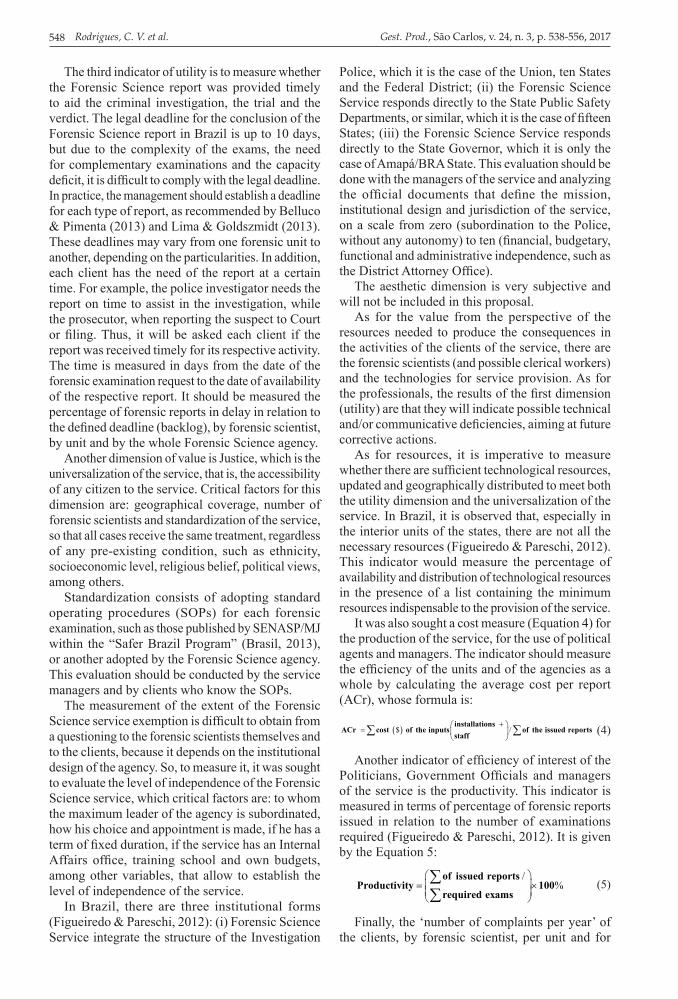
After defining the KPIs for the service to deliver value, the performance measurement method was elaborated. Initially, three separate questionnaires were developed to collect the data. The first questionnaire (Chart 5) will be answered by the forensic scientist responsible for the case under evaluation. Part of the questionnaire will be answered before the forensic scientist goes to the crime scene, when it is the case, another during the examinations and the third after the closing of the report. If the report requires additional examinations, the forensic scientists responsible for the respective examinations and reports will also answer. The objective is to guarantee the observance of the internal processes, evaluating each of the macro processes critical to the success of the examinations. It is a guide for managers and forensic scientists to orient themselves and identify opportunities for improvement in service processes.
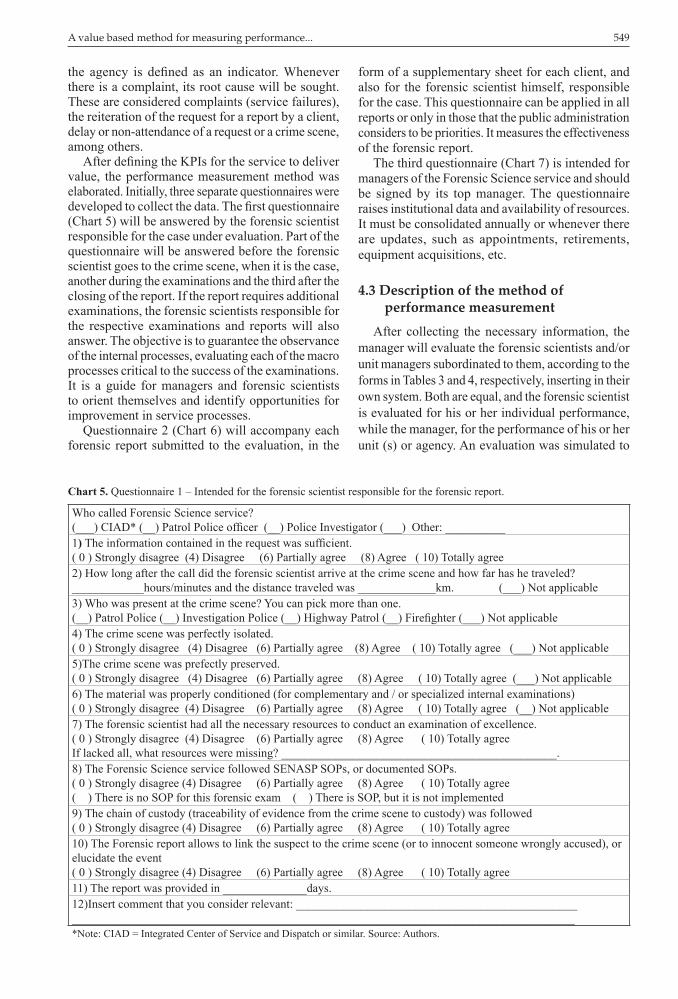
Questionnaire 2 (Chart 6) will accompany each forensic report submitted to the evaluation, in the
form of a supplementary sheet for each client, and also for the forensic scientist himself, responsible for the case. This questionnaire can be applied in all reports or only in those that the public administration considers to be priorities. It measures the effectiveness of the forensic report.
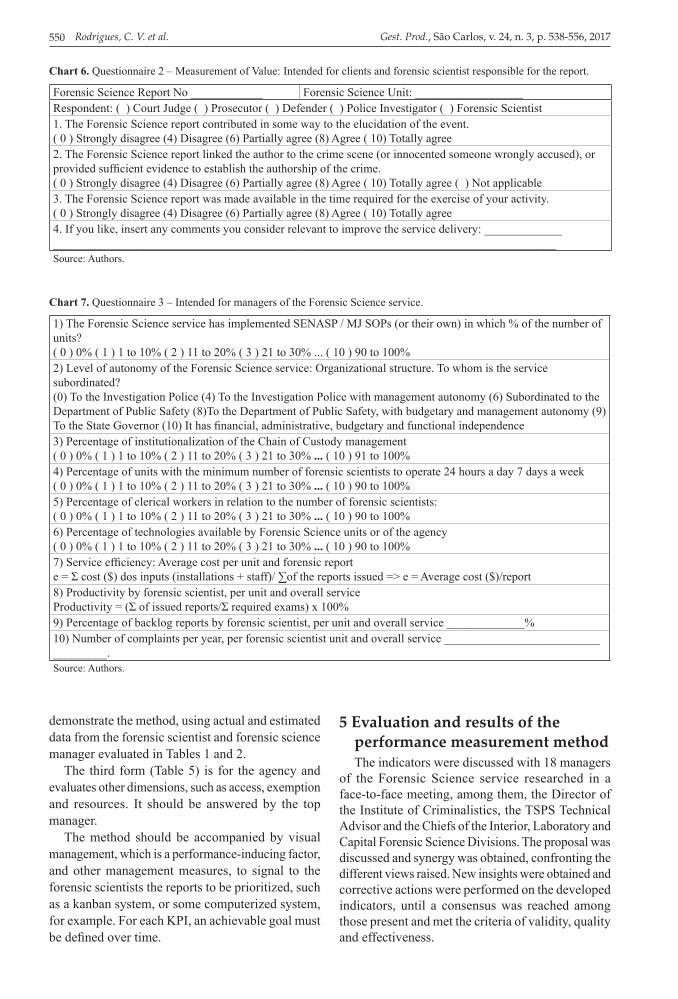
The third questionnaire (Chart 7) is intended for managers of the Forensic Science service and should be signed by its top manager. The questionnaire raises institutional data and availability of resources. It must be consolidated annually or whenever there are updates, such as appointments, retirements, equipment acquisitions, etc.
4.3 Description of the method of performance measurement
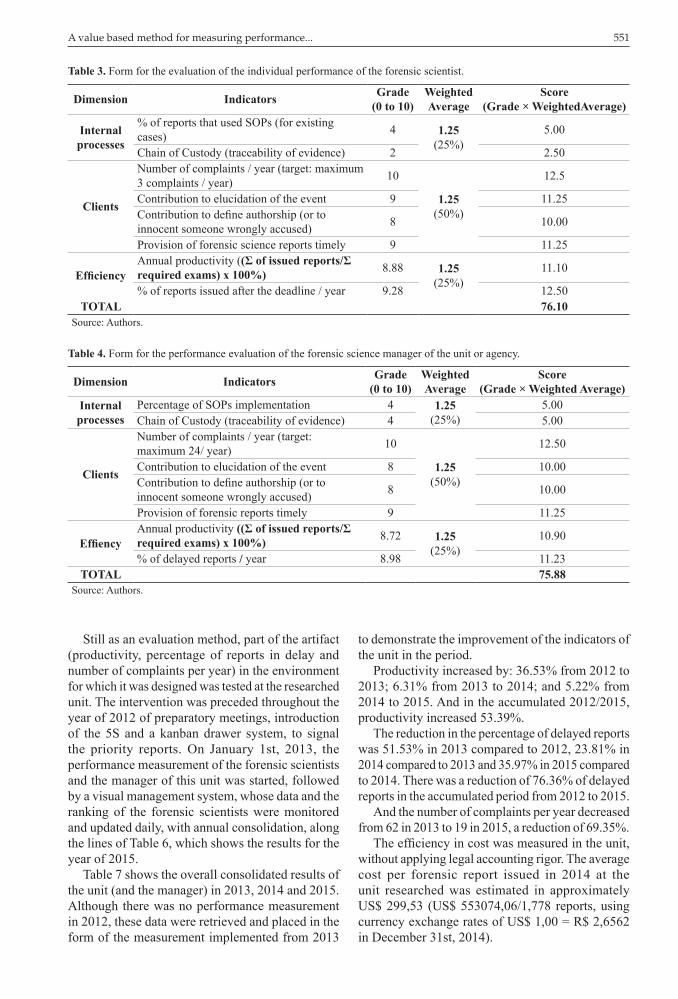
After collecting the necessary information, the manager will evaluate the forensic scientists and/or unit managers subordinated to them, according to the forms in Tables 3 and 4, respectively, inserting in their own system. Both are equal, and the forensic scientist is evaluated for his or her individual performance, while the manager, for the performance of his or her unit (s) or agency. An evaluation was simulated to
Chart 5. Questionnaire 1 – Intended for the forensic scientist responsible for the forensic report.
Who called Forensic Science service?(___) CIAD* (__) Patrol Police officer (__) Police Investigator (___) Other: __________1) The information contained in the request was sufficient.( 0 ) Strongly disagree (4) Disagree (6) Partially agree (8) Agree ( 10) Totally agree2) How long after the call did the forensic scientist arrive at the crime scene and how far has he traveled?____________hours/minutes and the distance traveled was _____________km. (___) Not applicable3) Who was present at the crime scene? You can pick more than one. (__) Patrol Police (__) Investigation Police (__) Highway Patrol (__) Firefighter (___) Not applicable4) The crime scene was perfectly isolated.( 0 ) Strongly disagree (4) Disagree (6) Partially agree (8) Agree ( 10) Totally agree (___) Not applicable5)The crime scene was prefectly preserved.( 0 ) Strongly disagree (4) Disagree (6) Partially agree (8) Agree ( 10) Totally agree (___) Not applicable6) The material was properly conditioned (for complementary and / or specialized internal examinations) ( 0 ) Strongly disagree (4) Disagree (6) Partially agree (8) Agree ( 10) Totally agree (__) Not applicable7) The forensic scientist had all the necessary resources to conduct an examination of excellence.( 0 ) Strongly disagree (4) Disagree (6) Partially agree (8) Agree ( 10) Totally agree If lacked all, what resources were missing? ______________________________________________.8) The Forensic Science service followed SENASP SOPs, or documented SOPs.( 0 ) Strongly disagree (4) Disagree (6) Partially agree (8) Agree ( 10) Totally agree ( ) There is no SOP for this forensic exam ( ) There is SOP, but it is not implemented9) The chain of custody (traceability of evidence from the crime scene to custody) was followed( 0 ) Strongly disagree (4) Disagree (6) Partially agree (8) Agree ( 10) Totally agree 10) The Forensic report allows to link the suspect to the crime scene (or to innocent someone wrongly accused), or elucidate the event( 0 ) Strongly disagree (4) Disagree (6) Partially agree (8) Agree ( 10) Totally agree 11) The report was provided in ______________days.12)Insert comment that you consider relevant: ___________________________________________________________________________________________________________________________________*Note: CIAD = Integrated Center of Service and Dispatch or similar. Source: Authors.
Rodrigues, C. V. et al.550 Gest. Prod., São Carlos, v. 24, n. 3, p. 538-556, 2017
demonstrate the method, using actual and estimated data from the forensic scientist and forensic science manager evaluated in Tables 1 and 2.
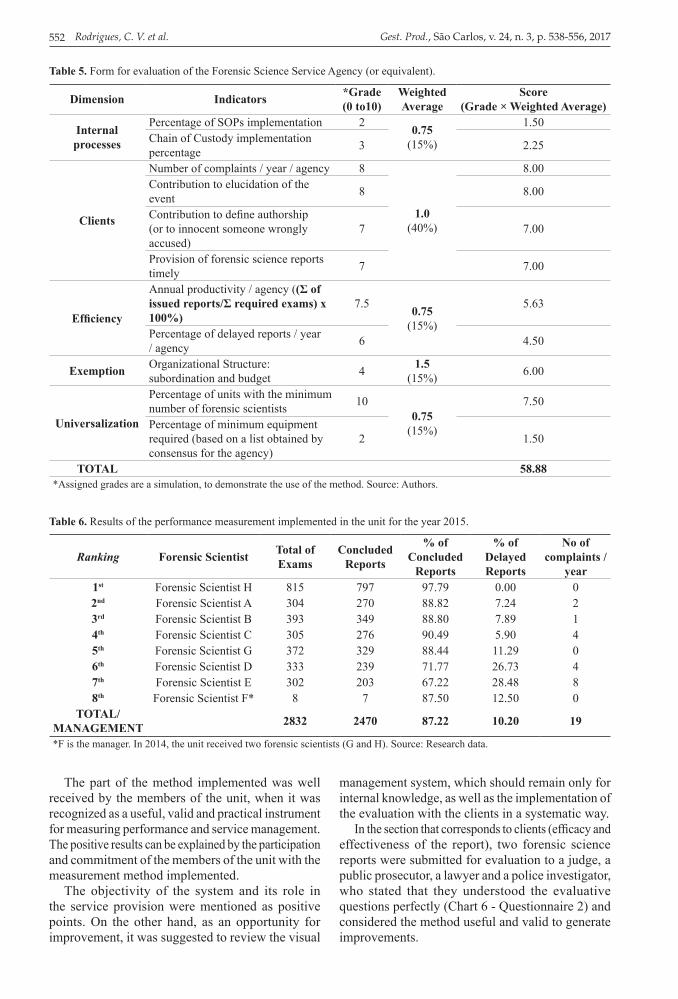
The third form (Table 5) is for the agency and evaluates other dimensions, such as access, exemption and resources. It should be answered by the top manager.
The method should be accompanied by visual management, which is a performance-inducing factor, and other management measures, to signal to the forensic scientists the reports to be prioritized, such as a kanban system, or some computerized system, for example. For each KPI, an achievable goal must be defined over time.
5 Evaluation and results of the performance measurement methodThe indicators were discussed with 18 managers
of the Forensic Science service researched in a face-to-face meeting, among them, the Director of the Institute of Criminalistics, the TSPS Technical Advisor and the Chiefs of the Interior, Laboratory and Capital Forensic Science Divisions. The proposal was discussed and synergy was obtained, confronting the different views raised. New insights were obtained and corrective actions were performed on the developed indicators, until a consensus was reached among those present and met the criteria of validity, quality and effectiveness.
Chart 7. Questionnaire 3 – Intended for managers of the Forensic Science service.
1) The Forensic Science service has implemented SENASP / MJ SOPs (or their own) in which % of the number of units?( 0 ) 0% ( 1 ) 1 to 10% ( 2 ) 11 to 20% ( 3 ) 21 to 30% ... ( 10 ) 90 to 100%2) Level of autonomy of the Forensic Science service: Organizational structure. To whom is the service subordinated?(0) To the Investigation Police (4) To the Investigation Police with management autonomy (6) Subordinated to the Department of Public Safety (8)To the Department of Public Safety, with budgetary and management autonomy (9) To the State Governor (10) It has financial, administrative, budgetary and functional independence3) Percentage of institutionalization of the Chain of Custody management( 0 ) 0% ( 1 ) 1 to 10% ( 2 ) 11 to 20% ( 3 ) 21 to 30% ... ( 10 ) 91 to 100%4) Percentage of units with the minimum number of forensic scientists to operate 24 hours a day 7 days a week( 0 ) 0% ( 1 ) 1 to 10% ( 2 ) 11 to 20% ( 3 ) 21 to 30% ... ( 10 ) 90 to 100%5) Percentage of clerical workers in relation to the number of forensic scientists:( 0 ) 0% ( 1 ) 1 to 10% ( 2 ) 11 to 20% ( 3 ) 21 to 30% ... ( 10 ) 90 to 100%6) Percentage of technologies available by Forensic Science units or of the agency( 0 ) 0% ( 1 ) 1 to 10% ( 2 ) 11 to 20% ( 3 ) 21 to 30% ... ( 10 ) 90 to 100%7) Service efficiency: Average cost per unit and forensic reporte = Ʃ cost ($) dos inputs (installations + staff)/ ∑of the reports issued => e = Average cost ($)/report8) Productivity by forensic scientist, per unit and overall serviceProductivity = (Ʃ of issued reports/Ʃ required exams) x 100%9) Percentage of backlog reports by forensic scientist, per unit and overall service _____________%10) Number of complaints per year, per forensic scientist unit and overall service ___________________________________.Source: Authors.
Chart 6. Questionnaire 2 – Measurement of Value: Intended for clients and forensic scientist responsible for the report.
Forensic Science Report No ____________ Forensic Science Unit: __________________Respondent: ( ) Court Judge ( ) Prosecutor ( ) Defender ( ) Police Investigator ( ) Forensic Scientist1. The Forensic Science report contributed in some way to the elucidation of the event.( 0 ) Strongly disagree (4) Disagree (6) Partially agree (8) Agree ( 10) Totally agree2. The Forensic Science report linked the author to the crime scene (or innocented someone wrongly accused), or provided sufficient evidence to establish the authorship of the crime.( 0 ) Strongly disagree (4) Disagree (6) Partially agree (8) Agree ( 10) Totally agree ( ) Not applicable3. The Forensic Science report was made available in the time required for the exercise of your activity.( 0 ) Strongly disagree (4) Disagree (6) Partially agree (8) Agree ( 10) Totally agree4. If you like, insert any comments you consider relevant to improve the service delivery: _________________________________________________________________________________________________Source: Authors.
A value based method for measuring performance... 551
Still as an evaluation method, part of the artifact (productivity, percentage of reports in delay and number of complaints per year) in the environment for which it was designed was tested at the researched unit. The intervention was preceded throughout the year of 2012 of preparatory meetings, introduction of the 5S and a kanban drawer system, to signal the priority reports. On January 1st, 2013, the performance measurement of the forensic scientists and the manager of this unit was started, followed by a visual management system, whose data and the ranking of the forensic scientists were monitored and updated daily, with annual consolidation, along the lines of Table 6, which shows the results for the year of 2015.
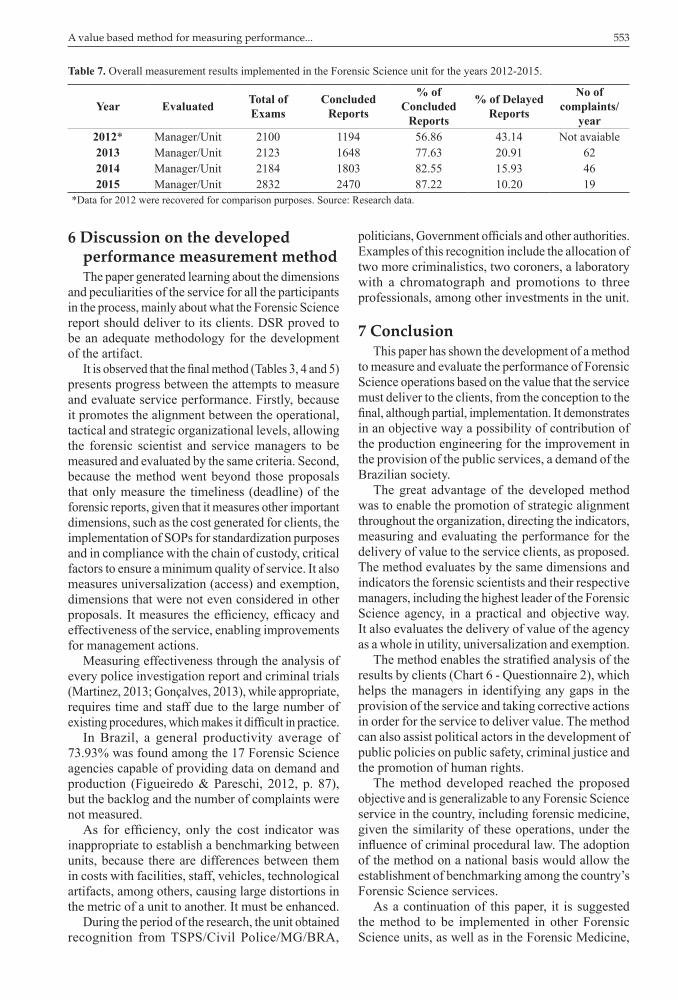
Table 7 shows the overall consolidated results of the unit (and the manager) in 2013, 2014 and 2015. Although there was no performance measurement in 2012, these data were retrieved and placed in the form of the measurement implemented from 2013
to demonstrate the improvement of the indicators of the unit in the period.
Productivity increased by: 36.53% from 2012 to 2013; 6.31% from 2013 to 2014; and 5.22% from 2014 to 2015. And in the accumulated 2012/2015, productivity increased 53.39%.
The reduction in the percentage of delayed reports was 51.53% in 2013 compared to 2012, 23.81% in 2014 compared to 2013 and 35.97% in 2015 compared to 2014. There was a reduction of 76.36% of delayed reports in the accumulated period from 2012 to 2015.
And the number of complaints per year decreased from 62 in 2013 to 19 in 2015, a reduction of 69.35%.
The efficiency in cost was measured in the unit, without applying legal accounting rigor. The average cost per forensic report issued in 2014 at the unit researched was estimated in approximately US$ 299,53 (US$ 553074,06/1,778 reports, using currency exchange rates of US$ 1,00 = R$ 2,6562 in December 31st, 2014).
Table 4. Form for the performance evaluation of the forensic science manager of the unit or agency.
Dimension Indicators Grade(0 to 10)
WeightedAverage
Score(Grade × Weighted Average)
Internal processes
Percentage of SOPs implementation 4 1.25(25%)
5.00Chain of Custody (traceability of evidence) 4 5.00
Clients
Number of complaints / year (target: maximum 24/ year) 10
1.25(50%)
12.50
Contribution to elucidation of the event 8 10.00Contribution to define authorship (or to innocent someone wrongly accused) 8 10.00
Provision of forensic reports timely 9 11.25
EffiencyAnnual productivity ((Ʃ of issued reports/Ʃ required exams) x 100%) 8.72 1.25
(25%)10.90
% of delayed reports / year 8.98 11.23TOTAL 75.88
Source: Authors.
Table 3. Form for the evaluation of the individual performance of the forensic scientist.
Dimension Indicators Grade(0 to 10)
WeightedAverage
Score(Grade × WeightedAverage)
Internal processes
% of reports that used SOPs (for existing cases) 4 1.25
(25%)5.00
Chain of Custody (traceability of evidence) 2 2.50
Clients
Number of complaints / year (target: maximum 3 complaints / year) 10
1.25(50%)
12.5
Contribution to elucidation of the event 9 11.25Contribution to define authorship (or to innocent someone wrongly accused) 8 10.00
Provision of forensic science reports timely 9 11.25
EfficiencyAnnual productivity ((Ʃ of issued reports/Ʃ required exams) x 100%) 8.88 1.25
(25%)11.10
% of reports issued after the deadline / year 9.28 12.50TOTAL 76.10
Source: Authors.
Rodrigues, C. V. et al.552 Gest. Prod., São Carlos, v. 24, n. 3, p. 538-556, 2017
Table 5. Form for evaluation of the Forensic Science Service Agency (or equivalent).
Dimension Indicators *Grade(0 to10)
WeightedAverage
Score(Grade × Weighted Average)
Internal processes
Percentage of SOPs implementation 2 0.75(15%)
1.50Chain of Custody implementation percentage 3 2.25
Clients
Number of complaints / year / agency 8
1.0(40%)
8.00Contribution to elucidation of the event 8 8.00
Contribution to define authorship (or to innocent someone wrongly accused)
7 7.00
Provision of forensic science reports timely 7 7.00
Efficiency
Annual productivity / agency ((Ʃ of issued reports/Ʃ required exams) x 100%)
7.5 0.75(15%)
5.63
Percentage of delayed reports / year / agency 6 4.50
Exemption Organizational Structure: subordination and budget 4 1.5
(15%) 6.00
Universalization
Percentage of units with the minimum number of forensic scientists 10
0.75(15%)
7.50
Percentage of minimum equipment required (based on a list obtained by consensus for the agency)
2 1.50
TOTAL 58.88*Assigned grades are a simulation, to demonstrate the use of the method. Source: Authors.
The part of the method implemented was well received by the members of the unit, when it was recognized as a useful, valid and practical instrument for measuring performance and service management. The positive results can be explained by the participation and commitment of the members of the unit with the measurement method implemented.
The objectivity of the system and its role in the service provision were mentioned as positive points. On the other hand, as an opportunity for improvement, it was suggested to review the visual
management system, which should remain only for internal knowledge, as well as the implementation of the evaluation with the clients in a systematic way.
In the section that corresponds to clients (efficacy and effectiveness of the report), two forensic science reports were submitted for evaluation to a judge, a public prosecutor, a lawyer and a police investigator, who stated that they understood the evaluative questions perfectly (Chart 6 - Questionnaire 2) and considered the method useful and valid to generate improvements.
Table 6. Results of the performance measurement implemented in the unit for the year 2015.
Ranking Forensic Scientist Total of Exams
Concluded Reports
% of Concluded
Reports
% of Delayed Reports
No of complaints /
year1st Forensic Scientist H 815 797 97.79 0.00 02nd Forensic Scientist A 304 270 88.82 7.24 23rd Forensic Scientist B 393 349 88.80 7.89 14th Forensic Scientist C 305 276 90.49 5.90 45th Forensic Scientist G 372 329 88.44 11.29 06th Forensic Scientist D 333 239 71.77 26.73 47th Forensic Scientist E 302 203 67.22 28.48 88th Forensic Scientist F* 8 7 87.50 12.50 0
TOTAL/MANAGEMENT 2832 2470 87.22 10.20 19
*F is the manager. In 2014, the unit received two forensic scientists (G and H). Source: Research data.
A value based method for measuring performance... 553
politicians, Government officials and other authorities. Examples of this recognition include the allocation of two more criminalistics, two coroners, a laboratory with a chromatograph and promotions to three professionals, among other investments in the unit.
7 ConclusionThis paper has shown the development of a method
to measure and evaluate the performance of Forensic Science operations based on the value that the service must deliver to the clients, from the conception to the final, although partial, implementation. It demonstrates in an objective way a possibility of contribution of the production engineering for the improvement in the provision of the public services, a demand of the Brazilian society.
The great advantage of the developed method was to enable the promotion of strategic alignment throughout the organization, directing the indicators, measuring and evaluating the performance for the delivery of value to the service clients, as proposed. The method evaluates by the same dimensions and indicators the forensic scientists and their respective managers, including the highest leader of the Forensic Science agency, in a practical and objective way. It also evaluates the delivery of value of the agency as a whole in utility, universalization and exemption.
The method enables the stratified analysis of the results by clients (Chart 6 - Questionnaire 2), which helps the managers in identifying any gaps in the provision of the service and taking corrective actions in order for the service to deliver value. The method can also assist political actors in the development of public policies on public safety, criminal justice and the promotion of human rights.
The method developed reached the proposed objective and is generalizable to any Forensic Science service in the country, including forensic medicine, given the similarity of these operations, under the influence of criminal procedural law. The adoption of the method on a national basis would allow the establishment of benchmarking among the country’s Forensic Science services.
As a continuation of this paper, it is suggested the method to be implemented in other Forensic Science units, as well as in the Forensic Medicine,
6 Discussion on the developed performance measurement methodThe paper generated learning about the dimensions
and peculiarities of the service for all the participants in the process, mainly about what the Forensic Science report should deliver to its clients. DSR proved to be an adequate methodology for the development of the artifact.
It is observed that the final method (Tables 3, 4 and 5) presents progress between the attempts to measure and evaluate service performance. Firstly, because it promotes the alignment between the operational, tactical and strategic organizational levels, allowing the forensic scientist and service managers to be measured and evaluated by the same criteria. Second, because the method went beyond those proposals that only measure the timeliness (deadline) of the forensic reports, given that it measures other important dimensions, such as the cost generated for clients, the implementation of SOPs for standardization purposes and in compliance with the chain of custody, critical factors to ensure a minimum quality of service. It also measures universalization (access) and exemption, dimensions that were not even considered in other proposals. It measures the efficiency, efficacy and effectiveness of the service, enabling improvements for management actions.
Measuring effectiveness through the analysis of every police investigation report and criminal trials (Martinez, 2013; Gonçalves, 2013), while appropriate, requires time and staff due to the large number of existing procedures, which makes it difficult in practice.
In Brazil, a general productivity average of 73.93% was found among the 17 Forensic Science agencies capable of providing data on demand and production (Figueiredo & Pareschi, 2012, p. 87), but the backlog and the number of complaints were not measured.
As for efficiency, only the cost indicator was inappropriate to establish a benchmarking between units, because there are differences between them in costs with facilities, staff, vehicles, technological artifacts, among others, causing large distortions in the metric of a unit to another. It must be enhanced.
During the period of the research, the unit obtained recognition from TSPS/Civil Police/MG/BRA,
Table 7. Overall measurement results implemented in the Forensic Science unit for the years 2012-2015.
Year Evaluated Total of Exams
Concluded Reports
% of Concluded
Reports
% of Delayed Reports
No of complaints/
year2012* Manager/Unit 2100 1194 56.86 43.14 Not avaiable2013 Manager/Unit 2123 1648 77.63 20.91 622014 Manager/Unit 2184 1803 82.55 15.93 462015 Manager/Unit 2832 2470 87.22 10.20 19
*Data for 2012 were recovered for comparison purposes. Source: Research data.
Rodrigues, C. V. et al.554 Gest. Prod., São Carlos, v. 24, n. 3, p. 538-556, 2017
and therefore, extend its evaluation and disseminate the results to new applications, seeking to improve it and, at the same time contribute to improving the performance and management of Forensic Science services.
AcknowledgementsThe authors thank the editor and referees of this
paper for their important contributions to improve its content and presentation.
ReferencesAustin, R., & Gittel, J. H. (2007). Anomalies of measurement:
when it works but should not. In A. Neely. Business performance measurement: unifying theory and integrating practice (2 ed., pp. 449-476). Cambridge: Cambridge University Press.
Behn, R. (2003). Why measure performance? Different purposes require different measures. Public Administration Review, 63(5), 586-606. http://dx.doi.org/10.1111/1540-6210.00322.
Belluco, C. G. (2012). Indicadores de produtividade (Dissertação de mestrado), Escola de Administração Pública e de Empresas, Fundação Getulio Vargas, Rio de Janeiro.
Belluco, C. G., & Pimenta, R. C. (2013). Indicadores de produtividade aplicados à criminalística da Polícia Federal. In F. C. Vasconcelos, R. Fontes Filho, & M. A. Tsunoda. Gestão Pública: a perícia criminal em foco (pp. 412). Rio de Janeiro: Editora FGV.
Bourne, M., Neely, A., Platts, K., & Mills, J. (2002). The success and failure of performance measurement initiatives: perceptions of participating managers. International Journal of Operations & Production Management, 22(11), 1288-1310. http://dx.doi.org/10.1108/01443570210450329.
Brasil. (1941, 24 outubro). Decreto-lei nº 3.689, de 3 de outubro de 1941. Código de Processo Penal. Brasília, DF: Diário Oficial da República Federativa do Brasil. Recuperado em 1 julho de 2012, de http://www.planalto.gov.br/ccivil_03/decreto-lei/del3689.htm
Brasil. Ministério de Justiça e Segurança Pública. (2003). Plano Nacional de Segurança Pública. Brasília: SENASP. Recuperado em 1 de julho de 2012, de http://www.mj.gov.br/Senasp/biblioteca/Bibliota_pnsp.htm
Brasil. Ministério da Justiça e Segurança Pública. Secretaria Nacional de Segurança Pública. Programa das Nações Unidas para o Desenvolvimento – PNUD. (2004). Eixo:“Modelo de gestão organizacional (Produto 05: Relatório Preliminar dos Trabalhos, 72 p.). Brasília: SENASP. Recuperado em 1 de outubro de 2008, de http://www.dhnet.org.br/redebrasil/executivo/nacional/anexos/gestao_org_caulliraux.pdf
Brasil. Ministério de Justiça e Segurança Pública. (2013). Procedimento operacional padrão. Brasília: SENASP.
Recuperado em 1 março de 2014, de http://portal.mj.gov.br/
Burrows, J., & Tarling, R. (2004). Measuring the impact of forensic science in detecting burglary and autocrime offenses. Science & Justice, 44(4), 217-222. PMid:15527184. http://dx.doi.org/10.1016/S1355-0306(04)71721-9.
Cauliraux, H. M., & Yuki, M. (Eds.) (2004). Gestão pública e reforma administrativa. Rio de Janeiro: Lucerna.
Cauliraux, H. M., Proença, A., & Silva, B. L. (2004). Gestão pública no Brasil. In H. M. Cauliraux & M. Yuki. Gestão pública e reforma administrativa (pp. 59-78). Rio de Janeiro: Lucerna.
Caulliraux, H. M., & Yamashita, E. C. (2004). Gestão pública no Brasil. In H. M. Caulliraux & M. Yuki. Gestão pública e reforma administrativa (pp. 59-78). Rio de Janeiro: Lucerna.
Chattergoon, S., Darling, S., Devitt, R., & Klassen, W. (2014). Creating and sustaining value: building a culture of continuous improvement. Health Management Forum, 27(1), 5-9. PMid:25109131. http://dx.doi.org/10.1016/j.hcmf.2013.12.002.
Collier, P. (2007). Police performance: sovereignty, discipline and governmentality. In A. Neely. Business performance measurement: unifying theory and integrating practice (2 ed., pp. 363-382). Cambridge: Cambridge University Press.
Corrêa, H. L., & Caon, M. (2002). Gestão de serviços: lucratividade por meio de operações e de satisfação dos clientes. São Paulo: Atlas.
Dresch, A. (2013). Design Science e Design Science Research como artefatos metodológicos para Engenharia de Produção (Dissertação de mestrado). Programa de Pós-Graduação em Engenharia e Sistemas, Universidade do Vale do Rio dos Sinos, São Leopoldo.
Dresch, A., Lacerda, D. P., & Antunes , J. V., Jr. (2015). Design Science Research - Método de Pesquisa Para Avanço da Ciência e Tecnologia. Porto Alegre: Bookman.
Félix, R., Félix, P. D., & Timóteo, R. (2011). Balanced ScoreCard: adequação para a gestão estratégica nas organizações públicas. Revista do Serviço Público, 62(1), 51-74.
Figueiredo, I. S., & Pareschi, A. C. (2012). Diagnóstico da perícia criminal no Brasil. Brasília: Ministério da Justiça, Secretaria Nacional de Segurança Pública.
Giannelli, P. (2007). Confirmation bias. Criminal Justice, 22(3), 60-61.
Gonçalves, M. N. (2013). Impacto dos laudos de homicídio e de latrocínio junto aos operadores do direito e às sentenças judiciais: o caso da perícia criminal do Instituto de Criminalística no âmbito do Distrito Federal (Dissertação de mestrado). Escola Brasileira de Administração Pública e de Empresas, Fundação Getúlio Vargas, Rio de Janeiro.
A value based method for measuring performance... 555
Gregor, S., & Hevner, A. R. (2013). Positioning and presenting design science research for maximum impact. Management Information Systems Quarterly, 37(2), 337-355.
Houck, M., Speaker, P. J., Fleming, A. S., & Riley, R. A., Jr. (2012). The balanced scoredcard: sustainable performance assessment for forensic laboratories. Science & Justice, 52(4), 209-2016. PMid:23068771. http://dx.doi.org/10.1016/j.scijus.2012.05.006.
Jacobs, R., Smith, P., & Goddard, M. (2007). The development of composite indicators to measure health care performance. In A. Neely. Business performance measurement: unifying theory and integrating practice (pp. 383-407). Cambridge: Cambridge University Press.
Jesus, I. R., & Costa, H. G. (2014). A nova gestão pública como indutora das atividades de Engenharia de Produção nos órgãos públicos. Production, 24(4), 887-897.
Jesus, M. M. (2009). O crime de tortura e a justiça criminal: um estudo dos processos de tortura na cidade de São Paulo (Dissertação de mestrado). Universidade de São Paulo, São Paulo.
Johnston, R., & Clark, G. (2005). Service operations management: improving service delivery (2 ed.). London: Prentice Hall.
Kaplan, R. S., & Norton, D. P. (1996a). The balanced scorecard: translating strategy into action. Boston: Harvard Business Review Press.
Kaplan, R. S., & Norton, D. P. (1996b). Using balanced scored card as a strategic management system. Harvard Business Review, 74(1), 75-85.
King, W., & Maguire, E. (2009). Assessing the performance of systems designed to process criminal forensic evidence. Forensic Science Policy & Management, 1(3), 159-170. http://dx.doi.org/10.1080/19409041003611143.
Kobus, H., Houck, M., Speaker, P., Riley, R., & Witt, T. (2011). Managing performance in the forensic sciences: expectations in light of limited budgets. Forensic Science Policy & Management, 2(1), 36-43. http://dx.doi.org/10.1080/19409044.2011.564271.
Koppl, R. (2005). How to improve forensic science. European Journal of Law and Economics, 20(3), 255-286. http://dx.doi.org/10.1007/s10657-005-4196-6.
Lacerda, D. P., Dresch, A., Proença, A., & Antunes, J. V., Jr. (2013). Design science research: método de pesquisa para a engenharia de produção. Gestão & Produção, 20(4), 741-761. http://dx.doi.org/10.1590/S0104-530X2013005000014.
Lima, F. F., & Goldszmidt, R. G. (2013). Determinantes do desempenho em laudos de criminalística no Departamento de Polícia Federal: uma abordagem multinível. In F. Vasconcelos, R. Fontes Filho, & M. A. Tsunoda. Gestão pública: a perícia criminal em foco (pp. 107-130). Rio de Janeiro: FGV.
Lokkerbol, J., Does, R., Mast, J., & Schoonhoven, M. (2012). Improving processes in financial service organizations:
where to begin? International Journal of Quality & Reliability Management, 29(9), 981-999. http://dx.doi.org/10.1108/02656711211272881.
Malhotra, N. K. (2001). Pesquisa de marketing: uma orientação aplicada (N. Montingelli Jr., & A. A. Farias, Trads., 3 ed.). Porto Alegre: Bookman.
Martinez, S. C. (2013). A efetividade do laudo pericial: um estudo sobre a influência do laudo pericial de informática na decisão judicial (Dissertação de mestrado). Escola Brasileira de Administração Pública e de Empresas, Fundação Getúlio Vargas, Rio de Janeiro.
Matias-Pereira, J. (2010). Manual de gestão pública contemporânea (3 ed.). São Paulo: Atlas.
Misse, M. (2006). Avaliação da formação e da capacitação profissional dos peritos criminais no Brasil (Relatório final). Brasília: SENASP, Ministério da Justiça. Recuperado em 1 de julho de 2012, de http://www.mj.gov.br/Senasp/pesquisas_aplicadas/anpocs/proj_aprov/aval_form_capacit_michel.pdf
National Research Council. (2009). Strengthening forensic science in the United States: a path forward. Washington: National Academies Press. http://dx.doi.org/10.17226/12589.
Neely, A. (1999). The performance measurement revolution: why now and what next? International Journal of Operations & Production Management, 19(2), 205-228. http://dx.doi.org/10.1108/01443579910247437.
Neely, A., Bourne, M., Mills, J., Platts, K., & Richards, H. (2002). Getting the measure of your business: strategy and performance. Cambridge: Cambridge University Press.
Neely, A., Mills, J., Platts, K., Richards, H., Gregory, M., Bourne, M., & Kennerley, M. (2000). Performance measurement system design: developing and testing a process-based approach. International Journal of Operations & Production Management, 20(10), 1119-1145. http://dx.doi.org/10.1108/01443570010343708.
Neely, A., Richards, H., Mills, J., Platts, K., & Bourne, M. (1997). Designing performance measures: a structured approach. International Journal of Operations & Production Management, 17(11), 1131-1152. http://dx.doi.org/10.1108/01443579710177888.
Newman, J., Dawley, D., & Speaker, P. J. (2011). Strategic management of forensic laboratory resources: from project foresight metrics to the development of action plans. Forensic Science Policy & Management, 2(4), 164-174. http://dx.doi.org/10.1080/19409044.2012.693571.
Paim, R., Cardoso, V., Caulliraux, H., & Clemente, R. (2009). Gestão de processos: pensar, agir e aprender. Porto Alegre: Bookman.
Peffers, K., Tuunanen, T., Rothenberger, M. A., & Chatterjee, S. (2007). A design science research methodology for information systems research. Journal of Management Information Systems, 24(3), 45-77. http://dx.doi.org/10.2753/MIS0742-1222240302.
Rodrigues, C. V. et al.556 Gest. Prod., São Carlos, v. 24, n. 3, p. 538-556, 2017
Pidd, M. (2007). Perversity in public service performance measurement. In A. Neely. Business performance measurement: unifying theory and integrating practice (2 ed., pp. 408-429). Cambridge: Cambridge Univerrsity Press.
Pidd, M. (2012). Measuring performance of public services: principles and practice. Cambridge: Cambridge University Press.
Pike, S., & Roos, G. (2007). The validity of measurement frameworks: measurement theory. In A. Neely. Business performance measurement: unifying theory and integrating practice (2 ed., pp. 218-235). Cambridge: Cambridge University Press.
Poister, T. H. (2003). Measuring performance in public and nonprofit organizations. São Francisco: Jossey-Bass.
Rodrigues, C. V. (2010). Perícia criminal: uma abordagem de serviços (Tese de doutorado). Departamento de Engenharia de Produção, Universidade Federal de São Carlos, São Carlos.
Rodrigues, C. V., Silva, M. T., & Truzzi, O. M. S. (2010). Perícia criminal: uma abordagem de serviços. Gestão & Produção, 17(4), 843-857. http://dx.doi.org/10.1590/S0104-530X2010000400016.
Rogêdo, J. C. (2005). O crime de tortura policial em Belo Horizonte após a lei de tortura, nº 9455 de 7 de abril de 1997 (Dissertação de mestrado). Fundação João Pinheiro, Belo Horizonte.
Slack, N. (2005). Operations estrategy: will it ever realize its potential? Gestão & Produção, 12(3), 317-468. http://dx.doi.org/10.1590/S0104-530X2005000300004.
Slack, N., Chambers, S., & Johnston, R. (2009). Administração da produção (3 ed.). São Paulo: Atlas.
Speaker, P. J. (2009). Key performance indicators and managerial analysis for forensic laboratories. Forensic Science Policy & Management, 1(1), 32-42. http://dx.doi.org/10.1080/19409040802624075.
Starr, M. K. (2005). Changing agendas for operations management. Gestão & Produção, 12(3), 317-468. http://dx.doi.org/10.1590/S0104-530X2005000300003.
Toledo, J. C., Borrás, M. Á., Mergulhão, R. C., & Mendes, G. S. (2013). Qualidade: gestão e métodos. Rio de Janeiro: LTC.
Van Aken, J. E. (2004). Management research based on the paradigm of the Design Sciences: the quest for field-teste and grounded technological rules. Journal of Management Studies, 41(2), 219-246. http://dx.doi.org/10.1111/j.1467-6486.2004.00430.x.
Van Aken, J. E. (2005). Management research as a Design Science: articulating the research products of mode 2 Knowledge production in management. British Journal of Management, 16(1), 19-36. http://dx.doi.org/10.1111/j.1467-8551.2005.00437.x.
Van Aken, J. E., & Romme, G. (2009). Reinventing the future: adding design science to the repertoire of organization and management studies. Organizational Management Journal, 6(1), 5-12. http://dx.doi.org/10.1057/omj.2009.1.
Winter, R. (2008). Design science research in Europe. European Journal of Information Systems, 17(5), 470-475. http://dx.doi.org/10.1057/ejis.2008.44.
Zarifian, P. (2001). Valor, organização e competência na produção de serviço: esboço de um modelo de produção de serviço. In M. S. Salerno. Relação de serviço: produção e avaliação (pp. 95-149). São Paulo: SENAC.