7. IJEEE -Dielectric - Hemaunt Kumar
8
DIELECTRIC BEHAVIOUR OF COBALT FERRITE NANOPARTICLES HEMAUNT KUMAR 1 , R. C. SRIVASTAVA 2 , P. NEGI 3 , H. M. AGRAWAL 4 & K. ASOKAN 5 1,2,3,4 Department of Physics, G.B. Pant University of Ag. & Technology, Pantnagar, India 5 Inter University Accelerator Centre, New Delhi, India ABSTRACT The cobalt ferrite (CoFe 2 O 4 ) samples of different particle size were successfully prepared by nitrate route. The X-ray diffraction (XRD) patterns of all the samples show the single phase spinel structure of nanoparticles. The dielectric constant and loss tangent for the samples were determined as a function of frequency, and the frequency range was used from 75 kHz to 5 MHz. The dielectric constant and the loss tangent decreases rapidly with increasing frequency, and then reaches a constant value. Low dielectric constants materials are required for high – frequency application in electrical circuits, to reduce dielectric losses and skin effect. The high value of electrical resistivity in ferrite is suitable for the high frequency application where eddy current losses are appreciable. The resistivity is decreased with increase in temperature and the material behaves like a semiconductor. KEYWORDS: XRD, Dielectric Constant, Dielectric Loss and Electrical Resistivity INTRODUCTION Ferrite nanoparticles are important magnetic materials due to their specific magnetic and electric properties. They are widely used in high density magnetic recording, microwave devices and magnetic ferro-fluids [1]. Cobalt ferrite crystallizes in partially inverse spinel structure represented as (Co x 2+ Fe 1-x 3+ ) (Co 1-x 2+ Fe 1+X 3+ )O 4 , where x depends on thermal treatment and preparation conditions [2]. It is ferrimagnetic with a Cruie temperature (Tc) around 520 0 C and shows a relatively large magnetic hysteresis with distinguishes it from the rest of spinel ferrite [3]. Spinel ferrite nanoparticles have high electrical resistivity and low eddy current and dielectric losses. Cobalt ferrite is one of the potential candidates for magnetic and magneto-optical recording media [4-5]. Dielectric behaviour is one of the most significant properties of fer rites which de pend on the pr eparation conditions, sintering temperature, composition a nd the grain size [ 6- 7]. Giri et. al. [8] have observed structural disorder, enhanced optical absorption and high coerctivity with the reduction of grain size in nanocrystalline cobalt ferrite. Several reports are available on the electrical conductivity and dielectric properties of bulk cobalt ferrite [9-12]. Jonker [10] has studied the electrical properties of a series of bulk Co 3-X Fe X O4 ferrites and observed two region of conductivity. The hole hoping between Co 2+ and Co 3+ ions contributes to the low-conductivity regions and the electron hopping between Fe 2+ and Fe 3+ ions is found to be responsible for the high – conductivity region. Na et al. [11, 12] have reported the m echanism for electrical conduction for bulk CoFe 2 O 4 under various heat treatment conditions. They have also observed a decrease in the electrical resistivity with quenching temperature, which is mainly because of the decrease in grain boundary resistance in Fe-excess cobalt ferrites. EXPERIMENTAL In the present work we have synthesized nanoparticles of CoFe 2 O 4 using the chemical route. The stoichiometric amounts of Fe(NO 3 ) 3 .9H 2 O, and Co(NO 3 ) 2 .6H 2 O were dissolved in distilled water. In the aqueous salt solution, citric acid International Journal of Electrical and Electronics Engineering (IJEEE) ISSN 2278-9944 Vol. 2, Issue 1, Feb 2013, 59-66 © IASET
-
Upload
iaset-journals -
Category
Documents
-
view
214 -
download
0
Transcript of 7. IJEEE -Dielectric - Hemaunt Kumar

7/29/2019 7. IJEEE -Dielectric - Hemaunt Kumar
http://slidepdf.com/reader/full/7-ijeee-dielectric-hemaunt-kumar 1/8
DIELECTRIC BEHAVIOUR OF COBALT FERRITE NANOPARTICLES
HEMAUNT KUMAR 1, R. C. SRIVASTAVA2, P. NEGI3, H. M. AGRAWAL4 & K. ASOKAN5
1,2,3,4 Department of Physics, G.B. Pant University of Ag. & Technology, Pantnagar, India5Inter University Accelerator Centre, New Delhi, India
ABSTRACT
The cobalt ferrite (CoFe2O4) samples of different particle size were successfully prepared by nitrate route. The
X-ray diffraction (XRD) patterns of all the samples show the single phase spinel structure of nanoparticles. The dielectric
constant and loss tangent for the samples were determined as a function of frequency, and the frequency range was used
from 75 kHz to 5 MHz. The dielectric constant and the loss tangent decreases rapidly with increasing frequency, and thenreaches a constant value. Low dielectric constants materials are required for high – frequency application in electrical
circuits, to reduce dielectric losses and skin effect. The high value of electrical resistivity in ferrite is suitable for the high
frequency application where eddy current losses are appreciable. The resistivity is decreased with increase in temperature
and the material behaves like a semiconductor.
KEYWORDS: XRD, Dielectric Constant, Dielectric Loss and Electrical Resistivity
INTRODUCTION
Ferrite nanoparticles are important magnetic materials due to their specific magnetic and electric properties. They
are widely used in high density magnetic recording, microwave devices and magnetic ferro-fluids [1]. Cobalt ferrite
crystallizes in partially inverse spinel structure represented as (Cox2+Fe1-x
3+) (Co1-x2+Fe1+X
3+)O4, where x depends on
thermal treatment and preparation conditions [2]. It is ferrimagnetic with a Cruie temperature (Tc) around 520 0C and
shows a relatively large magnetic hysteresis with distinguishes it from the rest of spinel ferrite [3]. Spinel ferrite
nanoparticles have high electrical resistivity and low eddy current and dielectric losses. Cobalt ferrite is one of the potential
candidates for magnetic and magneto-optical recording media [4-5]. Dielectric behaviour is one of the most significant
properties of ferrites which depend on the preparation conditions, sintering temperature, composition and the grain size [6-
7]. Giri et. al. [8] have observed structural disorder, enhanced optical absorption and high coerctivity with the reduction of
grain size in nanocrystalline cobalt ferrite.
Several reports are available on the electrical conductivity and dielectric properties of bulk cobalt ferrite [9-12].
Jonker [10] has studied the electrical properties of a series of bulk Co3-XFeXO4 ferrites and observed two region of
conductivity. The hole hoping between Co2+ and Co3+ ions contributes to the low-conductivity regions and the electron
hopping between Fe2+ and Fe3+ ions is found to be responsible for the high – conductivity region. Na et al. [11, 12] have
reported the mechanism for electrical conduction for bulk CoFe2O4 under various heat treatment conditions. They have
also observed a decrease in the electrical resistivity with quenching temperature, which is mainly because of the decrease
in grain boundary resistance in Fe-excess cobalt ferrites.
EXPERIMENTAL
In the present work we have synthesized nanoparticles of CoFe2O4 using the chemical route. The stoichiometric
amounts of Fe(NO3)3.9H2O, and Co(NO3)2.6H2O were dissolved in distilled water. In the aqueous salt solution, citric acid
International Journal of Electrical andElectronics Engineering (IJEEE)ISSN 2278-9944Vol. 2, Issue 1, Feb 2013, 59-66© IASET
7/29/2019 7. IJEEE -Dielectric - Hemaunt Kumar
http://slidepdf.com/reader/full/7-ijeee-dielectric-hemaunt-kumar 2/8
60 Hemaunt Kumar, R. C. Srivastava, P. Negi, H. M. Agrawal & K. Asokan
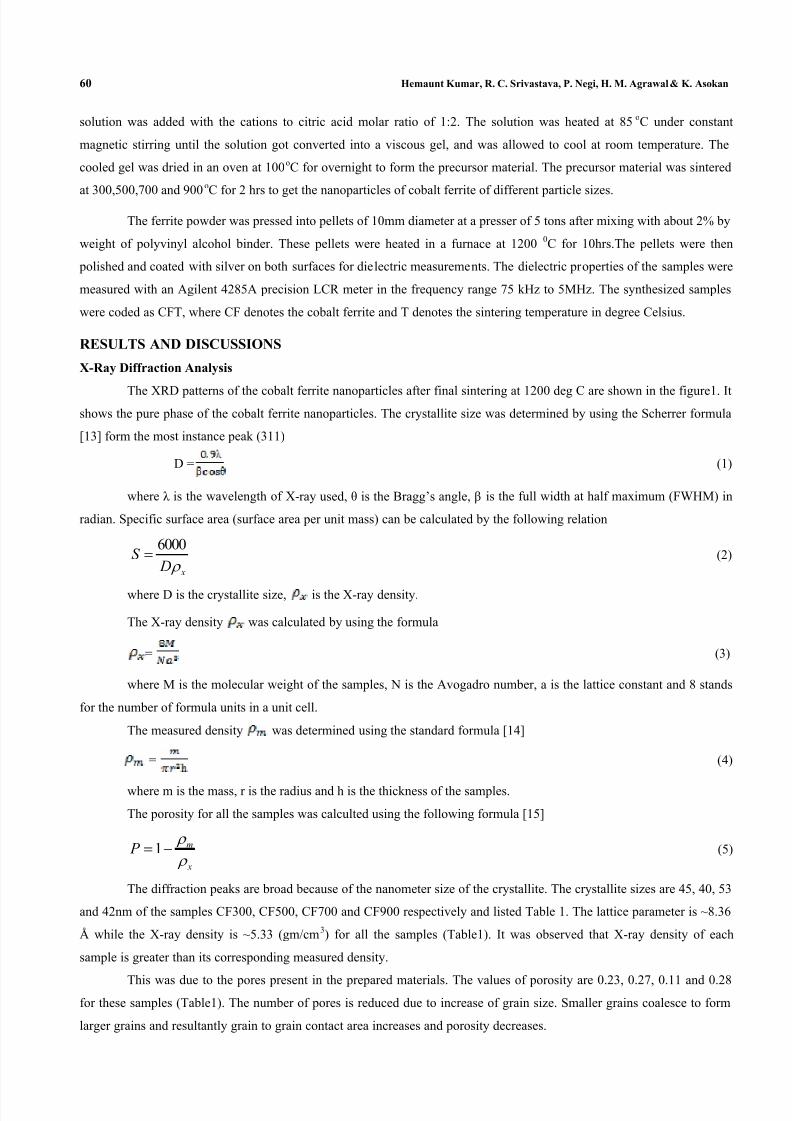
solution was added with the cations to citric acid molar ratio of 1:2. The solution was heated at 85 oC under constant
magnetic stirring until the solution got converted into a viscous gel, and was allowed to cool at room temperature. The
cooled gel was dried in an oven at 100oC for overnight to form the precursor material. The precursor material was sintered
at 300,500,700 and 900
o
C for 2 hrs to get the nanoparticles of cobalt ferrite of different particle sizes.
The ferrite powder was pressed into pellets of 10mm diameter at a presser of 5 tons after mixing with about 2% by
weight of polyvinyl alcohol binder. These pellets were heated in a furnace at 1200 0C for 10hrs.The pellets were then
polished and coated with silver on both surfaces for dielectric measurements. The dielectric properties of the samples were
measured with an Agilent 4285A precision LCR meter in the frequency range 75 kHz to 5MHz. The synthesized samples
were coded as CFT, where CF denotes the cobalt ferrite and T denotes the sintering temperature in degree Celsius.
RESULTS AND DISCUSSIONS
X-Ray Diffraction Analysis
The XRD patterns of the cobalt ferrite nanoparticles after final sintering at 1200 deg C are shown in the figure1. Itshows the pure phase of the cobalt ferrite nanoparticles. The crystallite size was determined by using the Scherrer formula
[13] form the most instance peak (311)
D = (1)
where λ is the wavelength of X-ray used, θ is the Bragg’s angle, β is the full width at half maximum (FWHM) in
radian. Specific surface area (surface area per unit mass) can be calculated by the following relation
x D
S
6000 (2)
where D is the crystallite size, is the X-ray density.
The X-ray density was calculated by using the formula
= (3)
where M is the molecular weight of the samples, N is the Avogadro number, a is the lattice constant and 8 stands
for the number of formula units in a unit cell.
The measured density was determined using the standard formula [14]
= (4)
where m is the mass, r is the radius and h is the thickness of the samples.
The porosity for all the samples was calculted using the following formula [15]
x
m P
1 (5)
The diffraction peaks are broad because of the nanometer size of the crystallite. The crystallite sizes are 45, 40, 53
and 42nm of the samples CF300, CF500, CF700 and CF900 respectively and listed Table 1. The lattice parameter is ~8.36
Å while the X-ray density is ~5.33 (gm/cm3) for all the samples (Table1). It was observed that X-ray density of each
sample is greater than its corresponding measured density.
This was due to the pores present in the prepared materials. The values of porosity are 0.23, 0.27, 0.11 and 0.28for these samples (Table1). The number of pores is reduced due to increase of grain size. Smaller grains coalesce to form
larger grains and resultantly grain to grain contact area increases and porosity decreases.

7/29/2019 7. IJEEE -Dielectric - Hemaunt Kumar
http://slidepdf.com/reader/full/7-ijeee-dielectric-hemaunt-kumar 3/8
Dielectric Behaviour of Cobalt Ferrite Nanoparticles 61
Figure1: XRD Patterens of the Samples
Table1: Calculated XRD Parameters and Porosity of the Samples
SampleCrystallite
SizeD (nm)
LatticeParameter
a (Å )
X-Ray Density(gm/cm3)
SpecificSurface Area
S (m2/gm)
MeasuredDensity
(gm/cm3)
Porosity(P)
CF300 45±1 8.36±0.01 5.33±0.02 25±1 4.05 0.23CF500 40±1 8.37±0.01 5.33±0.02 28±1 3.87 0.27CF700 53±1 8.36±0.01 5.34±0.02 21±1 4.74 0.11CF900 42±1 8.36±0.01 5.33±0.02 27±1 3.83 0.28
Dielectric Constant Behaviour
The dielectric constant of cobalt ferrite was determined using the formula [16]
(6)
where C is the capacitance of the pellets, d is the thickness of the pellets; A is the cross-sectional area of the flat
surface of the pellets in m2 and0
is the permittivity of free space. The dielectric constants measurement was done in the
range 75 kHz to 5MHz using Agilent 4285A precision LCR meter. The values for dielectric constant at different frequency
and temperature are listed in the Table2. The graphs of dielectric constant against frequency are depicted in Fig.2 (a-d).
Dielectric constant is highest at the frequency of 75 kHz and it decreases with the increase of frequency in all the samples.
This dependence upon frequency is because of the interfacial polarization as predicted by Maxwell-Wagner [17].According to this model, the dielectric structure of a ferrite material is assumed to be made up of two layers; the first layer
being a conductive layer that consists of large ferrite grains and the other being the grain boundaries that are poor
conductors. Rabinkin and Novikova [18] showed that the polarization in ferrites is through a mechanism similar to the
conduction process. Due to the electron exchange between Fe+2 and Fe+3 the local displacement of the electrons in the
direction of the applied field occurs and these electrons determine the polarization. The large value of dielectric constant at
lower frequency may be due to the predominance of species like Fe +2 ions, oxygen vacancies, grain boundary defects, etc.
The decrease in dielectric constant with frequency is obvious because of the fact that any effect contributing to polarization
is found to show lagging behind the applied field at higher and higher frequencies. By increasing the frequency beyond a
certain frequency limit, the electron hopping cannot follow the electric field fluctuations causing a decrease in the
dielectric constant. Koop [19] argued that the dielectric constant at low frequency comes from the grain boundaries which
have a high dielectric constant due high resistivity at the grain boundary region. The dielectric constant at high frequency
7/29/2019 7. IJEEE -Dielectric - Hemaunt Kumar
http://slidepdf.com/reader/full/7-ijeee-dielectric-hemaunt-kumar 4/8
62 Hemaunt Kumar, R. C. Srivastava, P. Negi, H. M. Agrawal & K. Asokan
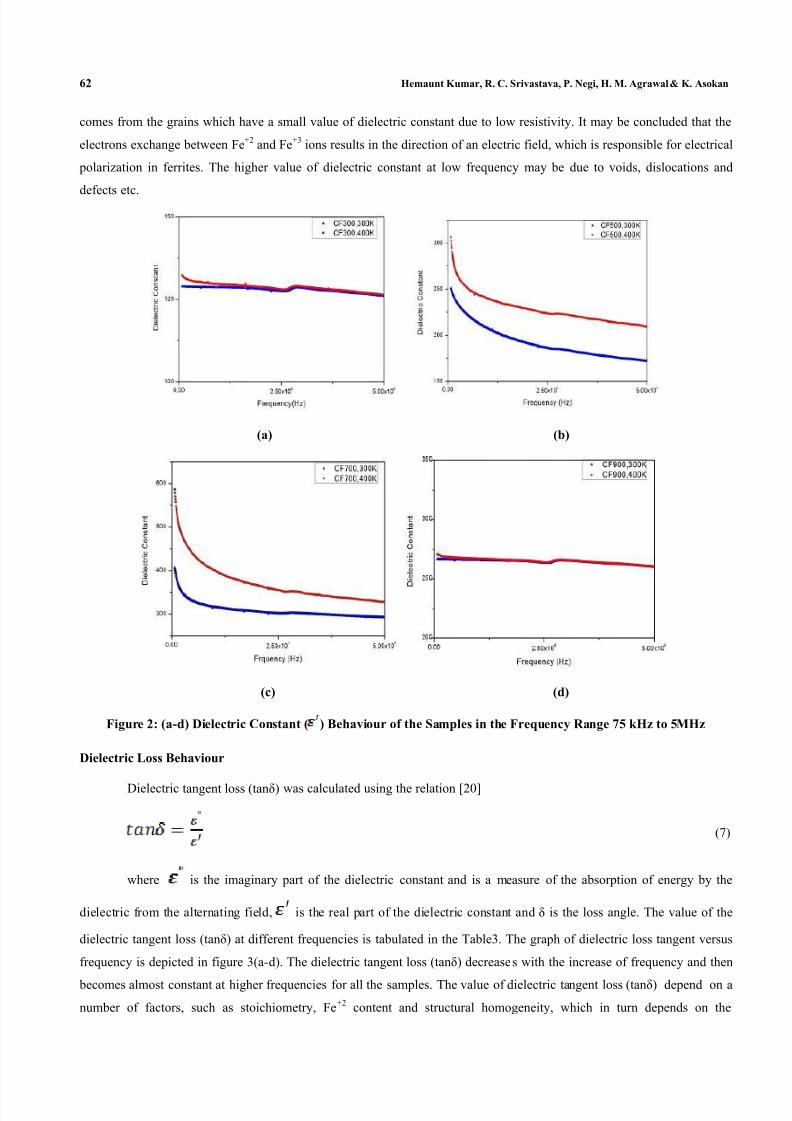
comes from the grains which have a small value of dielectric constant due to low resistivity. It may be concluded that the
electrons exchange between Fe+2 and Fe+3 ions results in the direction of an electric field, which is responsible for electrical
polarization in ferrites. The higher value of dielectric constant at low frequency may be due to voids, dislocations and
defects etc.
(a) (b)
(c) (d)
Figure 2: (a-d) Dielectric Constant ( ) Behaviour of the Samples in the Frequency Range 75 kHz to 5MHz
Dielectric Loss Behaviour
Dielectric tangent loss (tanδ) was calculated using the relation [20]
(7)
where is the imaginary part of the dielectric constant and is a measure of the absorption of energy by the
dielectric from the alternating field, is the real part of the dielectric constant and δ is the loss angle. The value of the
dielectric tangent loss (tanδ) at different frequencies is tabulated in the Table3. The graph of dielectric loss tangent versus
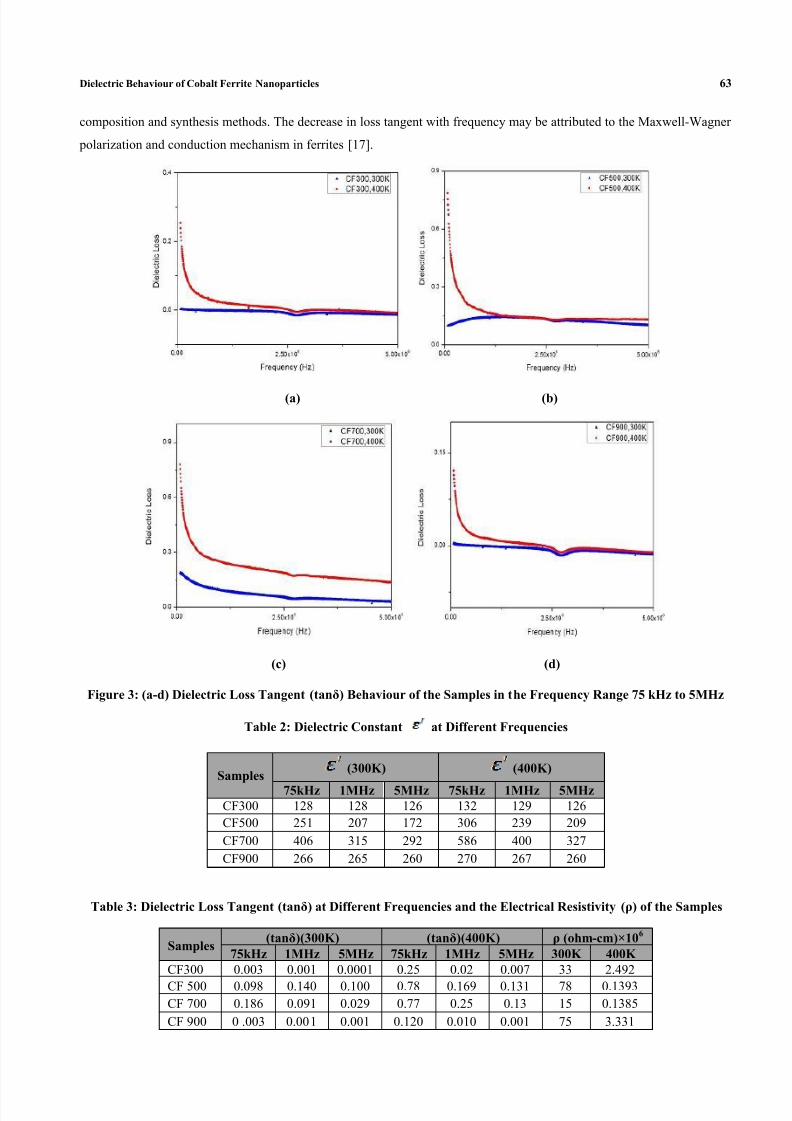
frequency is depicted in figure 3(a-d). The dielectric tangent loss (tanδ) decreases with the increase of frequency and then
becomes almost constant at higher frequencies for all the samples. The value of dielectric tangent loss (tanδ) depend on a
number of factors, such as stoichiometry, Fe+2 content and structural homogeneity, which in turn depends on the
7/29/2019 7. IJEEE -Dielectric - Hemaunt Kumar
http://slidepdf.com/reader/full/7-ijeee-dielectric-hemaunt-kumar 5/8
Dielectric Behaviour of Cobalt Ferrite Nanoparticles 63
composition and synthesis methods. The decrease in loss tangent with frequency may be attributed to the Maxwell-Wagner
polarization and conduction mechanism in ferrites [17].
(a) (b)
(c) (d)
Figure 3: (a-d) Dielectric Loss Tangent (tanδ) Behaviour of the Samples in the Frequency Range 75 kHz to 5MHz
Table 2: Dielectric Constant at Different Frequencies
Samples(300K) (400K)
75kHz 1MHz 5MHz 75kHz 1MHz 5MHzCF300 128 128 126 132 129 126CF500 251 207 172 306 239 209
CF700 406 315 292 586 400 327
CF900 266 265 260 270 267 260
Table 3: Dielectric Loss Tangent (tanδ) at Different Frequencies and the Electrical Resistivity (ρ) of the Samples
Samples(tanδ)(300K) (tanδ)(400K) ρ (ohm-cm)×106
75kHz 1MHz 5MHz 75kHz 1MHz 5MHz 300K 400K CF300 0.003 0.001 0.0001 0.25 0.02 0.007 33 2.492
CF 500 0.098 0.140 0.100 0.78 0.169 0.131 78 0.1393CF 700 0.186 0.091 0.029 0.77 0.25 0.13 15 0.1385
CF 900 0 .003 0.001 0.001 0.120 0.010 0.001 75 3.331

7/29/2019 7. IJEEE -Dielectric - Hemaunt Kumar
http://slidepdf.com/reader/full/7-ijeee-dielectric-hemaunt-kumar 6/8
64 Hemaunt Kumar, R. C. Srivastava, P. Negi, H. M. Agrawal & K. Asokan
Electrical Resistivity
The electrical resistivity was calculated using this formula
L
A
R (8)
where L is the width, R is the resistance and A is the area of the pellet. The value of electrical resistivity at 300K
and 400K is tabulated in the Table3. The graph of current versus voltage is depicted in figure 4(a-d). The value of electrical
resistivity is high at room temperature and it decreases with increase in temperature. Since the resistivity is decreased with
temperature the material behaves as a semiconductor. The electrical resistivity depends upon the crystal structure and
composition of the materials.
(a) (b)
(c) (d)
Figure 4: (a-d) Current versus Voltage Relationship for the Samples
CONCLUSIONS
The cobalt ferrite (CoFe2O4) samples of different particle size were successfully prepared by nitrate route. The X-
ray diffraction (XRD) patterns of all the samples show the single phase spinel structure of nanoparticles. The dielectric
constant and the loss decreases rapidly with increasing frequency, and then reaches a constant value. Low dielectric
constants materials are required for high – frequency application in electrical circuits, to reduce dielectric losses and skineffect. The high value of electrical resistivity in ferrite is suitable for the high frequency application where eddy current
losses are appreciable. The resistivity is decreased with increase in temperature and the material behaves like a
semiconductor.

7/29/2019 7. IJEEE -Dielectric - Hemaunt Kumar
http://slidepdf.com/reader/full/7-ijeee-dielectric-hemaunt-kumar 7/8
Dielectric Behaviour of Cobalt Ferrite Nanoparticles 65
REFERENCES
1. Goldman, Mordern ferrite Technology, Van Nostrand Reinhold, New York, 1990.
2. K. Haneda , A .H. Morrish, J. Appl. Phys. 63 (8) (1988).
3. M. Rajendram, R.C. Pullar, A.K. Bhattacharya, D. Das, S.N. Chintalapudi, C.K. Majumdar , J.Mang. Mang.
Matter. 232 (2001) 71-83.
4. Suzuki Y, van Dover R B , Gyorgy E M . Philips J M, Korenivski J, werder J. Chen C H , Cava R J, Krajewski J
J, Peck W F and Do K B 1996 Appl. Phys. Lett. 68 714.
5. Fontijin W F J, van der Zaag P J, Feiner L F, Metselaar R and Devillers M A C 1999 J. Appl. Phys. 85 5100.
6. Verwey E J W, Haaijman P W, Romeyn F C and Van Oosterhout G M 1950 Phil. Res. Rep. 5 173.
7. Ponpandian N, Balaya P and Narayanasamy A 2002 J. Phys. Condens. Matter 14 3221.
8. Giri A K, Kirkpatrick E M , Moongkhamklang P, Majetich S A and Harris V G 2002 Appl. Phys. Lett. 80 2341.
9. Mahajan P R, Patankar K K, Kothale M B , Chaudhari S C, Mathe V L and Patil S A 2002 Pramana 58 1115.
10. Jonker G H 1959 J. Phys. Chem. Solids 9 165.
11. Na J G, Lee T D and Park S J 1992 IEEE Trans. Magn. 28 2433.
12. Na J G, Kim M C, Lee T D and Park S J 1993 IEEE Trans. Magn. 29 3520.
13. D. Cullity (1978) Elements of X-ray Diffraction, London: Addison- Wesley.
14. Gul,I.H., Amin, F., Abbasi, A.Z., Anis-ur-Rehman, M., Maqsood, A. Scr.Mater. 56, 497-500 (2007).
15. Gul, I.H., Abbasi, A. Z., Amin, F., Anis-ur-Rehman, M., Maqsood, A., J. Magn. Magn. Matter.311, 494499
(2007).
16. Brockman, F.G., Dowling, P.H., Steneck, W.G.: Phys. Rev.75, 1440(1949).
17. Wanger, K.W.: Ann. Phys. 40, 817(1913).
18. Rabinkin, I.T., Novikova, Z.I.: Ferrites. Izv. Acad. Nauk USSr, Minsk (1960), pp146.
19. Tasawar J., Asghari M., Akhlaq A. M., J. Supercond Nov Magn (2011) 24, 2137 (2011).
20. Maqsood, A., Khan, K.: J. Alloys Compd. 509, 3393-3397 (2011).

7/29/2019 7. IJEEE -Dielectric - Hemaunt Kumar
http://slidepdf.com/reader/full/7-ijeee-dielectric-hemaunt-kumar 8/8
![Home [ccovadodarazone.gov.in]ccovadodarazone.gov.in/wp-content/uploads/2018/07/35... · 2018. 7. 10. · sangh priya gautam deepak kumar manoj kumar gupta nilklesh kumar manish kumar](https://static.fdocument.pub/doc/165x107/601439975b2c2534a80e49db/home-2018-7-10-sangh-priya-gautam-deepak-kumar-manoj-kumar-gupta-nilklesh.jpg)