2014 Town of Raymond Report - Tel: 207-655-4742 Fax: 207 ... · 2014 Town of Raymond ... Pan...
60
6 City Center, Suite 200 • Portland, Maine 04101 207.871.8622 www.panatlanticsmsgroup.com REPORT TO THE TOWN OF RAYMOND 2014 Town of Raymond Citizen Survey December 2014
Transcript of 2014 Town of Raymond Report - Tel: 207-655-4742 Fax: 207 ... · 2014 Town of Raymond ... Pan...
6 City Center, Suite 200 • Portland, Maine 04101207.871.8622
www.panatlanticsmsgroup.com
REPORT TOTHE TOWN OF RAYMOND
2014 Town of Raymond Citizen Survey
December 2014

Table of Contents
BACKGROUND, OBJECTIVES, & METHODOLOGY…………………………………………………………………........................ 3
EXECUTIVE SUMMARY………………………………………………………………………………………………........................ 9
SURVEY RESULTS AND ANALYSIS
OVERALL PERCEPTIONS OF THE TOWN OF RAYMOND………………………………………………………………..... 14
PUBLIC SAFETY…………………………….…………………………………............................................................................ 18
PUBLIC WORKS / TOWN MAINTENANCE…………………………………………………………………........................ 23
TOWN MANAGEMENT & TOWN CODES AND ORDINANCES……………………………………..…………………… 27
COMMUNICATIONS………………………………………………………………………….................................................. 31
OTHER ISSUES……………………………………............................................................................................................................. 38
COMPARISON TO OTHER TOWNS / CITIES……..……………...................................................................................................... 47
RESPONDENT PROFILE…………………………………………………………………………………………………………… 52
APPENDIX A: SURVEY INSTRUMENT
2

Background, Objectives, & Methodology

BACKGROUND, OBJECTIVES, AND METHODOLOGY
Background
In the late summer of 2014, Pan Atlantic SMS Group, a full-service market research and consulting firm in its 30th yearof successful operation, located in Portland, was commissioned by the Town of Raymond to conduct a quantitativeresearch project with residents of the Town.
The key overall objective of the research is to assess perceptions of and satisfaction with the Town and its delivery ofservices, as well as to evaluate the future needs of its residents.
Profile of the Town of Raymond
The Town of Raymond is located in Cumberland County on the northeastern shore of Sebago Lake in the heart ofMaine’s Lakes Region. Raymond is bordered by the towns of Windham, Gray, Poland, and Casco, as well as servingas the mainland connection for the Town of Frye Island via the ferry landing on Raymond Cape. Raymond isapproximately twenty miles distant from both Portland, Maine’s largest city, and the second largest population center ofLewiston-Auburn.1
Raymond is a four season recreational destination with a threefold increase in population from the year round U.S.Census Bureau count of 4,436 to approximately 12,000 in the summer. It is a prime location for luxury second homesand more rustic traditional camps, as well as having several large children’s summer camps. It is estimated that theSebago Lake region receives 450,000 to 500,000 annual overnight visitors, capturing 2.6% of the State’s 17.8 millionannual visitors. Raymond is considered to be one of the top reasons to visit the area, with six pristine lakes and pondsand scenic mountain views within its boundaries, attracting many day visitors.1
The Town has a relatively high median income level, ranking 17th out of 522 in the State at $67,917. The healthy livingenvironment, combined with easy commuting distance to nearby cities and transportation centers, makes Raymond anattractive area for growing families and for doing business.1
41 Town of Raymond RFP document
Objectives
The primary objective of this research is to determine residents’ perceptions of and levels of satisfaction withthe Town, including its various departments and government, as well as the future needs of residents.Information collected will be used by the Town’s Select Board and administration to assist in guiding decisionmaking on policy choices going forward.
In order to reach this objective, the survey developed focused on the following key issues / areas:
Overall perceptions of and quality of life in Raymond
Satisfaction levels with the following Town departments:
o Public Safety
o Public Works / Town Maintenance
o Town Management
o Town Codes and Ordinances
Use of and satisfaction with the Town’s citizen communication tools
Satisfaction with Regional School Unit #14 (RSU #14)
Level of interest in exploring various other services and enhancements
Major needs and priorities for Raymond in the next 10 years
Demographic questions
5
BACKGROUND, OBJECTIVES, AND METHODOLOGY
Methodology
Research was conducted using a hybrid methodology:
A four page mail survey (with postage paid response envelopes) was sent to Raymond households using a voterregistration list and list of property owners (this list was de-duped so that only one survey was sent out to eachhousehold – a total of 2,871 households were mailed the survey).
At the Town’s request, an online version of the survey was posted on the Town’s website for those who would preferto take the survey electronically. The survey was set to allow only one response per electronic device, as a measureto prevent respondents from taking the survey multiple times, though this was not anticipated to be a significantissue. In addition, it should be noted that only a small fraction (10.3%) of the surveys were completed online. Thecross-tabulations in Appendix B show the data broken down by method of completing the survey (mail surveys vs.online surveys), and differences in responses by mode of survey participation are noted throughout the report.However, results between these two modes are very similar overall, with statistically significant differences seen on11 of the 51 closed end, non-demographic questions, 5 of which were in the communications section (e.g. those whoresponded online tend to use the internet, applications for mobile devices, and video streaming services morefrequently than those who responded via mail survey).
This methodology was chosen in order to ensure that all residents of the Town had reasonable access to the survey andwere given an opportunity to voice their opinions, as well as to encourage a strong and statistically valid (with low marginof error) response. This methodology has been used successfully by many municipalities in Maine and elsewhere in theU.S. and is a widely accepted research tool.
A total of 320 completed surveys was targeted in order to achieve a margin of error of ± 5.0% at the 95% confidencelevel. However, the survey received a very high level of response, with a total of 572 surveys completed (513 mailsurveys were completed and returned to Pan Atlantic SMS Group, and 59 surveys were completed online). Thisrepresents a response rate of approximately 20%, which is very high for a project of this nature and shows a high levelof interest in participating by the Raymond community. With the total sample of 572, the margin of error for the surveyresults is ± 3.83% at the 95% confidence level.
6
BACKGROUND, OBJECTIVES, AND METHODOLOGY

Methodology
Surveys were mailed out to residents on October 29th, 2014. In addition, a link to the survey was posted to the Town website on this date. The survey was closed on November 21st, 2014.
The survey instrument used was developed by Pan Atlantic SMS Group in conjunction with a team of Raymond personnel. Several drafts were reviewed, and the final survey instrument used was approved by the Raymond survey project team, as well as the Select Board. (Please see a copy of the final survey instrument used in Appendix A).
Results were tabulated and analyzed using standard statistical methods. A complete set of statistical cross-tabulations is included in Appendix B of this report. Data is presented for thirteen demographic and behavioral variables.
The total results of this study command statistical validity to the 95 percent confidence interval level with a margin of error of plus or minus 3.83%. In other words, if the study were to be replicated, 95 times out of 100 the results would be within 3.83 percentage points of the results achieved for the current survey. The margins of error for specific sub-samples tend to be higher.
The following report presents an analysis of survey findings.
Mean ratings are given throughout this report. In each case, the scale used is a 5-point scale, where 1 is low and 5 is high (the question wording at the top of each page gives the specific anchor points for each of these scale questions).
Any statistically significant differences in viewpoints by population segments, such as age groups, households with or without children, survey completed via mail or online, etc., are noted throughout the report.
7
BACKGROUND, OBJECTIVES, AND METHODOLOGY

Methodology
It is important to note that the utility of the results of a specific question can be affected by the percentage of respondents answering “don’t know” or not providing a response to the question. While it may provide interesting data in and of itself, a response of “don’t know” cannot be categorized. The result is a reduction in the sample size for particular questions, which can have an effect on the utility of the data if the “don’t know” / non-response level is high enough. When a sample size is reduced, the data becomes less useful in terms of how it can be generalized to the population. A representative sample is used to approximate the attitudes and opinions of the population at large, but as a given sub-sample gets smaller, it becomes less appropriate to extend findings from that sub-sample to the overall population. In addition, “don’t know” responses / non-responses cannot be included in mean response calculations. Therefore, care should be taken in considering the percentages involved for each question in this report.
Please note that figures may not always add up to 100% due to the rounding of decimals and, in some cases, the ability to provide multiple responses to an individual question.
Two open-ended questions, regarding reasons for satisfaction / dissatisfaction with Regional School Unit #14 (RSU #14) and the major needs and priorities for Raymond in the next 10 years, were included in the survey. Major themes from these open-ended questions are reported on in this report.
8
BACKGROUND, OBJECTIVES, AND METHODOLOGY
Executive Summary

Though there is some variation with regard to 1) perceptions of the Town and 2) satisfaction levels with the various Town departments and government, with mean ratings falling anywhere in the “average” to “excellent” and “neutral” to “very satisfied” ranges, Raymond performs well overall. With the exception of satisfaction with RSU #14, the mean satisfaction and quality ratings do not drop significantly below the “average” / “neutral” mark (3.00) for the 31 factors rated, and indeed 12 factors rate over the 4.00 mark.
Overall Perceptions of the Town of Raymond
Raymond has a “good” overall perception, with a mean rating of 3.87 and 75.7% of respondents rating their overall perception of Raymond as either “good” or “excellent.”
The perceptions of Raymond both as a place to raise children and a place to retire / live as adults (without children) are also strong (mean ratings of 3.94 and 3.71, close to a “good” overall mean score of 4.00).
Opportunities to participate in community matters and overall confidence in Raymond’s elected officials come in somewhat lower, in the “average” to “good” range, while overall confidence in appointed members of Raymond’s Planning Board and Zoning Board of Appeals and overall opportunities for adult education and enrichment come in about “average.”
Public Safety
Satisfaction ratings of the Public Safety factors tested are very strong across the board, with mean ratings between 3.98 and 4.58, placing them in the “somewhat” to “very satisfied” range.
The level of friendliness and professionalism of fire and rescue personnel, the overall quality of fire and rescue services, and how quickly fire and rescue personnel respond rate the highest, but the overall feeling of safety in the Town, the responsiveness of Cumberland County Sheriff’s policing services, and outreach / education by the Fire Department also performed very well.
With regard to policing services “in the future,” four in ten (41.4%) respondents favor continuing to have policing services provided by the Cumberland County Sheriff’s Office, while a quarter said they would need more information to respond to the question, 9% would favor contracting for enhanced services with the Cumberland County Sheriff’s Office, and 5% would favor having Raymond provide policing services through its own police department. Nineteen percent did not offer a response.
EXECUTIVE SUMMARY
10

Public Works / Town Maintenance
Raymond rates highly with regard to satisfaction with the level and quality of trash and curbside services, overall response and service levels during storm conditions, and overall availability and quality of public recreation areas (mean ratings between 4.09 and 4.38).
Responsiveness of Public Works to address problems, the overall condition and quality of state-maintained roads, and overall condition and quality of town-maintained roads rate lower comparatively, with mean ratings in the 3.60 to 3.74 range.
Town Management & Town Codes and Ordinances
Satisfaction with Raymond’s Town Management and Town Codes and Ordinances is strong, with mean ratings between 3.84 and 4.47 for the 6 factors tested.
In this area of inquiry, Raymond’s satisfaction is highest for the transaction length of doing business in person at the Town Office and Town Office customer service (mean ratings of 4.47 and 4.39 respectively). These are very good scores.
Though not quite as high, satisfaction ratings for the responsiveness of the Town’s personnel and department heads to phone calls or e-mails, the Town Manager’s Office, the timeliness and ease of the Town’s permitting process, and the overall enforcement of Town codes and ordinances are also strong (mean ratings between 3.84 and 4.04).
Communications
Respondents state that the internet and social media are the most frequently used communications tools to get important information, followed by print publications, the telephone, cable TV or public / local access channel, and applications for mobile devices. Radio and video streaming services are the least frequently used of the communications tools tested.
Respondents were asked to rate Raymond on its use of five tools to communicate with residents regarding Town news and other Town information. Raymond’s Town website (www.raymondmaine.org) / Facebook page rate the highest on this metric (mean rating of 3.61). Raymond’s use of online live streaming video, the phone system, and cable TV / public access channels rate in the “average” to “good” range, while its use of the radio to communicate with residents rates just below “average.”
EXECUTIVE SUMMARY
11

Satisfaction with RSU #14
Satisfaction with RSU #14 is low, with only 18.0% of respondents saying that they are “somewhat” or “very satisfied.” About a third of respondents (33.2%) are “somewhat” or “very dissatisfied,” and amongst those with children in the household, dissatisfaction is even higher (49.5% are “somewhat” or “very dissatisfied”).
Top reasons for dissatisfaction are perceptions that the partnership is lopsided in nature, resulting in lack of control, higher costs, and a lower quality of education.
Level of Support for Raymond Further Exploring Various Services or Enhancements
The project with the greatest level of support of the 11 tested is “expanding conservation efforts (additional funding for support groups such as the Raymond Waterways Protective Association (RWPA) or milfoil eradication efforts).” Half of respondents (48.8%) “strongly support” exploring this, with an additional quarter (24.7%) “somewhat supporting” it (73.5% total; mean rating of 4.12).
Other projects garnering fairly strong levels of support are “expanding funding for the Raymond Village Library,” “expanding economic development efforts,” “investigating options for alternative high speed internet service and / or providers (e.g. fiber optics),” “updating the Comprehensive Plan that expires this year,” and “contracting for bulky waste removal services” (mean ratings between 3.65 to 3.83).
When asked what level of tax increase would be tolerable to support potentially pursuing any of these services or enhancements, over a third of respondents said that they would not find any tax increase tolerable. An additional 5.4% would not favor pursuing any additional services, facilities, infrastructure, or other projects. Of the 54.2% who might find some level of tax increase tolerable, 16.8% would find a one percent increase tolerable, 14.5% said two percent, 9.3% said three percent, 4.4% said four percent, 5.9% said five percent, 2.3% said six to ten percent, and 1.0% said more than ten percent.
EXECUTIVE SUMMARY
12
Major Needs and Priorities in the Next 10 Years
The top themes that emerged with regard to the major needs or priorities for Raymond in the next 10 years are 1) keeping taxes low, 2) improving local infrastructure, namely improving and paving local roads, 3) leaving RSU #14 and improving and expanding Raymond’s educational system, 4) economic development, and 5) preserving and improving open space, lakes, and other natural resources, including fighting invasive plant species.
The need for economic development and preserving and improving open space, lakes, and other natural resources was also cited in responses to the aided question about potential services or enhancements that Raymond might explore -61% of respondents supported further exploration of “expanding economic development efforts” and 74% supported further exploration of “expanding conservation efforts.”
EXECUTIVE SUMMARY
13

Overall Perceptions of the Town of Raymond
Survey Results & Analysis
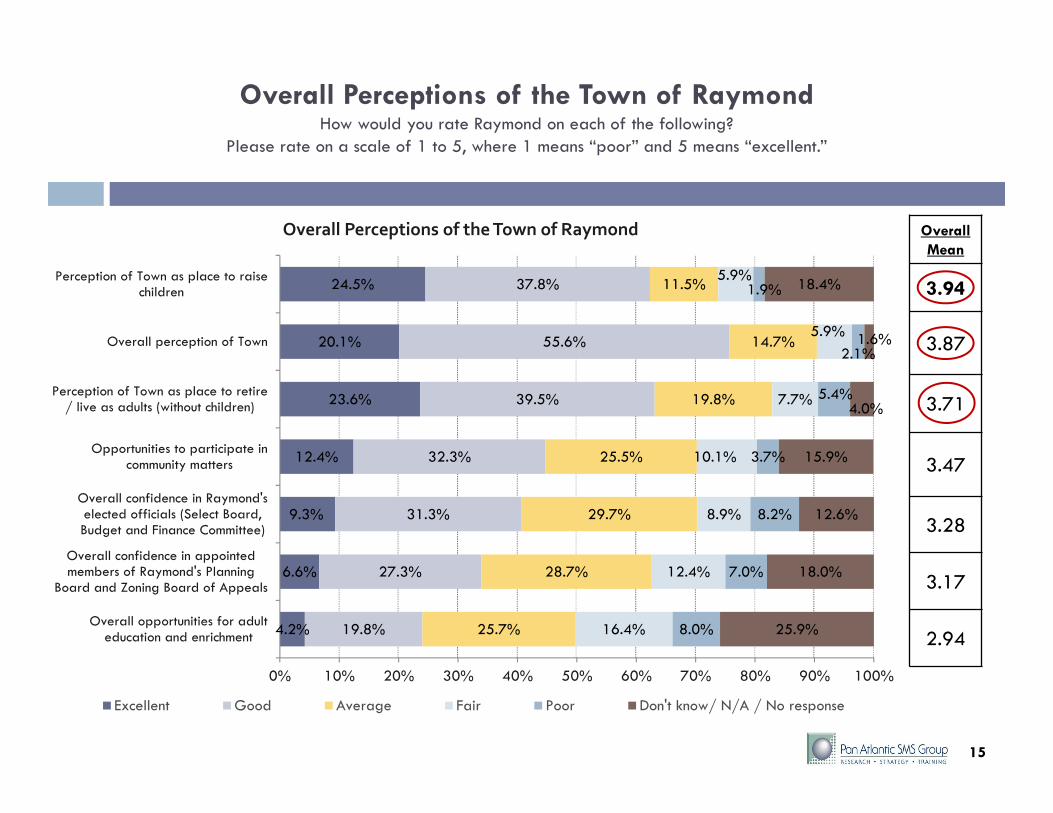
Overall Perceptions of the Town of RaymondHow would you rate Raymond on each of the following?
Please rate on a scale of 1 to 5, where 1 means “poor” and 5 means “excellent.”
15
4.2%
6.6%
9.3%
12.4%
23.6%
20.1%
24.5%
19.8%
27.3%
31.3%
32.3%
39.5%
55.6%
37.8%
25.7%
28.7%
29.7%
25.5%
19.8%
14.7%
11.5%
16.4%
12.4%
8.9%
10.1%
7.7%
5.9%
5.9%
8.0%
7.0%
8.2%
3.7%
5.4%
2.1%
1.9%
25.9%
18.0%
12.6%
15.9%
4.0%
1.6%
18.4%
0% 10% 20% 30% 40% 50% 60% 70% 80% 90% 100%
Overall opportunities for adulteducation and enrichment
Overall confidence in appointedmembers of Raymond's Planning
Board and Zoning Board of Appeals
Overall confidence in Raymond'selected officials (Select Board,Budget and Finance Committee)
Opportunities to participate incommunity matters
Perception of Town as place to retire/ live as adults (without children)
Overall perception of Town
Perception of Town as place to raisechildren
Overall Perceptions of the Town of Raymond
Excellent Good Average Fair Poor Don't know/ N/A / No response
Overall Mean
3.94
3.87
3.71
3.47
3.28
3.17
2.94

16
Raymond has a “good” overall perception, with a mean rating of 3.87 and 75.7% of respondents rating their overall perception of Raymond as either “good” or “excellent.” Only 7.8% have a “fair” or “poor” overall perception of Raymond.
The perceptions of Raymond both as a place to raise children and a place to retire / live as adults (without children) are also strong (mean ratings of 3.94 and 3.71, close to a “good” overall rating of 4.00).
Opportunities to participate in community matters and overall confidence in Raymond’s elected officials (Select Board, Budget and Finance Committee) rate in the “average” to “good” range (mean ratings of 3.47 and 3.28).
Overall confidence in appointed members of Raymond’s Planning Board and Zoning Board of Appeals and overall opportunities for adult education and enrichment are about “average” (mean ratings of 3.17 and 2.94).
Between 13% and 26% of respondents “don’t know” how to rate 5 of the 7 factors tested.
To see how ratings of the overall perceptions of Raymond vary by demographic subgroup, please see the table on the next page.
Overall Perceptions of the Town of RaymondHow would you rate Raymond on each of the following?
Please rate on a scale of 1 to 5, where 1 means “poor” and 5 means “excellent.”

17
Overall Perceptions of the Town of Raymond: Differences in Mean Ratings by Demographic Subgroup
Higher Lower
Perception of Town as place to raise children
Household income $50K-100K (4.09); less than $50K (3.99)Females (4.04)Children in household (4.15)Year-round residents (4.00)Voted in June Elections (4.04)
Household income $100K+ (3.86)Males (3.83)No children in household(3.87)Seasonal residents (3.71)Did not vote in June Elections (3.80)
Overall perception of Town4 yr. degree or more (3.93)Household income $50K-100K (4.01); $100K+ (3.91)Children in household (4.02)
Less than a 4 yr. degree (3.78)Household income under $50K (3.81)No children in household (3.83)
Perception of Town as place to retire / live as adults (without children)
1 adult in household (3.93); 2 adults in household (3.74)Year-round residents (3.76)
3 or more adults in household (3.44)Seasonal residents (3.55)
Opportunities to participate in community matters
55 or older (3.54)4 yr. degree or more (3.56)Children in household (3.61)Year-round residents (3.50)Attended June Town meeting (3.74)
35-54 year olds (3.34)Less than a 4 yr. degree (3.35)No children in household (3.43)Seasonal residents (3.31)Did not attend June Town meeting (3.47)
Overall confidence in Raymond's elected officials (Select Board, Budget and Finance Committee)
Household income $50K-100K (3.40); $100K+ (3.32)1 adult in household (3.43); 2 adults in household (3.30)
Household income under $50K (3.16)3 or more adults in household (3.06)
Overall confidence in appointed members of Raymond's Planning Board and Zoning Board of Appeals
4 yr. degree or more (3.26)Household income $50K-100K (3.34); $100K+ (3.27)1 or 2 adults in household (3.21)Year-round residents (3.21)
Less than a 4 yr. degree (3.06)Household income under $50K (3.07)3 or more adults in household (2.99)Seasonal residents (3.03)
Overall opportunities for adult education and enrichment
Household income under $100K (3.05)Children in household (3.11)1 adult in household (3.08); 2 adults in household (2.96)Year-round residents (2.97)Mail survey (2.97)
Household income $100K+ (2.84)No children in household (2.88)3 or more adults in household (2.75)Seasonal residents (2.79)Online survey (2.73)
Overall Perceptions of the Town of Raymond:Analysis by Demographic SubgroupHow would you rate Raymond on each of the following?
Please rate on a scale of 1 to 5, where 1 means “poor” and 5 means “excellent.”
Year-round residents tend to rate Raymond
more highly than seasonal residents
with regard to overall perceptions and quality of life
measures (5 of the 7 factors tested).
In addition, those with children in the
household, those with 1 to 2 adults in the
household, those with a 4 year degree or
more, and those with household incomes of $50,000 or higher rate Raymond more
highly than their counterparts on 3 to 4 of the 7 factors
tested.
17

Public Safety
Survey Results & Analysis

Public Safety – Satisfaction RatingsHow would you rate your satisfaction with each of the following?
Please rate your satisfaction on a scale of 1 to 5, where 1 means “very dissatisfied” and 5 means “very satisfied.”
19
23.6%
35.0%
50.9%
42.7%
53.7%
55.6%
14.7%
25.0%
26.7%
15.0%
17.5%
11.2%
15.9%
11.0%
14.0%
8.2%
7.7%
6.8%
2.1%
6.1%
4.5%
1.7%
1.2%
1.2%
1.6%
1.9%
1.7%
1.6%
1.0%
0.9%
42.1%
21.0%
2.1%
30.8%
18.9%
24.3%
0% 10% 20% 30% 40% 50% 60% 70% 80% 90% 100%
Outreach / education by the FireDepartment
Responsiveness of CumberlandCounty Sheriff's policing services
Overall feeling of safety in theTown
How quickly fire and rescuepersonnel respond
Overall quality of fire and rescueservices
Level of friendliness andprofessionalism of fire and rescue
personnel
Public Safety – Satisfaction Ratings
Very satisfied Somewhat satisfied Neutral Somewhat dissatisfied Very dissatisfied Don't know/ N/A / No response
Overall Mean
4.58
4.50
4.38
4.23
4.08
3.98

20
Public Safety – Satisfaction RatingsHow would you rate your satisfaction with each of the following?
Please rate your satisfaction on a scale of 1 to 5, where 1 means “very dissatisfied” and 5 means “very satisfied.”
Satisfaction ratings of the Public Safety factors tested are very strong across the board, with mean ratings between 3.98 and 4.58, placing them in the “somewhat” to “very satisfied” range. Intensity levels are also significantly higher for the “very satisfied” rating category.
The level of friendliness and professionalism of fire and rescue personnel, the overall quality of fire and rescue services, and how quickly fire and rescue personnel respond rate the highest (mean ratings of 4.58, 4.50, and 4.38 respectively).
The overall feeling of safety in the Town, the responsiveness of Cumberland County Sheriff’s policing services, and outreach / education by the Fire Department come in comparatively lower, but still perform very well, with mean ratings of 4.23, 4.08, and 3.98 respectively.
Dissatisfaction levels are low (2.1% to 8.0%).
For 5 of the 6 Public Safety factors tested, 18.9% to 42.1% of respondents “don’t know” how to rate Raymond.
To see how Public Safety ratings vary by demographic subgroup, please see the table on the next page.

21
Public Safety – Satisfaction Ratings:Differences in Mean Ratings by Demographic Subgroup
Higher LowerLevel of friendliness and professionalism of fire and rescue personnel
4 yr. degree or more (4.65)Household incomes $50K-$100K; $100K+ (4.65)Children in household (4.71)
Less than a 4 yr. degree (4.50)Household incomes under $50K (4.49)
No children in household (4.55)
Overall quality of fire and rescue services
Household incomes $50K-$100K (4.62); $100K+ (4.59)
Household incomes under $50K (4.42)
How quickly fire and rescue personnel respond
Voted in June elections (4.45)Year-round residents (4.40)
Did not vote in June elections (4.24)Seasonal residents (4.24)
Overall feeling of safety in the Town
4 yr. degree or more (4.29)Household incomes $50K-$100K (4.37); $100K+ (4.30)Did not attend June meeting (4.29)
Less than a 4 yr. degree (4.14)Household incomes under $50K (4.14)
Attended June meeting (4.07)Responsiveness of Cumberland County Sheriff's policing services
N/A N/A
Outreach / education by the Fire Department
4 yr. degree or more (4.05)Household incomes $50K-$100K (4.18)
Children in household (4.28)Year-round residents (4.00)
Less than a 4 yr. degree (3.90)Household incomes $100K+ (4.01); under $50K (3.95)No children in household (3.88)Seasonal residents (3.80)
21
Public Safety – Satisfaction Ratings:Analysis by Demographic Subgroup
How would you rate your satisfaction with each of the following? Please rate your satisfaction on a scale of 1 to 5, where 1 means “very dissatisfied” and 5 means “very satisfied.”
Respondents with a 4 year degree or
more and respondents with
household incomes of $50K or more
tend to rate Public Safety more highly
than their counterparts (on 3 of the 6 factors
tested). In addition, those with children in the
household and year-round
residents rate Public Safety
higher than their counterparts on 2 of the 6 factors
tested.

Policing Services in the FutureCurrently, policing services are provided by the Cumberland County Sheriff’s Office. Which of the following options would you
prefer with regard to providing Raymond’s policing services in the future?
22
41.4%
8.7%5.4%
25.7%
18.7%
0%
5%
10%
15%
20%
25%
30%
35%
40%
45%
Continue having policingservices provided by the
Cumberland County Sheriff'sOffice
Contract for enhanced serviceswith the Cumberland County
Sheriff's Office
Have Raymond providepolicing services through its
own police department
Need more information No response
Policing Services in the Future
Four in ten (41.4%) respondents favor continuing to have policing services provided by the Cumberland County Sheriff’s Office.
Only a minority would favor contracting for enhanced services with the Cumberland County Sheriff’s Office (8.7%) or having Raymond provide policing services by having its own police department (5.4%).
However, a quarter (25.7%) say that they would need more information to be in a position to respond, and 18.7% of respondents did not offer a response to this question.
Public Works / Town Maintenance
Survey Results & Analysis
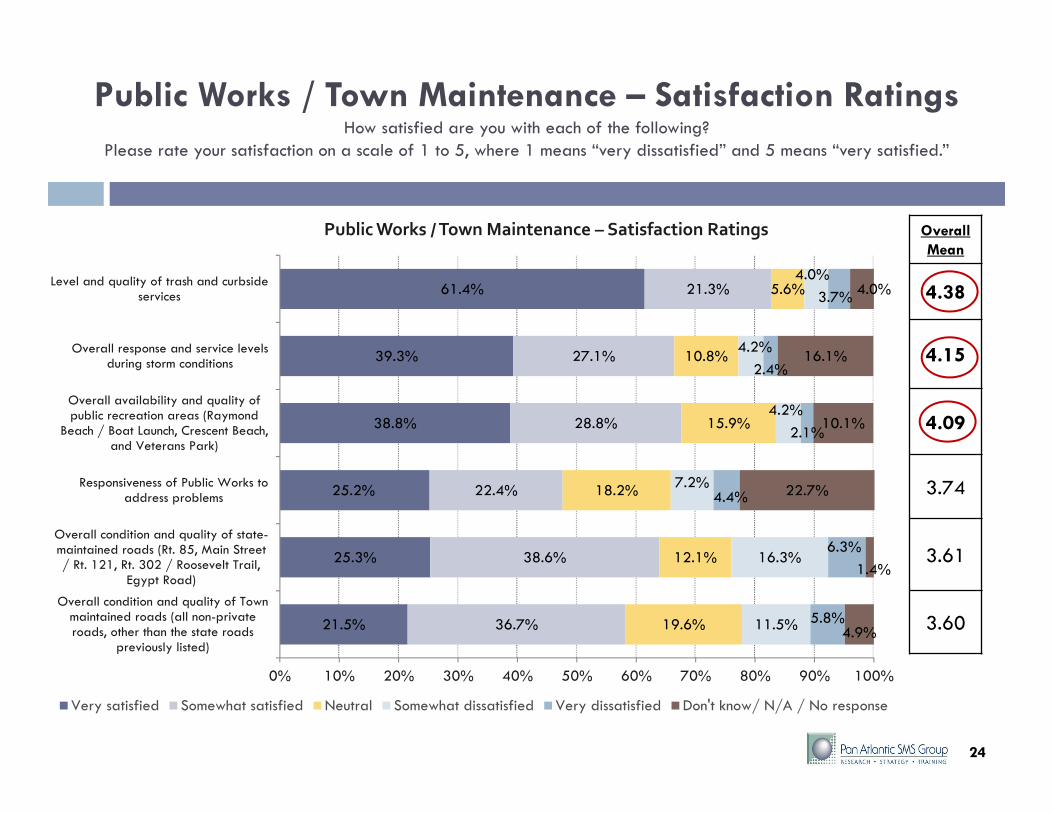
Public Works / Town Maintenance – Satisfaction RatingsHow satisfied are you with each of the following?
Please rate your satisfaction on a scale of 1 to 5, where 1 means “very dissatisfied” and 5 means “very satisfied.”
24
21.5%
25.3%
25.2%
38.8%
39.3%
61.4%
36.7%
38.6%
22.4%
28.8%
27.1%
21.3%
19.6%
12.1%
18.2%
15.9%
10.8%
5.6%
11.5%
16.3%
7.2%
4.2%
4.2%
4.0%
5.8%
6.3%
4.4%
2.1%
2.4%
3.7%
4.9%
1.4%
22.7%
10.1%
16.1%
4.0%
0% 10% 20% 30% 40% 50% 60% 70% 80% 90% 100%
Overall condition and quality of Townmaintained roads (all non-privateroads, other than the state roads
previously listed)
Overall condition and quality of state-maintained roads (Rt. 85, Main Street/ Rt. 121, Rt. 302 / Roosevelt Trail,
Egypt Road)
Responsiveness of Public Works toaddress problems
Overall availability and quality ofpublic recreation areas (Raymond
Beach / Boat Launch, Crescent Beach,and Veterans Park)
Overall response and service levelsduring storm conditions
Level and quality of trash and curbsideservices
Public Works / Town Maintenance – Satisfaction Ratings
Very satisfied Somewhat satisfied Neutral Somewhat dissatisfied Very dissatisfied Don't know/ N/A / No response
Overall Mean
4.38
4.15
4.09
3.74
3.61
3.60

25
Public Works / Town Maintenance – Satisfaction RatingsHow satisfied are you with each of the following?
Please rate your satisfaction on a scale of 1 to 5, where 1 means “very dissatisfied” and 5 means “very satisfied.”
Raymond rates highly in terms of satisfaction with the level and quality of trash and curbside services, overall response and service levels during storm conditions, and overall availability and quality of public recreation areas (Raymond Beach / Boat Launch, Crescent Beach, and Veterans Park) (mean ratings of 4.38, 4.15, and 4.09 respectively).
Responsiveness of Public Works to address problems, overall condition and quality of state-maintained roads, and overall condition and quality of town-maintained roads rate lower comparatively, with mean ratings of 3.74, 3.61, and 3.60 respectively.
Dissatisfaction levels are fairly low for the level of trash and curbside services, response and service levels during storm conditions, overall availability and quality of public recreation areas, and responsiveness of Public Works to address problems (6.3% to 11.6%). Dissatisfaction with both state- and town-maintained roads is somewhat higher (22.6% and 17.3% respectively).
Between 10.1% and 22.7% of respondents “don’t know” how to rate the overall availability and quality of public recreation areas, overall response and service levels during storm conditions, and responsiveness of Public Works to address problems.
To see how Public Works / Town Maintenance ratings vary by demographic subgroup, please see the table on the next page.

26
Public Works / Town Maintenance – Satisfaction Ratings:Differences in Mean Ratings by Demographic Subgroup
Higher Lower
Level and quality of trash and curbside services
Household incomes $50K-$100K (4.53); under $50K (4.47)Voted in June elections (4.50)1 adult in household (4.52); 2 adults in household (4.40)Year-round residents (4.49)
Household incomes $100K+ (4.22)Did not vote in June elections (4.21)3 or more adults in household (4.24)Seasonal residents (4.06)
Overall response and service levels during storm conditions
4 yr. degree or more (4.22)Attended June meeting (4.35)3 to 10 years of residence (4.30)Year-round residents (4.18)
Less than a 4 yr. degree (4.05)Did not attend June meeting (4.14)More than 10 years of residence (4.11)Seasonal residents (3.98)
Overall availability and quality of public recreation areas (Raymond Beach / Boat Launch, Crescent Beach, and Veterans Park)
55+ years old (4.17)Did not vote in June elections (4.19)Did not attend June meeting (4.14)1 adult in household (4.31)
Mail survey (4.12)More than 10 years of residence (4.14)
35-54 years old (3.96)Voted in June elections (4.01)Attended June meeting (3.88)2 adults in household (4.10); 3 or more adults in household (3.93)Online survey (3.83)3 to 10 years of residence (3.92)
Responsiveness of Public Works to address problems
4 yr. degree or more (3.81)Household incomes of $50K-$100K (3.87); $100K+ (3.84)Males (3.90)2 adults in household (3.84); 1 adult in household (3.66)
Less than a 4 yr. degree (3.63)Household incomes under $50K (3.56)Females (3.57)3 or more adults in household (3.37)
Overall condition and quality of state‐maintained roads (Rt. 85, Main Street / Rt. 121, Rt. 302 / Roosevelt Trail, Egypt Road)
55+ years old (3.68)4 yr. degree or more (3.73)Voted in June elections (3.91)1 adult in household (3.70); 2 adults in household (3.65)3 to 10 years of residence (3.78)Seasonal residents (3.95)
35-54 years old (3.46)Less than a 4 yr. degree (3.42)Did not vote in June elections (3.43)3 or more adults in household (3.39)More than 10 years of residence (3.55)Year-round residents (3.49)
Overall condition and quality of Town maintained roads (all non‐private roads, other than the state roads previously listed)
55+ years old (3.69)4 yr. degree or more (3.67)Household incomes $100K+ (3.66); $50K-$100K (3.58)Did not vote in June elections (3.84)Seasonal residents (3.94)
35-54 years old (3.37)Less than a 4 yr. degree (3.45)Household incomes under $50K (3.43)Voted in June elections (3.44)Year-round residents (3.48)
26
Public Works / Town Maintenance – Satisfaction Ratings:Analysis by Demographic Subgroup
How satisfied are you with each of the following? Please rate your satisfaction on a scale of 1 to 5, where 1 means “very dissatisfied” and 5 means “very satisfied.”
Respondents with a 4 year degree or more tend to rate Public
Works / Town Maintenance more highly than their
counterparts (on 4 of the 6 factors tested).
In addition, respondents 55 and
older and respondents with 1 or
2 adults in the household rate Raymond more highly than their
counterparts on 3 of the 6 Public Works / Town Maintenance
factors tested.

Town Management & Town Codes and Ordinances
Survey Results & Analysis
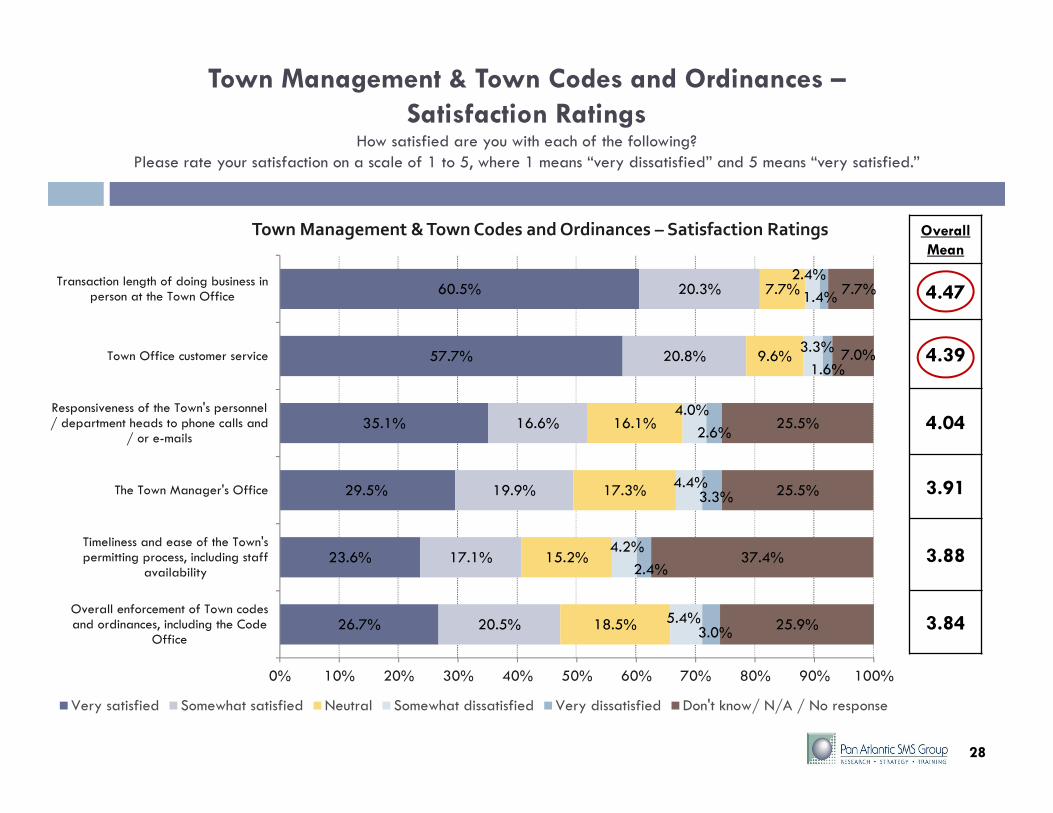
Town Management & Town Codes and Ordinances –Satisfaction Ratings
How satisfied are you with each of the following? Please rate your satisfaction on a scale of 1 to 5, where 1 means “very dissatisfied” and 5 means “very satisfied.”
28
26.7%
23.6%
29.5%
35.1%
57.7%
60.5%
20.5%
17.1%
19.9%
16.6%
20.8%
20.3%
18.5%
15.2%
17.3%
16.1%
9.6%
7.7%
5.4%
4.2%
4.4%
4.0%
3.3%
2.4%
3.0%
2.4%
3.3%
2.6%
1.6%
1.4%
25.9%
37.4%
25.5%
25.5%
7.0%
7.7%
0% 10% 20% 30% 40% 50% 60% 70% 80% 90% 100%
Overall enforcement of Town codesand ordinances, including the Code
Office
Timeliness and ease of the Town'spermitting process, including staff
availability
The Town Manager's Office
Responsiveness of the Town's personnel/ department heads to phone calls and
/ or e-mails
Town Office customer service
Transaction length of doing business inperson at the Town Office
Town Management & Town Codes and Ordinances – Satisfaction Ratings
Very satisfied Somewhat satisfied Neutral Somewhat dissatisfied Very dissatisfied Don't know/ N/A / No response
Overall Mean
4.47
4.39
4.04
3.91
3.88
3.84

29
Town Management & Town Codes and Ordinances –Satisfaction Ratings
How satisfied are you with each of the following? Please rate your satisfaction on a scale of 1 to 5, where 1 means “very dissatisfied” and 5 means “very satisfied.”
Satisfaction with Raymond’s Town Management and Town Codes and Ordinances is strong, with mean ratings between 3.84 and 4.47 for the 6 factors tested.
In this area, Raymond’s satisfaction is highest for the transaction length of doing business in person at the Town Office and Town Office customer service (mean ratings of 4.47 and 4.39 respectively, placing them between “somewhat” and “very satisfied” on the 5-point scale).
Though not quite as high, satisfaction ratings for the responsiveness of the Town’s personnel and department heads to phone calls or e-mails, the Town Manager’s Office, the timeliness and ease of the Town’s permitting process, and the overall enforcement of Town codes and ordinances are also strong (mean ratings of 4.04, 3.91, 3.88, and 3.84 respectively).
Of note, between 25.5% and 37.4% of respondents “don’t know” how to rate these 4 factors.
Dissatisfaction levels are fairly low across the board for the 6 factors tested (3.8% to 8.4%).
To see how Town Management / Town Codes and Ordinances ratings vary by demographic subgroup, please see the table on the next page.

30
Town Management & Town Codes and Ordinances – Satisfaction Ratings:Differences in Mean Ratings by Demographic Subgroup
Higher LowerTransaction length of doing business in person at the Town Office
4 yr. degree or more (4.54)Household incomes $50K-$100K (4.62)2 adults in household (4.56); 1 adult in household (4.49)
Less than a 4 yr. degree (4.40)Household incomes $100K+ (4.48); under $50K (4.38)3 or more adults in household (4.14)
Town Office customer service
55+ year olds (4.47)1 adult in household (4.49); 2 adults in household (4.44)
35-54 years old (4.29)3 or more adults in household (4.18)
Responsiveness of the Town's personnel / department heads to phone calls and / or e‐mails
4 yr. degree or more (4.14)Household incomes $50K-$100K (4.19); $100K+ (4.09)Males (4.12)
Less than a 4 yr. degree (3.90)Household incomes under $50K (3.77)Females (3.96)
The Town Manager's Office
4 yr. degree or more (4.02)Household incomes $50K-$100K (4.11); $100K+ (4.04)Males (4.00)Did not vote in June elections (4.08)2 adults in household (3.98)
Less than a 4 yr. degree (3.76)Household incomes under $50K (3.63)Females (3.82)Voted in June elections (3.86)1 adult in household (3.80); 3 or more adults in household (3.70)
Timeliness and ease of the Town's permitting process, including staff availability
4 yr. degree or more (4.03)Household incomes $50K+ (4.00)Males (3.97)2 adults in household (3.96); 1 adult in household (3.93)
Less than a 4 yr. degree (3.67)Household incomes under $50K (3.56)Females (3.79)3 or more adults in household (3.53)
Overall enforcement of Town Codes and Ordinances, including the Code Office
4 yr. degree or more (3.92)Household incomes $50K-$100K (4.03); $100K+ (3.93)Males (3.95)Attended June meeting (4.10)2 adults in household (3.93)Children in household (3.95)Year-round residents (3.89)
Less than a 4 yr. degree (3.73)Household incomes under $50K (3.70)Females (3.73)Did not attend June meeting (3.86)1 adult in household (3.66); 3 or more adults in household (3.63)No children in household (3.82)Seasonal residents (3.69)
30
Town Management & Town Codes and Ordinances – Satisfaction Ratings:Analysis by Demographic Subgroups
How satisfied are you with each of the following? Please rate your satisfaction on a scale of 1 to 5, where 1 means “very dissatisfied” and 5 means “very satisfied.”
As with Public Safety and Public Works / Town Maintenance, respondents with a 4 year degree or more tend to rate the Town
Management and Town Codes and Ordinances more highly than their counterparts (on 5 of the 6 factors tested).
In addition, respondents with household incomes of $50,000 or higher, male respondents, and those with 1 or 2 adults in their household rate Raymond more highly than their counterparts
on 3 to 4 of the 6 Town Management / Town
Codes and Ordinances factors tested.
Communications
Survey Results & Analysis

Communication Tools - Frequency of UseHow often do you use the following communication tools to get important information?
Please rate on a scale from 1 to 5, where 1 means “never” and 5 means “very frequently.”
32
9.4%
11.2%
20.3%
21.2%
19.9%
22.9%
37.9%
8.7%
17.3%
14.2%
18.2%
23.8%
28.1%
21.5%
17.0%
19.9%
12.6%
19.6%
27.1%
24.8%
15.6%
19.2%
19.1%
9.1%
14.9%
15.4%
11.2%
9.1%
34.6%
25.2%
30.2%
20.5%
9.1%
7.9%
10.3%
11.0%
7.3%
13.6%
5.8%
4.7%
5.1%
5.6%
0% 10% 20% 30% 40% 50% 60% 70% 80% 90% 100%
Video streaming services
Radio
Applications for mobile devices (smartphones, tablets, etc.)
Cable TV or public / local accesschannel
Telephone
Print publications (newspapers ornewsletters)
Internet / social media
Communication Tools ‐ Frequency of Use
Very frequently Frequently Occasionally Rarely Never Don't know/ N/A / No response
33
Communication Tools - Frequency of UseHow often do you use the following communication tools to get important information?
Please rate on a scale from 1 to 5, where 1 means “never” and 5 means “very frequently.”
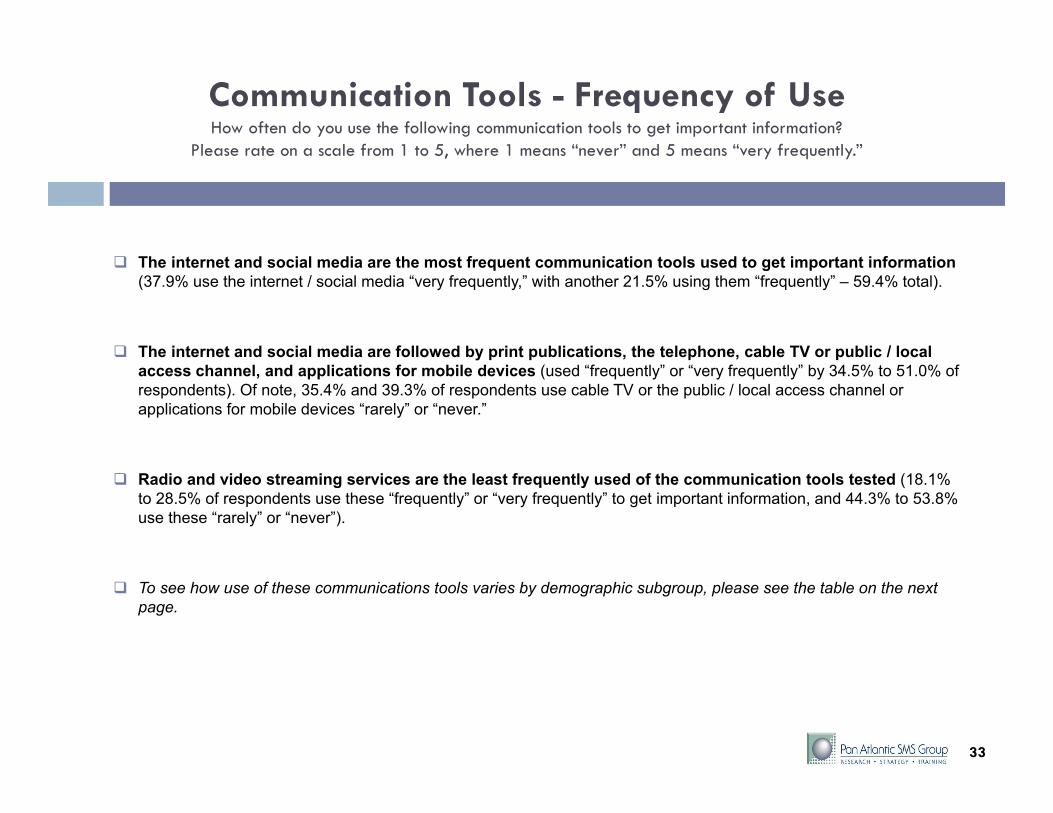
The internet and social media are the most frequent communication tools used to get important information (37.9% use the internet / social media “very frequently,” with another 21.5% using them “frequently” – 59.4% total).
The internet and social media are followed by print publications, the telephone, cable TV or public / local access channel, and applications for mobile devices (used “frequently” or “very frequently” by 34.5% to 51.0% of respondents). Of note, 35.4% and 39.3% of respondents use cable TV or the public / local access channel or applications for mobile devices “rarely” or “never.”
Radio and video streaming services are the least frequently used of the communication tools tested (18.1% to 28.5% of respondents use these “frequently” or “very frequently” to get important information, and 44.3% to 53.8% use these “rarely” or “never”).
To see how use of these communications tools varies by demographic subgroup, please see the table on the next page.

34
Communication Tools – Frequency of Use:Differences in the Percentage Using “Frequently” or “Very Frequently,”
by Demographic SubgroupHigher Lower
Internet / social media
35 to 54 year olds (68.7%). 4 yr. degree or more (65.1%)Household incomes $100K+ (70.6%); $50K-$100K (62.9%)Children in household (72.5%)3 to 10 years of residence (72.0%)Online survey (72.9%)
55+ year olds (56.8%)Less than a 4 yr. degree (51.6%)Household incomes under $50K (48.2%)No children in household (58.5%)More than 10 years of residence (55.5%)Mail survey (57.9%)
Print publications (newspapers or newsletters)
4 yr. degree or more (56.1%)Household incomes $100K+ (53.8%); $50K-$100K (51.7%)Females (58.7%)3 or more adults in household (57.8%); 2 adults in household (51.9%)
Less than a 4 yr. degree (44.3%)Household incomes under $50K (42.9%)Males (45.3%)1 adult in household (41.7%)
Telephone Mail survey (45.0%) Online survey (32.2%)
Cable TV or public / local access channel
N/A N/A
Applications for mobile devices (smart phones, tablets, etc.)
35 to 54 year olds (54.2%)4 yr. degree or more (40.1%)Household incomes $100K+ (48.8%)
Females (38.9%)3 or more adults in household (45.6%)
Children in household (51.6%)Online survey (49.2%)3 to 10 years of residence (44.1%)
55+ year olds (27.1%)Less than a 4 yr. degree (25.6%)Household incomes $50K-$100K (34.4%); under $50K (23.2%)Males (30.6%)2 adults in household (32.8%); 1 adult in household (30.6%)No children in household (31.0%)Mail survey (32.7%)More than 10 years of residence (31.1%)
Radio 35 to 54 year olds (35.9%)3 to 10 years of residence (32.2%)
55+ year olds (26.3%)More than 10 years of residence (26.9%)
Video streaming services
Attended June meeting (28.4%)Online survey (37.3%)3 to 10 years of residence (28.0%)
Did not attend June meeting (15.8%)Mail survey (16.0%)More than 10 years of residence (15.5%)
34
Communication Tools - Frequency of Use:Analysis by Demographic Subgroup
How often do you use the following communication tools to get important information?Please rate on a scale from 1 to 5, where 1 means “never” and 5 means “very frequently.”
Respondents with a 4 year degree or more
and those with household incomes of
$100,000 or more are more likely to frequently use the internet / social media, applications for mobile devices, and
print publications to get important information. In addition, use of the
internet / social media, applications for mobile
devices, and the radio to get important
information tends to decrease with age.

Raymond’s Use of Tools to Communicate with Residents –Quality Ratings
How would you rate Raymond on its use of each of the following tools to communicate with residents regarding Town news or other Town information?Please rate on a scale of 1 to 5, where 1 means “poor” and 5 means “excellent.”
35
3.3%
6.8%
6.8%
5.9%
13.3%
7.9%
20.5%
21.7%
16.3%
32.0%
13.1%
16.3%
17.8%
13.6%
19.8%
5.8%
7.3%
6.1%
5.2%
6.8%
6.1%
3.5%
4.4%
3.1%
3.0%
63.8%
45.6%
43.2%
55.8%
25.2%
0% 10% 20% 30% 40% 50% 60% 70% 80% 90% 100%
Radio
Cable TV / Public access channels
Phone system
Online live streaming video (e.g.live video of Town meetings, etc.)
Town website(www.raymondmaine.org) /
Facebook page (social media)
Raymond’s Use of Tools to Communicate with Residents –Quality Ratings
Excellent Good Average Fair Poor Don't know/ N/A / No response
Overall Mean
3.61
3.38
3.36
3.36
2.90

36
Raymond’s Use of Tools to Communicate with Residents –Quality Ratings
How would you rate Raymond on its use of each of the following tools to communicate with residents regarding Town news or other Town information?Please rate on a scale of 1 to 5, where 1 means “poor” and 5 means “excellent.”
Of the 5 communications tools tested, Raymond’s Town website (www.raymondmaine.org) / Facebook page rates the highest in terms of the quality of its use to communicate with residents regarding Town news or other Town information (mean rating of 3.61).
About a quarter (25.2%) of respondents “don’t know” how to rate Raymond’s website / Facebook page, as used to communicate with residents of the Town.
Raymond’s use of online live streaming video, the phone system, and cable TV / public access channels rate in the “average” to “good” range (mean ratings of 3.38, 3.36, and 3.36 respectively). Raymond’s use of the radio to communicate with residents rates just below “average,” at 2.90.
It is important to note that a large percentage of respondents “don’t know” how to rate Raymond with regard to these four communications tools (between 43.2% and 63.8%).
Only 8.3% to 11.9% of respondents rate Raymond’s use of these five tools as “fair” or “poor.”
To see how ratings of Raymond’s use of these communication tools varies by demographic subgroup, please see the table on the next page.

37
Raymond’s Use of Tools to Communicate with Residents –Quality Ratings:
Differences in Mean Ratings by Demographic SubgroupHigher Lower
Town website (www.raymondmaine.org) / Facebook page (social media)
4 yr. degree or more (3.68)Did not vote in June elections (3.76)
Less than a 4 yr. degree (3.50)Voted in June elections (3.56)
Online live streaming video (e.g. live video of Town meetings, etc.)
55+ years old (3.47)1 adult in household (3.68); 2 adults in household (3.42)
35 to 54 years old (3.22)3 or more adults in household (3.16)
Phone system4 yr. degree or more (3.46)1 adult in household (3.61)
Less than a 4 yr. degree (3.23)2 adults in household (3.38); 3 or more adults in household (3.17)
Cable TV / Public access channels
Household incomes $50K-$100K (3.56)1 adult in household (3.50); 2 adults in household (3.40)Year-round residents (3.39)
Household incomes under $50K (3.43); $100K+ (3.31)3 or more adults in household (3.25)
Seasonal residents (3.22)
RadioFemales (3.05)Did not attend June meeting (2.99)Mail survey (2.99)
Males (2.81)Attended June meeting (2.70)Online survey (2.25)
37
Raymond’s Use of Tools to Communicate with Residents – Quality Ratings: Analysis by Demographic Subgroup
How would you rate Raymond on its use of each of the following tools to communicate with residents regarding Town news or other Town information?Please rate on a scale of 1 to 5, where 1 means “poor” and 5 means “excellent.”
There was not a large amount of variation in terms of how different
demographic subgroups rated Raymond’s use of
these tools to communicate with
residents. Respondents with a 4 year degree or more rate the Town website
and phone system more highly than their
counterparts, while those with 1 to 2
adults in the household rate the
Town’s use of online live streaming video
and cable TV / public access channel more
highly.
Other Issues
Survey Results & Analysis

Satisfaction with Regional School Unit #14In 2009, Raymond partnered with Windham to form Regional School Unit #14 (RSU #14) to consolidate educational costs. How satisfied are you with this
educational partnership? Please rate your satisfaction on a scale of 1 to 5, where 1 means “very dissatisfied” and 5 means “very satisfied.”
39
11.4% 6.6% 12.9% 12.6% 20.6% 35.8%
0% 10% 20% 30% 40% 50% 60% 70% 80% 90% 100%
Satisfaction with Regional School Unit #14
Very satisfied Somewhat satisfied Neutral Somewhat dissatisfied Very dissatisfied Don't know/ N/A / No response
Overall Mean
2.62
Satisfaction with RSU #14 is low, with only 18.0% of respondents saying that they are “somewhat” (6.6%) or “very satisfied” (11.4%).
Conversely, about a third of respondents (33.2%) are “somewhat” (12.6%) or “very dissatisfied” (20.6%) with RSU #14. Amongst those with children in the household, dissatisfaction is even higher (49.5% are “somewhat” or “very dissatisfied”).
Satisfaction with RSU #14 increases with age, household income, and the number of adults in the household. In addition, satisfaction is higher amongst those with a 4 year degree or more, those who did not vote in the June elections, those who did not attend the June meeting, those without children in the household, those who took the mail survey, and those who are seasonal residents.
Of note, more than a third of respondents (35.8%) “don’t know” how to rate their level of satisfaction with RSU #14.
18.0% satisfied overall 33.2% dissatisfied overall

40
Top Reasons for:Satisfaction (rating of 4 or 5): Dissatisfaction (rating of 1 or 2):
Cost Savings: Reduction in costs to RaymondEconomy of scaleSharing of resources
Lopsided in Nature:Benefits Windham more than RaymondRaymond paying more than its share of costsWindham will not send their students to Raymond schools
Improved Offerings for Students:More educational optionsMore extracurricular opportunities
Control:Lack of independenceLack of controlLittle to no voice or input
Quality of Education: Quality of education has not changed / declinedQuality of education is good
Costs:Higher costs Lack of savings for Raymond
Believe Partnership will be Beneficial with Time / Compromise:
Natural growing painsHave come too far to go backWill cost Raymond and Windham more to go back
Level of Education:Poorer level of education Level of education has not improved
Reasons for Satisfaction and Dissatisfaction with RSU #14Please explain your response to question 9A [rating of satisfaction with Regional School Unit #14].
40
“When small dogs partner with big dogs, the big dogs always
decide where the walks will be taken.”
“Loss of local control.”
“It’s not an equal partnership.”
“The education of our students has declined.”
“No cost reduction realized.”
“Windham sees us as a ‘cash cow.’”
“They won’t use schools located in Raymond and instead wish to
build a new school which will likely have high cost to Raymond
residents.”“The opportunities for our
students are much improved.”
“Economy of scale.”
“Quality of education has not changed.”
“They are having growing pains, but have put too
much into the partnership to stop now.”
“Windham has good schools.”
“Allows towns to share resources.”

Level of Support for Raymond Further Exploring Various Services or Enhancements
Please rate your level of interest in the Town’s further exploring the following services or enhancements on a scale of 1 to 5, where 1 means “strongly oppose” this idea and 5 means “strongly support” this idea.
41
15.6%
15.2%
12.9%
16.8%
24.8%
25.2%
22.2%
32.5%
28.8%
33.2%
48.8%
19.8%
18.9%
20.5%
30.1%
24.8%
25.7%
23.4%
25.0%
32.3%
31.3%
24.7%
20.3%
27.1%
26.9%
23.1%
17.3%
23.6%
26.2%
21.7%
18.4%
19.4%
14.5%
16.4%
13.8%
14.9%
11.7%
11.0%
7.5%
3.5%
5.2%
6.8%
6.1%
5.4%
21.2%
17.1%
14.7%
9.6%
14.7%
5.8%
2.3%
5.9%
4.5%
5.9%
3.8%
6.8%
7.9%
10.1%
8.7%
7.3%
12.2%
22.4%
9.6%
9.1%
4.0%
2.8%
0% 10% 20% 30% 40% 50% 60% 70% 80% 90% 100%
Building a combined Town Office, library, and communitycenter at a new location
Expanding public access to waterways
Developing / expanding Town water and sewer services
Expanding Town's Commercial District
Creating an outdoor recreational complex in the Town forall age groups, which would include a baseball diamond,
tennis courts, athletic fields, and walking paths
Contracting for bulky waste removal services
Updating the Comprehensive Plan that expires this year
Investigating options for alternative high speed internetservice and / or providers (e.g. fiber optics)
Expanding economic development efforts (being moreproactive in economic development)
Expanding funding for the Raymond Village Library (theprivate, non-profit library in Raymond)
Expanding conservation efforts (additional funding forsupport groups such as the Raymond Waterways Protective
Association (RWPA) or milfoil eradication efforts)
Level of Support for Raymond Further Exploring Various Services or Enhancements
Strongly support Somewhat support Neither support nor oppose Somewhat oppose Strongly oppose Don't know/ N/A / No response
Overall Mean
4.12
3.83
3.82
3.81
3.77
3.65
3.37
3.36
3.02
3.01
2.92

42
Level of Support for Raymond Further Exploring Various Services or Enhancements
Please rate your level of interest in the Town’s further exploring the following services or enhancements on a scale of 1 to 5, where 1 means “strongly oppose” this idea and 5 means “strongly support” this idea.
The service or enhancement with the greatest level of support of the eleven tested is “expanding conservation efforts (additional funding for support groups such as the Raymond Waterways Protective Association (RWPA) or milfoil eradication efforts).” Half of respondents (48.8%) “strongly support” exploring this, with an additional quarter (24.7%) “somewhat supporting” it (73.5% total; mean rating of 4.12).
Other projects garnering fairly strong levels of support are:
“Expanding funding for the Raymond Village Library” (64.5% “strongly” or “somewhat support”; mean rating of 3.83)
“Expanding economic development efforts” (61.1% “strongly” or “somewhat support”; mean rating of 3.82)
“Investigating options for alternative high speed internet service and / or providers (e.g. fiber optics)” (57.5% “strongly” or “somewhat support”; mean rating of 3.81)
“Updating the Comprehensive Plan that expires this year” (45.6% “strongly” or “somewhat support”; mean rating of 3.77. Of note, almost a quarter (22.4%) of respondents answered “don’t know” for this question.)
“Contracting for bulky waste removal services” (50.9% “strongly” or “somewhat support”; mean rating of 3.65)
“Creating an outdoor recreational complex…,” “Expanding the Town’s commercial district,” “Developing / expanding Town water and sewer services,” “Expanding public access to waterways,” and “Building a combined Town Office, library, and community center at a new location” are the least supported services / enhancements (for exploration) of the eleven tested, with mean ratings around the neutral point (2.92 to 3.37).
To see how interest in exploring the various services and enhancements varies by demographic subgroup, please see the table on the next page.

43
Level of Support for Raymond Further Exploring Various Services or Enhancements: Differences in Mean Ratings by Demographic Subgroup for Top 5 Services and Enhancements
Higher Lower1) Expanding conservation efforts (additional
funding for support groups such as the Raymond Waterways Protective Association (RWPA) or milfoil eradication efforts)
4 yr. degree or more (4.34)Household incomes $100K+ (4.33); $50K-$100K (4.25)Did not vote in June elections (4.43)Seasonal residents (4.53)
Less than a 4 yr. degree (3.79)Household incomes under $50K (3.81)Voted in June elections (3.95)Year-round residents (3.97)
2) Expanding funding for the Raymond Village Library (the private, non‐profit library in Raymond)
4 yr. degree or more (3.96)Household incomes $50K-$100K (4.01); $100K+ (3.94)Females (4.00)Children in household (4.16)
Less than a 4 yr. degree (3.65)Household incomes under $50K (3.72)Males (3.71)No children in household (3.78)
3) Expanding economic development efforts (being more proactive in economic development)
35 to 54 years old (3.96)Household incomes $100K+ (3.97)Females (3.90)Voted in June elections (3.90)Children in household (4.01)Year-round residents (3.90)
55 or older (3.77)Household incomes under $100K (3.79)Males (3.73)Did not vote in June elections (3.65)No children in household (3.78)Seasonal residents (3.54)
4) Investigating options for alternative high speed internet service and / or providers (e.g. fiber optics)
35 to 54 years old (4.02)4 yr. degree or more (3.95)Household incomes $100K+ (4.05); $50K-$100K (4.04)3 or more adults in household (3.87); 2 adults in household (3.86)Children in household (3.96)Online survey (4.12)3 to 10 years of residence (4.02)
55+ years old (3.76)Less than a 4 yr. degree (3.61)Household incomes under $50K (3.49)1 adult in household (3.64)No children in household (3.77)Mail survey (3.77)More than 10 years of residence (3.73)
5) Updating the Comprehensive Plan that expires this year
35 to 54 years old (3.89)4 yr. degree or more (3.94)Household incomes $50K-$100K (3.95); $100K+ (3.90)Voted in June elections (3.83)Attended June meeting (4.04)2 adults in household (3.82); 3 or more adults in household (3.72)
55+ years old (3.73)Less than a 4 yr. degree (3.51)Household incomes under $50K (3.59)Did not vote in June elections (3.65)Did not attend June meeting (3.73)1 adult in household (3.56)
43
Level of Support for Raymond Further Exploring Various Services or Enhancements:Analysis by Demographic Subgroup
Please rate your level of interest in the Town’s further exploring the following services or enhancements on a scale of 1 to 5, where 1 means “strongly oppose” this idea and 5 means “strongly support” this idea.
Level of Tax Increase that Respondents Would Find Tolerable for Additional Town Services, Facilities, Infrastructure, or Other Projects
If you support the Town pursuing any additional services, facilities, infrastructure, or other projects,what level of tax increase would you find tolerable?
44
16.8%14.5%
9.3%
4.4% 5.9%2.3% 1.0%
36.4%
5.4% 4.0%
0%5%
10%15%20%25%30%35%40%
1% 2% 3% 4% 5% 6-10% More than 10% I would not find anytax increase
tolerable
Do not favorpursuing any
additional services,facilities,
infrastructure, orother projects
No response
Level of Tax Increase that Respondents Would Find Tolerable for Additional Town Services, Facilities, Infrastructure, or Other Projects
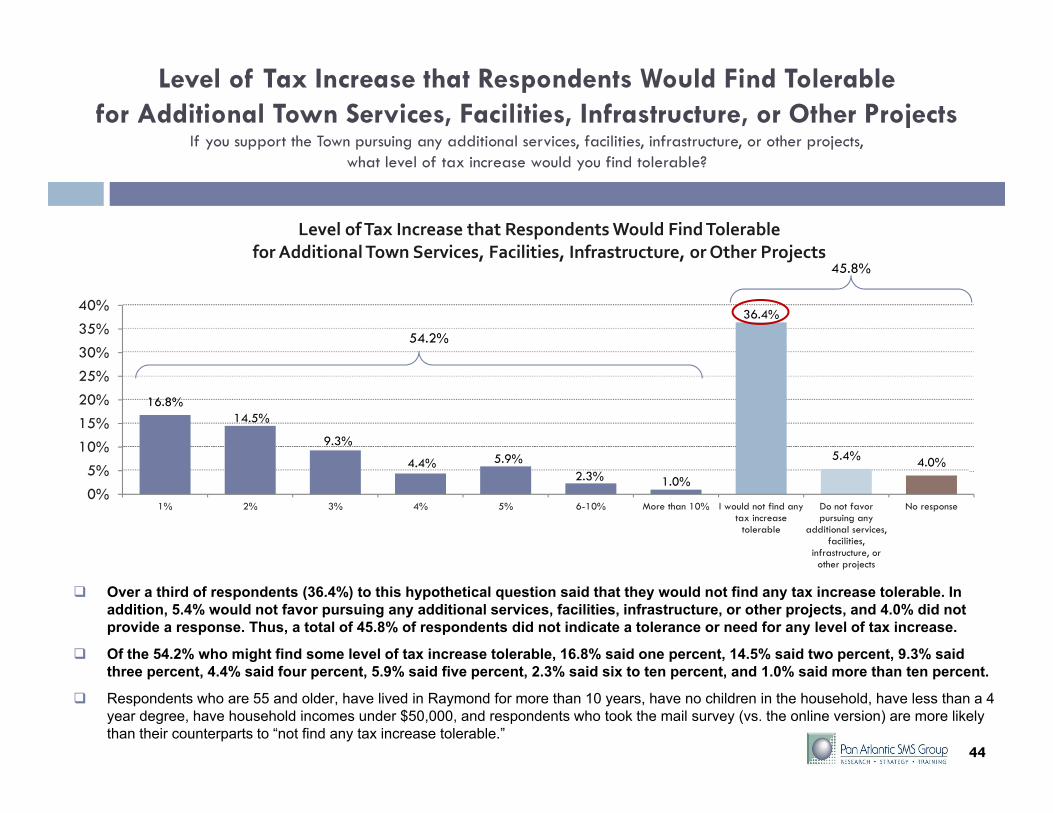
Over a third of respondents (36.4%) to this hypothetical question said that they would not find any tax increase tolerable. In addition, 5.4% would not favor pursuing any additional services, facilities, infrastructure, or other projects, and 4.0% did notprovide a response. Thus, a total of 45.8% of respondents did not indicate a tolerance or need for any level of tax increase.
Of the 54.2% who might find some level of tax increase tolerable, 16.8% said one percent, 14.5% said two percent, 9.3% said three percent, 4.4% said four percent, 5.9% said five percent, 2.3% said six to ten percent, and 1.0% said more than ten percent.
Respondents who are 55 and older, have lived in Raymond for more than 10 years, have no children in the household, have less than a 4 year degree, have household incomes under $50,000, and respondents who took the mail survey (vs. the online version) are more likely than their counterparts to “not find any tax increase tolerable.”
54.2%
45.8%
45
Major Needs or Priorities for Raymond in the Next 10 YearsWhat do you see as the major needs or priorities for Raymond in the next 10 years?
46
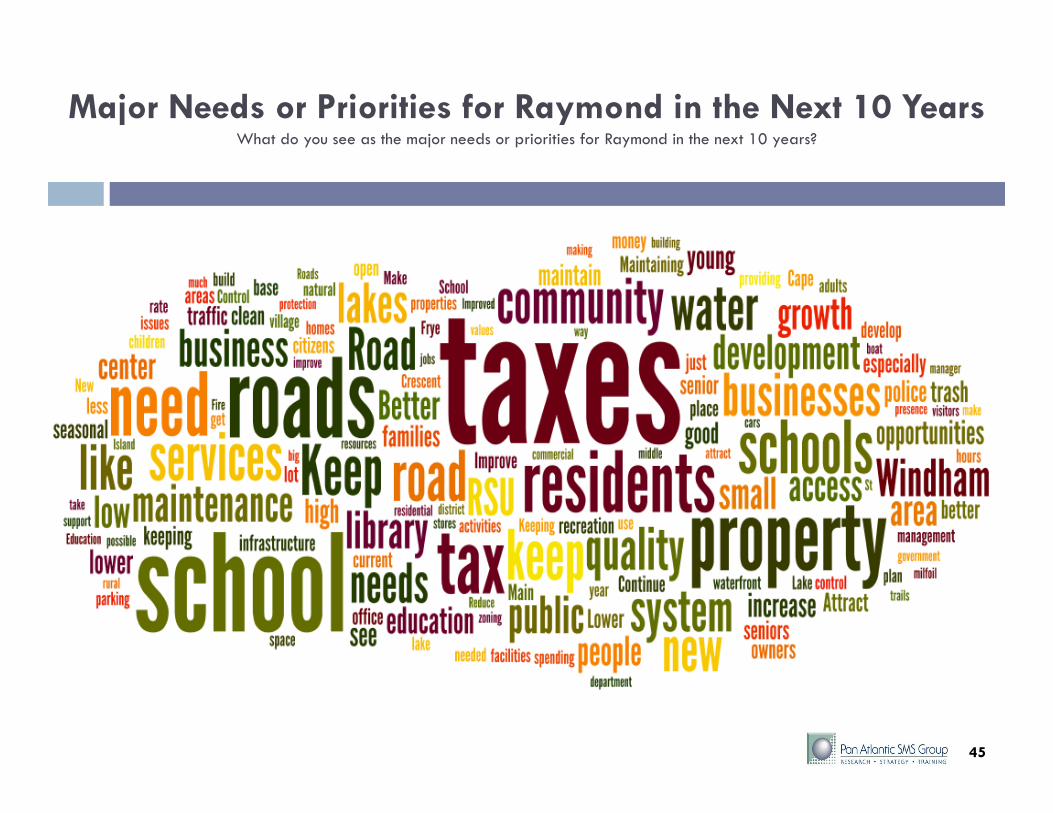
Major Needs or Priorities for Raymond in the Next 10 YearsWhat do you see as the major needs or priorities for Raymond in the next 10 years?
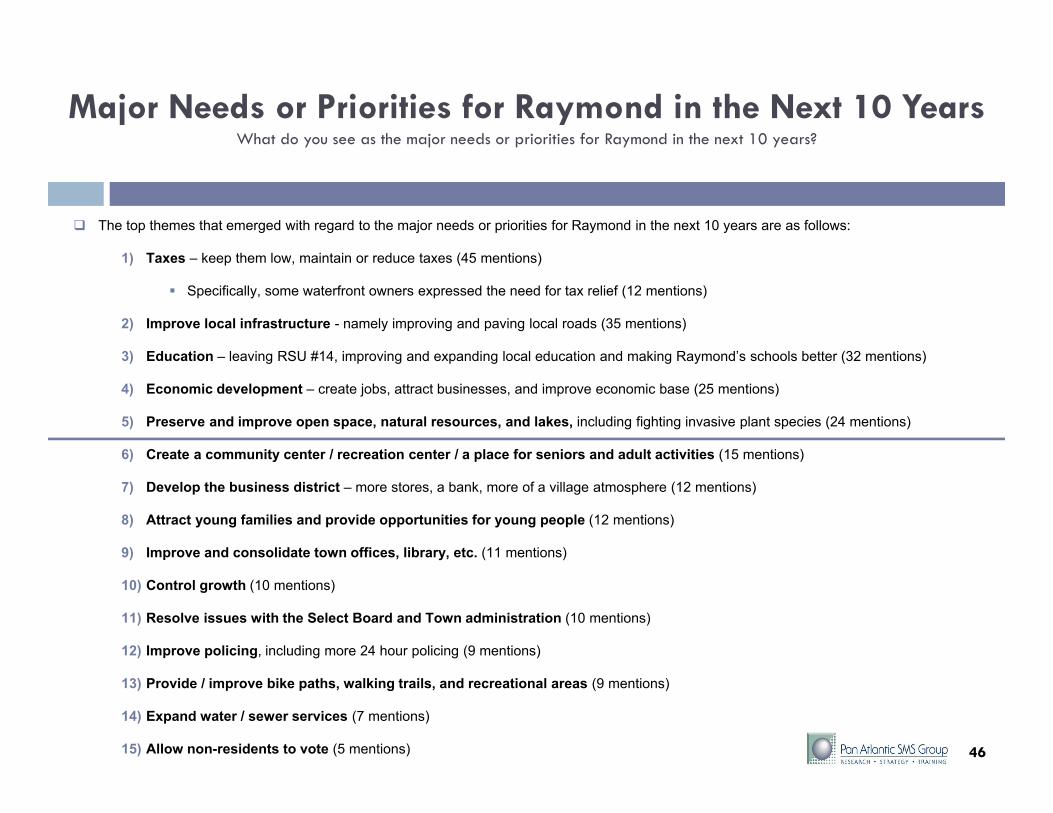
The top themes that emerged with regard to the major needs or priorities for Raymond in the next 10 years are as follows:
1) Taxes – keep them low, maintain or reduce taxes (45 mentions)
Specifically, some waterfront owners expressed the need for tax relief (12 mentions)
2) Improve local infrastructure - namely improving and paving local roads (35 mentions)
3) Education – leaving RSU #14, improving and expanding local education and making Raymond’s schools better (32 mentions)
4) Economic development – create jobs, attract businesses, and improve economic base (25 mentions)
5) Preserve and improve open space, natural resources, and lakes, including fighting invasive plant species (24 mentions)
6) Create a community center / recreation center / a place for seniors and adult activities (15 mentions)
7) Develop the business district – more stores, a bank, more of a village atmosphere (12 mentions)
8) Attract young families and provide opportunities for young people (12 mentions)
9) Improve and consolidate town offices, library, etc. (11 mentions)
10) Control growth (10 mentions)
11) Resolve issues with the Select Board and Town administration (10 mentions)
12) Improve policing, including more 24 hour policing (9 mentions)
13) Provide / improve bike paths, walking trails, and recreational areas (9 mentions)
14) Expand water / sewer services (7 mentions)
15) Allow non-residents to vote (5 mentions)

Comparison to Other Towns / Cities
Survey Results & Analysis
48
Comparison to Other Towns / Cities
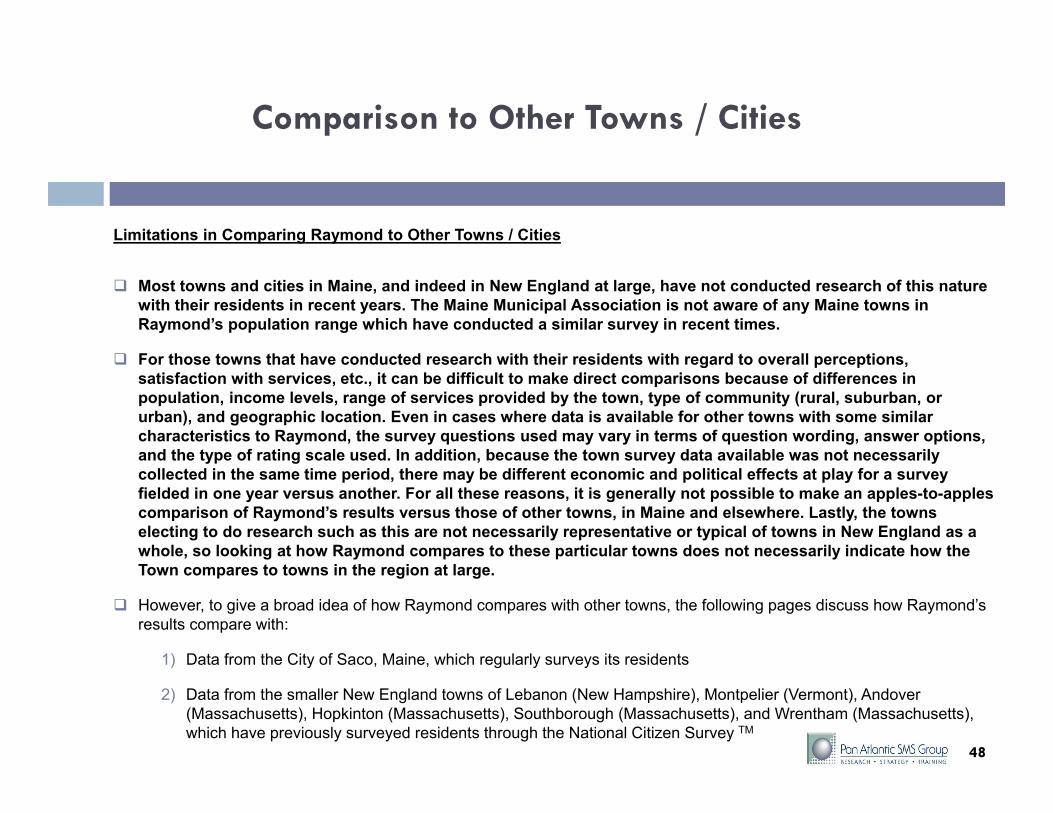
Limitations in Comparing Raymond to Other Towns / Cities
Most towns and cities in Maine, and indeed in New England at large, have not conducted research of this nature with their residents in recent years. The Maine Municipal Association is not aware of any Maine towns in Raymond’s population range which have conducted a similar survey in recent times.
For those towns that have conducted research with their residents with regard to overall perceptions, satisfaction with services, etc., it can be difficult to make direct comparisons because of differences in population, income levels, range of services provided by the town, type of community (rural, suburban, or urban), and geographic location. Even in cases where data is available for other towns with some similar characteristics to Raymond, the survey questions used may vary in terms of question wording, answer options, and the type of rating scale used. In addition, because the town survey data available was not necessarily collected in the same time period, there may be different economic and political effects at play for a survey fielded in one year versus another. For all these reasons, it is generally not possible to make an apples-to-apples comparison of Raymond’s results versus those of other towns, in Maine and elsewhere. Lastly, the towns electing to do research such as this are not necessarily representative or typical of towns in New England as a whole, so looking at how Raymond compares to these particular towns does not necessarily indicate how the Town compares to towns in the region at large.
However, to give a broad idea of how Raymond compares with other towns, the following pages discuss how Raymond’s results compare with:
1) Data from the City of Saco, Maine, which regularly surveys its residents
2) Data from the smaller New England towns of Lebanon (New Hampshire), Montpelier (Vermont), Andover (Massachusetts), Hopkinton (Massachusetts), Southborough (Massachusetts), and Wrentham (Massachusetts), which have previously surveyed residents through the National Citizen Survey TM
49
Comparison to Other Towns / Cities
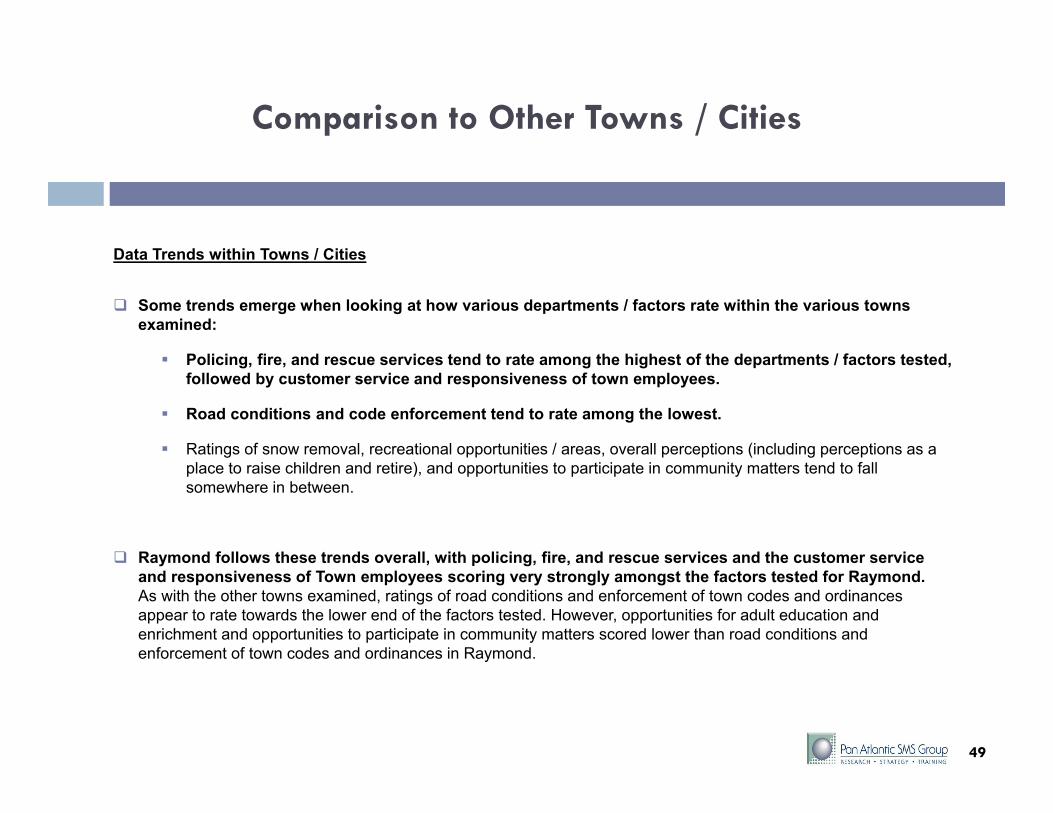
Data Trends within Towns / Cities
Some trends emerge when looking at how various departments / factors rate within the various towns examined:
Policing, fire, and rescue services tend to rate among the highest of the departments / factors tested, followed by customer service and responsiveness of town employees.
Road conditions and code enforcement tend to rate among the lowest.
Ratings of snow removal, recreational opportunities / areas, overall perceptions (including perceptions as a place to raise children and retire), and opportunities to participate in community matters tend to fall somewhere in between.
Raymond follows these trends overall, with policing, fire, and rescue services and the customer service and responsiveness of Town employees scoring very strongly amongst the factors tested for Raymond. As with the other towns examined, ratings of road conditions and enforcement of town codes and ordinances appear to rate towards the lower end of the factors tested. However, opportunities for adult education and enrichment and opportunities to participate in community matters scored lower than road conditions and enforcement of town codes and ordinances in Raymond.
50
Comparison to Other Towns / Cities
Comparing the Town of Raymond and the City of Saco*
When looking at the Town of Raymond versus the City of Saco, the Town appears to score similarly in terms of ratings of its overall feeling of safety; its fire and rescue services; the condition of its roads; the availability and quality of its recreation areas; service levels during storm conditions; trash removal services; the Town Manager’s Office / City Administrator’s Office; and the enforcement of its codes and ordinances.
Raymond appears to rate slightly below Saco in terms of its overall rating; perceptions of the Town as a place to raise children; opportunities for adult education and enrichment; opportunities to participate in community matters; its policing services; and outreach / education efforts by the Fire Department. However, Raymond still scores strongly in these areas (with mean ratings between 3.47 and 4.08 for five of these six factors).
* Again, it is important to bear in mind that Saco has a much larger population and is more urban than Raymond when comparing the two municipalities.
51
Comparison to Other Towns / Cities
Comparing the Town of Raymond and the Towns of Lebanon, Montpelier, Andover, Hopkinton, Southborough, and Wrentham*
When comparing Raymond with these smaller New England towns, Raymond rates as follows:
Raymond appears to rate somewhat higher than most of the towns examined in terms of its road conditions, service levels during storm conditions / snow removal, trash removal services, code enforcement, and its perception as a place to retire.
Ratings of Raymond’s policing services, customer service and responsiveness of town employees, and Town Manager appear to be in a similar range as these towns.
When looking at the percentage of respondents rating a department / factor as the top two points on a scale in a rating question (e.g. the percentage rating a department / factor as “good” or “excellent”), Raymond comes in slightly lower overall with regard to ratings of the Town overall, the Town as a place to raise children, opportunities to participate in community matters, and outreach by the Fire Department. However, the National Citizen Survey TM
uses a 4-point scale with no “neutral” / “average” point, whereas the Raymond survey uses a 5-point scale with a “neutral” / “average” point, which skews results and makes a direct comparison impossible.
In addition, it appears that Raymond most likely scores higher than the national average (for the towns and cities who have done the National Citizen Survey TM) in terms of its ratings as a place to raise children; a place to retire; its policing, fire, and rescue services; its service levels during storm conditions / snow removal; its trash removal services; and the customer service and level of responsiveness of its employees.
* Again, due to differences in the characteristics of these towns, differences in the question wording and scales used, and the different dates / years in which the surveys were fielded, the limitations of these comparisons must be emphasized.
Respondent Profile

Respondent Profile
53
3.0% 6.1%9.4%
19.9%12.6%
47.9%
1.0%
0 to 2 3 to 5 6 to 9 10 to 15 16 to 20 More than20 years
No response
Approximately how many years have you lived or owned property in Raymond?Do you own or rent your current residence?
Own, 95.8%Rent, 1.2%
Other, 2.3%
No response, 0.7%
1.0% 1.0%7.3%
15.6%
29.2%
43.2%
2.6%
18 to 24 25 to 34 35 to 44 45 to 54 55 to 64 65 or older No response
Into which of the following categories does your age fall?
Are you a year-round or seasonal resident of Raymond?
Year-round, 71.9%
Seasonal, 27.1%
No response, 1.0%
53
Respondent Profile
54
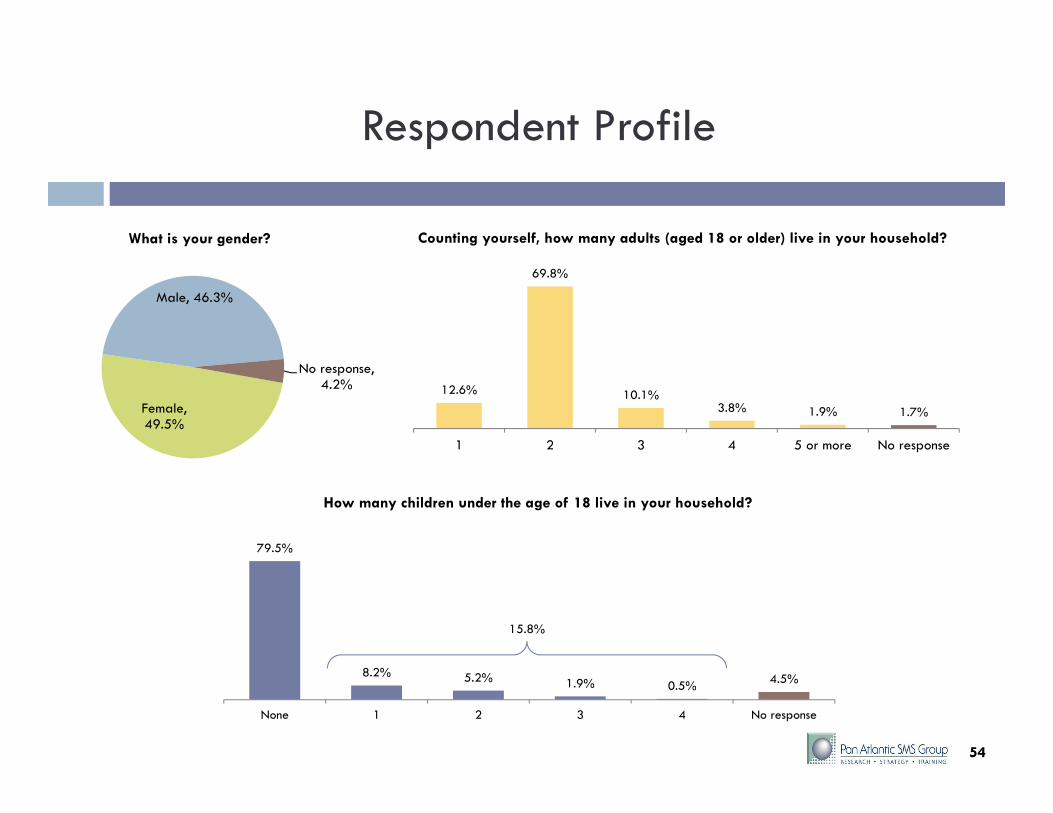
12.6%
69.8%
10.1%3.8% 1.9% 1.7%
1 2 3 4 5 or more No response
Counting yourself, how many adults (aged 18 or older) live in your household?What is your gender?
Female, 49.5%
Male, 46.3%
No response, 4.2%
79.5%
8.2% 5.2% 1.9% 0.5% 4.5%
None 1 2 3 4 No response
How many children under the age of 18 live in your household?
15.8%
54

Yes, 55.2%
No, 35.7%
Prefer not to answer / No
response, 9.1%
Respondent Profile
55
0.9%
14.0%
4.4%
19.1%
26.9%
33.2%
1.6%
Less than highschool graduate
High schoolgraduate
Vocational /Trade school
Some college /2-year college
graduate
4-year collegegraduate
Post-graduatework
No response
What is the highest level of education you have completed?
Which of the following income categories includes your total household income in 2013 before taxes?
26.0%
11.2%
16.8%
12.1%
14.3%
15.9%
3.7%
Prefer not to answer / No response
$150k or more
$100k to less than $150k
$75k to less than $100k
$50k to less than $75k
$25k to less than $50k
Less than $25K
Did you vote in the last Town elections in June 2014?
Did you go to the annual Town meeting in June 2014?
Yes, 15.4%
No, 76.2%Prefer not to answer / No
response, 8.4%
55

Appendix A
Survey Instrument

1
2014 TOWN OF RAYMOND SURVEY
The Town of Raymond is gathering opinions on a variety of Town issues. Two surveys are allowed per
household (one paper and one online). Your responses will be anonymous. We thank you in advance for
your participation. Please return the survey in the business reply envelope provided or respond online at
www.raymondmaine.org by November 21, 2014.
OVERALL SATISFACTION WITH AND THE QUALITY OF LIFE IN THE TOWN OF RAYMOND
1. How would you rate Raymond on each of the following? Please rate on a scale of 1 to 5, where 1 means “poor” and 5 means
“excellent.”
1 –
Poor
2 –
Fair
3 -
Average
4 –
Good
5 -
Excellent
Don’t know
or N/A
A. Your overall perception of the Town
B. Your perception of the Town as a place to
raise children
C. Your perception of the Town as a place to
retire / live as adults (without children)
D. Overall opportunities for adult education and
enrichment
E. Opportunities to participate in community
matters
F. Your overall confidence in Raymond’s
elected officials (Select Board, Budget and
Finance Committee)
G. Your overall confidence in the appointed
members of Raymond’s Planning Board and
Zoning Board of Appeals
PUBLIC SAFETY
2. How would you rate your satisfaction with each of the following? Please rate your satisfaction on a scale of 1 to 5, where 1
means “very dissatisfied” and 5 means “very satisfied.”
1 –
Very
dissatisfied
2 –
Somewhat
dissatisfied
3 –
Neutral
4 –
Somewhat
satisfied
5 –
Very
satisfied
Don’t
know or
N/A
A. Your overall feeling of safety in the Town
B. The responsiveness of Cumberland County
Sheriff’s policing services
C. The overall quality of fire and rescue services
D. How quickly fire and rescue personnel
respond
E. The level of friendliness and professionalism
of fire and rescue personnel
F. Outreach / education by the Fire Department
3. Currently, policing services are provided by the Cumberland County Sheriff’s Office. Which of the following options would
you prefer with regard to providing Raymond’s policing services in the future:
Continue having policing services provided by the Cumberland County Sheriff’s Office
Contract for enhanced services with the Cumberland County Sheriff’s Office
Have Raymond provide policing services through its own police department
Need more information

2
PUBLIC WORKS / TOWN MAINTENANCE
4. How satisfied are you with each of the following? Please rate your satisfaction on a scale of 1 to 5, where 1 means “very
dissatisfied” and 5 means “very satisfied.”
1 –
Very
dissatisfied
2 –
Somewhat
dissatisfied
3 –
Neutral
4 –
Somewhat
satisfied
5 –
Very
satisfied
Don’t
know or
N/A
A. The responsiveness of Public Works to
address problems
B. The overall condition and quality of state-
maintained roads (Rt. 85, Main Street / Rt.
121, Rt. 302 / Roosevelt Trail, Egypt Road)
C. The overall condition and quality of Town
maintained roads (all non-private roads, other
than the state roads listed in 4B above)
D. The overall availability and quality of public
recreation areas (Raymond Beach / Boat
Launch, Crescent Beach, and Veterans Park)
E. The overall response and service levels
during storm conditions
F. The level and quality of trash and curbside
services
TOWN MANAGEMENT & TOWN CODES AND ORDINANCES
5. How satisfied are you with each of the following? Please rate your satisfaction on a scale of 1 to 5, where 1 means “very
dissatisfied” and 5 means “very satisfied.”
1 –
Very
dissatisfied
2 –
Somewhat
dissatisfied
3 –
Neutral
4 –
Somewhat
satisfied
5 –
Very
satisfied
Don’t
know or
N/A
A. The Town Manager’s Office
B. Town Office customer service
C. Transaction length of doing business in
person at the Town Office
D. Responsiveness of the Town’s personnel /
department heads to phone calls and / or e-
mails
E. The overall enforcement of Town codes and
ordinances, including the Code Office
F. The timeliness and ease of the Town’s
permitting process, including staff
availability
COMMUNICATIONS
6. How often do you use the following communication tools to get important information? Please rate on a scale of 1 to 5,
where 1 means 'never' and 5 means 'very frequently.'
1 –
Never
2 –
Rarely
3 –
Occasionally
4 –
Frequently
5 –
Very
frequently
Don’t
know or
N/A
A. Internet/social media
B. Video streaming services
C. Cable TV or Public/local access channel
D. Telephone
E. Radio
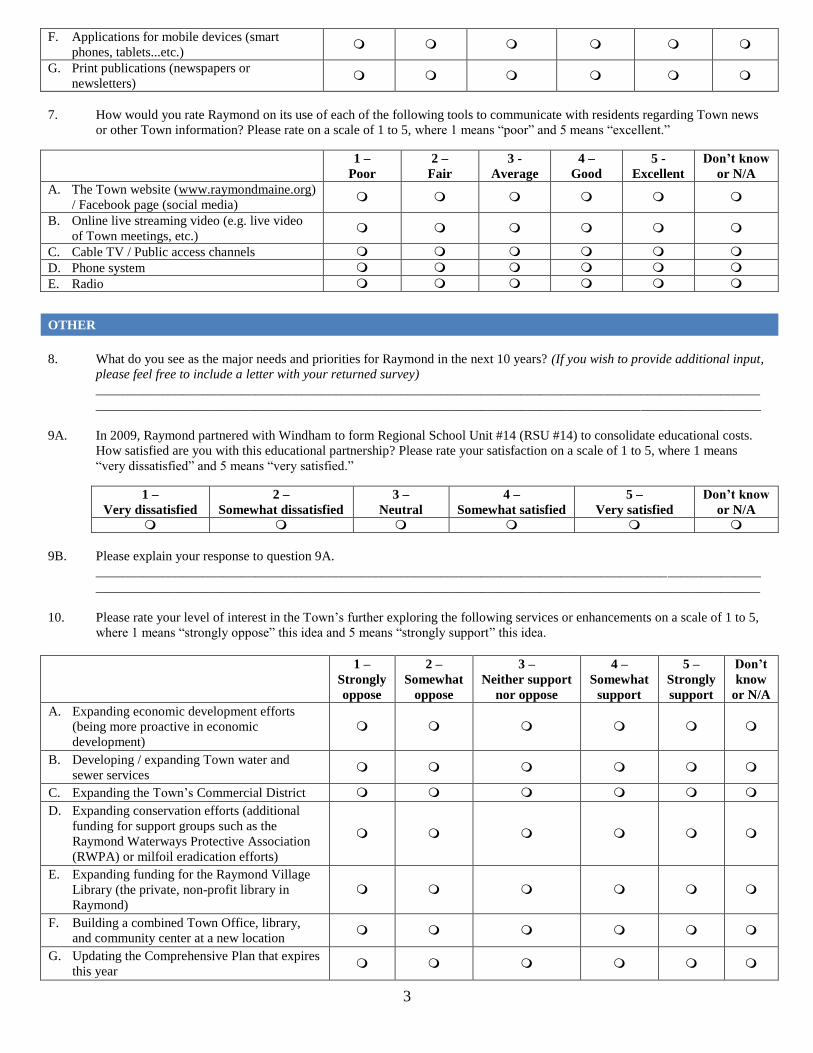
3
F. Applications for mobile devices (smart
phones, tablets...etc.)
G. Print publications (newspapers or
newsletters)
7. How would you rate Raymond on its use of each of the following tools to communicate with residents regarding Town news
or other Town information? Please rate on a scale of 1 to 5, where 1 means “poor” and 5 means “excellent.”
1 –
Poor
2 –
Fair
3 -
Average
4 –
Good
5 -
Excellent
Don’t know
or N/A
A. The Town website (www.raymondmaine.org)
/ Facebook page (social media)
B. Online live streaming video (e.g. live video
of Town meetings, etc.)
C. Cable TV / Public access channels
D. Phone system
E. Radio
OTHER
8. What do you see as the major needs and priorities for Raymond in the next 10 years? (If you wish to provide additional input,
please feel free to include a letter with your returned survey)
____________________________________________________________________________________________________
____________________________________________________________________________________________________
9A. In 2009, Raymond partnered with Windham to form Regional School Unit #14 (RSU #14) to consolidate educational costs.
How satisfied are you with this educational partnership? Please rate your satisfaction on a scale of 1 to 5, where 1 means
“very dissatisfied” and 5 means “very satisfied.”
1 –
Very dissatisfied
2 –
Somewhat dissatisfied
3 –
Neutral
4 –
Somewhat satisfied
5 –
Very satisfied
Don’t know
or N/A
9B. Please explain your response to question 9A.
____________________________________________________________________________________________________
____________________________________________________________________________________________________
10. Please rate your level of interest in the Town’s further exploring the following services or enhancements on a scale of 1 to 5,
where 1 means “strongly oppose” this idea and 5 means “strongly support” this idea.
1 –
Strongly
oppose
2 –
Somewhat
oppose
3 –
Neither support
nor oppose
4 –
Somewhat
support
5 –
Strongly
support
Don’t
know
or N/A
A. Expanding economic development efforts
(being more proactive in economic
development)
B. Developing / expanding Town water and
sewer services
C. Expanding the Town’s Commercial District
D. Expanding conservation efforts (additional
funding for support groups such as the
Raymond Waterways Protective Association
(RWPA) or milfoil eradication efforts)
E. Expanding funding for the Raymond Village
Library (the private, non-profit library in
Raymond)
F. Building a combined Town Office, library,
and community center at a new location
G. Updating the Comprehensive Plan that expires
this year

4
H. Creating an outdoor recreational complex in
the Town for all age groups, which would
include a baseball diamond, tennis courts,
athletic fields, and walking paths
I. Investigating options for alternative high
speed internet service and / or providers (e.g.
fiber optics)
J. Contracting for bulky waste removal services
K. Expanding public access to waterways
11. If you support the Town pursuing any additional services, facilities, infrastructure, or other projects, what level of tax
increase would you find tolerable?
1% 2% 3% 4% 5% 6-10% More than 10%
I would not find any tax increase tolerable
N/A / Do not favor pursuing any additional services, facilities, infrastructure, or other projects
DEMOGRAPHIC QUESTIONS
The last set of questions will only be used for statistical analysis purposes and to ensure that we have a representative sample of
Raymond citizens.
12. Approximately how many years have you lived or owned property in Raymond? ___ years
13. Do you own or rent your current residence?
Own Rent Other (please specify): __________________
14. Are you a year-round or seasonal resident of Raymond?
Year-round Seasonal
15. Counting yourself, how many adults (aged 18 or older) live in your household? ___ adults
16. How many children under the age of 18 live in your household? (Please write “0” if no children under the age of 18 live in
your household)
___ children
17. What is your gender? Female Male
18. Into which of the following categories does your age fall?
18-24 25-34 35-44 45-54 55-64 65 or older
19. What is the highest level of education you have completed?
Less than high school graduate Some college/Two-year college graduate
High school graduate Four-year college graduate
Vocational/Trade school Post-graduate work
20. For tabulation purposes only, which of the following income categories includes your total household income in 2013 before
taxes?
Less than $25,000 $100,000 to $149,999
$25,000 to $49,999 $150,000 or more
$50,000 to $74,999 Prefer not to answer
$75,000 to $99,999
21. Did you vote in the last Town elections in June 2014? Yes No Prefer not to answer
22. Did you go to the annual Town meeting in June 2014? Yes No Prefer not to answer
The Town of Raymond thanks you very much for your time. Please return the survey in the business reply envelope provided
by November 21, 2014. If you have any questions about this survey, please contact Town of Raymond Executive Assistant
Danielle Loring (phone: (207) 655-4742 ext. 133 or email: [email protected]).