20110413 WRF modeling for Houston - Home Page - … · WRF Fractional Cloud Coverage at Low Levels...
29
WRF Meteorological Modeling Status for Houston Bright Dornblaser, Ph.D. Air Quality Division P t dt th SETPMTC Air Quality Division Presented to the SETPMTC April 13, 2011
Transcript of 20110413 WRF modeling for Houston - Home Page - … · WRF Fractional Cloud Coverage at Low Levels...

WRF Meteorological Modeling Status for Houston
Bright Dornblaser, Ph.D.Air Quality Division
P t d t th SETPMTC
Air Quality Division
Presented to the SETPMTCApril 13, 2011

Outline
• WRF configurationg
• Preliminary WRF performance statistics
• Additional evaluation
• Future work
• Conclusions
• Questions
Air Quality Division • WRF Modeling for Houston • BCD • April 13, 2011 • Page 2
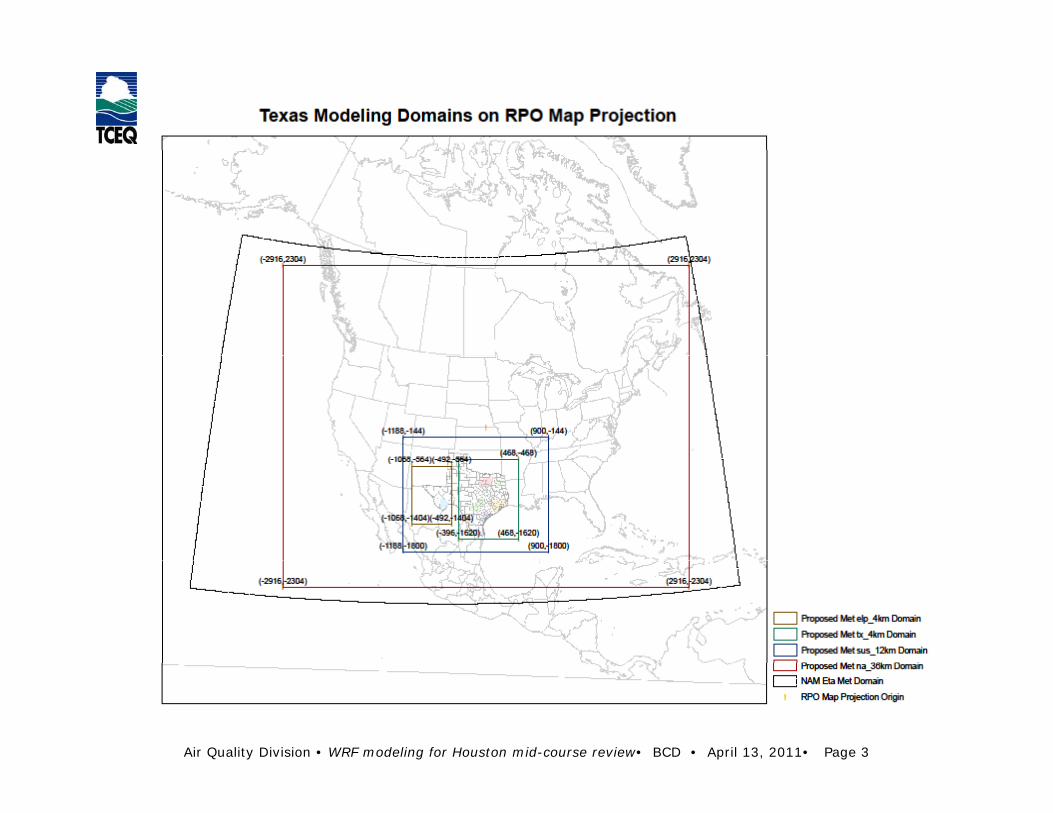
Air Quality Division • WRF modeling for Houston mid-course review• BCD • April 13, 2011• Page 3

What is WRF, Again?
• WRF is the Weather Research and Forecast Model.
• WRF replaces the Fifth Generation M l M l i l M d l (MM5)Mesoscale Meteorological Model (MM5).
Air Quality Division • WRF Modeling for Houston • BCD • April 13, 2011 • Page 4

WRF Configuration
• New RPO map projection and new gridsp p j g
• Physics options include:– YSU PBL scheme – Kain-Fritsch cumulus parameterization– WSM 6 microphysics– 5 layer thermal diffusion5 layer thermal diffusion
• Nudging options include:– Gridded analysis nudging– Observational profiler nudging– Surface nudging
Air Quality Division • WRF Modeling for Houston • BCD • April 13, 2011 • Page 5

WRF Configuration and Testing
• Over 18 major runs and additional minor runs
• PBL options have included:
– MYJ turbulent kinetic energy (1.5 order)– MYNN TKE (2.5 order)( 5 o de )– YSU
• Cumulus schemes have included:
– Grell-Devenyi (cumulus ensemble)Grell Devenyi (cumulus ensemble)– “New” Grell– Kain-Fritsch
• Land-use options have included:• Land use options have included:
– NOAH LSM – including MODIS data– RUC
5 layer thermal diffusion
Air Quality Division • WRF Modeling for Houston • BCD • April 13, 2011 • Page 6
– 5 layer thermal diffusion
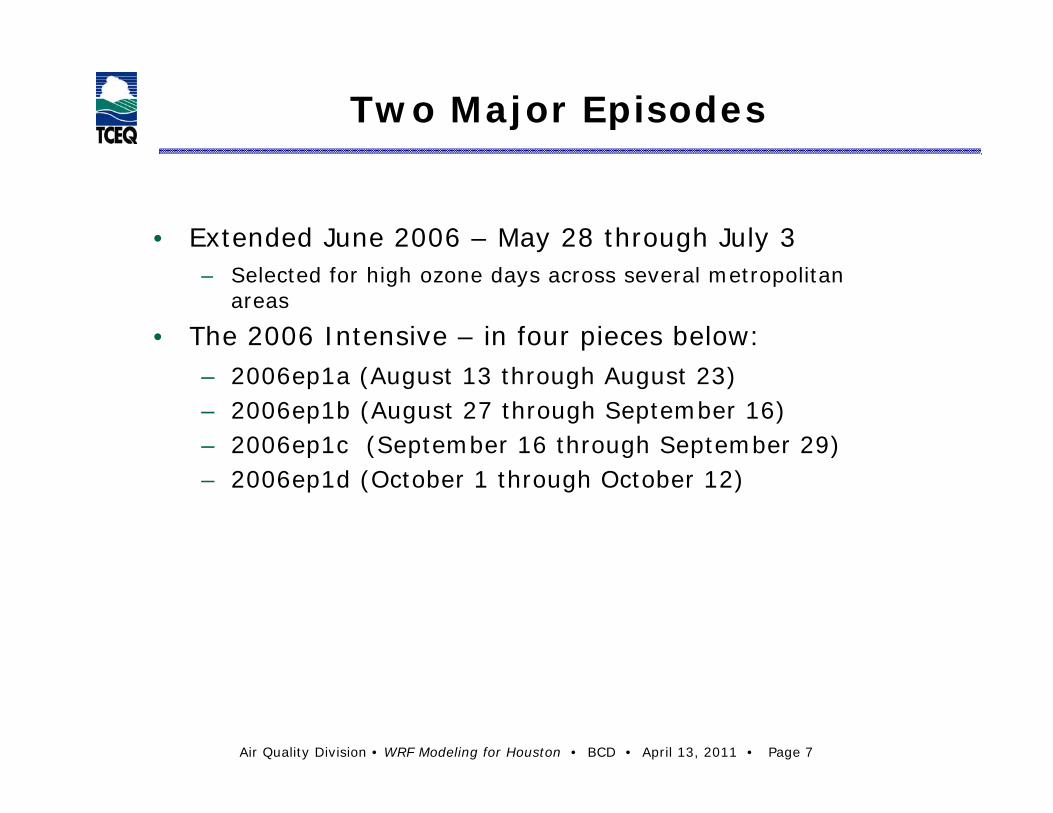
Two Major Episodes
• Extended June 2006 – May 28 through July 3– Selected for high ozone days across several metropolitan
areas
• The 2006 Intensive – in four pieces below:– 2006ep1a (August 13 through August 23)– 2006ep1b (August 27 through September 16)– 2006ep1c (September 16 through September 29)– 2006ep1d (October 1 through October 12)
Air Quality Division • WRF Modeling for Houston • BCD • April 13, 2011 • Page 7
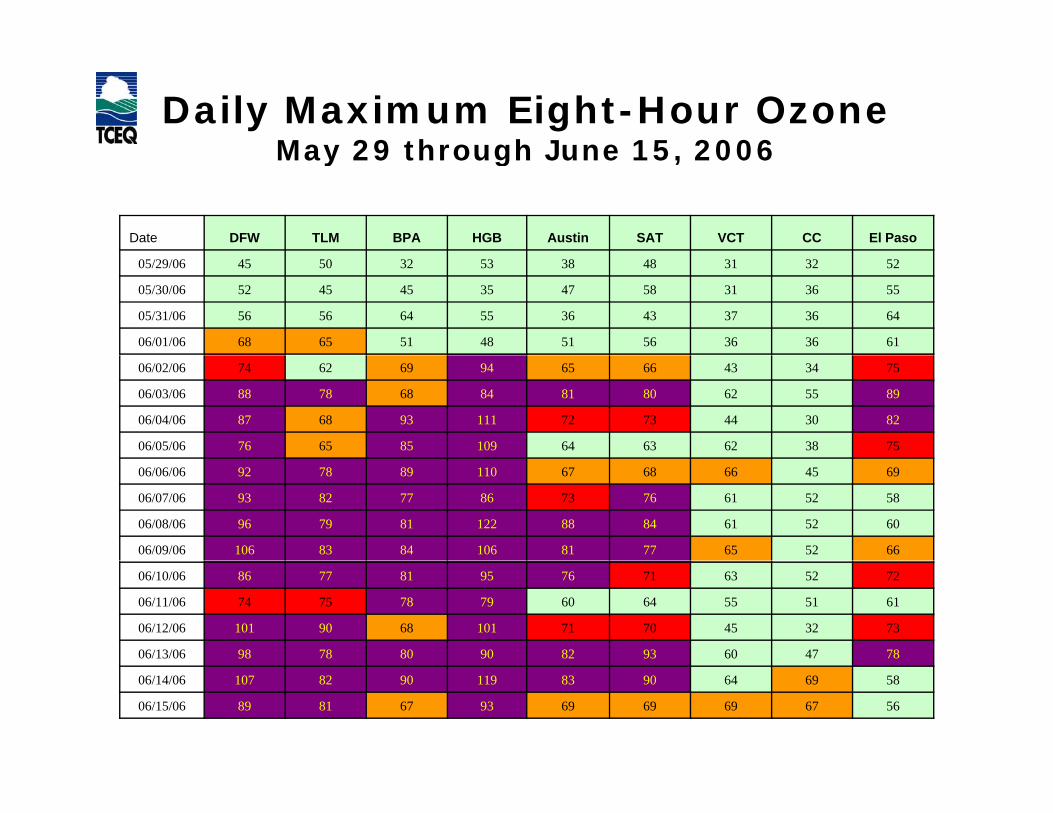
Daily Maximum Eight-Hour OzoneMay 29 through June 15 2006May 29 through June 15, 2006
Date DFW TLM BPA HGB Austin SAT VCT CC El Paso
05/29/06 45 50 32 53 38 48 31 32 52
05/30/06 52 45 45 35 47 58 31 36 55
05/31/06 56 56 64 55 36 43 37 36 64
06/01/06 68 65 51 48 51 56 36 36 61
06/02/06 74 62 69 94 65 66 43 34 75
06/03/06 88 78 68 84 81 80 62 55 89
06/04/06 87 68 93 111 72 73 44 30 82
06/05/06 76 65 85 109 64 63 62 38 75
06/06/06 92 78 89 110 67 68 66 45 69
06/07/06 93 82 77 86 73 76 61 52 58
06/08/06 96 79 81 122 88 84 61 52 60
06/09/06 106 83 84 106 81 77 65 52 66
06/10/06 86 77 81 95 76 71 63 52 72
06/11/06 74 75 78 79 60 64 55 51 61
06/12/06 101 90 68 101 71 70 45 32 73
06/13/06 98 78 80 90 82 93 60 47 78
06/14/06 107 82 90 119 83 90 64 69 58
06/15/06 89 81 67 93 69 69 69 67 56
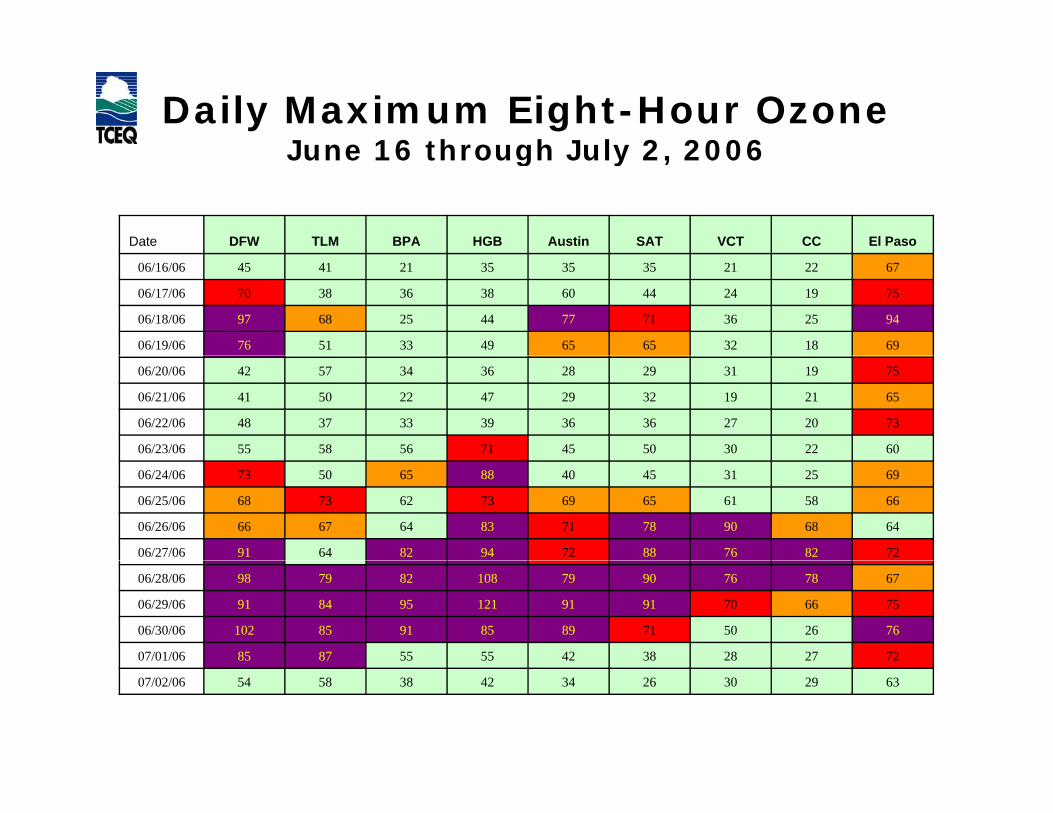
Daily Maximum Eight-Hour OzoneJune 16 through July 2 2006June 16 through July 2, 2006
Date DFW TLM BPA HGB Austin SAT VCT CC El Paso
06/16/06 45 41 21 35 35 35 21 22 67
06/17/06 70 38 36 38 60 44 24 19 75
06/18/06 97 68 25 44 77 71 36 25 94
06/19/06 76 51 33 49 65 65 32 18 69
06/20/06 42 57 34 36 28 29 31 19 75
06/21/06 41 50 22 47 29 32 19 21 65
06/22/06 48 37 33 39 36 36 27 20 73
06/23/06 55 58 56 71 45 50 30 22 60
06/24/06 73 50 65 88 40 45 31 25 69
06/25/06 68 73 62 73 69 65 61 58 66
06/26/06 66 67 64 83 71 78 90 68 64
06/27/06 91 64 82 94 72 88 76 82 72
06/28/06 98 79 82 108 79 90 76 78 67
06/29/06 91 84 95 121 91 91 70 66 75
06/30/06 102 85 91 85 89 71 50 26 76
07/01/06 85 87 55 55 42 38 28 27 72
07/02/06 54 58 38 42 34 26 30 29 63

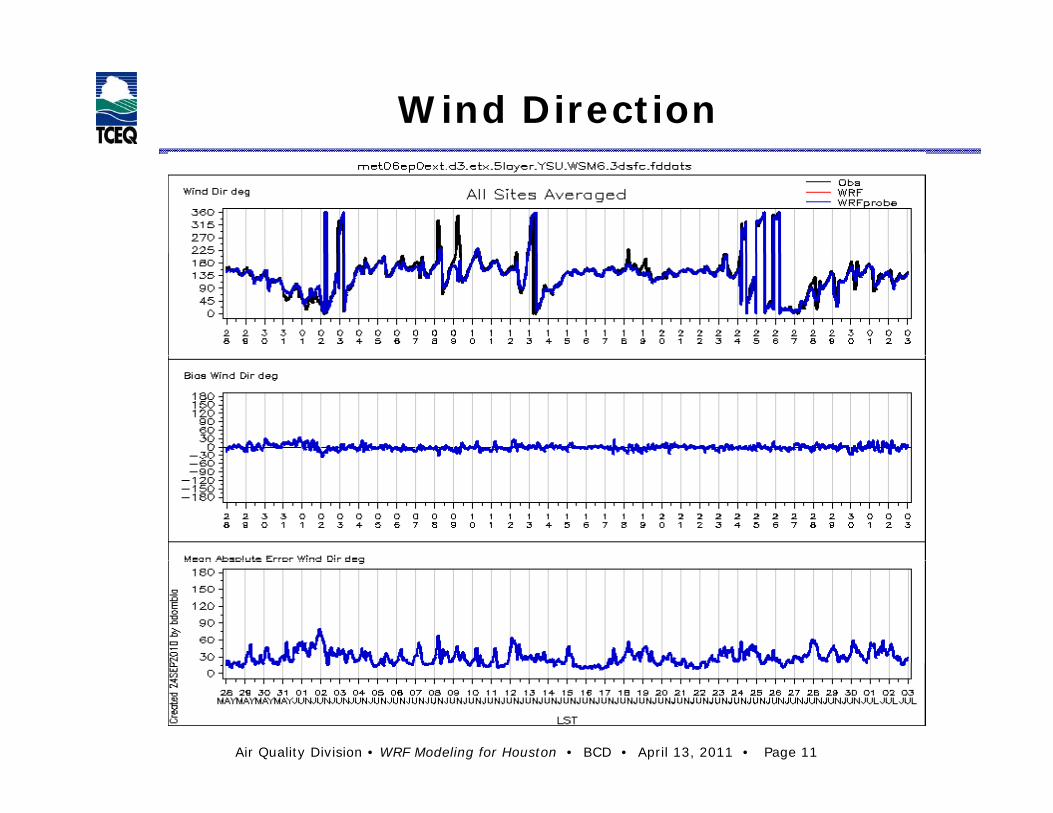
Wind Direction
Insert graphic here
Air Quality Division • WRF Modeling for Houston • BCD • April 13, 2011 • Page 11

Wind Speed
Air Quality Division • WRF Modeling Status• BCD • October 5, 2010 • Page 12

HGB Wind Direction
Air Quality Division • WRF Modeling Status• BCD • October 5, 2010 • Page 13

HGB Wind Speed
Air Quality Division • WRF Modeling Status• BCD • October 5, 2010 • Page 14

HGB Wind Direction2006ep1a
Air Quality Division • WRF Modeling Status• BCD • October 5, 2010 • Page 15

HGB Wind Speed2006ep1a
Air Quality Division • WRF Modeling Status• BCD • October 5, 2010 • Page 16

HGB Wind Direction2006ep1b
Air Quality Division • WRF Modeling Status• BCD • October 5, 2010 • Page 17

HGB Wind Speed2006ep1b
Air Quality Division • WRF Modeling Status• BCD • October 5, 2010 • Page 18

HGB Wind Direction2006ep1c
Air Quality Division • WRF Modeling Status• BCD • October 5, 2010 • Page 19

HGB Wind Speed2006ep1c
Air Quality Division • WRF Modeling Status• BCD • October 5, 2010 • Page 20

HGB Wind Direction2006ep1d
Air Quality Division • WRF Modeling Status• BCD • October 5, 2010 • Page 21

HGB Wind Speed2006ep1d
Air Quality Division • WRF Modeling Status• BCD • October 5, 2010 • Page 22
Future Work
• Preliminary analysis of regional statistics y y gand focus on wind speed and direction are well underway.
E l i ill hif d il ifi • Evaluation will shift to daily specific performance at key monitors.
• Evaluation will expand to clouds • Evaluation will expand to clouds, precipitation and other variables.
Air Quality Division • WRF Modeling for Houston • BCD • April 13, 2011 • Page 23
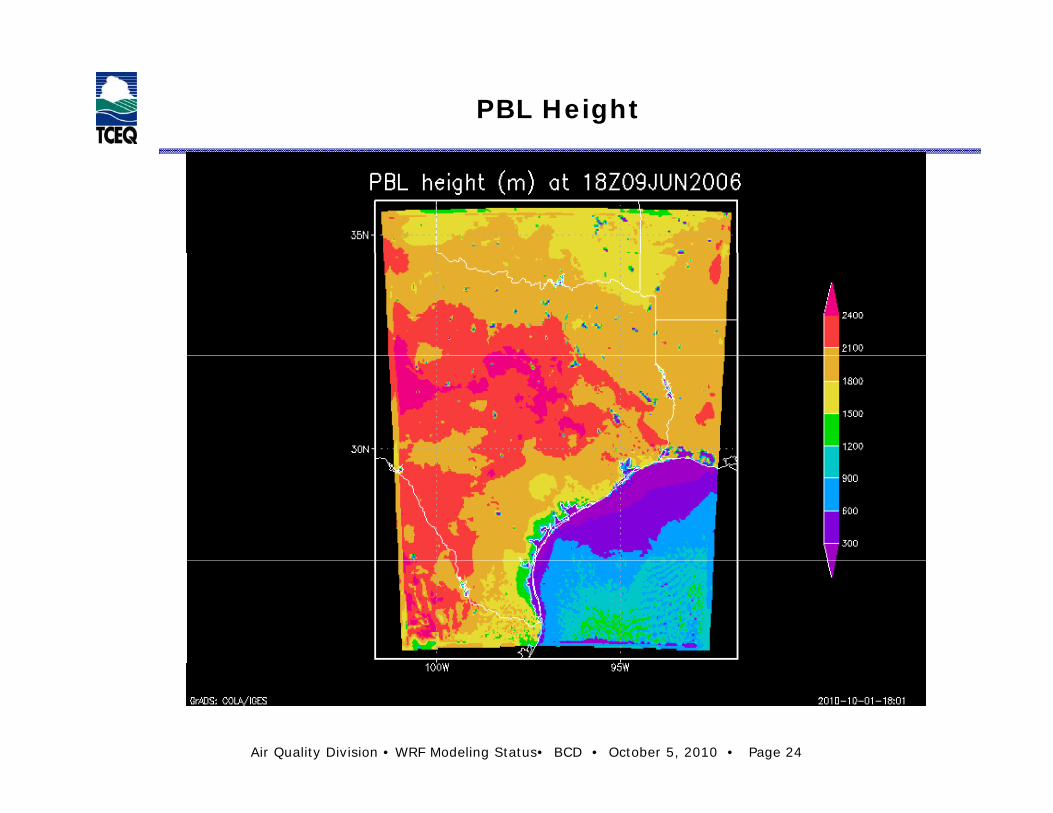
PBL Height
Air Quality Division • WRF Modeling Status• BCD • October 5, 2010 • Page 24

Comparison: Cloud Fraction and Cloud Optical Depthp p
Air Quality Division • WRF Modeling Status• BCD • October 5, 2010 • Page 25

WRF Fractional Cloud Coverage at Low Levels
Air Quality Division • WRF Modeling Status• BCD • October 5, 2010 • Page 26

WRF Fractional Cloud Coverage at Mid Levels
Air Quality Division • WRF Modeling Status• BCD • October 5, 2010 • Page 27

Conclusions
• Several WRF sensitivities testing model configuration and nudging have been g g gperformed.
• Updates and improvements will be id d th b il blprovided as they become available.
• Thanks to Khalid Al-Wali for several WRF runs focusing on surface nudging runs focusing on surface nudging sensitivities and graphics.
Air Quality Division • WRF Modeling for Houston • BCD • April 13, 2011 • Page 28

Questions?
Contact Information:
Bright Dornblaser
512-239-1978
Air Quality Division • WRF Modeling for Houston • BCD • April 13, 2011 • Page 29