


Languages
Pages
Legal

Valorisation of agroindustrial waste for the production of energy, biofuels and
biopolymers
Prof. Gerasimos LyberatosNational Technocal University of Athens
Industrial Waste & Wastewater Treatment & ValorisationAthens, 21-23 May 2015

Biomass: is the oldest and most promising source ofenergy
Βiomass
Biomass Organic and animal wastes, wastewaters, energy crops, agricultural and industrial residues
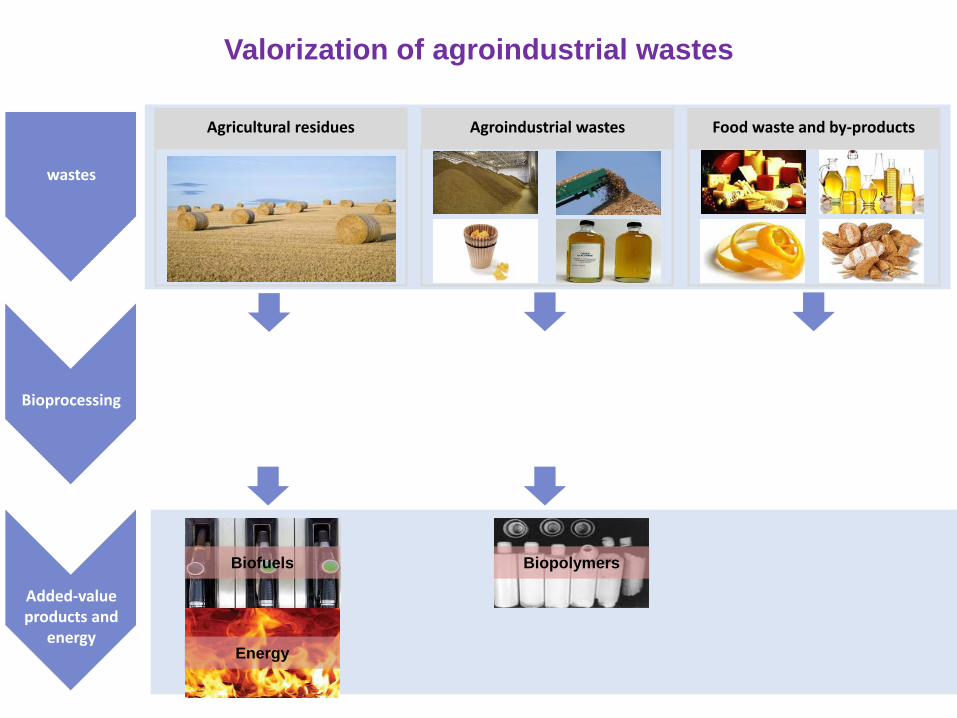
wastes
Agroindustrial wastes
Bioprocessing
Added-valueproducts and
energy
Food waste and by-products
Biofuels Biopolymers
Energy
Agricultural residues
Valorization of agroindustrial wastes

Biomass utilization for energy
• First generation (energy crops)– Serious concern as it replaces food resources
• Second generation (residues, mainly lignocellulosic)• Third generation (algal biomass)

Technologies:
Thermal (direct combustion, pyrolysis, gasification)
Biological (anaerobic digestion, hydrogen fermentation, alcoholic fermentation etc)
Chemical (biodiesel)
Microbial fuel cells (MFCs)
Βiomass Conversion to Biofuels
Direct Electricity Generation:
An emerging new possibility:
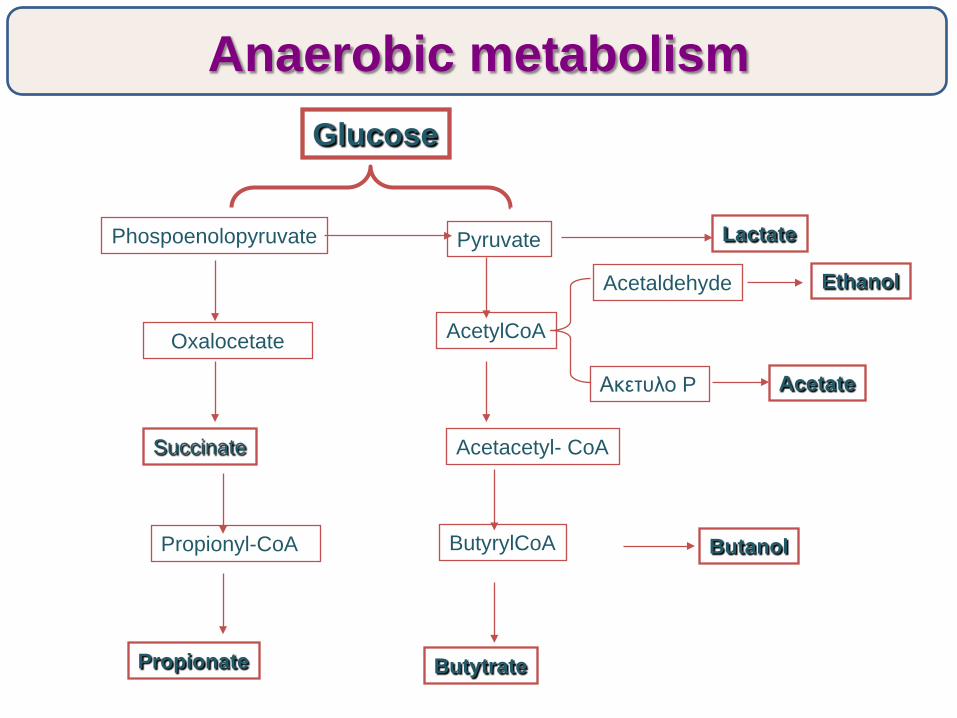
Glucose
Phospoenolopyruvate Pyruvate Lactate
Oxalocetate AcetylCoA
Ακετυλο P
Acetaldehyde
Acetate
Ethanol
Succinate
Propionyl-CoA
Propionate
Acetacetyl- CoA
ButyrylCoA
Butytrate
Butanol
Anaerobic metabolism

What will be produced depends on:
1. Feedstock characteristics2. Microbial species present (pure and mixed
cultures)3. Operating conditions
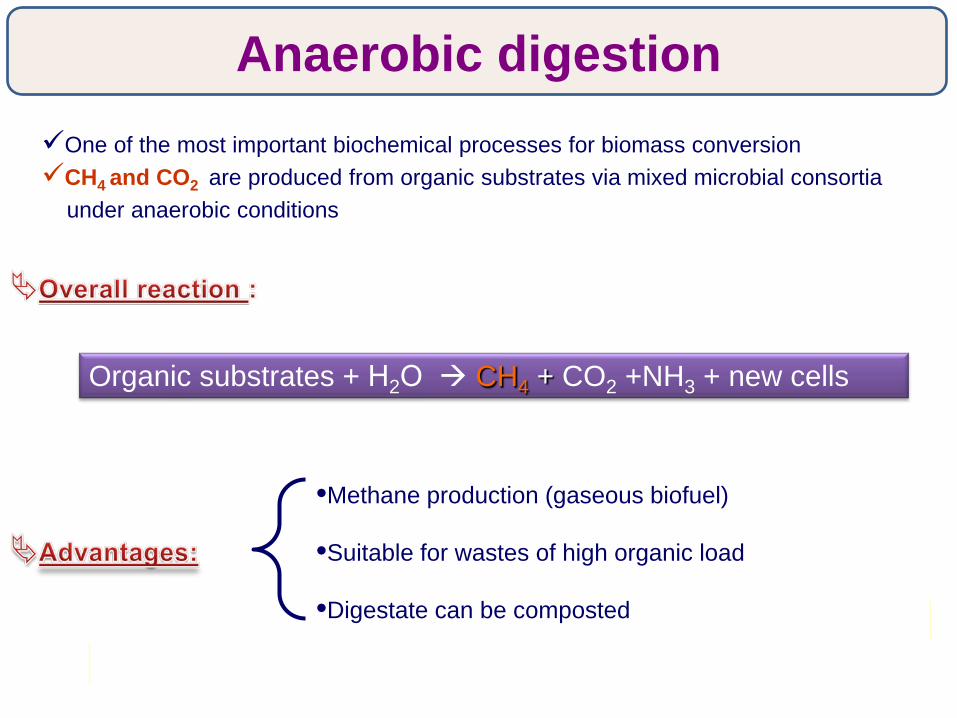
Anaerobic digestion
•Methane production (gaseous biofuel)
•Suitable for wastes of high organic load
•Digestate can be composted
Organic substrates + Η2Ο CH4 + CO2 +NH3 + new cells
One of the most important biochemical processes for biomass conversionCH4 and CO2 are produced from organic substrates via mixed microbial consortia
under anaerobic conditions
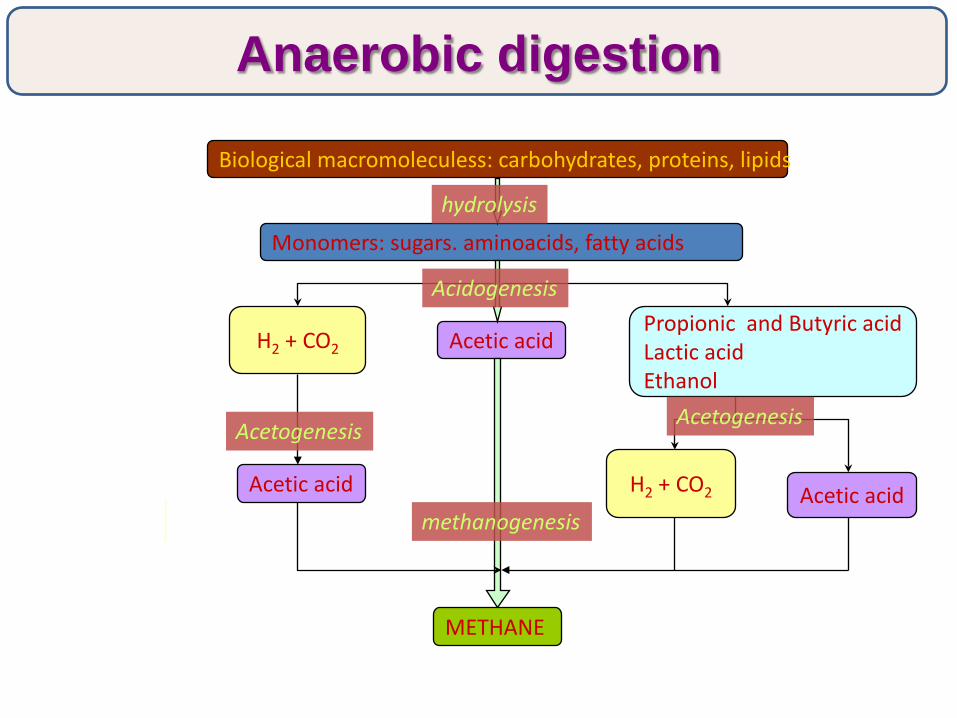
Biological macromoleculess: carbohydrates, proteins, lipids
Monomers: sugars. aminoacids, fatty acids
Acetic acidH2 + CO2
Acetic acidPropionic and Butyric acid Lactic acidEthanol
H2 + CO2
Acetic acid
AcetogenesisAcetogenesis
hydrolysis
Acidogenesis
Anaerobic digestion
METHANE
methanogenesis

Virtually AD is the only feasible biological process for treatingagroindustrial wastewaters (e.g. dairy, piggery and olive-mill)
high organic loadseasonal naturesmall distributed units
Normally high retention times are needed in standard CSTR-type reactors
High-rate reactors such the UASBR and the ABR have beendeveloped

InfluentEffluent
Periodic Anaerobic Baffled Reactor (PABR)
Influent Effluent
… based on the simple ABR configuration ...
Dow
nflow
section Upflo
w
sect
ionThe PABR
compartments arearranged in a circular
manner:
… it was made flexible to alternate its operation between the ABR (compartmentalized) and UASBR (homogenized) operation mode by
directing the influent into all compartments successively.

The experimental PABR
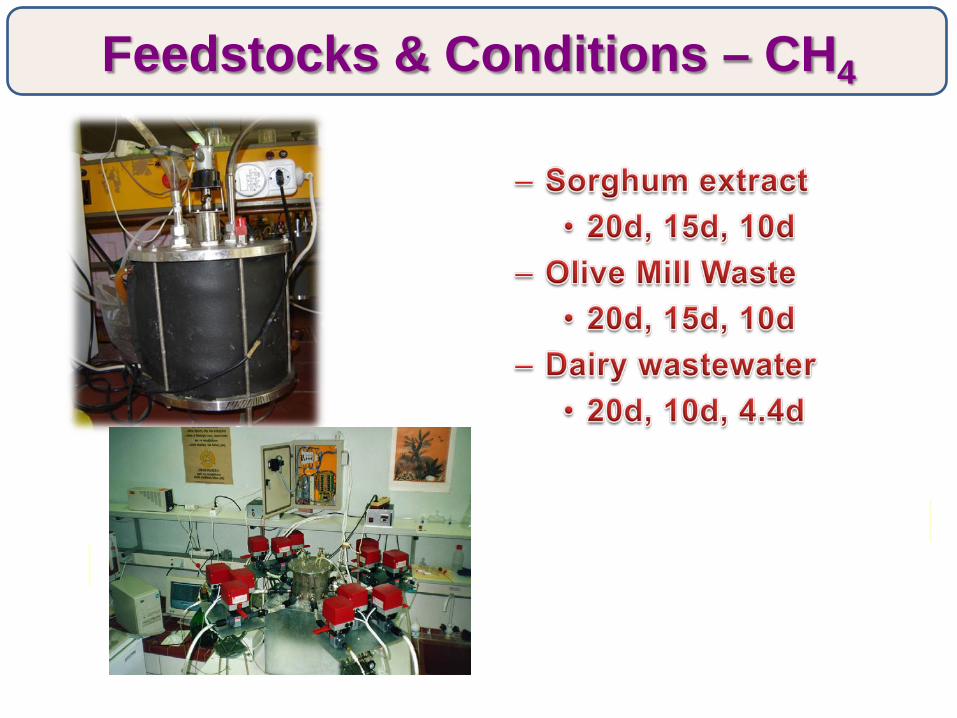
Feedstocks & Conditions – CH4
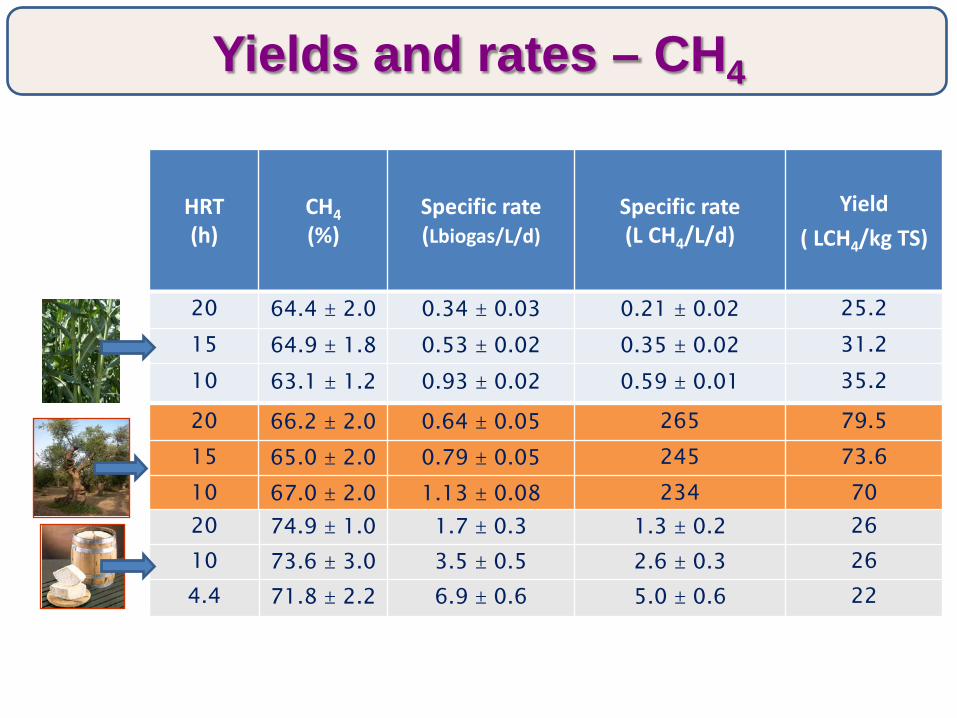
Yields and rates – CH4
HRT(h)
CH4(%)
Specific rate(Lbiogas/L/d)
Specific rate(L CH4/L/d)
Yield( LCH4/kg TS)
20 64.4 ± 2.0 0.34 ± 0.03 0.21 ± 0.02 25.215 64.9 ± 1.8 0.53 ± 0.02 0.35 ± 0.02 31.210 63.1 ± 1.2 0.93 ± 0.02 0.59 ± 0.01 35.2
20 66.2 ± 2.0 0.64 ± 0.05 265 79.515 65.0 ± 2.0 0.79 ± 0.05 245 73.610 67.0 ± 2.0 1.13 ± 0.08 234 7020 74.9 ± 1.0 1.7 ± 0.3 1.3 ± 0.2 2610 73.6 ± 3.0 3.5 ± 0.5 2.6 ± 0.3 264.4 71.8 ± 2.2 6.9 ± 0.6 5.0 ± 0.6 22

Fermentative hydrogen production
Biopolymers: carbohydrates, proteins, lipids
Monomers: sugars. aminoacids, fatty acids
Acetic acidPropionic acidButyric acid, lactic acidEthanol
H2 + CO2
hydrolysis
Acidogenesis
Acetic acidH2 + CO2Acetic acid
AcetogenesisAcetogenesis
METHANE
methanogenesis

Why hydrogen ?
Could be used to produce electricity through fuel cells
Can be produced by renewable raw materials, such as biomass, through biological or thermochemical processes
Possesses the highest specific energy yield (122kJ/g)
A clean and environmentally friendly fuel which produces water instead of greenhouse gases, when burned
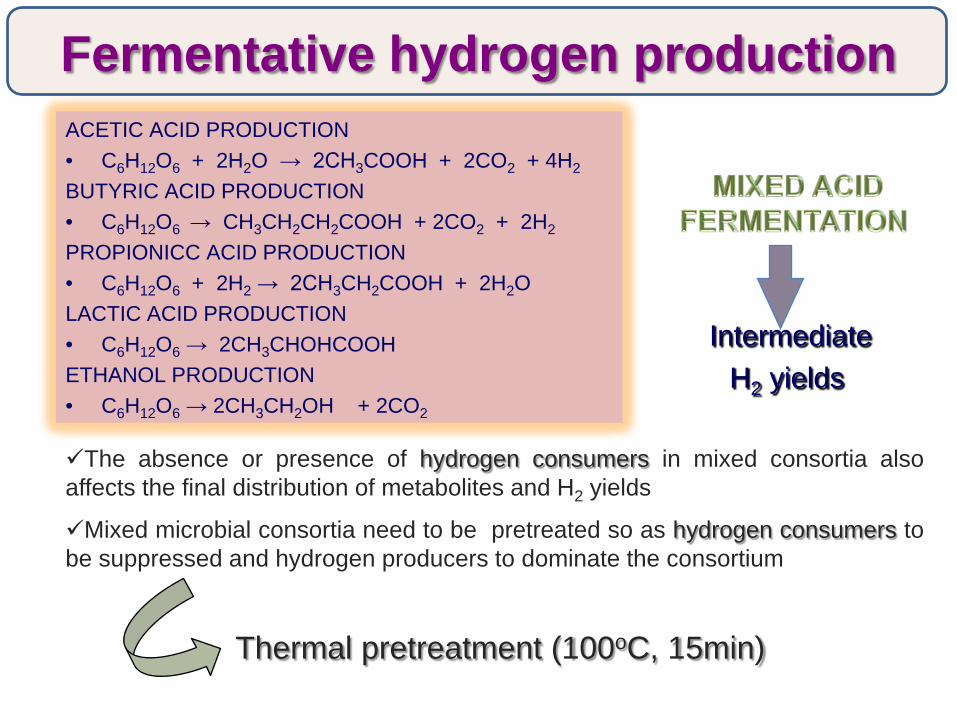
Mixed microbial consortia need to be pretreated so as hydrogen consumers tobe suppressed and hydrogen producers to dominate the consortium
ACETIC ACID PRODUCTION• C6H12O6 + 2H2O → 2CH3COOH + 2CO2 + 4H2
BUTYRIC ACID PRODUCTION• C6H12O6 → CH3CH2CH2COOH + 2CO2 + 2H2
PROPIONICC ACID PRODUCTION• C6H12O6 + 2H2 → 2CH3CH2COOH + 2H2OLACTIC ACID PRODUCTION• C6H12O6 → 2CH3CHOHCOOHETHANOL PRODUCTION• C6H12O6 → 2CH3CH2OH + 2CO2
The absence or presence of hydrogen consumers in mixed consortia alsoaffects the final distribution of metabolites and H2 yields
Intermediate H2 yields
Thermal pretreatment (100oC, 15min)
Fermentative hydrogen production

pH
Temperature
Organic loading
Nutrients concentration
Initial carbohydrates concentration
Η2 partial pressure
Hydraulic Retention Time (HRT)
Parameters affecting fermentative hydrogen production
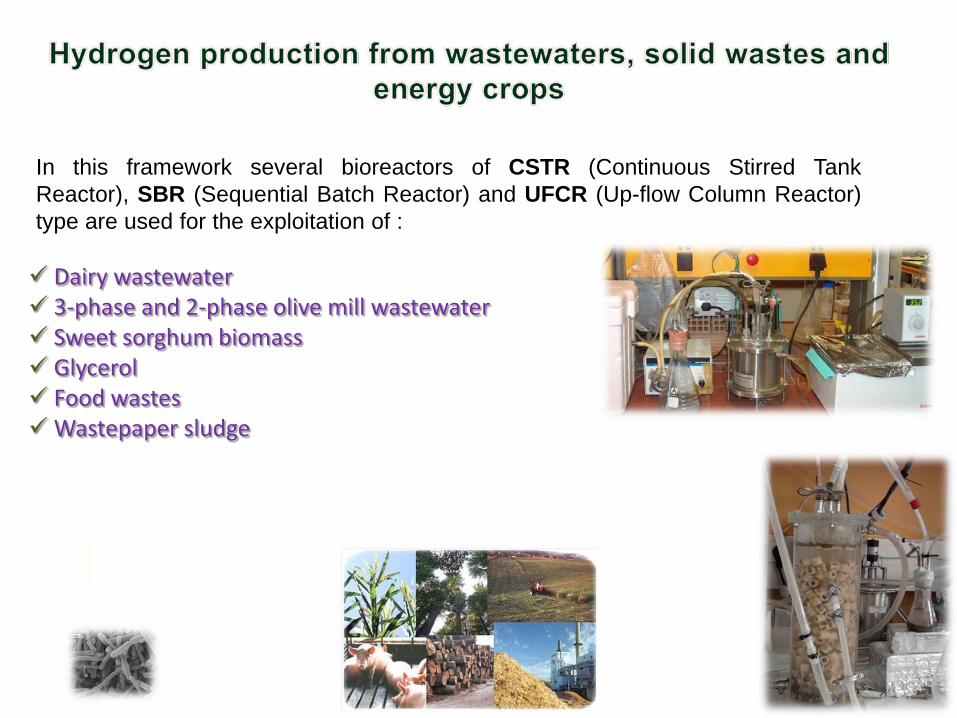
Dairy wastewater 3-phase and 2-phase olive mill wastewater Sweet sorghum biomass Glycerol Food wastesWastepaper sludge
In this framework several bioreactors of CSTR (Continuous Stirred TankReactor), SBR (Sequential Batch Reactor) and UFCR (Up-flow Column Reactor)type are used for the exploitation of :
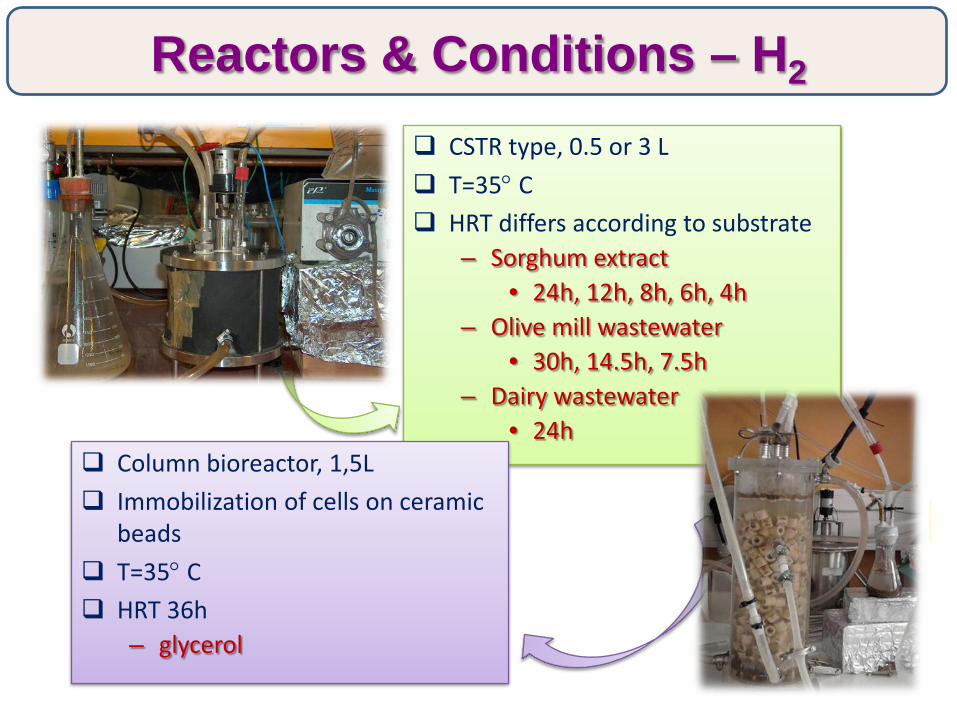
Reactors & Conditions – H2
CSTR type, 0.5 or 3 L T=35° C HRT differs according to substrate
– Sorghum extract• 24h, 12h, 8h, 6h, 4h
– Olive mill wastewater• 30h, 14.5h, 7.5h
– Dairy wastewater• 24h
Column bioreactor, 1,5L Immobilization of cells on ceramic
beads T=35° C HRT 36h
– glycerol
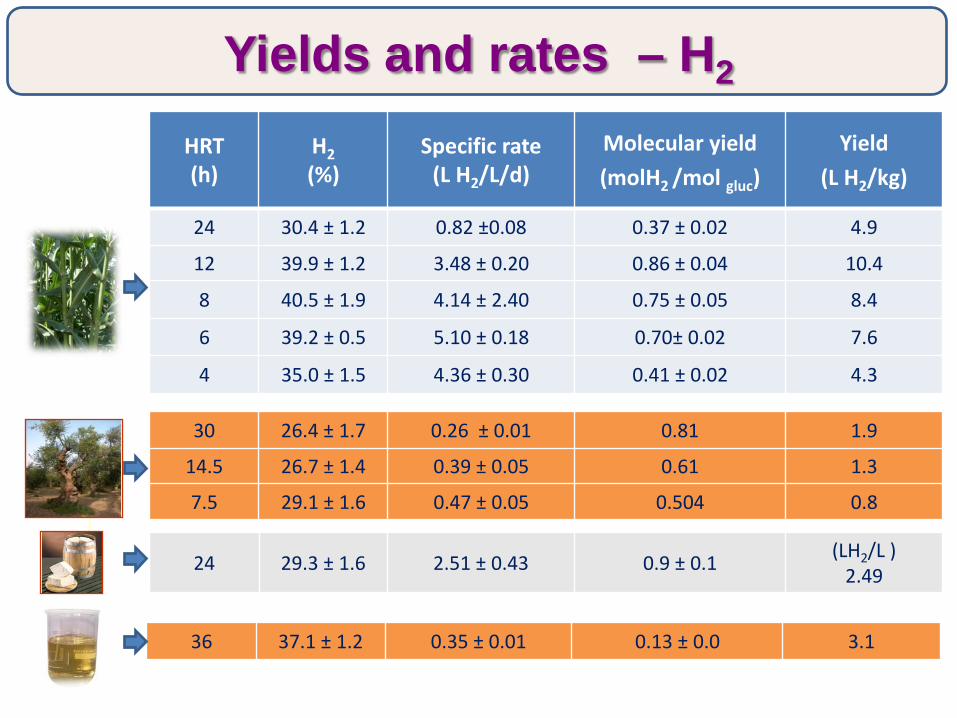
Yields and rates – H2
HRT(h)
H2(%)
Specific rate(L H2/L/d)
Molecular yield(molH2 /mol gluc)
Yield (L H2/kg)
24 30.4 ± 1.2 0.82 ±0.08 0.37 ± 0.02 4.9
12 39.9 ± 1.2 3.48 ± 0.20 0.86 ± 0.04 10.4
8 40.5 ± 1.9 4.14 ± 2.40 0.75 ± 0.05 8.4
6 39.2 ± 0.5 5.10 ± 0.18 0.70± 0.02 7.6
4 35.0 ± 1.5 4.36 ± 0.30 0.41 ± 0.02 4.3
30 26.4 ± 1.7 0.26 ± 0.01 0.81 1.9
14.5 26.7 ± 1.4 0.39 ± 0.05 0.61 1.3
7.5 29.1 ± 1.6 0.47 ± 0.05 0.504 0.8
24 29.3 ± 1.6 2.51 ± 0.43 0.9 ± 0.1 (LH2/L )2.49
36 37.1 ± 1.2 0.35 ± 0.01 0.13 ± 0.0 3.1
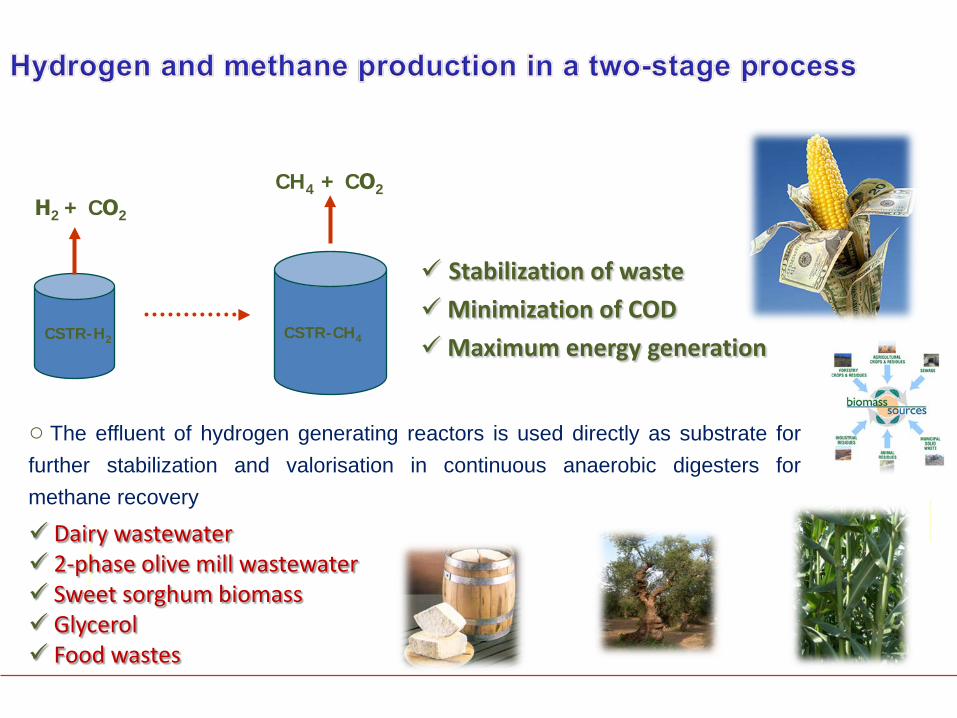
CSTR-H2
Η2 + CΟ2
CSTR-CH4
CH4 + CΟ2
○ The effluent of hydrogen generating reactors is used directly as substrate forfurther stabilization and valorisation in continuous anaerobic digesters formethane recovery
Stabilization of wasteMinimization of CODMaximum energy generation
Dairy wastewater 2-phase olive mill wastewater Sweet sorghum biomass Glycerol Food wastes

PHB intracellular granules formed in Ralstonia eutropha (Yu J., 2002)
R = CH3 ⇒ PHB poly-3-hydroxybutyrate
R = C2H5 ⇒ PHV poly-3-hydroxyvalerate
Production of polyxydroxyalkanoates

24
PHAs Biosynthesis

Alternating nutrient limitation (carbon & nitrogen)leads to PHA formation when nitrogen availability is limited
25CEST2013-Athens,Greece
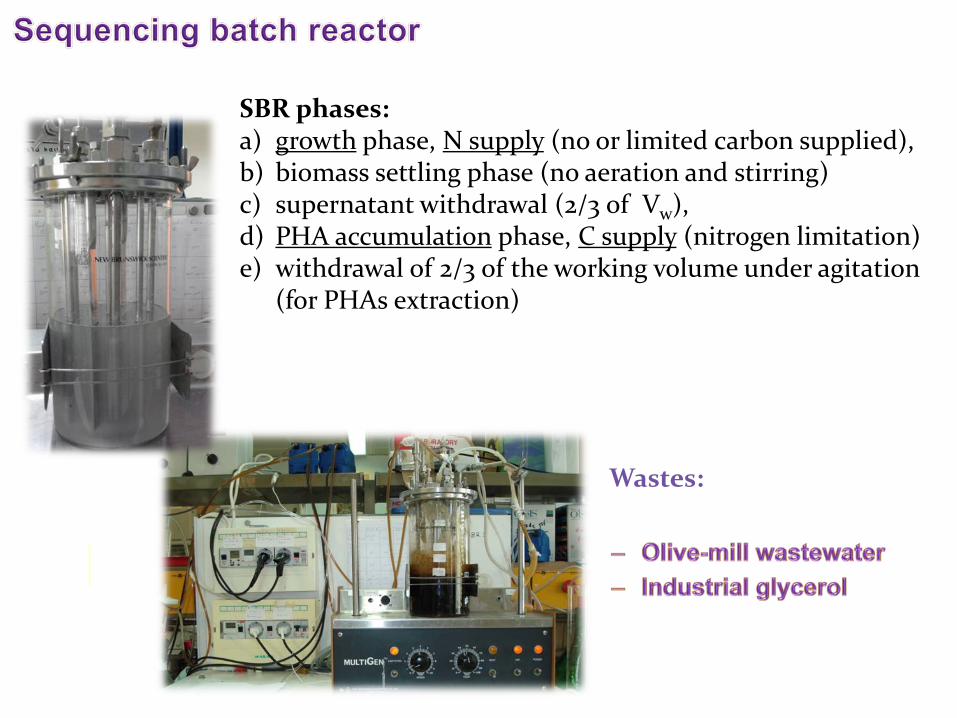
SBR phases:a) growth phase, Ν supply (no or limited carbon supplied),b) biomass settling phase (no aeration and stirring)c) supernatant withdrawal (2/3 of Vw),d) PHA accumulation phase, C supply (nitrogen limitation)e) withdrawal of 2/3 of the working volume under agitation
(for PHAs extraction)
Wastes:

27CEST2013-Athens,Greece

Collecting dry biomass by centrifugation, freezing and lyophilization
28
Extraction with chloroform
Purification: Mixing the extract with methanol for precipitation of bioplastic and then filtration
Collection of the solid and re-dissolution in chloroform to obtain bioplastic films

A fuel cell is an electrochemical energyconversion device that produces electricity fromexternal supplies of fuel (on the anode side) andoxidant (on the cathode side).
In the microbial fuel cell electricity is producedvia microorganisms
Pure substrates:
Glucose, lactose
Glycerol
Wastes:
dairy wastewater
municipal wastewater
Substrates studied:

The working principle of an MFC
Bacteria
H +
Anode Cathode
e-
Electricity
CEM
CatalystCO2
Chemistry of MFC: As an example, glucose is used as an organic substrate.Anode : C6H12O6 + 6H2O 6CO2 + 24H+ + 24e-
Cathode : 24H+ + 24e- + 6O2 12H2O
6O2
External resistance
H2O

Two-chamber MFC
Two bottles connected via a glass tube.
Anode electrode: carbon fiber paper
Cathode electrode: carbon cloth coated
with a Pt catalyst
Proton exchange membrane (Nafion 117)
CathodeAnode
Nafion

Experiments using (diluted) cheese whey as substrate
Diluted cheese whey (dilution 1:100) at a final concentration of 0.73 g COD/L
After addition of fresh medium:
the MFC voltage increased rapidly,
reaching a constant value within
only a few hours (approximately 50
mV for an external load of 100 Ω)
COD removal completed within 50
hours, accompanied by rapid
decrease in voltage
0 10 20 30 40 50 60 70 800,00
0,01
0,02
0,03
0,04
0,05
0,06
Ucell
(V)
Time (h)
0 10 20 30 40 50 60 70 800
200
400
600
800
COD
(mgO
2/L)
Time (h)

Varying the external load from
0.1 to 1000 kΩ
Maximum power density 18.4 mW/m2
0 40 80 120 1600
5
10
15
20
Powe
r den
sity
(mW
/m2 )
Current density (mA/m2)
0 40 80 120 1600,0
0,2
0,4
0,6
Ucell
(V)
Current density (mA/m2)

Experiments with cheese whey
Initial concentration (mg COD/L)
% COD removal
Duration of each cycle (h)
Maximum power output (mW/m2)
350 95 68 40.5700 96 110 39.91500 96 213 39.82700 96 335 386700 96 851 42
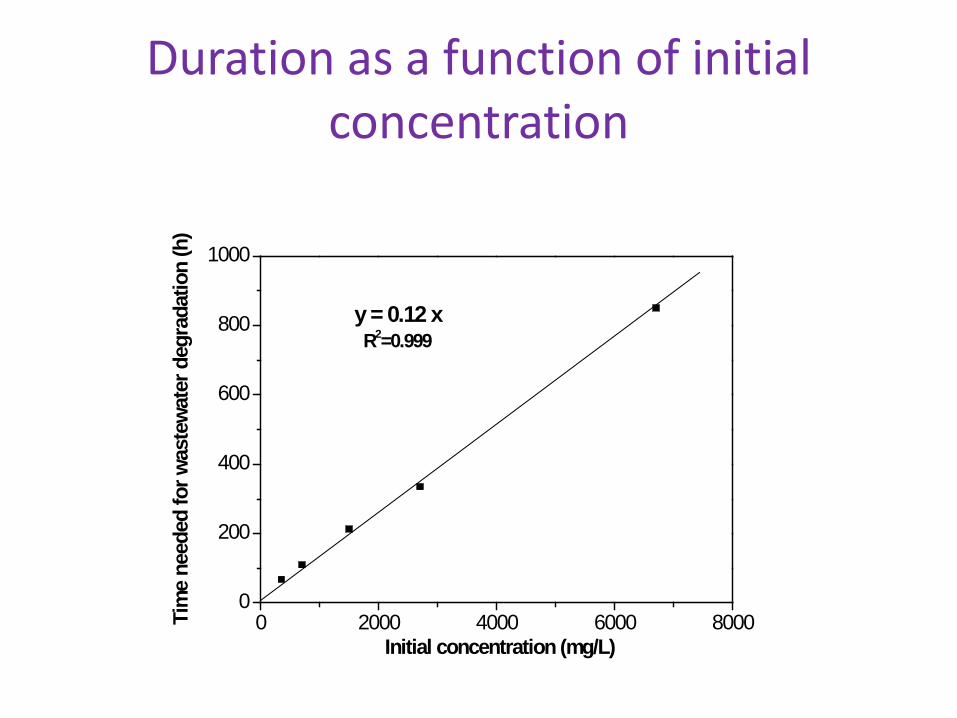
Duration as a function of initial concentration
0 2000 4000 6000 80000
200
400
600
800
1000
y = 0.12 x R2=0.999
Initial concentration (mg/L)
Tim
e ne
eded
for w
aste
wate
r deg
rada
tion
(h)

Single cell chamber

Innovative single chamber MFC
A single cylindrical plexiglas chamber with four plexiglas tubes placed, in a concentric arrangement, inside the chamber.
The tubes inside the cell were homogenously drilled with holes
Anode electrode: graphite granules.
Cation Exchange Assembly: GORE-TEX ® cloth covered with graphite conductive paint and electrolytic manganese oxide, MnO2.

Continuously operated Single chamber performance using glucose as substrate
0 200 400 600 800 1000 12000
0,05
0,10
0,15
0,20
0,25
0,30
0,35
0,40 Ucell CODout CODin
Time (h)
U cell
(V)
0
0,2
0,4
0,6
0,8
1,0
1,2
16h 24h30h20h
50ml/3h
g COD/L
60h
HRT

Thank you for your attention !
Top Related