


Languages
Pages
Legal


Update on JSR20i6 in FY March 2017
May 25, 2016
Representative Director and President
1

Table of Contents
2
Outline
Overview Summary of our mid-term business plans, JSR20i3 and JSR20i6
Present business management policy
Measures for each business
Petrochemicals business
Fine chemicals business
Life Sciences business・Lithium-ion Capacitor business
Capital allocation policy
Summary
Outline
3
Outline
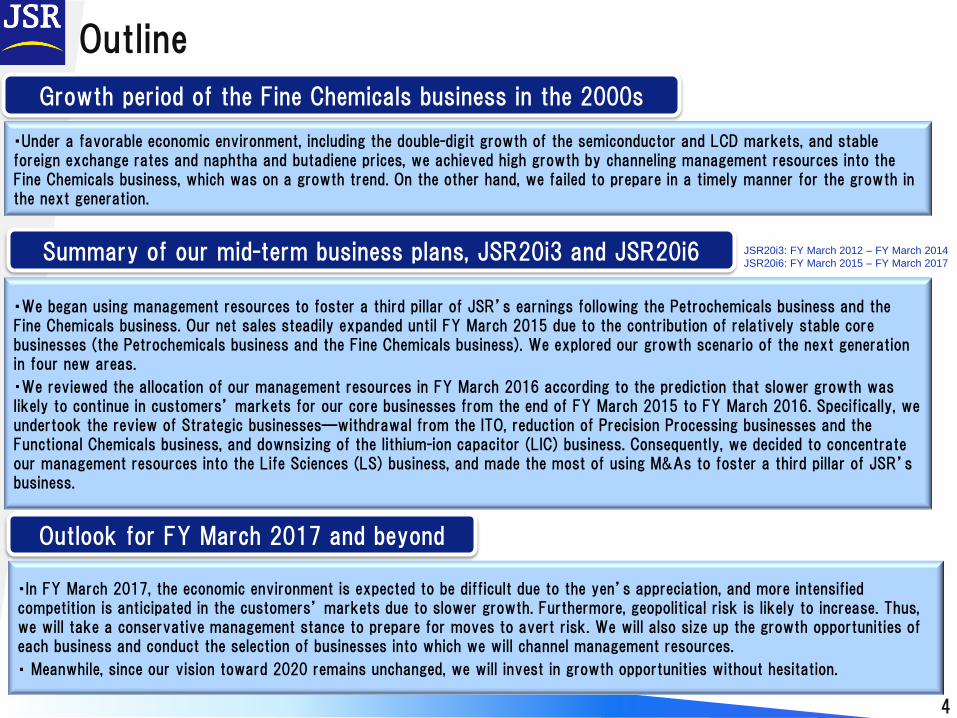
・Under a favorable economic environment, including the double-digit growth of the semiconductor and LCD markets, and stable foreign exchange rates and naphtha and butadiene prices, we achieved high growth by channeling management resources into the Fine Chemicals business, which was on a growth trend. On the other hand, we failed to prepare in a timely manner for the growth in the next generation.
・We began using management resources to foster a third pillar of JSR’s earnings following the Petrochemicals business and the Fine Chemicals business. Our net sales steadily expanded until FY March 2015 due to the contribution of relatively stable core businesses (the Petrochemicals business and the Fine Chemicals business). We explored our growth scenario of the next generation in four new areas.
We reviewed the allocation of our management resources in FY March 2016 according to the prediction that slower growth was likely to continue in customers’ markets for our core businesses from the end of FY March 2015 to FY March 2016. Specifically, we undertook the review of Strategic businesses—withdrawal from the ITO, reduction of Precision Processing businesses and the Functional Chemicals business, and downsizing of the lithium-ion capacitor (LIC) business. Consequently, we decided to concentrate our management resources into the Life Sciences (LS) business, and made the most of using M&As to foster a third pillar of JSR’s business.
・In FY March 2017, the economic environment is expected to be difficult due to the yen’s appreciation, and more intensified competition is anticipated in the customers’ markets due to slower growth. Furthermore, geopolitical risk is likely to increase. Thus, we will take a conservative management stance to prepare for moves to avert risk. We will also size up the growth opportunities of each business and conduct the selection of businesses into which we will channel management resources.
Meanwhile, since our vision toward 2020 remains unchanged, we will invest in growth opportunities without hesitation.
4
Growth period of the Fine Chemicals business in the 2000s
Outlook for FY March 2017 and beyond
Summary of our mid-term business plans, JSR20i3 and JSR20i6 JSR20i3: FY March 2012 – FY March 2014
JSR20i6: FY March 2015 – FY March 2017

Overview
5

914 895 923 994 1,038 1,065
523 535 571 633 657
721
391 360 352 361 381 344
15.3% 15.3% 15.4% 16.1% 16.3%
18.7%
11.5% 10.3% 9.5% 9.1% 9.4% 8.9%
0.0%
5.0%
10.0%
15.0%
20.0%
25.0%
30.0%
35.0%
40.0%
0
200
400
600
800
1,000
1,200
2010 2011 2012 2013 2014 2015
Gross Profit SGA Operating Profit SGA to sales ratio Operating margin
Summary of our mid-term business plans, JSR20i3 and JSR20i6: Changes in earnings
(Unit: 100 million yen)
・We actively explored and fostered new businesses until FY March 2015 against the backdrop of a steady sales increase in core businesses supported by relatively stable growth of the customers’ market.
• However, we will reallocate management resources by taking into account changes in the latest economic and market environments and rising geopolitical risk.
JSR20i3 JSR20i6 6

914 895 923
994 1,038 1,065
15.3% 15.3% 15.4% 16.1% 16.3%
18.7%
0.0%
5.0%
10.0%
15.0%
20.0%
25.0%
30.0%
35.0%
40.0%
0
200
400
600
800
1,000
1,200
2010 2011 2012 2013 2014 2015
Gross Profit Operating Profit SGA to sales ratioSales
4,041 3,867
3,943 3,715
3,499
(Unit: 100 million yen)
・Net sales increased by around 60.0 billion yen (Elastomers business: around 40.0 billion yen; Fine Chemicals business: around 20.0 billion yen) from FY March 2011 to FY March 2015. Although gross profit also grew by around 12.0 billion yen during the same period, it fell short of the initial target. An increase in selling and general administrative expenses (SGA) cut into profit.
・Although we explored the next growth scenario in four business areas from FY March 2011, we have decided to concentrate our management resources into the LS business in the future. We withdrew from ITO business. We will transfer the Functional Chemicals business to a group company in order to focus on the sales.
3,407
7
Summary of our mid-term business plans, JSR20i3 and JSR20i6: Earnings and cost structure
523
SGA
535 571
633 657
721
JSR20i3 JSR20i6

Restraint in management resource spending and cost reduction by CR-G *1
Summary of our mid-term business plans, JSR20i3 and JSR20i6: Changes in management and business strategies
Petrochemicals business
Growth period of the Fine Chemicals business JSR20i3 JSR20i6
8
Relying on domestic businesses and maintaining earnings
Investment of management resources with the aim of achieving global growth (such as the establishment of an overseas production base)
Preparation of global infrastructures
Determination of the switch to global production of SSBR and the establishment of the foundation therefor. E100*2:cost structure reform
Extracting growing products
Commencement of SSBR global production Cancellation of a manufacturing outsourcing agreement in Europe
Full-scale global development
Semiconductor materials: 【Semiconductor materials】 Response to ballooning capital expenditures → Consolidation of R&D bases in Japan 【LCD materials】 Further localization of operations (manufacturing and sales + R&D)
Global development 【Semiconductor materials】 Recapture of No.1 position; growth based on the product portfolio strategy 【LCD materials】 Acceleration of business development in China and a delay in the restructuring of the business structure
Measures to cope with
slower growth
Exploration of growth opportunities in four business areas: Functional Chemicals, Precision Processing and ITO, LIC *5, and LS
Exploration of investment opportunities in four strategic
business areas Establishment of the LS business as a third pillar of JSR’s business and use of an inorganic growth strategy (consolidation of KBI *3 and MBL*4) Reduction of the Functional Chemicals business and the Precision Processing. Withdrawal from ITO businesses, and downsizing of the LIC business
Selection of the Strategic business
Fine Chemicals business
Strategic business
(New business)
*1CR-G:Abbreviation of “Cost Reduction for Growth” (Name of the cost structure reform in JSR)、*2E100: Abbreviation of “Efficiency100” (Name of the cost structure reform in JSR).
*3 KBI:KBI Biopharma Inc., *4MBL:MEDICAL & BIOLOGICAL LABORATORIES CO., LTD., *5LIC:lithium-ion capacitor.

・We will concentrate on the front-end area, which will become a driver for miniaturization. We will aim to seize a leading market share in the lithography materials business and continue to expand the product portfolio, such as post CMP cleaning solutions and materials for High-Density packaging, by fully utilizing R&D facilities and strategic alliances with customers.
Present business management policy
Petro chemicals
・Since the SSBR market has been growing as expected, we will continue focusing on this business. As the market in Japan has been shrinking, we will not exclude the possibility of forming a business alliance with other companies.
・The commoditization of products has progressed rapidly. The globalization of our R&D system brought the opposite results of what we had aimed for. We will streamline the operation costs and management resources.
・The acquisition of KBI and MBL has expanded our business opportunities, raising the possibility that the LS business will achieve net sales of 40.0 billion yen to 50.0 billion yen in 2020. We will accelerate the growth of the LS business using these companies as a vehicle and aim to bring the business segment into the black in around two years.
・We decided to focus on high-value added applications which have more advantages over LiB and other energy-storing devices. We will promote development of the market while minimizing the business investments.
Display
Semicon- ductor
LS
LIC
9

Measures for each business
10

Petrochemicals business: Change in the spread between butadiene (BD) and naphtha prices
・In the 2010s, prices of BD and naphtha have drastically fluctuated. The spread between BD and naphtha prices has narrowed since FY March 2015 due to the oversupply of BD and weak demand, particularly in eastern Asia. We forecast the market will remain sluggish in FY March 2017.
*Source: Statistics of Platts and JSR, etc.
0
500
1,000
1,500
2,000
2,500
3,000
3,500
4,000
4,500Change in butadiene and naphtha prices
Spread (Butadiene-Naphtha)
Butadiene
Naphtha
Lehman
Shock
11
(Unit:$/ton)
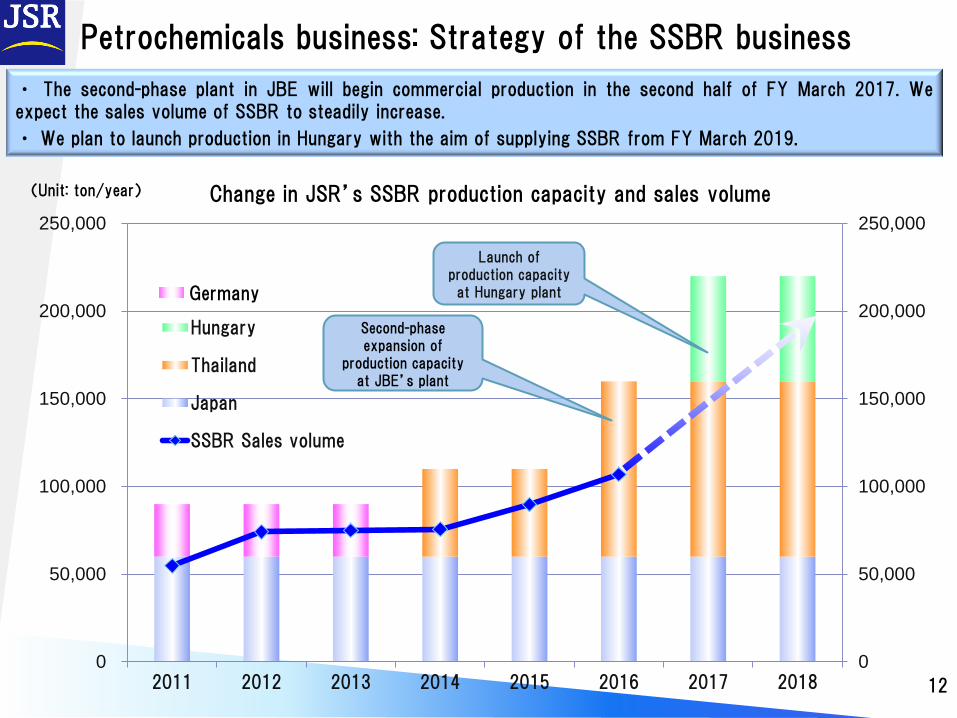
Petrochemicals business: Strategy of the SSBR business
Change in JSR’s SSBR production capacity and sales volume
• The second-phase plant in JBE will begin commercial production in the second half of FY March 2017. We expect the sales volume of SSBR to steadily increase.
• We plan to launch production in Hungary with the aim of supplying SSBR from FY March 2019.
12
0
50,000
100,000
150,000
200,000
250,000
0
50,000
100,000
150,000
200,000
250,000
2011 2012 2013 2014 2015 2016 2017 2018
Hungary
Thailand
Japan
SSBR Sales volume
Germany
Second-phase expansion of
production capacity at JBE’s plant
Launch of production capacity at Hungary plant
(Unit: ton/year)

・Strengthening sales bases in Europe
・Forming specialized units for tire materials
Petrochemicals business: Strategy of the SSBR business
・We will aim to expand the top line of the SSBR business by implementing the following measures: Technology (establishment of the next generation technology), Production (launch of the second-phase plant in JBE), and Marketing (strengthening of overseas sales bases).
Production
Marketing
Technology
13
・Launching the second-phase plant in JBE
・Ensuring the completion of customers’ approval
・Promoting the shift to overseas products
・Establishing the fifth generation technology
・Launching products targeted at the high-volume segment of the S-SBR market

14
Techno America
UMG Indonesia
Techno Europe
Petrochemicals business: Next Jump in the Plastics business
Otake Ube
Yokkaichi
Domestic manufacturing capacity of ABS resin (from FY March 2016) (KTA)
Company Country Base location Capacity
Techno Polymer Japan Yokkaichi 250
UMG ABS Japan Ube 100
Otake 50
NIPPON A&L INC. Japan Ehime 70
Osaka 30
Toray Industries, Inc. Japan Chiba 72
Denka Company Limited Chiba 50
Total 622
● Factory locations of Techno Polymer ● Factory locations of UMG ABS
・Since the domestic market has been shrinking year by year, we plan to consolidation of Plastics business with UMG ABS in order to establish a solid business structure that we can provide stable supplies in the future. Furthermore, we aim to expand oversea sales aggressively by combination of the two companies’ differentiated material technologies.

0
200
400
600
800
Change in sales of the semiconductor materials
Lithography Process Packaging and other
Semiconductor materials business: Market trend and JSR’s sales forecast
90
100
110
120
130
140
150 Wafer(200-300mm) Resist(KrF&ArF)
32~22nm 45nm 14~7nm
ArF and KrF photoresist market
CAGR:
+5%(’10-’15)
Silicon wafer input growth rate:
+4%(’10-’19)
・Since more than moore continues, the lithography market is expected to continue to grow faster than the wafer market. We will continue to focus on the cutting-edge processing technology of front-end process and secure the leading position in the market.
15
32~22nm
45nm 14~7nm
Growth in silicon wafer input (area) vs.
Growth in the photoresist material market (value)
(Unit: 100 million yen)
(2010 base of 100)
* Source: JSR prepared the chart based on statistics of Gartner, etc.
JSR Micro, Inc.
(United States)
* Image of an EUV joint venture company
Manufac- turing
facilities
EUV joint venture
company
Contract Manufacturing
Rights to use an EUV exposure
tool
EUV exposure
tool
Analysis tool
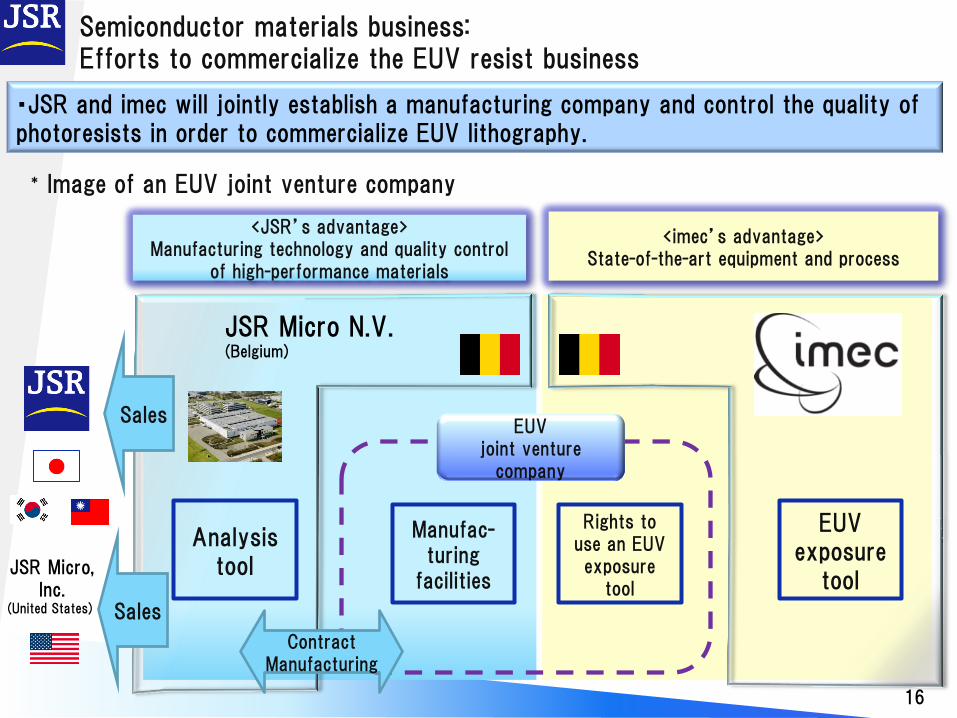
・JSR and imec will jointly establish a manufacturing company and control the quality of photoresists in order to commercialize EUV lithography.
Semiconductor materials business: Efforts to commercialize the EUV resist business
Sales
JSR Micro N.V. (Belgium)
<JSR’s advantage> Manufacturing technology and quality control
of high-performance materials
<imec’s advantage> State-of-the-art equipment and process
16
Sales
0
200
400
600
800
Change in sales of the Display materials business
Display materials business: Market trends and JSR’s efforts
80
100
120
140
160
180Trend in TV panel shipments
Panel Area Shipment value
Maintaining stable earnings
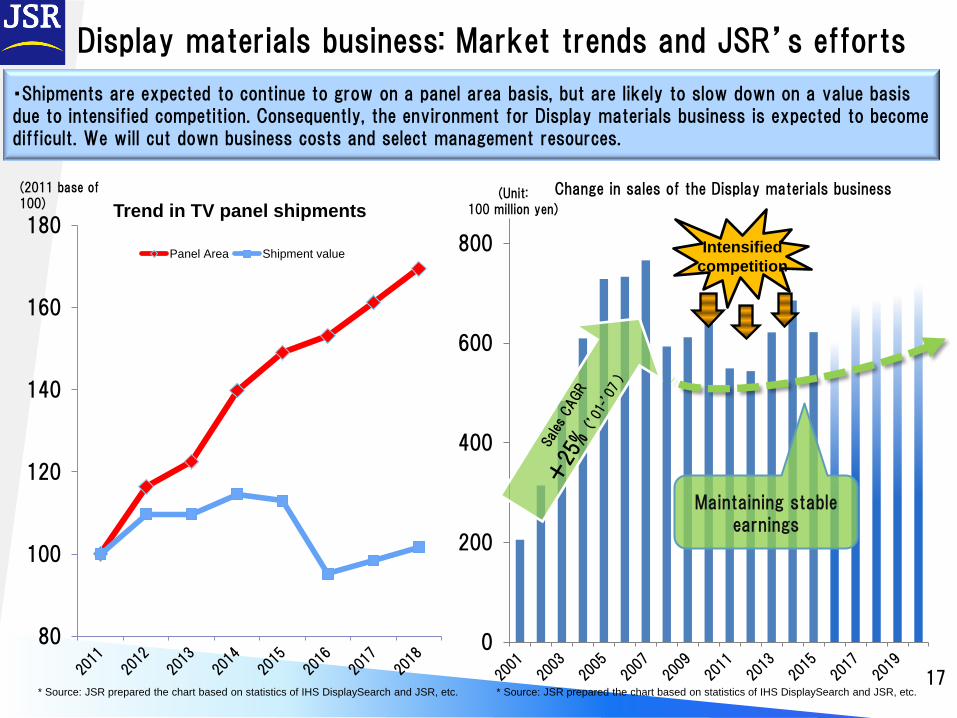
・Shipments are expected to continue to grow on a panel area basis, but are likely to slow down on a value basis due to intensified competition. Consequently, the environment for Display materials business is expected to become difficult. We will cut down business costs and select management resources.
17
(2011 base of 100)
Intensified
competition
* Source: JSR prepared the chart based on statistics of IHS DisplaySearch and JSR, etc. * Source: JSR prepared the chart based on statistics of IHS DisplaySearch and JSR, etc.
(Unit: 100 million yen)

20% of the world’s LCD production in 2016 is
expected to be in China.
JSR’s Group business deployment for LCD panel manufacturers in China
・We have moved into the Chinese market, which is expected to grow faster, ahead of our competitors. Meanwhile, we will try to maintain earnings growth in the Display materials business by carrying out a drastic business structural reform related to the operations of other bases, and also continuously expand our product portfolio.
Display materials business: Measures to maintain earnings growth
18
● Location of customers’ LCD plants in China ● Location of JSR Group companies and their business areas
Chinese manufacturer’s market share
Source: IHS Technology (based on the number of panels shipped)

・We have established an organizational framework centering on KBI and MBL and have newly established the Life Sciences Division in JSR. We have placed an American as General Manager of the Life Sciences Division to unitarily control the division, including overseas bases.
Life Sciences business: Development of global organization
Base in USA
Analyzing and manufacturing
biopharmaceuticals under contract
Manufacturing/R&D/Sales of research reagents and
diagnostic agents
Base in China Manufacturing/R&D/Sales of Diagnostic reagent materials
Base in Europe
JSR Corporation
Life Sciences Division
19

Life Sciences business: Two growth drivers
・We have obtained material+α business areas through consolidations of KBI and MBL. We will accelerate the growth of the Life Sciences business by placing KBI and MBL as growth drivers. We will continue to actively invest in the business.
MEDICAL & BIOLOGICAL LABORATORIES CO, LTD. (MBL)
【Establishment】1969
【JSR’s investment ratio】 50.4%
【Number of employees】291 on a nonconsolidated basis, 485 on a consolidated basis(as of March 31, 2016)
【Offices】 Head office in Nagoya, Production and Research & Development in Ina
【Business】 Manufacturing and sale of diagnostic agents and research reagents
【Competitive advantage】 Technology to produce antibodies and reagents for diagnosing autoimmune diseases
Diagnostic agents and research reagents business
KBI Biopharma
【Establishment】 1997
【JSR’s investment ratio】 51.0%
【Number of employees】 428(as of March 31, 2016)
【Offices】 Durham, North Carolina and Boulder, Colorado, the United States
【Business】 Contract process development and manufacture of antibody medicines
【Competitive advantage】 Development of a purification process for antibody medicines and analysis technology
Contract process development and manufacture of antibody medicines business
20

Life Sciences business: Future outlook
0
100
200
300
400
500
600
700
2010 2011 2012 2013 2014 2015 2016 2017 2018 2019 2020
Sales of the Life Science Business
・In the markets of advanced countries, such as Europe, North America, and Japan, we will try to expand business in the field of personalized medicine that is expected to grow in the future by using MBL and KBI. Meanwhile, we will endeavor to grow the in vitro diagnostic agent business in the markets of emerging countries, including China.
Turning KBI into a consolidated
subsidiary
Turning MBL into a consolidated
subsidiary
21
(Unit: 100 million yen)
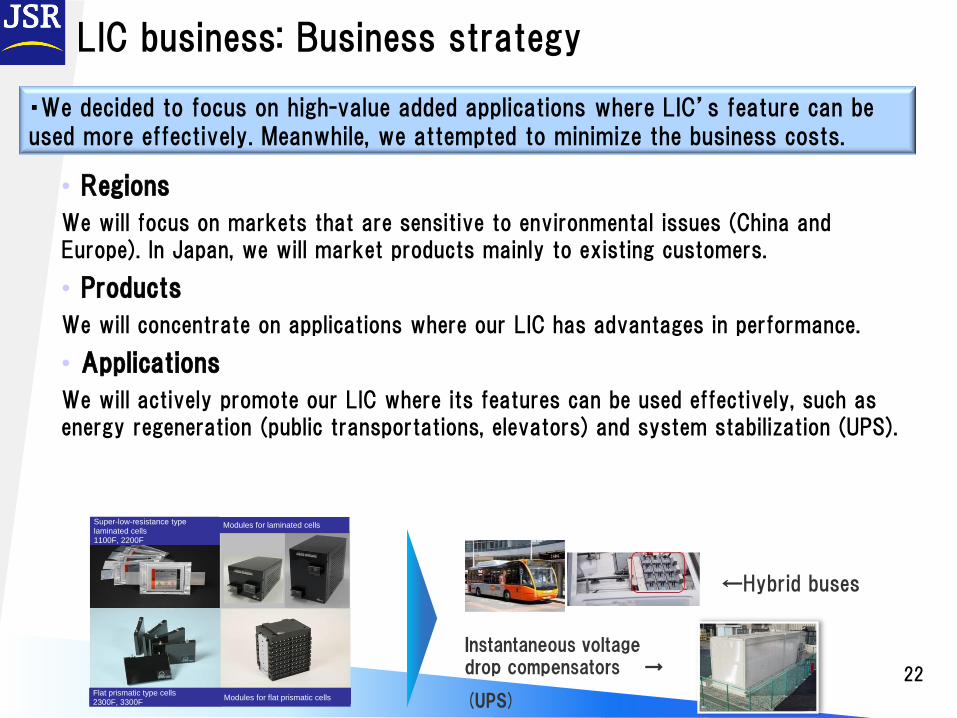
LIC business: Business strategy
• Regions
We will focus on markets that are sensitive to environmental issues (China and Europe). In Japan, we will market products mainly to existing customers.
• Products
We will concentrate on applications where our LIC has advantages in performance.
• Applications
We will actively promote our LIC where its features can be used effectively, such as energy regeneration (public transportations, elevators) and system stabilization (UPS).
Instantaneous voltage drop compensators →
(UPS)
←Hybrid buses
・We decided to focus on high-value added applications where LIC’s feature can be used more effectively. Meanwhile, we attempted to minimize the business costs.
22
Super-low-resistance type laminated cells 1100F, 2200F
Modules for laminated cells
Flat prismatic type cells 2300F, 3300F
Modules for flat prismatic cells

Capital allocation policy
23
34.0%
36.0%
117.8%
46.5%
46.7%
29.2%
46.7% 53.3%
64.5%
84.2%
0.0%
20.0%
40.0%
60.0%
80.0%
100.0%
120.0%
0
50
100
150
200
250
'07/3 '08/3 '09/3 '10/3 '11/3 '12/3 '13/3 '14/3 '15/3 '16/3
The ra
tio o
f tota
l am
ounts retu
rned
to sh
areho
lders to p
rofit A
mounts
ret
urn
ed t
o s
hare
hold
ers
(100 m
illio
n y
en)
Annual dividend per share (yen) Dividend payout ratio Total payout ratio
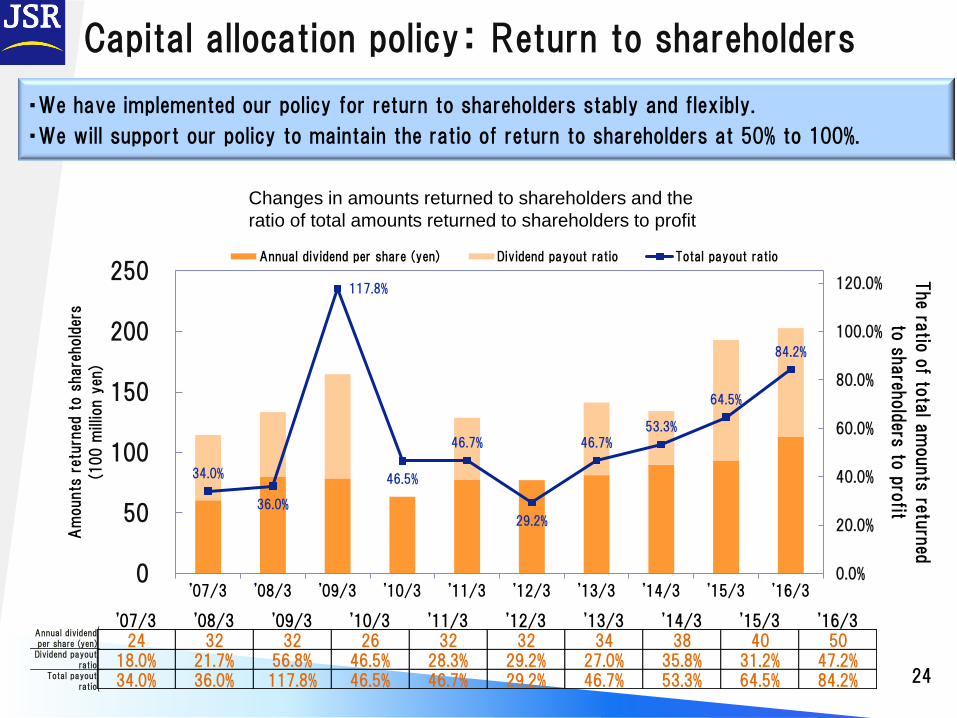
Capital allocation policy: Return to shareholders
Changes in amounts returned to shareholders and the
ratio of total amounts returned to shareholders to profit
・We have implemented our policy for return to shareholders stably and flexibly.
・We will support our policy to maintain the ratio of return to shareholders at 50% to 100%.
24
'07/3 '08/3 '09/3 '10/3 '11/3 '12/3 '13/3 '14/3 '15/3 '16/3配当単価(円) 24 32 32 26 32 32 34 38 40 50
配当性向 18.0% 21.7% 56.8% 46.5% 28.3% 29.2% 27.0% 35.8% 31.2% 47.2%総還元性向 34.0% 36.0% 117.8% 46.5% 46.7% 29.2% 46.7% 53.3% 64.5% 84.2%
Annual dividendper share (yen)
Dividend payoutratio
Total payoutratio

Summary
25

・Organic growth scenario: Our future growth drivers consist of three pillars: S-SBR, semiconductor materials business, and life sciences businesses. In businesses other than growth drivers, we will give priority to creating a long tale of earnings by striking a balance between earnings opportunities and costs.
・In-organic growth: We will explore opportunities to transform our businesses and the Company at the same time.
Summary
Realization of JSR’s Vision/Target (Market Cap: 1 trillion yen)
Operating income supported by core businesses
Further leap through Jump
Growth supported by core businesses Growth supported by new businesses
SSBR
Promote overseas manufacturing and
differentiation
Semiconductor materials business
Focus on cutting-edge front-end technology
Petrochemicals business
LCD Plastics business
Fine Chemicals business
Life Sciences business Accelerate growth using
two drivers
Strategic businesses
Convert the business structure and expand product lineups

27
* The forecasts, future plans and strategies made in this document contain a variety of uncertain factors, since it has been prepared based on judgments from currently available information. Actual business results may differ from those projected, depending on factors such as the economic status of the market surrounding the company.
Top Related