


Languages
Pages
Legal


Towards the architecture of the human inner kinetochore
Dissertation
zur Erlangung des akademischen Grades
doctor rerum naturalium
(Dr. rer. nat.)
vorgelegt dem Rat der Biologisch-Pharmazeutischen Fakultät
der Friedrich-Schiller-Universität Jena
von
Diplom-Biologin Sandra Orthaus
geboren am 02. Juli 1974 in Jena

I
Table of contents 1 Introduction 1
1.1. The centromere kinetochore complex 1
1.1.1. The centromere 1 1.1.2. Inner kinetochore proteins 2
1.1.2.1. CENP-A 3 1.1.2.2. CENP-B 4 1.1.2.3. CENP-C 5 1.1.2.4. CENP-H 5 1.1.2.5. CENP-I 6
1.1.3. Outer kinetochore proteins 6
1.2. The nucleosome 7
1.3. Objective 10
2 Materials and Methods 12
2.1. Materials 12
2.1.1. Chemicals 12 2.1.2. Standarts and Kits 12
2.2. Methods 12
2.2.1. Cell culture and transfection into HEp-2 cells 13 2.2.2. Analysis of the CENP-H genotype of HEp-2 cells 13 2.2.3. RNA interference 14 2.2.4. Cell viability assays 15 2.2.5. Cell cycle analysis and cell synchronisation 15 2.2.6. Antibodies and immuno-fluorescence 16 2.2.7. Confocal microscopy 16 2.2.8. Western Blots 17 2.2.9. Plasmids and cloning 17 2.2.10. Förster resonance energy transfer (FRET) 20
2.2.10.1. Acceptor Photobleaching based FRET measurements 24 2.2.10.2. FLIM (Fluorescence Lifetime Measurements) 25
3 Results 29
3.1. RNAi knock down of the human kinetochore protein CENP-H 29
3.1.1. The siRNA led to depletion of CENP-H in human HEp-2 cells 30 3.1.2. Depletion of CENP-H in human cells resulted in aberrant mitotic
phenotypes and decreased numbers of living cells but did not lead to mitotic arrest
32
II
3.1.3. CENP-H depleted kinetochores showed an unchanged presence of the checkpoint protein hBubR1 and a reduced presence of CENP-C and CENP-E
36
3.2. Interaction studies within the human kinetochore in living human cells 40
3.2.1. FRET measurements using the acceptor photobleaching method 43 3.2.1.1. Controls 43 3.2.1.2. Interaction studies with the inner kinetochore protein CENP-A 46 3.2.1.3. Interactions between the inner kinetochore proteins CENP-B,
CENP-C and CENP-I 50
3.2.1.4. Analysis of H1.0 interactions at human centromeres 52
3.2.2. FLIM based FRET measurements 55 3.2.2.1. Controls 55 3.2.2.2. Interaction studies with the inner kinetochore protein CENP-A 58 3.2.2.3. Interactions between the inner kinetochore proteins CENP-B,
CENP-C and CENP-I 67
3.2.2.4. Analysis of H1.0 interactions at human centromeres 71
4 Discussion 76
4.1. Functional analysis of the inner kinetochore protein CENP-H 76
4.2. Interaction studies of inner kinetochore proteins by FRET in vivo 79
4.2.1. Assembly of the inner kinetochore proteins CENP-A and CENP-B in living human cells
79
4.2.2. The inner kinetochore proteins CENP-B, CENP-C and CENP-I assemble to stabilise a centromere-specific chromatin structure in living human cells
84
4.2.3. Linker histone H1.0 is present at human centromeres 88 4.2.4. Model of the interface between centromeric chromatin and the inner
kinetochore sub-complex 91
4.3. Future perspectives 93
5 Summary 95
6 Zusammenfassung 97
7 References 99
III
List of figures and tables
Figure 1.1: The human centromere/kinetochore complex. 2
Figure 1.2: Nucleosome core particle. 8
Figure 2.1: Perrin-Jablonski diagram of FRET process and determination of the FRET efficiency through the fluorescence lifetime of the donor.
21
Figure 2.2: Comparison of FRET and AB-FRET (acceptor bleaching). 23
Figure 2.3: Potential association states between proteins within the centromere kinetochore complex and the respective fluorescence decays.
25
Figure 2.4: Principle of TCSPC (time correlated single photon counting). 26
Figure 2.5: Experimental set-up for the FLIM measurements. 27
Figure 3.1.1: Splice variants of the CENP-H gene and position of the siRNA target sequence within the area of exon 2 and 3.
30
Figure 3.1.2: CENP-H reduction by RNAi did not influence the cellular content of the kinetochore proteins CENP-C, CENP-E and hBubR1.
31
Figure 3.1.3: Depletion of CENP-H lead to aberrant mitotic phenotypes. 32
Figure 3.1.4: Depletion of CENP-H resulted in a decreasing growth rate. 33
Figure 3.1.5: CENP-H deficient cells displayed an increased number of aberrant mitotic phenotypes such as misaligned chromosomes and multipolar spindles.
34
Figure 3.1.6: Cell cycle analysis revealed no mitotic arrest in CENP-H depleted cells.
35
Figure 3.1.7: Kinetochores depleted of CENP-H showed an aberrant distribution or lack of CENP-E but still contained CENP-C and hBubR1.
38
Figure 3.1.8: CENP-H deficient kinetochores contained a decreased amount of CENP-C and CENP-E and about half of the misaligned chromosomes totally failed to recruit CENP-E.
39
Figure 3.2.1: Cerulean and EYFP fusion constructs are expressed as full length proteins in human HEp-2 cells.
42
Figure 3.2.2: AB-FRET controls showed no false negative or positive FRET.
44
IV
Figure 3.2.3: Acceptor bleaching in vivo lead to FRET between CENP-B- Cerulean/EYFP-CENP-A, Cerulean-CENP-A/EYFP-CENP-A and Cerulean-CENP-A/EYFP-H4.A
48
Figure 3.2.4: Acceptor bleaching FRET measurements of the inner kinetochore proteins CENP-B, CENP-C and CENP-I in vivo.
51
Figure 3.2.5: Acceptor bleaching FRET in vivo revealed the presence of linker histone H1.0 at human centromeres.
54
Figure 3.2.6: FLIM controls. Fluorescence lifetime imaging of cells (co-) expressing Cerulean and Cerulean-YFP fusion constructs.
57
Figure 3.2.7: Confocal micrographs and fluorescence lifetime measurements of single HEp-2 cells co-expressing Cerulean and EYFP fusion proteins.
60
Figure 3.2.8: Lifetime histogram of all kinetochores evaluated in this study. 62
Figure 3.2.9: FLIM measurements in vivo to assess the interactions between the inner kinetochore proteins CENP-B, CENP-C and CENP-I.
69
Figure 3.2.10: FLIM in vivo confirmed the association between histone H1.0 and the inner kinetochore proteins CENP-A, -B and C.
72
Figure 4.1: Schematic model representation of the FRET experiments including CENP-A, CENP-B and core histones.
81
Figure 4.2: Linear model of the centromere array formed by interactions of the inner kinetochore proteins CENP-B and CENP-C.
87
Figure 4.3: Binding of linker histone H1.0 to centromeric chromatin. 89
Figure 4.4: Linear model of the centromere organisation and inner kinetochore architecture.
92
Table 1.: Overview of the AB-FRET and FLIM results. 74

V
List of abbreviations % percentage
A adenine, alanine
aa amino acid
AB-FRET acceptor bleaching fluorescence resonance energy transfer
ACA anti centromere antibody
APC anaphase promoting complex
ATCC american tissue culture collection
bp base pair
BP band pass filter
BSA bovine serum albumine
°C degree
C cytosine, carboxy terminus
CAD CENP-A-nucleosome distal centromere components
cDNA complementary DNA
CENP centromere protein
C. elegans Caenorhabditis elegans
CREST Calcinosis (cutis), Raynaud (syndrom), Esophageal (dysmotility),
Sklerodactyly, Telangiectasia
CY3 Indocarbocyanin
D aspartic
DAPI 4',6-diamidino-2-phenylindole
DIC differential interference contrast
DMEM Dulbeccos modified Eagles medium
DNA deoxyribonucleic acid
dT deoxy-thymidine
E glutamic
Ef FRET efficiency
ECFP enhanced cyan fluorescent protein
ECL enhanced chemiluminescence
E. coli Escherichia coli
EDTA ethylene diamine tetra acetic acid
Ef efficiency of FRET

VI
e.g. for example (exempli gratia)
EGFP enhanced green fluorescent protein
EYFP enhanced yellow fluorescent protein
et al. et alii
EtBr ethidium bromide
EtOH ethanol
F phenylalanine
FACS fluorescence associated cell sorting
f.e. for example
FCS fetal calf serum
Fig figure
FITC fluorescein isothiocyanate
FLIM fluorescence lifetime imaging
FRET fluorescence resonance energy transfer
FWHM full width half maximum
G guanine, glycine
g gram
Hec1 highly expressed in cancer
HEp-2 human epithelial cell line 2
HCl hydrochloric acid
HP1 heterochromatin protein 1
HRP horse raddish peroxidase
I isoleucine
IgG immune globulin
IIF in direct immuno fluorescence
K lysine
k rate constant
kf rate constant for a radiative (fluorescent) process
knr rate constant for a nonradiative process
kt rate constant for energy transfer
kb kilo base pairs
kDa kilo Dalton
L leucine
l litre

VII
LBO lithium triborate
LP long pass filter
LSM laser scanning microscope
µ micro
m milli
M molar
MAC mammalian artificial chromosome
MCAK mitotic centromere-associated kinesin
MCP-PMT multichannel-plate photomultiplier tube
min minute
hMis12 (human) minichromosome instability
MT microtubules
N amino terminus, asparagine
n number
NAC CENP-A nucleosome associated complex
nm nano meter
P proline
PAGE poly-acrylamid gel electrophoresis
PBS phosphate buffered saline
PCR polymerase chain reaction
PI propidium iodide
Q glutamine
R arginine
RNA ribonucleic acid
RNAi RNA interference
ROI region of interest
rpm revolutions per minute
RT room temperature
RT-PCR reverse transcriptase PCR
S serine
s second
S.c. Saccharomyces cerevisiae
s.d. standard deviation
SDS sodium dodecyl sulfate

VIII
s.e.m. standard error of the mean
SHG second-harmonic generation
siRNA small interfering RNA
T thymine, threonine
τD lifetime of the donor
τDA lifetime of the donor in the presence of the acceptor
Tab table
TCSPC time correlated single photon counting
Ti:Sa titanium:sapphire
To-Pro3 monomeric cyanine dye
Tris tris-(hydroxymethyl)-aminomethan
U unit, uracile
V valine
Y tyrosine
Introduction
1
1 Introduction
1.1. The centromere/kinetochore complex
At mitosis, the assembly of a kinetochore at each centromere locus ensures accurate
segregation of every chromosome. This centromere/kinetochore plays a fundamental role in
sister chromatid cohesion and separation, chromosome attachment at spindle microtubules
leading to chromosome movement to the cell poles, formation of the centromeric chromatin
structure, and mitotic checkpoint control (for reviews see Choo 1997; Sullivan et al., 2001;
Cleveland et al., 2003; Amor et al., 2004; Chan et al., 2005; Henikoff & Dalal, 2005). In this
way, correct kinetochore function grants proper chromosome segregation during cell division
and prevents aneuploidy. Already small changes in the expression or functional states of
genes encoding specific kinetochore proteins appear to be associated with aneuploidy, cell
death or cancer (Tomonaga et al., 2005; Cimini & Degrassi, 2005; Kops et al., 2005) which is
associated with birth defects and tumorigenesis. Traditional electron microscopy of
chromosomes revealed that the kinetochore of vertebrate cells is a trilaminar structure on the
surface of the centromeric heterochromatin consisting of an inner plate, the interzone and an
outer plate (Cleveland et al., 2003; Amor et al., 2004, Figure 1.1). Proteins within the inner
plate associate constitutively with the centromere during the whole cell cycle. Proteins of the
outer part bind transiently mainly during mitosis and link the complex to spindle
microtubules. Within this structure, the inner kinetochore plate has an essential role in
kinetochore assembly, and the outer kinetochore plate is both a mitotic checkpoint and a
microtubule binding structure (Figure 1.1).
1.1.1. The centromere
Heterochromatin is present at the centromeric or pericentromeric regions of almost all
eukaryotic centromeres (apart from that of S. cerevisiae); depleting specific components of
heterochromatin results in chromosome missegregation (Bernard et al., 2001). The
heterochromatin function might be its innate ability to recruit the multisubunit cohesin
complex to centromeric regions thus ensuring sister chromatid cohesion until cell division
(Bernard et al., 2001; Nonaka et al., 2002).

Introduction
2
Again, with the exception of budding yeast S. cerevisiae, a strict dependence of centromere
function on a primary DNA sequence is absent in all other known eukaryotes (Westermann et
al., 2003). Instead, centromeric DNA follows some conserved organisational themes like
repetitive DNA (Alexandrov et al., 2001). In humans, the centromeric subunit is a AT-rich
171 bp monomer of α-satellite DNA (alphoid DNA). The repetitive structure of alphoid DNA
can be classified into two types of repeats (Ikeno et al., 1994): units composed of several
monomers (type-I alphoid repeat) and monomeric organisation consisting of divergent
alphoid monomer units (type-II alphoid repeat). Centromere components are mainly
assembled on type-I alphoid sequences (Ikeno et al., 1994; Ando et al., 2002; Politi et al.,
2002). However, the tandem repeats of α-satellite DNA do not solely define centromere
location. In addition, centromere function can be assumed by “neo-centromeres” (a rare
phenomenon in which centromeres form on fragmented chromosomes) that – in rare instances
– appear in regions of the genome that are completely devoid of α-satellites (Amor & Choo,
2002). Thus, the overriding link between DNA and centromeric function seems to be an
epigenetic or structural phenomenon.
Figure 1.1: The human centromere/kinetochore complex. (A) Metaphase chromosome consisting of two sister chromatids. (B) Electron micrograph showing centromeric chromatin and the overlaying kinetochore. The kinetochore consists of two electron-dense layers, the inner and the outer kinetochore, and the fibrous corona where the spindle microtubules are attached during mitosis. Only selected kinetochore proteins are displayed within the complex. Kinetochore proteins analysed in this work are blue-coloured. (modified from Cleveland et al., 2003)
1.1.2. Inner kinetochore proteins
In vertebrates, several inner kinetochore proteins assemble hierarchically and co-dependently:
CENP-A, CENP-B, CENP-C, CENP-H, CENP-I and hMis12 localise to a core domain of

Introduction
3
centromere chromatin during the whole cell cycle (Amor et al., 2004). Recent studies
identified 11 new inner kinetochore proteins CENP-K to CENP-U(50) in human and chicken
(Foltz et al., 2006; Okada et al., 2006). Inner kinetochore proteins have various roles and
mutual interactions (Choo, 1997; Amor et al., 2004).
The kinetochore proteins CENP-A, -B and -C associate with centromeric DNA suggesting
that they have a direct role in the formation of centromeric chromatin. At least in humans,
CENP-H, -I and hMis12 (Sugata et al., 2000; Goshima et al., 2003; Liu et al., 2003) as well as
the members of the NAC and CAD complex (Foltz et al., 2006) are supposed to bind down-
stream in the process of complex formation. In chicken, nascent CENP-A is not effectively
incorporated when proteins of the CENP-H-I complex (CENP-H, CENP-I, CENP-K, CENP-
M) are mutated (Okada et al., 2006). With the exception of CENP-B, these foundation
kinetochore proteins are found in every active but not in inactive centromeres including
neocentromeres. Depletion of these proteins results in chromosome missegregation and
disruption of mitosis.
1.1.2.1. CENP-A
Central to the kinetochore complex assembly is CENP-A that replaces histone H3 at the
centromeric nucleosome (Shelby et al., 1997; Black et al., 2004). This protein, also referred to
as cenH3, is present in all eukaryotes and its depletion leads to the mislocation of CENP-B,
CENP-C, CENP-H, CENP-M, CENP-N, Nuf2/Hec1, Mad2 and CENP-E (Howman et al.,
2000; van Hooser et al., 2001; Regnier et al., 2005; Foltz et al., 2006). Over-expression of
CENP-A leads to its ectopic incorporation into chromosomal arms and to the recruitment of
CENP-C and some kinetochore proteins, and in Drosophila melanogaster (Heun et al., 2006)
but not in humans (van Hooser et al., 2001) to the assembly of a functional kinetochore.
CENP-A associated chromatin exists as a series of distinct subdomains that are separated by
intervening blocks of chromatin containing histone H3 (Blower et al., 2001; Schueler et al.,
2001; Jin et al., 2004). These repeating clusters might represent an amplification of a simple
functional unit akin to that of the S. pombe and related to the S. cerevisiae centromere (Meluh
et al., 1998; Blower et al., 2001; Wieland et al., 2004). CENP-A forms a sub-nucleosomal
tetramer complex with histone H4 that is conformationally more compact and rigid than the
corresponding tetramers of histones H3 and H4 (Black et al., 2004). Unlike the four core
histones which are assembled just behind the replication fork (Verreault, 2003), the assembly
of CENP-A nucleosomes occurs mainly uncoupled from DNA replication during G2 phase
(Shelby et al., 2000). CENP-A nucleosomes directly recruit a CENP-A nucleosome proximal

Introduction
4
associated complex (NAC) comprised of the three centromere proteins CENP-M, CENP-N
and CENP-T, along with CENP-U(50), CENP-C and CENP-H. Assembly of the CENP-A
NAC at centromeres is dependent on CENP-M, CENP-N and CENP-T. Seven CENP-A-
nucleosome distal (CAD) centromere components (CENP-K; CENP-L; CENP-O; CENP-P;
CENP-Q; CENP-R and CENP-S) are found to assemble on the CENP-A NAC. The CENP-A
NAC is essential, as disruption of the complex causes errors of chromosome alignment and
segregation that preclude cell survival despite continued centromere-derived mitotic
checkpoint signalling (Foltz et al., 2006; Okada et al., 2006).
1.1.2.2. CENP-B
CENP-B is the only inner kinetochore protein that binds to a specific centromere sequence,
the 17 bp CENP-B box that appears in every other α-satellite repeat (171 base pairs) in human
centromeres (Masumoto et al., 1989; Muro et al., 1992; Yoda et al., 1992; Ikeno et al., 1994;
Kipling & Warburton, 1997). The CENP-B box was found only in type-I alphoid sequences
of autosomes and X chromosomes (Masumoto et al., 1989). CENP-B is absent from the
centromere of human or murine Y chromosome and from functional centromeres that lack
CENP-B boxes while it is present at the inactive centromere in dicentric chromosomes
(Cooke et al., 1990; Pluta et al., 1995; Kipling & Warburton, 1997). CENP-B-null mice show
normal viability, mitosis, and localisation of other kinetochore proteins (Hudson et al., 1998).
Although CENP-B seems not to be essential for kinetochore function, the CENP-B/CENP-B-
box interaction plays a crucial role in the assembly of other essential kinetochore components
on the alphoid DNA, as demonstrated in mammalian artificial chromosomes (Masumoto et
al., 1998; Ohzeki et al., 2002; Basu et al., 2005). Ikeno et al., (1998) have reported that stable
mini-chromosomes were only be established from MACs when α-satellite DNA containing
CENP-B boxes were used. CENP-B is a dimeric protein composed of 80-kDa subunits
(Earnshaw et al., 1987) and contains DNA-binding and dimerisation domains at its N- and C-
terminus, respectively (Pluta et al., 1992; Yoda et al., 1992; Kitagawa et al., 1995). Tanaka et
al. (2001) determined the crystal structure of the CENP-B N-terminal DNA-binding domain
(amino acids 1–129) complexed with the CENP-B box DNA. This DNA-binding domain
forms two helix-turn-helix motifs that are bound to adjacent major grooves of the CENP-B
box DNA. The crystal structure of the C-terminal CENP-B dimerisation domain (amino acids
540–599) consists of two α-helices that are folded into an antiparallel configuration, and
forms a dimer with a symmetrical, antiparallel, four-helix bundle structure (Tawaramoto et

Introduction
5
al., 2003). Nucleosome reconstitution experiments with canonical histones and CENP-B
suggested that CENP-B has the potential to modulate nucleosome formation in the vicinity of
the CENP-B box (Yoda et al., 1998). In vitro, CENP-B is able to bind to nucleosomal DNA
when the CENP-B box is wrapped within the nucleosome core particle and can induce
translational positioning of the nucleosome (Tanaka et al., 2005). CENP-B may thus
translationally position centromere-specific nucleosomes through its binding to the
nucleosomal CENP-B box.
1.1.2.3. CENP-C
CENP-C is a conserved inner kinetochore protein and binds centromeric DNA of the same
type of α-satellite DNA as CENP-B (Politi et al., 2002; Ando et al., 2002) but without
sequence specificity (Sugimoto et al., 1994). The interaction between CENP-B and –C has
been shown by Yeast-2-Hybrid and in vitro interaction assays (Suzuki et al., 2004),
nevertheless the exact arrangement of these two proteins remains unresolved. CENP-C
kinetochore localisation depends on CENP-A in mouse cells (Howman et al., 2000) and, in
addition, on CENP-H and CENP-I in chicken and in human (Fukagawa et al., 1999;
Nishihashi et al., 2002; Orthaus et al., 2006). Like CENP-A, CENP-C is found only at active
centromeres (Sullivan & Schwartz, 1995) and is needed to form a functional kinetochore
(Song et al., 2002). In chicken, the absence of CENP-C resulted in mitotic arrest, chromosome
missegregation, and apoptosis (Fukagawa & Brown, 1997; Fukagawa et al., 1999).
1.1.2.4. CENP-H
With the kinetochore proteins CENP-A and CENP-C, also the recently identified kinetochore
protein CENP-H localises constitutively to the inner kinetochore in both interphase and
metaphase in mouse fibroblast (Sugata et al., 1999), chicken (Fukagawa et al., 2001) and
human HeLa cells (Sugata et al., 2000). CENP-H is detected at neocentromeres but not at
inactive centromeres in stable dicentric chromosomes. In vitro binding assays suggest that
CENP-H binds to itself and mitotic centromere-associated kinesin (MCAK) (Sugata et al.,
2000), but not to CENP-A, -B or -C. In addition, CENP-H is supposed to interact in vitro with
the N-terminus of CENP-I (unpublished, from Nishihashi et al., 2002) and with Hec1, a
member of the Ndc80 complex, which in turn bind to the checkpoint protein Mad2 (DeLuca
et al., 2005; Mikami et al., 2005). Immunocytochemical analysis of the CENP-H-deficient
chicken DT40 cells demonstrated that CENP-H is necessary for CENP-C but not CENP-A

Introduction
6
localisation to the centromere (Sugata et al., 2000). Analysis of a conditional knockout of
CENP-H in DT40 cells revealed that CENP-H is essential for cell growth and mitotic
progression (Sugata et al., 2000). In chicken DT40 cells, a CENP-H derivative that lacks the
amino-terminal 72 amino acids (aa) and the carboxy-terminal 10 aa complemented CENP-H
function (Mikami et al., 2005).
1.1.2.5. CENP-I
Also CENP-I is a constitutive kinetochore protein that localises to the inner kinetochore
throughout the cell cycle (Nishihashi et al., 2002; Goshima et al., 2003). CENP-I is
responsible for the recruitment of the outer kinetochore protein CENP-F and the checkpoint
proteins Mad1 and Mad2 (Liu et al., 2003). The chicken DT40 phenotype of CENP-I
knockout cells is similar to that of CENP-H knockout cells. Analyses of both CENP-H and
CENP-I knockout chicken cells suggest that CENP-H and CENP-I are mutually
interdependent for targeting to the kinetochore structure and that both are necessary for
CENP-C localisation to kinetochores (Fukagawa et al., 1999; Nishihashi et al., 2002). The
CENP-H-I complex, which includes the established inner kinetochore components CENP-H
and CENP-I, and additionally seven other proteins (CENP-K, CENP-L; CENP-O; CENP-P;
CENP-Q; CENP-U(50) and CENP-M), is required for the efficient incorporation of newly
synthesised CENP-A into centromeres in human and chicken (Okada et al., 2006). The
CENP-I homologue Mis 6 from S. pompe is necessary for CENP-A localisation at
centromeres in yeast (Takahashi et al., 2000). However, in vertebrates the situation is
contrary: CENP-I recruitment to centromeres strictly depends on CENP-A (Nishihashi et al.,
2002). The depletion of the inner kinetochore protein hMis12 results in chromosome
missegregation and loss of CENP-H and CENP-I but does not affect CENP-A localisation
(Goshima et al., 2003). hMis12 interacts with a series of 9 proteins including Hec1, Zwint-1
and the heterochromatin components HP1α and HP1γ (Obuse et al., 2004).
1.1.3. Outer kinetochore proteins
A series of further proteins are part of the functional kinetochore during mitosis: proteins
building the mitotic checkpoint complex and motor proteins connecting the complex to the
microtubules (for reviews see Choo, 1997; Sullivan et al., 2001; Amor et al., 2004; Chan et
al., 2005; Henikoff & Dalal, 2005). Mitotic checkpoint proteins are activated at the
kinetochores of unattached chromosomes. These activated checkpoint components

Introduction
7
subsequently inhibit the anaphase-promoting complex and prevent the ubiquitination of
substrates whose destruction is required for advance to anaphase (reviewed by Cleveland et
al., 2003). A single unaligned chromosome is sufficient to inhibit anaphase onset, correlating
with the presence of an activated checkpoint at the kinetochore (Rieder et al., 1994; Li &
Nicklas, 1995).
CENP-E is a kinesin-like motor protein localised at the outer kinetochore. It is required for
efficient capture and attachment of spindle microtubules by kinetochores, a necessary step in
chromosome alignment during prometaphase (Putkey et al., 2002). Functional disruption of
CENP-E by various methods consistently resulted in the appearance of some unaligned
chromosomes at metaphase (Yao et al., 2000). CENP-E interacts with the checkpoint protein
BubR1 (Chan et al., 1998, Yao et al., 2000) and stimulates directly its kinase activity (Mao et
al., 2003, Weaver et al., 2003). This leads to a Mad2 dependent mitotic arrest. Kinetochores
without CENP-E cannot activate the BubR1 kinase (Tanudji et al., 2004). Without CENP-E,
checkpoint function cannot be established or maintained in vitro (Abrieu et al., 2000) or in
mice (Putkey et al., 2002); it is required for prevention of premature advance to anaphase in
the presence of unattached kinetochores (Putkey et al., 2002). BubR1 kinase activity is
silenced after spindle assembly and chromosome alignment.
1.2. The nucleosome
Genomic DNA in eukaryotes was long believed to require packaging into chromatin to fit
inside the cell nucleus. But numerous facts indicate an adapted functional organisation of the
chromatin fiber and its regulatory role in cellular functions (e.g. at the level of transcription).
For this reason, DNA is organised in a nucleoprotein complex called chromatin wherein DNA
is arranged in arrays of disc-like shaped nucleosomes (Kornberg, 1977). Chromatin is specific
in all eukaryotes and can be found ubiquitous in all eukaryotic cells. Two copies of each
histone core protein, H2A, H2B, H3 and H4, are assembled into an octamer that has 146 base
pairs of DNA wrapped 1.75 turns around it to form a nucleosome core (Whitlock and
Simpson, 1976; Allan et al., 1980; Furrer et al., 1995, Figure 1.2). The protein octamer is
divided into four “histone-fold” dimers defined by H3-H4 and H2A-H2B histone pairs. Each
evolutionarily conserved core histone consists of a flexible N-terminal tail protruding outward
from the nucleosome, and a globular C-terminal histone-fold domain making up the
nucleosome scaffold (Fletcher and Hansen, 1996). The histone-fold domains of all four core
histone proteins share a highly similar structural motif constructed from three α-helices

Introduction
8
connected by two loops (Luger et al., 1997). The repeating nucleosome cores further assemble
into higher order structures that are stabilised by the linker histone H1. The nucleosome
(nucleosome core, linker DNA and histone H1) thereby has a role as the principle packaging
element of DNA within the nucleus and determines the accessibility of DNA. The
nucleosome structure is highly conserved, but the core itself might presumably experience
conformational changes, and the entry/exit conformation of linker DNA might arise in at least
three variants (open, positive crossing or negative crossing) (Sivolob & Prunell, 2003).
Figure 1.2: Nucleosome core particle. Ribbon traces for the 146-bp DNA phosphodiester backbones (brown and turquoise) and eight histone protein main chains (blue: H3; green: H4; yellow: H2A; red: H2B. The views are down the DNA superhelix axis for the left particle (A) and perpendicular to it for the right particle (B). (from Luger et al., 1997).
Mainly the N-termini of core histones function as acceptors for a variety of dynamic post-
translational modifications, including acetylation, methylation and ubiquitination of lysine
residues, phosphorylation of serine and threonine residues, and methylation of arginine
residues leading to different chromatic states as eu- and heterochromatin (for review see
Fischle et al., 2003). Heterochromatin domains are more compact and transcriptionally silent
and replicate later than transcriptionally active euchromatin domains (Kornberg and Lorch,
1995). Nucleosomes are also built from histone variant proteins (like CENP-A), which act in
regulating chromosome regions (like centromeres) and individual genes.

Introduction
9
The H1 or “linker histones” are a family of very lysine-rich proteins that associate with the
stretch of DNA that enters and exits the nucleosome establishing a higher level of
organisation, the so-called “30 nm fibres”. The histones H1 are believed to be involved in
chromatin organisation by stabilising higher-order chromatin structure (Thoma and Koller,
1977; Ramakrishnan, 1997; Thomas, 1999). Furthermore, H1 is generally viewed as a
repressor of transcription as it prevents the access of transcription factors and chromatin
remodelling complexes to DNA (Croston et al., 1991; Strahl and Allis, 2000; Zlatanova et al.,
2000). H1 histones have a tripartite structure consisting of a short N-terminal domain, a
highly conserved central globular domain, and a large lysine- and arginine-rich C-terminal
domain which is essential for the formation of compact chromatin structures possibly
mediated by a charge-neutralisation process of the DNA phosphate backbone (Cole, 1987).
The C-terminal domain contains most of the amino acid variations that define the individual
histone H1 subtypes. There exist six histone H1 variants in the somatic cells in mammals
(H1.0-H1.5) which share a highly conserved globular domain sequence while exhibiting
variations in the N- and C-terminal tails (Albig et al., 1997). H1.0 is differentiation-specific
and has a very divergent sequence in the globular domain and tails compared with the other
members (Albig et al., 1997).

Introduction
10
1.3. Objective
The objective of this work was to improve our understanding of the in vivo functions and
interactions of the core proteins CENP-A, -B, -C, -H and –I of the human inner kinetochore.
This sub-complex serves as a “foundation” of the centromere/kinetochore complex.
Before initiating further functional studies, the impact of all inner kinetochore proteins on the
process of human cell division should be known. In earlier studies by other groups, this had
been determined - and published - for the inner kinetochore proteins except for CENP-H;
CENP-H functions had been described in chicken (Fukagawa et al., 2001; Mikami et al.,
2005) but not in man. Therefore, as a first step it will be examined here if CENP-H, like the
other inner kinetochore proteins CENP-A (Wieland et al., 2004), CENP-C (Trazzi et al.,
2002) and CENP-I (Liu et al., 2003), plays an essential role within the human kinetochore
complex. CENP-B was shown not to be essential (Hudson et al., 1998). For this functional
analysis, CENP-H will be specifically down-regulated by RNAi knock down in human HEp-2
cells and the influence of CENP-H on kinetochore function and on the protein
interdependencies of CENP-H with other kinetochore proteins determined. In these CENP-H
knocked-down cells, phenotypes leading to severe mitotic defects and alterations in cell cycle
and cell division will be analysed. Similarities but also important differences between chicken
and human kinetochore functions should be described.
The human kinetochore is a large protein complex associated to centromeric DNA. Up to
date, our knowledge of the architecture, i.e. the temporal and spatial interactions of the
numerous proteins of the inner and outer kinetochore is still marginal, particularly since
conventional biochemical techniques only yield limited structural and stoichiometrical
information. Structural aspects, however, seem to play an important, yet to be determined,
role in centromere and kinetochore function. This view is based on two observations:
1. detailed in vitro analyses revealed that, with the exception of the non-essential
kinetochore protein CENP-B, there exist no specific interaction sites of kinetochore
proteins with centromeric DNA indicating that centromeric regions are not solely
defined by a specific DNA sequence.
2. CENP-A, the most important factor in early genesis of the kinetochore, seems not to
interact with any other kinetochore protein, based on classical biochemical in vitro
data.
Thus, epigenetic or structural aspects, or both, are thought to determine the localisation and
the formation of the centromere kinetochore complex. Understanding mitosis at the molecular

Introduction
11
level requires not only the functional characterisation of an individual protein but, ideally,
also the analysis of the complete protein complex and its assembly in the living cell in space
and time. Therefore, a thorough in vivo mapping of the spatial interactions of human CENP-
A, CENP-B, CENP-C, CENP-H and CENP-I within the inner kinetochore will be performed
by applying the modern microscopic techniques of acceptor bleaching FRET (Fluorescence
Resonance Energy Transfer) and FLIM (Fluorescence Lifetime Imaging) in living human
HEp-2 cells. This study would offer insights on
1. how the centromere and the inner kinetochore sub-complex are formed and
2. how the various inner kinetochore proteins interdepend during kinetochore
assembly.
Interactions of these constitutive kinetochore proteins in vivo, as deduced in this work, will be
used to develop a 3-dimensional model describing the formation and organisation of the
centromere/inner kinetochore, the sub-complex responsible for the assembly of a functional
kinetochore during mitosis.
.

Materials and Methods
12
2 Materials and Methods
2.1. Materials
2.1.1. Chemicals
All general chemicals were purchased from Roth (Karlsruhe, Germany), Merck (Darmstadt,
Germany), Sigma-Aldrich (Taufkirchen, Germany), Serva (Heidelberg, Germany) and
AppliChem (Cheshire, USA) with high purity grade. Bacterial medium materials were
purchased from Invitrogen (Carlsbad, CA, USA) and cell line medium materials were
purchased from PAA Laboratories, Pasching, Austria. Restriction enzymes were purchased
from NEB (Ipswich, USA) and T4 DNA ligase was purchased from Invitrogen (Carlsbad,
CA, USA).
2.1.2. Standards and kits
The following kits and markers were used and obtained from the companies given in brackets:
puRE Taq Ready To Go PCR Beads kit (Amersham Biosciences, Uppsala, Sweden), Expand
high fidelity plus PCR system kit (Roche, Penzberg, Germany), TOPO TA cloning kit
(Invitrogen, Carlsbad, CA, USA), Zero blunt end TOPO PCR cloning Kit (Invitrogen,
Carlsbad, CA, USA), qiaquick PCR purification kit (Qiagen, Hilden, Germany), Mini-elute
gel extraction kit (Qiagen, Hilden, Germany), Hi-speed plasmid mini kit (Qiagen, Hilden,
Germany), Hi-speed plasmid midi kit (Qiagen, Hilden, Germany), 1kb DNA ladder (MBJ
Fermentas, St. Leon-Rot, Germany), unstained protein marker (Biorad, Krefeld, Germany),
unstained protein marker (MBJ Fermentas, St. Leon-Rot, Germany), pre-stained protein
marker (MBJ Fermentas, St. Leon-Rot, Germany).
2.2. Methods
The following routine molecular biology and cell biology methods were performed according
to standard protocol (Sambrook, 1989; Celis, 1994): DNA preparation, restriction, ligation,
transformation and EtBr visualization, E. coli competent cell preparation, DNA and protein
spectrophotometric quantification, DNA and protein gel electrophoresis and bacterial culture.

Materials and Methods
13
The following methods described in detail are those developed or modified during this
laboratory work.
2.2.1. Cell culture and transfection into HEp-2 cells
HEp-2 (HeLa derivative) cells were obtained from the American Tissue Culture Collection
(ATCC, Rockville, USA). Hek293 cells were available in the laboratory. The cells were
cultured in Dulbecco´s modified Eagle´s medium DMEM (PAA Laboratories, Pasching,
Austria) supplemented with 10% fetal calf serum (PAA Laboratories, Pasching, Austria) in a
9,5% CO2 atmosphere (for Hek293 cells: 5%) at 37 °C and grown to subconfluency as
recommended. At this stage, the medium was removed and cells were washed with
Magnesium and Calcium-containing PBS (Sigma-Aldrich, Taufkirchen, Germany) followed
by detachment with trypsine/EDTA (PAA Laboratories, Pasching, Austria). The detached
cells were centrifuged for 2 minutes at 2.000 rpm, dissolved in fresh DMEM and re-seeded in
new culture dishes. For RNAi experiments, cells were seeded in 6-well-plates containing 15
mm glass dishes (Saur Laborbedarf, Reutlingen, Germany) 24 hours before experiments and
transfected with siRNA using RNAiFect transfection reagent (Qiagen, Hilden, Germany)
according to the manufacturers protocol. For live cell imaging experiments, cells were seeded
on 42 mm glass dishes (Saur Laborbedarf, Reutlingen, Germany) two or three days before
experiments and transfected with plasmid DNA 24-48 h before observation using FuGENE 6
transfection reagent (Roche, Basel, Switzerland) according to the manufacturers protocol.
2.2.2. Analysis of the CENP-H genotype of HEp-2 cells
In the siRNA binding domain, the CENP-H gene contains a polymorphism which was
detected by reverse transcriptase (RT)-PCR of HEp-2 cells. RNA was isolated from HEp-2
cells using the RNeasy Mini Kit (Qiagen, Hilden, Germany). First strand cDNA was derived
from oligo-dT primed reverse transcription by the use of Omniscript Reverse Transcriptase
Kit (Qiagen, Hilden, Germany) according to the manufacturers instructions.
For determination of the respective genotype in HEp-2 cells, about 20 ng of genomic DNA
were used to PCR amplify the different CENP-H isoforms using Ready-To-Go PCR beads
(Amersham Biosciences, Uppsala, Sweden). Seminested PCR conditions were one cycle of
denaturation at 93 °C for 60 s, followed by 5 cycles of denaturing at 95 °C for 60 s, annealing
at 58 °C for 30 s, and extension at 72 °C for 90 s; followed by 30 cycles of denaturing at 95
°C for 60 s, annealing at 60 °C for 30 s, and extension at 72 °C for 90 s; and 1 cycle of final
Materials and Methods
14
extension at 72 °C for 5 min. PCR products were purified by precipitation and sequenced with
the same primers used for PCR amplification by the dye terminator method using BigDye
v3.1 (Applied Biosystems, Foster City CA, USA).
For amplification of genomic DNA and subsequent sequencing of the resulting amplicons that
correspond to the CENP-H isoforms listed in Figure 1 we used for full length isoform BG
742599 the primers BG/BFa-for (5`-cgt ttg cct gtt gag tgg ta-3`) and BGa-rev (5´-ggt gga cag
aca aat gca ca-3´) in the first PCR, and BG/BFa-for and BGi-rev (5´-caa ttt cct taa ggg cag ga-
3´) in the second PCR; for BF 245236 the primers BG/BFa-for and BFa-rev (5´-tct cca tct gta
ggt ttt gtc g-3´) in the first PCR, and BG/BFa-for and BFi-rev (5´-tgt cca aat caa tct tct gtt tg-
3´) in the second PCR; for AI 761528 the primers AIa-for (5´-cag gct gag agc aca gac aa-3´)
and AIa-rev (5´-tga aca ctg ctt cat ccg ag-3´) in the first PCR, and AIa-for and AIi-rev (5´-gga
acc cat tcc ctc aaa ct-3´) in the second PCR. In case of BF 245236 the amplicons obtained by
RT- and seminested PCR were cloned into PCR2.1-TOPO (Invitrogen, Carlsbad, USA) and
propagated in E. coli TOP10 cells. Plasmids were isolated from several isolated clones and
their inserts sequenced using plasmid primers.
2.2.3. RNA interference
5`-UGGUUGAUGCAAGUGAAGA-3´ (top strand) siRNA was synthesised (Qiagen-
Xeragon, Germantown, USA) for RNAi against CENP-H specific for the N-terminal portion
of CENP-H. As a positive control for protein synthesis knock down, the RNA sequence for
lamin A/C (5´-CUGGACUUCCAGAAGAACAdTdT-3´) was used. The procedure for RNAi
was adopted from published protocols (Elbashir et al., 2001). HEp-2 cells were grown to
about 50% confluence in coverslip-containing 6-well-plates. Cells were transfected with 5 µg
of the double-strand siRNA using RNAiFect transfection reagent (Qiagen, Hilden, Germany)
according to the manufacturers instructions. Repeatedly, after 24 hour time steps the cells
were harvested and cell viability properties were monitored using trypan blue. In addition,
coverslips were stained with antibodies to monitor the RNAi induced phenotypes and the
presence of further kinetochore proteins. Aliquots of the cells were lysed (see above) and
analysed by western blotting in order to verify the protein knock down of the RNAi treatment
and the amount of further kinetochore proteins. For cell cycle examination FACS analysis
was performed with another aliquot of the cells. In order to determine the siRNA transfection
efficiency, a CY3 labeled Luciferase GL2 RNA duplex (CY3-5´-CGU ACG CGG AAU ACU
UCG A dTdT-3´; Dharmacon, Lafayette, USA) was applied and transfected cells were
counted.

Materials and Methods
15
2.2.4. Cell viability assays
DAPI staining of DNA was used to assess the 'loss of viability' phenotypes in CENP-H
depleted cells. Mitotic indices were determined by ToPro3 and centromere staining and
quantification of mitotic cells in confocal images (n > 400). In parallel, HEp-2 cells were
analysed for frequency of living cells. The supernatant as well as the trypsine/EDTA-detached
cells were combined, washed twice in phosphate buffered saline (PBS) and pelleted at 2.000
rpm. The pellet was redissolved in 1 ml PBS. 50 µl of this cell suspension was mixed with 50
µl trypane blue 0,4% (Eurobio, Courtaboeuf Cedex B, France) and immediately loaded onto a
Neubauer chamber. Trypane blue exclusion served to discriminate and quantitate dead and
living cells.
2.2.5. Cell cycle analysis and cell synchronisation
Cells were harvested and fixed with 95% EtOH for 15 min at 4 °C and stained with 20 µg/ml
propidium iodide (PI, Sigma-Aldrich, Taufkirchen, Germany) in phosphate-buffered saline
(PBS) with 250 µg RNAse and 1% FCS 30 min at 37 °C. Between incubations, cells were
washed with PBS containing 1% FCS. Subsequent flow cytometry was performed with an
FACScan cytometer (Becton Dickinson, Franklin Lakes, USA). Fluorescence data were
displayed as histogram blots using Cell Quest analysis software (Becton Dickinson, Franklin
Lakes, USA). As a control for correct cell cycle analysis, we synchronised HEp-2 cells at
different stages of the cell cycle. Incubation of HEp-2 cells with serum-free medium for 24
hours yielded in an enrichment of cells in G0 phase. For a mitotic arrest, we incubated freshly
seeded HEp-2 cells with 1 µg/ml nocodazole (Sigma-Aldrich, Taufkirchen, Germany) for 12
hours. For enrichment of cells in S-phase, we applied 1 µg/ml aphidicoline (Sigma-Aldrich,
Taufkirchen, Germany) for 12 hours followed by subsequent PI-staining and FACS analysis
or we performed a double thymidine block. Therefore, HEp-2 cells were grown to 50%
confluence and incubated with 5 mM thymidine (Sigma-Aldrich, Taufkirchen, Germany) for
16 hours. Cells were washed with PBS and cultivated for 10 hours with DMEM + 10% FCS.
After repeated thymidine treatment for 16 hours, cells were subsequently harvested, stained
and analysed in the cytometer.
Materials and Methods
16
2.2.6. Antibodies and immuno-fluorescence
The following primary antibodies were used for indirect immuno-fluorescence analyses:
human CREST sera against centromere proteins CENP-A, CENP-B and CENP-C (von
Mikecz et al., 2000), mouse monoclonal anti beta-tubulin antibody (Sigma-Aldrich,
Taufkirchen, Germany), mouse monoclonal antibody against CENP-A (MBL, Woburn,
USA), guinea pig serum against the N-terminal half of CENP-C (a kind gift of K. Yoda),
rabbit polyclonal antibody against hBubR1 and rabbit polyclonal antibody against CENP-E
(kind gifts of T. J. Yen). Cells grown on coverslips were fixed by incubation in 4%
paraformaldehyde for 10 minutes at room temperature followed by 5 min permeabilisation in
0.25% Triton X-100 (Serva, Heidelberg, Germany). Immuno-fluorescence was performed as
described previously (Kiesslich et al., 2002). For immuno-fluorescence staining, primary
antibodies from mouse, rabbit, guinea pig and human sources were used and detected with
species-specific secondary antibodies linked to FITC or rhodamine (Jackson Immunoresearch,
West Grove, USA). Cellular DNA was stained with ToPro3 and DAPI (Molecular Probes,
Eugene, USA) at concentrations established individually. The coverslips were then mounted
onto microscope slides using Vectashield Mounting Medium (Vector Lab, Burlingame, USA).
2.2.7. Confocal microscopy
Microscopic images were collected by using an Axiovert 200M / LSM510META microscope
(Carl Zeiss, Jena, Germany). Samples were scanned using a 63x/1.40 Plan-Apochromat oil
objective. GFP/FITC, rhodamine and ToPro3 dyes were excited by laser light at 488, 543 or
633 nm wavelength, respectively. To avoid bleed-through effects in double or triple staining
experiments, each dye was scanned independently (multi track mode). Fluorescence signals
were detected using narrow band pass (+ 20 nm wavelengths) instead of long pass filters.
Thus, only the peak regions of the fluorescence signals were taken for data analysis. Single
optical sections were selected either by eye-scanning the sample in z-axis for optimal
fluorescence signals, or taken from stack projections. Images were electronically merged and
stored as TIF files. Figures were assembled from the TIF files using Adobe Photoshop
software. The fluorescence intensity analysis at centromeres was performed using Metamorph
Offline 6.1r4 software (Universal Imaging Corporation, Downingtown, PA).

Materials and Methods
17
2.2.8. Western Blots
To control the full length protein expression of the fusion constructs and protein depletion
after RNAi treatment, transfected HEp-2 cells were taken from culture flasks, stained with
trypan blue 0,4% (Eurobio, Courtaboeuf Cedex B, France), counted in a Neubauer chamber to
determine the cell number and lysed for 10 min at 100 °C in an appropriate volume of 2%
SDS, 0.1% bromphenole blue, 35 mM dithiothreitole, 25% glycerin and 60 mM TrisHCl pH
6.8. Cell lysates with appropriate amounts of total protein were separated by SDS-PAGE and
blotted onto Protran BA nitrocellulose (Schleicher & Schuell, Dassel, Germany). Proteins
reacted with mouse monoclonal antibody against GFP (#sc-9996, Santa Cruz Biotechnology,
Santa Cruz, USA) at a dilution of 1:50, human anti-splicing factor SmB/B´ antibody (WM
Keck Autoimmune Disease Center, La Jolla, USA), mouse monoclonal antibody against
lamin A/C (#sc-7292, Santa Cruz Biotechnology, Santa Cruz, USA), goat anti-CENP-H
polyclonal antibody (#sc-11297, Santa Cruz Biotechnology, Santa Cruz, USA), guinea pig
serum against the N-terminal half of CENP-C (a kind gift of K. Yoda), rabbit polyclonal
antibody against hBubR1 and rabbit polyclonal antibody against CENP-E (kind gifts of T. J.
Yen). Bound antibodies were detected with horse radish peroxidase-conjugated goat anti-
mouse (#115-035-072), goat anti-human (#109-035-097), goat anti-guinea pig (#106 035 006)
and goat anti-rabbit (#111 035 006) IgG antibodies (Jackson Immunoresearch Laboratories,
West Grove, USA) at a dilution of 1:4000, mouse anti-goat IgG antibody (#sc-2354, Santa
Cruz Biotechnology, Santa Cruz, USA) at a dilution of 1:250 and finally with the ECL-
advance system (Amersham Biosciences, Uppsala, Sweden) according to the manufacturers
instructions. The chemiluminescence was detected by Biomax light-1 Kodak film (Kodak,
Stuttgart, Germany). The protein amount in the corresponding bands was analysed using the
Phoretix TotalLab software (Biostep, Jahnsdorf, Germany).
2.2.9. Plasmids and cloning
Plasmid pEGFP-AF8-CENP-A vector encoding a EGFP-CENP-A fusion protein (Sugimoto et
al., 2000; Wieland et al., 2004) was a kind gift of K. Sugimoto (Osaka) and was used for
amplification of full length CENP-A by PCR (Expand high fidelityPLUS PCR System, Roche,
Penzberg, Germany) applying forward primer 5´-CAT GTC GAC GAT GGG CCC GCG
CCG CCG GAG CCG AAA-3´ and reverse primer 5´-TGC AGC GGC CGC TTT CAG CCG
AGT CCC TCC TCA A-3´. The blunt ended CENP-A fragment was cloned into the vector
pCR4Blunt-TOPO (Zero Blunt TOPO PCR cloning kit, Invitrogen, Carlsbad, CA, USA). The
EcoRI-NotI fragment of this construct was subcloned into the EcoRI-PspOMI frame of the

Materials and Methods
18
pEYFP-C1-vector (BD Biosciences, Clontech, Palo Alto, CA, USA) and the pCerulean-C1-
vector. In these constructs, the linker between fluorophore and the N-terminus of CENP-A
consists of the amino acid sequence SGLRSRAQASNSPF. We constructed the pCerulean-C1
vector identical to the Clontech pEGFP-C1 vector by replacement of the 722 bp EGFP
containing AgeI-BsrGI fragment with the corresponding 722 bp AgeI-BsrGI fragment
containing the Cerulean sequence (Rizzo et al., 2004), which was a kind gift of N. Klöcker,
Freiburg.
For construction of the pECFP-EYFP-CENP-A triple fusion, the EcoRI-NotI fragment from
the pCR4Blunt-TOPO-CENP-A was subcloned into the EcoRI-PspOMI frame of the pECFP-
EYFP-C1 vector (a kind gift of L. He, Bethesda; Karpova et al., 2003). The two fluorophores
are separated by the two amino acids SG, the linker between the fluorophores and the N-
terminus of CENP-A consists of the amino acid sequence RSRAQASNSPF.
The fusion protein EYFP-Cerulean having a 6 amino acid linker between them was a kind gift
of T. Zimmer (Jena, Germany).
Full length CENP-B was amplified by PCR (Advantage-GC PCR, BD Biosciences, Clontech,
Palo Alto, CA, USA) using forward primer 5’-GAA TTC ATG GGC CCC AAG AGG CGA
CA-3’ and reverse primer 5’-GTC GAC ATT ACA CCG GTT GAT GTC CAA GAC CTC
GAA CTC-3’ from pT7.7/CENP-B (a kind gift from W. Earnshaw, University of Edinburgh,
UK) and cloned into the vector pCR4Blunt-TOPO. The EcoRI-SalI fragment was subcloned
into the EcoRI-SalI frame of the pEYFP-C2-vector (BD Biosciences, Clontech, Palo Alto,
CA, USA). In this construct, the linker between EYFP and the N-terminus of CENP-B
consists of the amino acid sequence SGRTQISSSSFEF. In addition, the EcoRI-AgeI fragment
was subcloned into the EcoRI-AgeI frame of the pEYFP-N1 vector (BD Biosciences,
Clontech, Palo Alto, CA, USA). In this construct the linker between EYFP and the C-
terminus of CENP-B consists of the amino acids PVAT. We constructed a pCerulean-N1-
CENP-B vector by replacement of the 722 bp EYFP containing AgeI-BsrG fragment with the
corresponding 722 bp Cerulean containing AgeI-BsrGI fragment from the pCerulean-C1
vector.
Full length CENP-C was amplified by PCR (Expand high fidelityPLUSPCR Sytem) using
forward primer 5’-TTC ATC TCG AGT ATG GCT GCG TCC GGT CTG GAT CA-3’ and reverse
primer 5’-ACT TAC TGC AGC GGC CGC TAT CAT CTT TTT ATC TGA GTA AAA-3’ from
pTCATG recombinant plasmid (W. Earnshaw, University of Edinburgh, UK) containing the
entire human CENP-C coding region. Blunt end PCR fragments were subcloned into the
vector pCR®4Blunt-TOPO. The XhoI/NotI fragment was subcloned into the XhoI/PspOMI
Materials and Methods
19
fragment of the pEYFP-C2 vector (BD Biosciences, Clontech, Palo Alto, CA, USA). In this
construct the linker between EYFP and the N-terminus of CENP-C consists of the amino
acids SGRTQISS. We constructed a pCerulean-C2-CENP-C vector by replacement of the 722
bp EYFP containing AgeI-BsrG fragment with the corresponding 722 bp Cerulean containing
AgeI-BsrGI fragment from the pCerulean-C1 vector.
Full length CENP-I was obtained from T. Yen and S. Tao (Fox Chase Cancer Center,
Philadelphia, PA, USA), amplified by PCR (Expand high fidelityPLUSPCR Sytem) using
forward primer 5’-CAT GTC GAC GAT GTC ACC TCA AAA GAG AGT TAA GAA-3’
and reverse primer 5’-TGC AGC GGC CGC TTT TAA TAT TGA TTG TTG CAG TTT-3’
and subcloned into the vector pCR®4Blunt-TOPO. The SalI/NotI fragment was cloned into
the Xho/PspOMI-fragment of pEYFP-C2 vector (BD Biosciences, Clontech, Palo Alto, CA,
USA). In this construct the linker between EYFP and the N-terminus of CENP-I consists of
the amino acids SGRTQIST. We constructed a pCerulean-C2-CENP-I vector by replacement
of the 722 bp EYFP containing AgeI-BsrG fragment with the corresponding 722 bp Cerulean
containing AgeI-BsrGI fragment from the pCerulean-C1 vector.
For expression of H1.0 fused to the N-terminus of EYFP in human cell lines we used plasmid
pSVH1.0-EYFP (a friendly gift of W. Waldeck, Heidelberg). For expression of H1.0 fused to
the C-terminus of EYFP we digested pSVH1.0-EYFP with HindIII-BamHI and ligated the
purified 608 bp fragment into HindIII-BamHI treated pEYFP-C3 (Clontech, Palo Alto, CA,
USA). This procedure resulted in a fusion of the amino acids RDPPDLDN to the C-terminus
of H1.0.
For expression of H2A.1 fused to the C-terminus of Cerulean, we digested the plasmid
pSVH2A.1-EYFP (a friendly gift of W. Waldeck, Heidelberg) with EcoRI-BamHI and ligated
the purified 400 bp fragment into the EcoRI-BamHI treated pCerulean-C3 vector. This
procedure resulted in a fusion of the amino acid sequence RDPPDLDN to the C-terminus of
H2A.1. In this construct, the linker between Cerulean and the N-terminus of H2A.1 consists
of the amino acid sequence YSDLELKLRIL. We constructed the pCerulean-C3 vector
identical to the Clontech pEGFP-C3 vector by replacement of the 722 bp EGFP containing
AgeI-BsrGI fragment with the corresponding 722 bp Cerulean containing AgeI-BsrGI
fragment from the pCerulean-C1 vector.
Plasmid BOS H3-N-GFP vector encoding a H3.1-GFP fusion protein (Kimura & Cooke,
2001) was a kind gift of H. Kimura (Oxford) and was used for amplification of full length
H3.1 by PCR (Expand high fidelityPLUS PCR System, Roche, Penzberg, Germany) applying
forward primer 5´-GCT AGC ATG GCT ACT AAA CAG AC -3´ and reverse primer 5´-
Materials and Methods
20
GGA TCC CGG GCC CGC GGT A -3´. The blunt ended H3 PCR fragment was cloned into
the vector pCR®4Blunt-TOPO (Zero Blunt TOPO PCR cloning kit, Invitrogen, Carlsbad,
CA, USA). The NheI-BamHI fragment was subcloned into the NheI-BamHI frame of the
pEYFP-N1-vector (BD Biosciences, Clontech, Palo Alto, CA, USA). For expression of H3.1
fused to the C-terminus of EYFP, we digested pEYFP-N1-H3.1 with NheI-EcoRI and ligated
the purified 433 bp fragment into XbaI-MfeI treated pEYFP-C3 vector (BD Biosciences,
Clontech, Palo Alto, CA, USA). This procedure resulted in a fusion of the amino acid
sequence RADLELKLRIVVVNLFIAAYNGYK to the C-terminus of H3.1. In this construct,
the linker between Cerulean and the N-terminus of H3.1 consists of the amino acid sequence
SGLRSRAQASNSAVDGTAGGGSTGSS.
For expression of H4.A fused to the C-terminus of EYFP, we digested the plasmid pSVH4.A-
EYFP (a kind gift of W. Waldeck, Heidelberg) with EcoRI-BamHI and ligated the purified
319 bp fragment into the EcoRI-BamHI treated pEYFP-C3 vector (BD Biosciences, Clontech,
Palo Alto, CA, USA). This procedure resulted in a fusion of the amino acid sequence
RDPPDLDN to the C-terminus of H4.A. In this construct, the linker between Cerulean and
the N-terminus of H4.A consists of the amino acid sequence YSDLELKLRIL.
All clones were verified by sequencing (MWG Biotech, Ebersberg, München, Germany).
2.2.10. Förster resonance energy transfer (FRET)
FRET measurements provide a useful tool to resolve associations or even interactions
between fluorescent tagged proteins up to 10 nm proximity, in real time and in living cells. By
the use of FRET it is possible to undergo the limited optical resolution of a confocal
microscope that is in the range of about 200 nm. Förster resonance energy transfer (FRET)
was first discovered by Perrin in 1927. The phenomenon of FRET can be explained by a
Jablonski diagram (Figure 2.1.).
A molecule in an excited electronic state (S1) can return to the ground state (S0) by various
pathways. A radiative process, fluorescence, is a transient phenomenon typically occurring in
the picosecond to nanosecond range (rate constant kf), and takes place when a molecule
excited by light absorption reverts to the ground state by light emission. FRET is a
nonradiative process, proceeding without the emission of a photon, that occurs when an
energy quantum is transferred from a donor fluorophore in its excited state to an acceptor
fluorophore by a weak dipole-dipole coupling mechanism (Förster, 1948). This energy
transfer is related to the distance separating a given donor and acceptor pair and is typically
observed when this distance is smaller than 10 nm (Van der Meer et al., 1994). Therefore,

Materials and Methods
21
FRET indicates that fluorescent tagged proteins are adjacent to each other and might be
binding partners. FRET can be measured in vivo.
Figure 2.1: Perrin-Jablonski diagram of FRET process and determination of the FRET efficiency through the fluorescence lifetime of the donor. Due to light absorption, a fluorophore (D) can be excited to a higher electronical, vibrational and rotational state (D*). Excited molecules relax within picoseconds to the lowest vibrational level of S1. From this level the excited molecule can return to the ground state S0 either by emitting a photon (fluorescence, rate constant kf) or by a variety of other nonradiative processes (knr) such as interaction with solvent molecules, quenching by solutes, or excited state reactions. If a suitable acceptor molecule (A) is only few nanometers away, an additional pathway - FRET - is opened through which the excited donor molecule (D*) can return to the ground state (kt). In this case, a nonradiative process transfers energy from a donor to an acceptor molecule causing an increase of acceptor fluorescence intensity. The kinetics of the fluorescence decay of the donor (rate constant k = knr+kf) depend on the relative proportion of the various pathways for returning to ground state. When FRET takes place, the energy transfer rate is thus added to the total rate constant of deactivation of the excited donor. As a consequence, donor fluorescence intensity and donor fluorescence lifetime decrease relative to these ones of the donor measured in the absence of FRET, whereas acceptor fluorescence intensity increases. These values can be determined experimentally and are used to calculate the FRET efficiency (E). (k) rate constant; (knr) sum of the rate constants of all nonradiative transitions (e.g. internal conversion) to the ground state S0; (kf) radiative process (fluorescence); (kt) rate constant for energy transfer. (modified from Biskup et al., 2006)
The rate constant for energy transfer (kt) determines the extend of FRET and depends on the
distance between the two fluorophores (R), the extent of overlap between the donor emission
and acceptor excitation spectra (J), the quantum yield of the donor (QD), the fluorescence
lifetime of the donor (τD), and the relative orientation of the donor and acceptor molecules
(κ2) (Förster, 1948). The lifetime τ of a molecule is the inverse of the rate constant k of the
various decay processes and is a measure of all deactivation pathways through which the
Materials and Methods
22
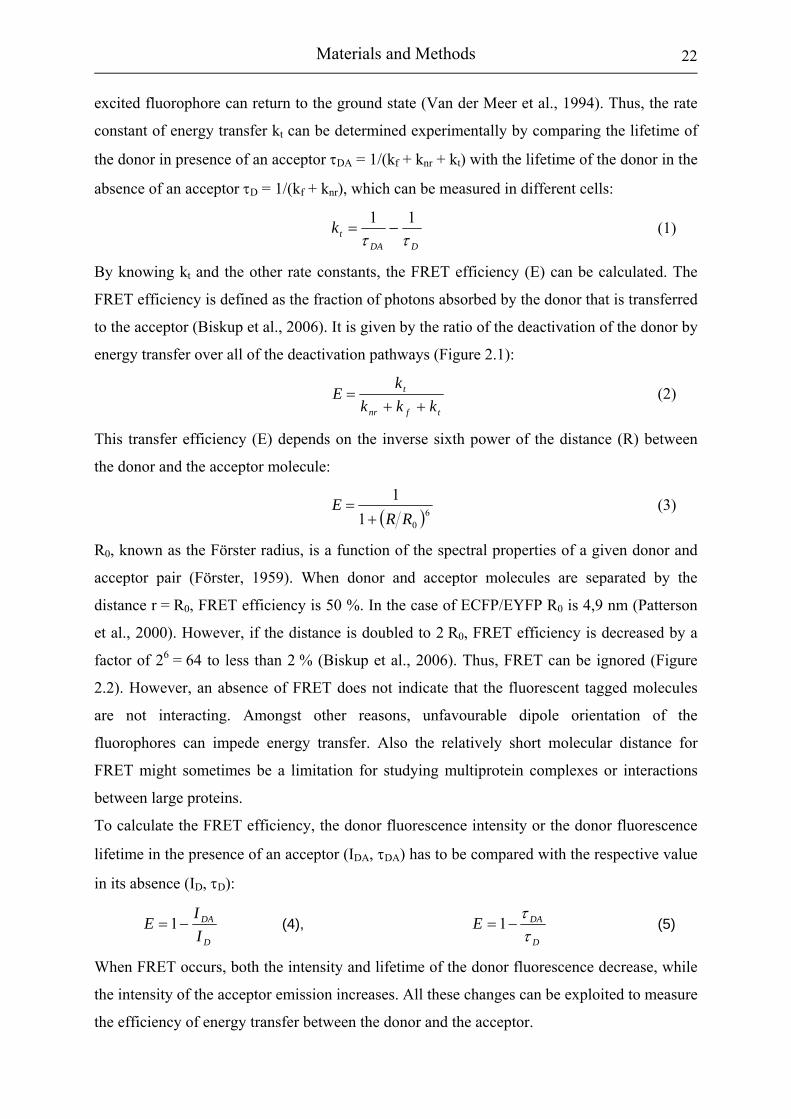
excited fluorophore can return to the ground state (Van der Meer et al., 1994). Thus, the rate
constant of energy transfer kt can be determined experimentally by comparing the lifetime of
the donor in presence of an acceptor τDA = 1/(kf + knr + kt) with the lifetime of the donor in the
absence of an acceptor τD = 1/(kf + knr), which can be measured in different cells:
DDA
tkττ11
−= (1)
By knowing kt and the other rate constants, the FRET efficiency (E) can be calculated. The
FRET efficiency is defined as the fraction of photons absorbed by the donor that is transferred
to the acceptor (Biskup et al., 2006). It is given by the ratio of the deactivation of the donor by
energy transfer over all of the deactivation pathways (Figure 2.1):
tfnr
t
kkkk
E++
= (2)
This transfer efficiency (E) depends on the inverse sixth power of the distance (R) between
the donor and the acceptor molecule:
( )6
011
RRE
+= (3)
R0, known as the Förster radius, is a function of the spectral properties of a given donor and
acceptor pair (Förster, 1959). When donor and acceptor molecules are separated by the
distance r = R0, FRET efficiency is 50 %. In the case of ECFP/EYFP R0 is 4,9 nm (Patterson
et al., 2000). However, if the distance is doubled to 2 R0, FRET efficiency is decreased by a
factor of 26 = 64 to less than 2 % (Biskup et al., 2006). Thus, FRET can be ignored (Figure
2.2). However, an absence of FRET does not indicate that the fluorescent tagged molecules
are not interacting. Amongst other reasons, unfavourable dipole orientation of the
fluorophores can impede energy transfer. Also the relatively short molecular distance for
FRET might sometimes be a limitation for studying multiprotein complexes or interactions
between large proteins.
To calculate the FRET efficiency, the donor fluorescence intensity or the donor fluorescence
lifetime in the presence of an acceptor (IDA, τDA) has to be compared with the respective value
in its absence (ID, τD):
D
DA
IIE −= 1 (4),
D
DAEττ
−= 1 (5)
When FRET occurs, both the intensity and lifetime of the donor fluorescence decrease, while
the intensity of the acceptor emission increases. All these changes can be exploited to measure
the efficiency of energy transfer between the donor and the acceptor.
Materials and Methods
23
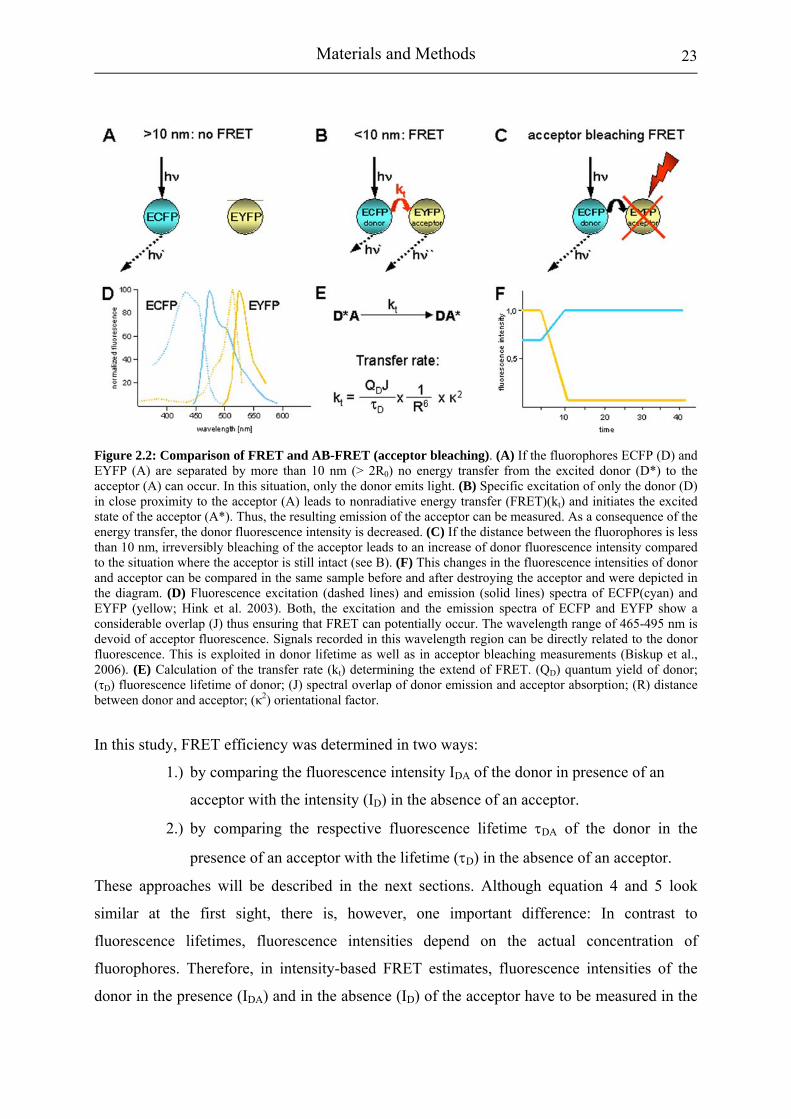
Figure 2.2: Comparison of FRET and AB-FRET (acceptor bleaching). (A) If the fluorophores ECFP (D) and EYFP (A) are separated by more than 10 nm (> 2R0) no energy transfer from the excited donor (D*) to the acceptor (A) can occur. In this situation, only the donor emits light. (B) Specific excitation of only the donor (D) in close proximity to the acceptor (A) leads to nonradiative energy transfer (FRET)(kt) and initiates the excited state of the acceptor (A*). Thus, the resulting emission of the acceptor can be measured. As a consequence of the energy transfer, the donor fluorescence intensity is decreased. (C) If the distance between the fluorophores is less than 10 nm, irreversibly bleaching of the acceptor leads to an increase of donor fluorescence intensity compared to the situation where the acceptor is still intact (see B). (F) This changes in the fluorescence intensities of donor and acceptor can be compared in the same sample before and after destroying the acceptor and were depicted in the diagram. (D) Fluorescence excitation (dashed lines) and emission (solid lines) spectra of ECFP(cyan) and EYFP (yellow; Hink et al. 2003). Both, the excitation and the emission spectra of ECFP and EYFP show a considerable overlap (J) thus ensuring that FRET can potentially occur. The wavelength range of 465-495 nm is devoid of acceptor fluorescence. Signals recorded in this wavelength region can be directly related to the donor fluorescence. This is exploited in donor lifetime as well as in acceptor bleaching measurements (Biskup et al., 2006). (E) Calculation of the transfer rate (kt) determining the extend of FRET. (QD) quantum yield of donor; (τD) fluorescence lifetime of donor; (J) spectral overlap of donor emission and acceptor absorption; (R) distance between donor and acceptor; (κ2) orientational factor.
In this study, FRET efficiency was determined in two ways:
1.) by comparing the fluorescence intensity IDA of the donor in presence of an
acceptor with the intensity (ID) in the absence of an acceptor.
2.) by comparing the respective fluorescence lifetime τDA of the donor in the
presence of an acceptor with the lifetime (τD) in the absence of an acceptor.
These approaches will be described in the next sections. Although equation 4 and 5 look
similar at the first sight, there is, however, one important difference: In contrast to
fluorescence lifetimes, fluorescence intensities depend on the actual concentration of
fluorophores. Therefore, in intensity-based FRET estimates, fluorescence intensities of the
donor in the presence (IDA) and in the absence (ID) of the acceptor have to be measured in the

Materials and Methods
24
same sample. Whereas IDA is directly accessible, ID can only be determined by measuring the
donor fluorescence after destroying the acceptor fluorophore, e.g. by photo-bleaching.
2.2.10.1. Acceptor Photobleaching based FRET measurements
FRET was measured using the acceptor photobleaching method (Kenworthy, 2001; Karpova
et al., 2003). The AB-FRET method consists of measuring the donor fluorescence intensity
before and after photobleaching the acceptor (Figure 2.2C and F). Destroying the acceptor due
to photobleaching eliminates the energy transfer between the two fluorophores. This leads to
an increased donor fluorescence that is indicative of FRET. Since it is difficult to estimate the
amount of acceptor fluorescence that is only due to FRET correctly, methods that evaluate
only the donor fluorescence signal are considered to be more reliable. Emission spectra of
molecules are rather steep at the short wavelength side, therefore in most cases a part of the
donor emission spectrum is devoid of acceptor fluorescence.
Transfected cells grown on 42 mm glass dishes were transferred to a life cell chamber (Pecon,
Erbach, Germany) and analysed using an Axiovert 200M/LSM510 Meta microscope with a
C-Apochromat 40x/1.2 NA water objective.
Cerulean fluorescence was excited with the Ar 458 nm laser line and detected using the Meta
detector (ChS1: 477-488 nm, ChS2: 488-499 nm). EYFP fluorescence was excited with the
Ar 514 nm laser line and detected in one of the confocal channels (Ch 2) using a 530 nm long-
pass filter. To minimize cross talk between the channels each image was collected separately
in the multi track mode.
Single optical sections were selected by scanning the sample in the z-axis for optimal
fluorescence signals. Acceptor bleaching was performed within a region of interest (ROI)
including one centromere of a nucleus using the 514 nm laser line at 100% intensity and with
100 scans at 1.6µs pixel time. Bleaching times per pixel were identical for each experiment.
However, total bleaching times varied depending on the size of the bleached ROIs. Two
Cerulean and EYFP fluorescence images were taken before bleaching procedure to ensure
that bleaching due to imaging was minimal. 8-10 images were taken immediately after EYFP
bleaching to assess changes in donor and acceptor fluorescence. To minimize the effect of
photobleaching of the donor during the imaging process, the image acquisition was performed
at low laser intensities (1% transmission) and without cycle delay. Cerulean and EYFP
intensities in the ROI were averaged and normalized to the highest intensity measured during
the time series. The FRET efficiency was calculated according to equation (4). IDA was
obtained by averaging the Cerulean intensities of the two prebleach images in the presence of

Materials and Methods
25
a photochemically intact acceptor. ID was determined by measuring the Cerulean fluorescence
intensity in the first postbleach image obtained after the acceptor has been destructed by
photobleaching.
2.2.10.2. FLIM (Fluorescence Lifetime Measurements)
Fluorescence lifetime measurements (FLIM) are minimally invasive compared to the
fluorescence-intensity based AB-FRET approach and provide direct quantitative
measurements of FRET efficiency. In addition, lifetime-based FRET measurements are
fluorophore-concentration independent and can provide valuable information on the relative
fraction of the bound complex resulting from the kinetics of the fluorescence decay: The
fraction of free compared to associated molecules within a complex can be determined by
fitting a multi-exponential function to the fluorescence decay curve (Figure 2.3). Furthermore,
statistical tests can be applied to check if a model is consistent with the measured data
(Biskup et al., 2006).
τs
τf
As
Af
biexponential fit
τmonoexponential fit
Figure 2.3: Potential association states between proteins within the centromere kinetochore complex and the respective fluorescence decays. (top right) In the case that all proteins fused to donor molecules (dark green) are associated with acceptor labelled proteins (purple) only one class of donor molecules exists and the resulting donor fluorescence decay is monoexponential (blue curve). (bottom right) When only a part of the donor labelled proteins is associated two populations of donor molecules – bound and unbound – are present, giving rise to a bi-exponential decay (green curve). By measuring and analysing the donor fluorescence decay one can distinguish between the two association states of the labelled proteins. The slow lifetime constant (τs) is the lifetime of unbound donor labelled proteins. From the lifetime of the fast component (τf) the FRET efficiency of the interacting donor and acceptor pairs can be calculated. From the relative amplitudes (As, Af) one can get an estimate for the fraction of bound and unbound proteins of the lifetime components. (CFP) donor, (YFP) acceptor. (modified from Biskup et al., 2006)

Materials and Methods
26
For measuring the donor fluorescence lifetime, we applied the time-correlated single-photon
counting (TCSPC) method (O´Connor and Phillips, 1984). In this approach, the time delay of
a single emitted photon after excitation is measured sequentially and sampled into different
acquisition channels (Figure 2.4). The decay obtained corresponds to the return to the ground
state of the fluorophore population excited by a short laser pulse and is a measure of the
fluorescence lifetime (Goldman and Spector, 2005).
Figure 2.4: Principle of TCSPC (time correlated single photon counting). (top) A fluorophore is excited by a short laser pulse and emits photons when returning to the ground state. The time between the excitation and the emission of a photon is measured. (bottom) Single photons were counted and collected in different channels of a histogram according to their decay times. Based on these measurements the fluorescence lifetime of the fluorophore can be calculated. (modified from Goldman and Spector, 2005).
The set-up used for lifetime measurements based on TCSPC is depicted in Figure 2.5. It
consists of a Titanuim:Sapphire laser (Mira 900, Coherent GmbH, Dieburg, Germany), a laser
scanning microscope (Zeiss LSM 510, Carl Zeiss GmbH, Göttingen, Germany) and a
photomultiplier (3809U, Hamamatsu Photonics Deutschland GmbH, Herrsching, Germany)
connected to a TCSPC imaging module (SPC730/SPC830 Becker&Hickl GmbH, Berlin,
Germany). In all FLIM experiments, the Cerulean fluorophore was excited by ultrashort light
pulses generated by a combination of a mode locked Ti:Sapphire laser and a SHG crystal. The
emission wavelength was tuned to 860 nm and frequency-doubled to 430 nm by a LBO-
crystal. At this excitation wavelength, no EYFP fluorescence was excited. In order to
minimize photobleaching and photoconversion of Cerulean, the average excitation power was

Materials and Methods
27
adjusted to less than 25 µW. The attenuated laser beam was directed to the scan head of the
laser scanning microscope. Fluorescence light originating from the sample was focused onto
one of the pinholes (channel 4) of the laser scanning microscope and guided to a MCP-PMT
for time-correlated single photon counting (TCSPC). A 465-495 nm bandpass filter (XF3075,
Omega optical, Laser Components, Olching, Germany) or 460-500 nm bandpass filter (F72-
484, AF Analysentechnik, Tübingen, Germany) in front of the photomultiplier restricted the
fluorescence light to be analysed to the emission wavelength range of Cerulean and filtered
out scattered excitation light and EYFP fluorescence effectively. The MCP-PMT was
connected to a TCSPC computer module. The temporal resolution of this setup was better
than 30 ps (FWHM) (Biskup et al., 2004a).
Figure 2.5: Experimental set-up for the FLIM measurements. Femtosecond laser pulses were generated with a Ti:Sapphire laser, that was pumped by a 5 W frequency doubled Nd:YVO4 laser. The frequency of the laser beam was doubled in a LBO-crystal (SHG-unit). The parallelised beam was directed to the scan head of the laser-scanning microscope. Fluorescence light originating from the sample was guided through an optical glass fiber to a photomultiplier (MCP-PMT) for time-correlated single photon counting (TCSPC). A bandpass filter in front of the MCP-PMT restricted the recorded fluorescence to the wavelength range of 465-495 nm. The TCSPC unit receives laser pulse time information via a photodiode. The MCP-PMT was connected to a TCSPC computer module (SPC730, SPC830 Becker&Hickl) which was used to built up a three-dimensional histogram of photon density over spatial (x,y) and temporal (t) coordinates. The actual position of the scanning beam was calculated from the FrameSync, LineSync and PixelClock signals of the laser scanning microscope. The temporal resolution of this setup was better than 30 ps. (from Biskup et al., 2004a).
TCSPC data were analysed with software developed by C. Biskup and a commercial software
package (SPCImage V2.4, Becker&Hickl, Berlin, Germany). In both approaches, the iterative
reconvolution method was used to recover the fluorescence lifetime from fluorescence decay
Materials and Methods
28
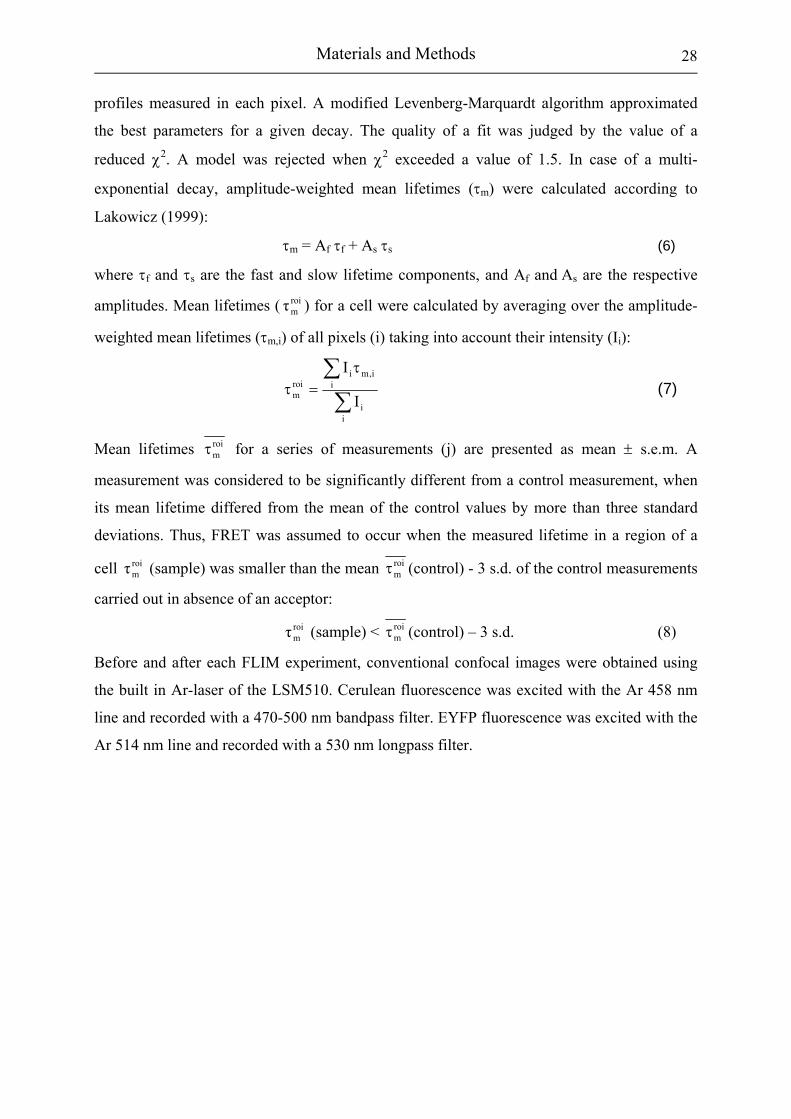
profiles measured in each pixel. A modified Levenberg-Marquardt algorithm approximated
the best parameters for a given decay. The quality of a fit was judged by the value of a
reduced χ2. A model was rejected when χ2 exceeded a value of 1.5. In case of a multi-
exponential decay, amplitude-weighted mean lifetimes (τm) were calculated according to
Lakowicz (1999):
τm = Af τf + As τs (6)
where τf and τs are the fast and slow lifetime components, and Af and As are the respective
amplitudes. Mean lifetimes ( ) for a cell were calculated by averaging over the amplitude-
weighted mean lifetimes (τm,i) of all pixels (i) taking into account their intensity (Ii):
roimτ
∑
∑ τ=τ
ii
ii,mi
roim I
I (7)
Mean lifetimes roimτ for a series of measurements (j) are presented as mean ± s.e.m. A
measurement was considered to be significantly different from a control measurement, when
its mean lifetime differed from the mean of the control values by more than three standard
deviations. Thus, FRET was assumed to occur when the measured lifetime in a region of a
cell (sample) was smaller than the mean roimτ
roimτ (control) - 3 s.d. of the control measurements
carried out in absence of an acceptor: roimτ (sample) < roi
mτ (control) – 3 s.d. (8)
Before and after each FLIM experiment, conventional confocal images were obtained using
the built in Ar-laser of the LSM510. Cerulean fluorescence was excited with the Ar 458 nm
line and recorded with a 470-500 nm bandpass filter. EYFP fluorescence was excited with the
Ar 514 nm line and recorded with a 530 nm longpass filter.
Results
29
3 Results
3.1. RNAi knock down of the human kinetochore protein CENP-H
Many knock out/down experiments in different organisms elucidated functions and
interdependencies of most of the inner kinetochore protein in kinetochore complex assembly.
These studies indicated that in different organisms, the impact of several kinetochore proteins
on kinetochore formation and proper cell division seems to vary. For example, in fission
yeast, CENP-A localisation is altered in Mis6 mutants (CENP-I homologue) suggesting that
Mis6 may be involved in CENP-A localisation to the fission yeast centromere (Takahashi et
al., 2000). However, the Mis6 budding yeast homologue Ctf3p is not required for loading of
the CENP-A homologue Cse4p onto budding yeast centromeric DNA (Measdy et al., 2002).
And in chicken, a whole multiprotein CENP-H-I complex is required for incorporation of
newly synthesised CENP-A into centromeres (Okada et al., 2006). Furthermore, both CENP-
H and CENP-I are necessary for the kinetochore localisation of CENP-C in chicken
(Fukagawa et al., 2001; Nishihasi et al., 2002). In human HeLa cells, however, CENP-C could
be localised at the kinetochore independently of CENP-I (Goshima et al., 2003). And finally,
the inner kinetochore protein CENP-H is a homologous protein in human, mouse and chicken,
however, it seems not to have homologous representatives in C. elegans, D. melanogaster, S.
cerevisiae or S. pombe. Thus, if present at all, functional homologues would have limited
sequence homology. A comparative study of human and chicken kinetochores is imperative
since despite a rather well established overall (inner) kinetochore complex conservation
between eukaryotes, its detailed architecture and protein binding hierarchy varies from
organism to organism.
Studies of the essential functions of the constitutive kinetochore protein CENP-H in humans
are lacking. Therefore, the influence of CENP-H on kinetochore assembly, function and
mitotic progression was analysed here by RNAi knock down in human HEp-2 cells. In
chicken DT40 cells, CENP-H localises to the kinetochore during the whole cell cycle and was
found to be necessary for CENP-C, but not CENP-A, localisation to the centromeres
(Fukagawa et al., 2001). In the absence of CENP-H, these chicken cells arrest in metaphase
consistent with loss of centromere function (Fukagawa et al., 2001). The comparative analysis
presented here will elucidate the role of CENP-H in organisation and function of the human
centromere-kinetochore complex.

Results
30
3.1.1. The siRNA led to depletion of CENP-H in human HEp-2 cells
In different tissues, CENP-H appears in several iso-forms (see harvester.embl.de
/harvester/Q9H3/Q9H3R5.htm; Figure 3.1.1).
Figure 3.1.1: Splice variants of the CENP-H gene and position of the siRNA target sequence within the area of exon 2 and 3. The clones BG742599 (915 bp), BF245236 (810 bp) and AI761528 (467 bp), which represent the 3 splice variants, were obtained from RZPD, Berlin, Germany. Their names correspond to their accession number in PubMed. The lanes show which areas are removed by splicing in the different forms. Human HEp-2 cells only contain the BF 245236 splicing variant. In HEp-2 cells, a single nucleotide polymorphism (SNP) from T to C (shown in red) was found in the area of siRNA, marked with a thick lane.
A suitable siRNA sequence which simultaneously knocked down all CENP-H iso-forms but
no other protein (verified by a BLAST analysis) was designed. The target sequence
(dTGGTTGATGCAAGTGAAGA) is situated at the exon 2 to 3 transition (see Figure 3)
starting at gene position 177. Then, it was determined which of the three available iso-forms
occured in HEp-2 cells. HEp-2 cell RNA was isolated and RT-PCR was performed in order to
obtain the HEp-2 cDNA. Semi-nested PCR with a specific primer pair for each iso-form (see
Material & Methods) lead to the identification of BF245236 as the CENP-H form present in
HEp-2 cells: a PCR fragment of 810 bp length was identified in 1% agarose gel (data not
shown). Subsequently, the PCR fragment was cloned and several clones were sequenced.
Sequence comparison of several (96) clones identified a single nucleotide polymorphism
(SNP) at sequence position 8 of the siRNA from T to C. Nevertheless, the further analyses
indicated that the selected and synthesised siRNA indeed knocked down CENP-H specifically
(see Figure 3.1.2).

Results
31
Figure 3.1.2: CENP-H reduction by RNAi did not influence the cellular content of the kinetochore proteins CENP-C, CENP-E and hBubR1. RNAi was used to block the protein synthesis of CENP-H (A, C, D, E, F) and, as a positive control, lamin A/C (B) in HEp-2 cells. The reduction of protein level and the amount of further proteins was then analysed by immuno-blotting of protein lysates from cells treated without (-) or with (+) RNAi oligonucleotides for 72 hours. (A) The amount of CENP-H was strongly reduced by RNAi. In Western blots using a goat anti-CENP-H antibody, CENP-H always appeared as a double band. The lower of the two bands migrated at 30 kDa, the expected size of CENP-H. The upper band appeared at about 32 kDa. (B) SiRNA against lamin A/C led to the depletion of both protein isoforms. (C) An anti-splicing factor SmB/B´ antibody was used as a loading control in untreated and CENP-H depleted cells (Sm). Depletion of CENP-H did not affect the protein amount of CENP-C (D), CENP-E (E) or the checkpoint protein hBubR1 (F). The protein content did not change in control and siRNA treated cells.
For the following set of experiments including cell number determination, Western blot
analysis, immuno-fluorescence and flow cytometry analysis, equal number of HEp-2 cells
were seeded in 6-well-plates, transfected with siRNA and incubated for 24, 48 or 72 hours. At
these different time points, the cells were subjected to the various experimental analyses.
Using Cy3-labelled luciferase GL2 RNA duplex, the siRNA transfection efficiency was
measured and found to be close to 100% (data not shown). After 24, 48 and 72 hours
incubation with siRNA cells were harvested, counted, lysed and equal numbers of cells were
analysed by Western blots. Figure 3.1.2A displays the very low protein level of CENP-H after
72 h of incubation in comparison to untreated cells. As a positive control, also lamin A/C is
knocked down by lamin specific siRNA in HEp-2 cells (Figure 3.1.2B, compare Wieland et
al., 2004). To control the specificity of the siRNA against CENP-H and to ensure equal
amounts of other proteins in control and siRNA treated samples, cell lysates were stained with
an antibody against the splicing factor SmB/B´. Similar protein levels were found in control
and CENP-H depleted cells (Figure 3.1.2C). Western blots were quantitatively analysed after
incubation times of 24, 48 and 72 h. After 72 h, the protein level of CENP-H was reduced to a
few percent (< 5%) compared to the initial value (data not shown).
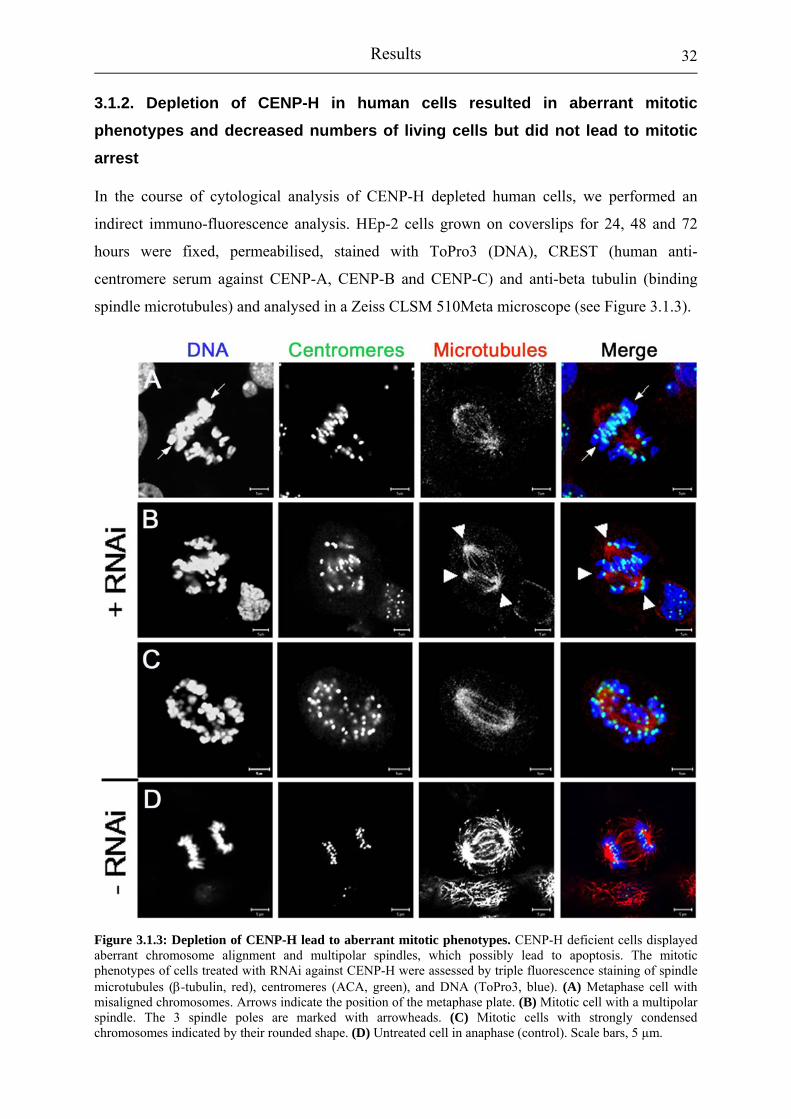
Results
32
3.1.2. Depletion of CENP-H in human cells resulted in aberrant mitotic phenotypes and decreased numbers of living cells but did not lead to mitotic arrest
In the course of cytological analysis of CENP-H depleted human cells, we performed an
indirect immuno-fluorescence analysis. HEp-2 cells grown on coverslips for 24, 48 and 72
hours were fixed, permeabilised, stained with ToPro3 (DNA), CREST (human anti-
centromere serum against CENP-A, CENP-B and CENP-C) and anti-beta tubulin (binding
spindle microtubules) and analysed in a Zeiss CLSM 510Meta microscope (see Figure 3.1.3).
Figure 3.1.3: Depletion of CENP-H lead to aberrant mitotic phenotypes. CENP-H deficient cells displayed aberrant chromosome alignment and multipolar spindles, which possibly lead to apoptosis. The mitotic phenotypes of cells treated with RNAi against CENP-H were assessed by triple fluorescence staining of spindle microtubules (β-tubulin, red), centromeres (ACA, green), and DNA (ToPro3, blue). (A) Metaphase cell with misaligned chromosomes. Arrows indicate the position of the metaphase plate. (B) Mitotic cell with a multipolar spindle. The 3 spindle poles are marked with arrowheads. (C) Mitotic cells with strongly condensed chromosomes indicated by their rounded shape. (D) Untreated cell in anaphase (control). Scale bars, 5 µm.
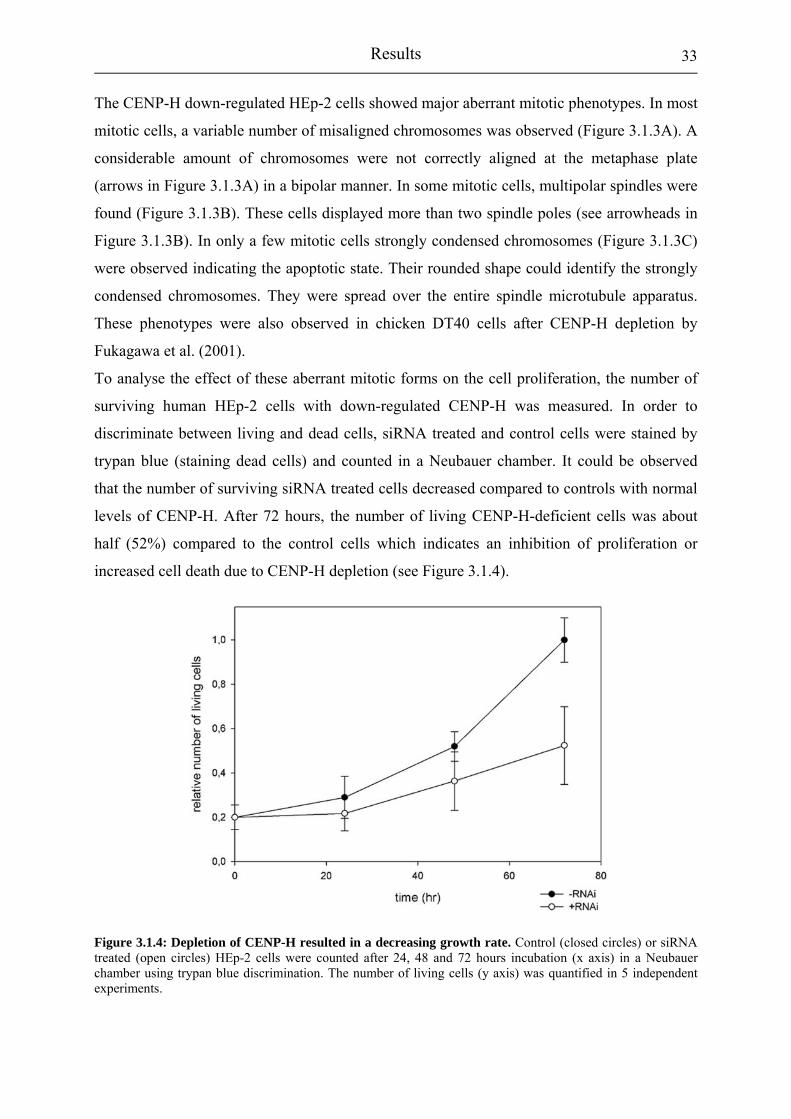
Results
33
The CENP-H down-regulated HEp-2 cells showed major aberrant mitotic phenotypes. In most
mitotic cells, a variable number of misaligned chromosomes was observed (Figure 3.1.3A). A
considerable amount of chromosomes were not correctly aligned at the metaphase plate
(arrows in Figure 3.1.3A) in a bipolar manner. In some mitotic cells, multipolar spindles were
found (Figure 3.1.3B). These cells displayed more than two spindle poles (see arrowheads in
Figure 3.1.3B). In only a few mitotic cells strongly condensed chromosomes (Figure 3.1.3C)
were observed indicating the apoptotic state. Their rounded shape could identify the strongly
condensed chromosomes. They were spread over the entire spindle microtubule apparatus.
These phenotypes were also observed in chicken DT40 cells after CENP-H depletion by
Fukagawa et al. (2001).
To analyse the effect of these aberrant mitotic forms on the cell proliferation, the number of
surviving human HEp-2 cells with down-regulated CENP-H was measured. In order to
discriminate between living and dead cells, siRNA treated and control cells were stained by
trypan blue (staining dead cells) and counted in a Neubauer chamber. It could be observed
that the number of surviving siRNA treated cells decreased compared to controls with normal
levels of CENP-H. After 72 hours, the number of living CENP-H-deficient cells was about
half (52%) compared to the control cells which indicates an inhibition of proliferation or
increased cell death due to CENP-H depletion (see Figure 3.1.4).
Figure 3.1.4: Depletion of CENP-H resulted in a decreasing growth rate. Control (closed circles) or siRNA treated (open circles) HEp-2 cells were counted after 24, 48 and 72 hours incubation (x axis) in a Neubauer chamber using trypan blue discrimination. The number of living cells (y axis) was quantified in 5 independent experiments.

Results
34
Furthermore, the number of aberrant mitotic cells was determined in order to quantify the
aberrant mitotic phenotypes having multipolar spindles or misaligned chromosomes (see
Figure 3.1.5). 450 cells per time point were counted in 6 independent experiments. The
numbers of cells are given relative to all cells observed (100%). With increasing incubation
time, control cells showed a slightly decreasing number of aberrant mitotic cells (18% after 24
hours, 15% after 48 hours and 11% after 72 hours; see Figure 3.1.5).
Figure 3.1.5: CENP-H defi-cient cells displayed an in-creased number of aberrant mitotic phenotypes such as misaligned chromosomes and multipolar spindles. Control (closed labels) and siRNA treated (open labels) HEp-2 cells were fixed after 24, 48 and 72 hours incubation (x axis), stained for spindle microtubules, centromeres and DNA and analysed in the CLSM. The cell numbers which show misaligned chro-mosomes (circles) and multi-polar spindles (triangles) were quantified (y axis). For each time point 450 cells were counted in 6 independent ex-periments.
Of these cells, only 1% showed multipolar spindles after 48 hours; most of the aberrant
control cells displayed the misaligned chromosome phenotype which decreased from 18% to
13% and 10% after 24, 48 and 72 hours, respectively. This situation was different in the
siRNA treated cells: here the number of aberrant mitotic cells was 1.7times higher compared
to control cells after 24 hours, 2.5times higher after 48 hours and 4.3times higher after 72
hours. CENP-H depleted cells established multipolar spindles with a frequency of 2% after 24
hours, 1% after 48 hours and 4% after 72 hours. In addition, like in the control, a high number
of mitotic cells with misaligned chromosomes was observed increasing from 30% (24 h) up to
35% (48 h) and 43% (72 h). The appearance of this phenotype increased with time (while it
decreased for the control cells) and it was of considerably higher number. It, therefore, can be

Results
35
concluded that in human HEp-2 cells depletion of CENP-H results in a strongly increased
number of abnormal mitotic phenotypes and cell death.
The high and increasing number of observed abnormal phenotypes of siRNA knocked down
HEp-2 cells indicates that CENP-H is highly important for normal cell cycle progression and
chromosome segregation. It was therefore tested if CENP-H depletion resulted in mitotic
arrest in human cells as it did in chicken. A FACS analysis was performed using propidium
iodide for DNA staining in order to count cells with either di- (2N) or tetraploid (4N) sets of
chromosomes - or even more in case of severe distortions. As controls, cells were blocked in
G0 phase by serum starvation, in S phase by adding aphidicoline or thymidine, or in mitosis
by adding nocodazole. The expected enrichment of cells in the respective cell cycle phase
(data not shown) was observed. The HEp-2 cells were analysed in time steps of 24 hours from
day 1 to day 9 (216 hours; see Figure 3.1.6).
Figure 3.1.6: Cell cycle analysis revealed no mitotic arrest in CENP-H depleted cells. FACS analysis of siRNA treated HEp-2 cells was performed after 24 to 216 hours incubation in 5 different experiments. In each measurement 50.000 gated cells stained with propidium iodide to detect total DNA (linear scale) were counted.
A normal cell cycle distribution was observed although the cells were depleted of CENP-H.
Thus, the cell cycle of CENP-H depleted HEp-2 cells seemed to be normal without
indications of cell cycle delay and distorted chromosome segregation. This finding was
supported by observations in chicken, where the spindle checkpoint became inactive after 72
hours in CENP-H-/- DT-40 cells most likely reflecting complete removal of CENP-H.
However, in contrast to the situation in human HEp-2 cells Fukagawa et al. (2001) reported
distorted chromosome segregation and a metaphase arrest 48 hours after knocking out CENP-

Results
36
H in chicken. Obviously, the abnormal mitotic phenotypes resulting from depletion of CENP-
H in human cells either were corrected in a short time or the affected cells died.
3.1.3. CENP-H depleted kinetochores showed an unchanged presence of the checkpoint protein hBubR1 and a reduced presence of CENP-C and CENP-E
In order to elucidate the functionality of the kinetochore complex, the localisation of several
kinetochore proteins in CENP-H depleted HEp-2 cells was studied. In a first step, the
interdependencies between CENP-H and CENP-C in human cells was analysed since CENP-
H is necessary for the recruitment of CENP-C to kinetochores in chicken DT40 cells.
Therefore, human HEp-2 cells were stained with antibodies against CENP-A and CENP-C
and the distribution of these kinetochore proteins compared in control and siRNA treated
mitotic cells in 3 different experiments, Figure 3.1.7). CENP-A was used as a marker for the
kinetochore. CENP-C is a constitutive kinetochore protein stably binding to the complex. In
healthy cells, CENP-A and CENP-C colocalised at the kinetochore throughout the whole cell
cycle (Figure 3.1.7A). In CENP-H depleted human cells, in contrast to chicken DT40 cells,
considerable amounts of CENP-C could be detected, even at kinetochores of misaligned
chromosomes (arrowhead in Figure 3.1.7B). In addition, an abnormal localisation of CENP-C
at the cell periphery was observed. The total protein amount of CENP-C did not change in
CENP-H depleted cells (see Figure 3.1.2D). However, CENP-H depleted human kinetochores
showed a decreased CENP-C protein level at kinetochores compared to control cells (Figure
3.1.2A and B). To quantify the amount of CENP-C at kinetochores the background corrected
fluorescence intensity of CENP-C related rhodamine linked to a secondary antibody detecting
the anti-CENP-C antibody was determined. Using the Metamorph software we analysed 445
kinetochores in eleven control cells yielding relative fluorescence intensity set to 100 ± 1%
(Figure 3.1.8A). When determining the fluorescence intensity of rhodamine at 364
kinetochore in ten CENP-H depleted cells (72 hours after RNAi transfection) a relative
fluorescence intensity of 72 ± 1% was observed. This suggests that a reduced amount of
CENP-C was incorporated into CENP-H depleted kinetochores. This effect, however, is much
smaller in human (-28%) than in chicken cells (-88%; Fukagawa et al; 2001). Nevertheless,
this result indicates that, as in chicken, strong reduction of CENP-H influences the binding of
CENP-C to kinetochores also in human cells. As described above, mitotic arrest in CENP-H
knocked-down cells was not observed despite appearance of misaligned chromosomes. This
led to the assumption that checkpoint function might be disturbed. Due to the difference in

Results
37
mitotic progression in CENP-H depleted human and chicken cells, the localisation of the
checkpoint protein hBubR1 was analysed in control and CENP-H deficient cells. hBubR1 is
present at the kinetochores until they are correctly aligned in the metaphase plate and
connected to spindle microtubules. In this way, together with other checkpoint proteins,
hBubR1 grants the “wait-for-anaphase” signal (Harris et al., 2005; Mao et al., 2005). In
control cells, hBubR1 was correctly localised at the kinetochore of not aligned chromosomes
(Figure 3.1.7C). In human cells lacking CENP-H, the protein was still present at kinetochores
of misaligned chromosomes (Figure 3.1.7D). The protein level of hBubR1 was not changed in
CENP-H depleted cells as shown by Western Blot analysis (see Figure 3.1.2F). Therefore,
also at CENP-H depleted kinetochores, the mitotic checkpoint seems to be assembled in a
correct manner.
When the checkpoint is correctly assembled at CENP-H depleted kinetochores, why then does
it not inhibit cell cycle progression until all chromosomes are properly aligned? Recent
findings indicate that the checkpoint cannot be established or maintained without the
kinetochore-associated microtubule motor protein CENP-E (Abrieu et al., 2000; Putkey et al.,
2002; Mao et al., 2005). The association of CENP-E with hBubR1 stimulates its kinase
activity that is required for prevention of premature anaphase in the presence of unattached
kinetochores (Putkey et al., 2002). To find out if CENP-E is still present to activate hBubR1
kinase, the localisation of CENP-E at kinetochores lacking CENP-H was studied. During
mitosis, CENP-E was detected at kinetochores and at the spindle poles in control cells (Figure
3.1.7E). CENP-E strongly accumulated on misaligned chromosomes while it was much
weaker on kinetochores of aligned chromosomes. In CENP-H depleted cells, the spindle poles
were still stained with CENP-E, but most of the protein was detected within the nucleoplasm
in an abnormal pattern (Figure 3.1.7F). The amount of CENP-E in CENP-H depleted cells,
however, did not change in comparison to control cells; only its localization was altered (as
shown by Western Blot analysis, see Figure 3.1.2E). Misaligned chromosomes were identified
by CENP-A and DNA staining (as an example see Figure 3.1.7E, 5.2F) and it was determined
how many of them contained CENP-E at their kinetochores. In control cells, CENP-E was
present at kinetochores in 98 ± 0,2% of unaligned chromosomes. After CENP-H depletion,
only 56 ± 1% kinetochores of misaligned chromosomes contained CENP-E (after 72 hours;
Figure 3.1.8B).

Results
38
Figure 3.1.7: Kinetochores depleted of CENP-H showed an aberrant distribution or lack of CENP-E but still contained CENP-C and hBubR1. HEp-2 cells transfected with control (A, C, E) or CENP-H siRNA (B, D, F) were fixed and co-stained for CENP-A to show the position of the kinetochores (left column) and for the kinetochore proteins CENP-C (A,B), hBubR1 (C, D) and CENP-E (E, F), (second column). Chromosomes were stained with ToPro3 (third column). The right column displays the overlay of all 3 stainings. Some kinetochores of misaligned chromosomes in CENP-H deficient cells, which were stained against CENP-C (B), hBubR1 (D) or CENP-E (F) are indicated by arrowheads for comparison. The spindle poles are indicated with arrows. For each of the 3 kinetochore proteins 150 CENP-H depleted cells at 3 different time points after incubation (24, 48 and 72 hours) were analysed. Scale bars, 10 µm.

Results
39
In those misaligned chromosomes containing CENP-E at their kinetochores, the amount of
CENP-E (n = 150 kinetochores of nine control cells) was quantified by measuring the
fluorescence intensity of FITC-labelled secondary antibodies detecting anti-CENP-E
antibodies as described above.
Figure 3.1.8: CENP-H deficient kinetochores contained a decreased amount of CENP-C and CENP-E and about half of the misaligned chromosomes totally failed to recruit CENP-E. Control or siRNA treated HEp-2 cells were fixed after 72 hours incubation and co-stained for CENP-A and for the kinetochore proteins CENP-E and CENP-C, respectively. To quantify the amount of CENP-C (A) or CENP-E (B, C) at each centromere locus, the fluorescence intensity analysis (see text) was performed using Metamorph Offline 6.1r4 software. (A) The CENP-H deficient kinetochores contained only 72±1% CENP-C compared to untreated control cells. (B) In untreated control cells, 98±0.2% of the kinetochores of misaligned chromosomes contained CENP-E. In CENP-H deficient cells, this number was reduced to 56±1%. (C) In those kinetochores of misaligned chromosomes that contained CENP-E, the amount of CENP-E was reduced to 72±2% in CENP-H deficient cells compared to untreated cells.
Results
40
In CENP-H depleted cells (96 kinetochores of nine cells, after 72 hours), a reduced amount of
CENP-E of 72 ± 2% (Figure 3.1.8C) was observed in the kinetochores of misaligned
chromosomes. Slightly less than half of the CENP-A marked kinetochores of misaligned
chromosomes completely lacked CENP-E during mitosis and those kinetochores containing
CENP-E showed a reduced CENP-E level. Since obviously CENP-H depleted kinetochores of
misaligned chromosomes mostly failed to recruit CENP-E and the CENP-E amount at all
kinetochores was decreased, it can be speculated that BubR1 kinase might not be sufficiently
activated. This would possibly lead to a disturbed “wait-for-anaphase” signal with the
consequence that the cells could not arrest in mitosis despite of misaligned chromosomes.
From the data described it can be concluded that CENP-H depletion leads to disturbed
kinetochore function during mitosis in human HEp-2 cells.
3.2. Interaction studies within the human kinetochore in living human cells
The inner kinetochore protein sub-complex binds to the centromere during the whole cell
cycle and serves as the fundamental basis for the binding of further kinetochore proteins
during G2 and mitosis. CENP-A replaces histone H3 at centromeres and is a marker for the
kinetochore positioning on the chromosome. Although being basic for the assembly of all
kinetochore proteins, it seems not to interact with any other inner kinetochore protein, at least
not in vitro or Yeast-2-Hybrid analyses (Suzuki et al., 2004). Furthermore, the non-conserved
centromeric DNA sequence does not determine the localisation of CENP-A. In addition, inner
kinetochore proteins preferentially assemble at α-satellite repetitive DNA sequences, but in
the case of destruction functional neocentromeres can also be established within non-
centromeric regions. Since neither CENP-A nor the centromeric DNA seem to offer a specific
binding site for further kinetochore proteins, it is investigated in this study what signal or
structure might define the site of the kinetochore complex settlement.
It was assumed that epigenetic or structural phenomena of centromeric chromatin contribute
to or even might determine kinetochore build-up. The interplay of centromeric DNA,
containing CENP-A nucleosomes, and inner kinetochore proteins as CENP-B, CENP-C,

Results
41
CENP-H and CENP-I possibly provides such a particular structure which will be recognized
and bound by further kinetochore proteins. Therefore, by interaction studies, the interface
between centromere and inner kinetochore and the protein network necessary for the complex
assembly is analysed in detail on a molecular level.
So far, the structure of the kinetochore and the interactions of the inner kinetochore proteins
have been examined by various in vitro and Yeast-two-Hybrid studies leading to the
identification of potential new interaction partners of CENP-C and CENP-H (thesis of I.
Erliandri in our laboratory). However, most of the kinetochore proteins have molecular
masses above 30 kDa making structural analyses (e.g. NMR) infeasible. Furthermore, only
few specific antibodies against kinetochore proteins are available (e.g. for electron
microscopy or pull down experiments). Therefore, the development of specific “camel”-
antibodies is in progress (thesis of D. Hellwig in our laboratory). The use of recombinant
proteins, however, led to problems of protein solubility and correct folding. In general,
heterologous protein expression is not able to grant proper protein modification.
For these reasons, potential binding partners within the inner kinetochore complex were
studied in this work in vivo. The proteins CENP-A, CENP-B, CENP-C, CENP-H and CENP-I
have been shown to colocalise in vivo at the inner kinetochore complex. However, due to the
limited optical resolution of a confocal microscope, colocalisation does not prove interaction
of these molecules. Thus, the interactions of CENP-A, -B, -C and –I as well as histones were
analysed in living human HEp-2 cells by measuring the extent of Förster resonance energy
transfer (FRET) between the fluorescent tags of the proteins.
To label the proteins with appropriate donor and acceptor fluorophores for FRET analyses,
the kinetochore proteins CENP-A, CENP-B; CENP-C, CENP-H, CENP-I and the histones
H1, H2A.1, H3.1 and H4.A were cloned into vectors containing the fluorophores Cerulean or
EYFP. N-terminal fusion proteins of the inner kinetochore protein CENP-A, CENP-C and
CENP-I, fusions at both termini of CENP-B, CENP-H and histone H1.0, and N-terminal
fusions of the histones H2A.1, H3.1 and H4.A each with Cerulean or EYFP were constructed.
Comparison of experiments with N-terminally labelled proteins and C-terminally tagged
proteins yields additional information about, for example, the orientation of the protein in the
complex. The DNA sequences of the different constructs were verified by restriction analysis
and sequencing.

Results
42
Figure 3.2.1: Cerulean and EYFP fusion constructs are expressed as full length proteins in human HEp-2 cells. Lysates from HEp-2 cells expressing the respective fusion proteins were separated by SDS-PAGE and transferred to nitrocellulose membranes. Single strips from the membranes were probed with an anti-GFP antibody or anti CENP-C antibody (asterix) detecting the histones H1.0 N-and C-terminally fused to EYFP at about 48 kDa, Cerulean-H2A.1 at about 41 kDa, H3.1 N-terminally fused to EYFP at about 42 kDa, EYFP-H4.A at about 38 kDa, CENP-A fusion proteins at about 43 kDa, CENP-B fusion proteins at about 92 kDa (the lower band is caused by degradation), endogenous and N-terminally fused CENP-C at about 107 kDa and 134 kDa, respectively, CENP-I fusions at the N-terminus at about 110 kDa and ECFP-EYFP-CENP-A at about 70 kDa. Cerulean and EYFP showed a similar but not identical migration (expected size of both fluorophores at about 27 kDa). Fluorescence tagged proteins were detected as full-length proteins at their expected molecular masses. Numbers to the left indicate the positions of standard protein markers (in kDa).
In order to confirm the correct full-length expression of each fusion protein, the vectors were
transiently transfected into HEp-2 cells and their lysates were analysed by Western blotting
(see Figure 3.2.1). All cloned proteins were expressed in the HEp-2 cells with their correct
size. Upon transiently transfection into HEp-2 cells, the fluorescent-tagged kinetochore
proteins except CENP-H localised properly in vivo at centromeric regions like the endogenous
proteins (data not shown). The fusion of fluorescence tags at both termini of CENP-H,
however, resulted in a diffuse distribution of the fusion protein within the cell. Also varying
the linker length between CENP-H and the fluorophores in a way applicable for FRET
measurements did not lead to a correct incorporation of the fusion protein into the inner
kinetochore. Thus, the associations of CENP-H could not be analysed by FRET. Recently, we
had shown that EGFP-tagged CENP-A is correctly incorporated into nucleosomes of
centromeric heterochromatin (Wieland et al., 2004) indicating that the fluorescent tag does
not alter the localisation of the fusion protein in comparison to the endogenous protein.
Dynamic FRAP and FCS studies showed that EGFP-tagged inner kinetochore proteins
CENP-A, -B, -C and -I tightly bound to human centromeres (Weidtkamp-Peters et al., 2006)
suggesting that these fusion constructs retained functional properties of endogenous proteins.

Results
43
Also the fluorescent tagged histones H1.0, H2A.1, H3.1 and H4.A showed the same
distribution and dynamic behaviour in the nucleus as the endogenous proteins (Kimura &
Cook, 2001; Wachsmuth et al., 2003; Weidemann et al., 2003).
3.2.1. FRET measurements using the acceptor photobleaching method
Cells containing the fluorescent-tagged proteins were analysed in vivo with a confocal ZEISS
LSM 510 Meta using the acceptor photobleaching method (AB-FRET). In this approach, the
donor fluorescence intensity is measured (in the same sample) in the presence of an acceptor
before and after destroying the acceptor fluorophore by photobleaching (Kenworthy, 2001). In
AB-FRET, potential energy transfer between the donor and the acceptor is eliminated by
irreversibly bleaching the acceptor fluorophore resulting in an increase of the donor
fluorescence (Figure 2.2; for more details see Methods; Berney & Danuser, 2003). In the
measurements shown here, Cerulean and EYFP were used as donor and acceptor
fluorophores, respectively. For the labelled proteins, reliable FRET data were only obtained
when using the ECFP analogon Cerulean because Cerulean is 2.5 fold brighter than ECFP and
more resistant to photobleaching (Rizzo et al., 2004).
In transiently transfected living HEp-2 cells, single centromeres in interphase nuclei were
bleached with the unattenuated Ar 514 nm laser line. Fluorescence intensity changes in the
bleached area were recorded over time in the Cerulean and EYFP channel by sequential
imaging scans. FRET measurements were carried out in several independent experiments. The
results of single experiments are displayed in Figure 3.2.2 and 3.2.3.
3.2.1.1. Controls
As a positive control, a triple fusion protein consisting of ECFP-EYFP-CENP-A was
constructed giving rise to a high FRET efficiency at human kinetochores because only a two
amino acid linker separates the two fluorophores. Figure 3.2.2A shows the results obtained
from a HEp-2 cell that has been transfected with this construct and incubated for 24 to 48
hours. As visible from the left panel, which shows an overlay of the transmission and the
confocal channels, ECFP-EYFP-CENP-A has been directed to the centromere sites in the cell
nucleus. The second panel in Figure 3.2.2A entitled “Intensity image” shows intensity coded
images of the Cerulean and EYFP channels of the analysed cell before and after acceptor
bleaching. In these images, fluorescence intensities are encoded by colour: high fluorescence
intensities are represented by red colour whereas low intensities are encoded by blue colour.
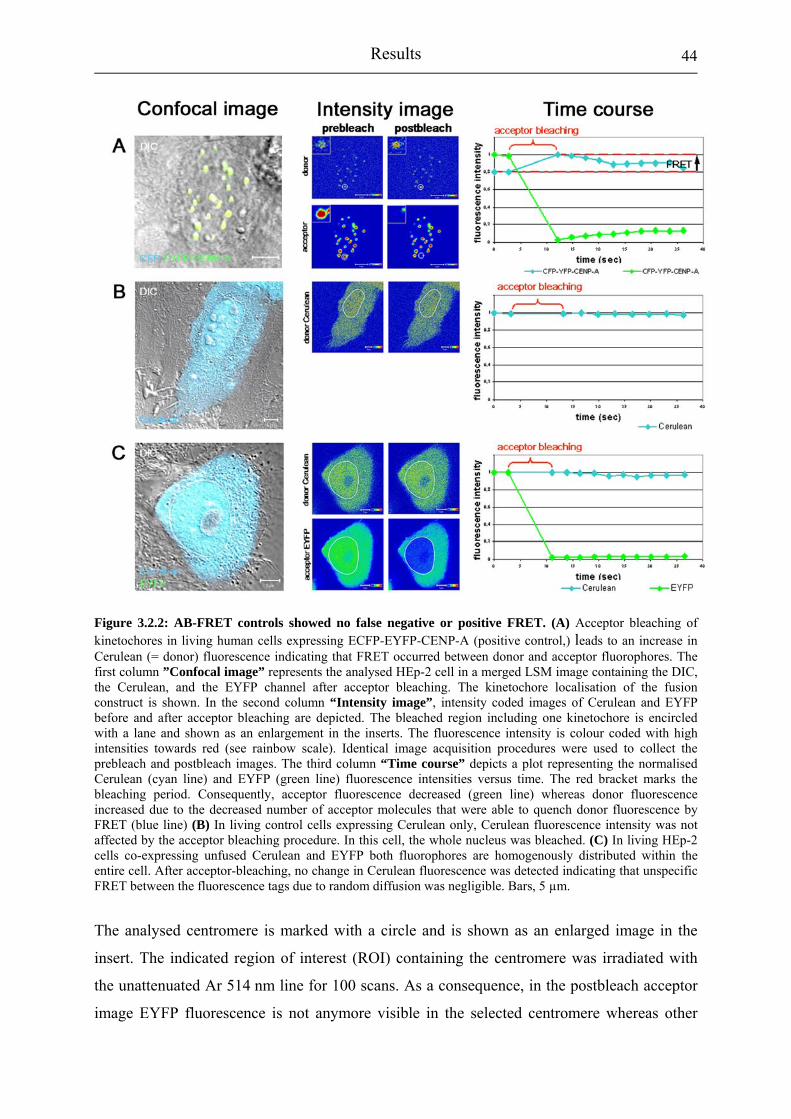
Results
44
Figure 3.2.2: AB-FRET controls showed no false negative or positive FRET. (A) Acceptor bleaching of kinetochores in living human cells expressing ECFP-EYFP-CENP-A (positive control,) leads to an increase in Cerulean (= donor) fluorescence indicating that FRET occurred between donor and acceptor fluorophores. The first column ”Confocal image” represents the analysed HEp-2 cell in a merged LSM image containing the DIC, the Cerulean, and the EYFP channel after acceptor bleaching. The kinetochore localisation of the fusion construct is shown. In the second column “Intensity image”, intensity coded images of Cerulean and EYFP before and after acceptor bleaching are depicted. The bleached region including one kinetochore is encircled with a lane and shown as an enlargement in the inserts. The fluorescence intensity is colour coded with high intensities towards red (see rainbow scale). Identical image acquisition procedures were used to collect the prebleach and postbleach images. The third column “Time course” depicts a plot representing the normalised Cerulean (cyan line) and EYFP (green line) fluorescence intensities versus time. The red bracket marks the bleaching period. Consequently, acceptor fluorescence decreased (green line) whereas donor fluorescence increased due to the decreased number of acceptor molecules that were able to quench donor fluorescence by FRET (blue line) (B) In living control cells expressing Cerulean only, Cerulean fluorescence intensity was not affected by the acceptor bleaching procedure. In this cell, the whole nucleus was bleached. (C) In living HEp-2 cells co-expressing unfused Cerulean and EYFP both fluorophores are homogenously distributed within the entire cell. After acceptor-bleaching, no change in Cerulean fluorescence was detected indicating that unspecific FRET between the fluorescence tags due to random diffusion was negligible. Bars, 5 µm.
The analysed centromere is marked with a circle and is shown as an enlarged image in the
insert. The indicated region of interest (ROI) containing the centromere was irradiated with
the unattenuated Ar 514 nm line for 100 scans. As a consequence, in the postbleach acceptor
image EYFP fluorescence is not anymore visible in the selected centromere whereas other

Results
45
centromeres did not exhibit any change. The acceptor bleaching resulted in an increase of
donor fluorescence at the respective centromere. To quantify fluorescence intensities in the
ROIs the donor and acceptor fluorescence intensities were averaged and normalised to the
highest donor or acceptor value in the time series, respectively. In the right panel of Figure
3.2.2A labelled “Time course”, the normalised intensities are plotted versus time. For each
time series two images were taken before and 8 to 10 images after acceptor bleaching. The
time plot emphasizes the changes already observed in the intensity images: Acceptor
bleaching resulted in a strong decrease of the acceptor fluorescence and, when FRET
occurred, an increase of the donor fluorescence. The intensities before (IDA) and after (ID)
photobleaching are displayed by red dashed lines. From the intensities the FRET efficiency
was calculated according to Equation 4 (see Materials and Methods) yielding a value of 25 ±
1 % (n = 16 kinetochores) for the positive control ECFP-EYFP-CENP-A. This control
experiment verified that FRET can be obtained reliably in living cells by selectively bleaching
only small areas in the nucleus.
Measurements with large postbleach fluorescence variations were discarded to exclude false
positive FRET signals due to random fluorescence fluctuations. In many cases, however,
stable postbleach fluorescence intensity was observed and in some cases acceptor recovery
after bleaching (see for example Figure 3.2.2A “Time course”) that was accompanied with
decreasing donor intensity.
In order to prove that due to the acceptor bleaching procedure no bleaching or
photoconversion of the donor occurs, cells transfected with Cerulean only were subjected to
the same bleaching procedure (Figure 3.2.2B). Due to the absence of the acceptor, no FRET
occurred in these cells. As shown by the confocal image (Figure 3.2.2B, left panel), Cerulean
was distributed diffusely over the entire cell. The bleaching procedure was performed within
the marked area of the cell nucleus in the same way and with the same laser power like in all
other experiments (see Figure 3.2.2B “Intensity image”). Analysing 15 cells, donor
fluorescence intensities (Figure 3.2.2B, middle) and donor fluorescence time course (Figure
3.2.2B, right) showed that Cerulean fluorescence was unaffected by the acceptor bleaching
procedure. Besides, negative influence of the bleaching procedure could not be observed on
cell morphology: All DIC images, shown in Figure 3.2.2 - 3.2.5, were taken after FRET data
acquisition and displayed healthy cell phenotypes.
As a second negative control, unfused Cerulean and EYFP were co-expressed in living human
cells (Figure 3.2.2C). Previous studies suggested that ECFP and EYFP molecules can form
aggregates (Zacharias et al., 2002). However, FCS measurements have shown that such an

Results
46
association occurs only at mM concentrations. Nevertheless, in order to show that such an
association did not occur in the samples, Cerulean and EYFP were co-transfected in HEp-2
cells and acceptor bleaching was performed in 15 cells. Both proteins distributed equally
throughout the whole cell (Figure 3.2.2C “Confocal image”). After complete acceptor
bleaching within the cell nucleus (marked area in Figure 3.2.2C “Intensity image”), no change
in donor fluorescence intensity was observed (Figure 3.2.2C “Time course”). Thus, it can be
excluded that a direct association of Cerulean and EYFP occurred which would have resulted
in a measurable energy transfer. This finding excludes also unspecific FRET between
Cerulean and EYFP molecules that are randomly brought into close vicinity by diffusion.
Thus, if FRET is observed between the labelled proteins, it can only have been caused by a
specific (direct or indirect) interaction between the proteins but not between the tags.
3.2.1.2. Interaction studies of the inner kinetochore protein CENP-A
In a first set of experiments it was studied if an interaction partner of CENP-A exists in vivo.
Therefore, in the same manner as described above, AB-FRET experiments were carried out
with CENP-B-Cerulean and EYFP-CENP-A (Figure 3.2.3A). Both proteins are constitutive
kinetochore proteins that localise at the centromere during the whole cell cycle. Recently,
CENP-B was found in purified CENP-A nucleosome complexes (Foltz et al., 2006). Due to
the DNA binding of CENP-B via its N-terminus (Kitagawa et al., 1995), an association with
the nucleosome incorporated CENP-A seemed to be likely. The centromeric colocalisation of
both fusion proteins is shown in Figure 3.2.3A “Confocal image”. The fluorescence intensities
of the acceptor EYFP-CENP-A and donor CENP-B-Cerulean were stable before and after
bleaching (Figure 3.2.3A “Time course”). The bleaching of the acceptor resulted in a strong
increase of the donor fluorescence intensity with a mean FRET efficiency of 31 ± 2 % (n = 36
kinetochores, Table 1). This indicates a close vicinity of the CENP-A N-terminus to the C-
terminus of CENP-B within the human kinetochore.
However, if donor and acceptor tags are swapped yielding Cerulean-CENP-A and CENP-B-
EYFP no FRET could be detected by the acceptor bleaching method (n = 12 kinetochores,
Table 1). It was assumed that these different results might be due to a different stoichiometry
of donor and acceptor molecules. This is explained in more detail in the FLIM section below.
When analysing Cerulean-CENP-A and CENP-B now tagged at the N-terminus (EYFP-
CENP-B), again no increase of donor fluorescence intensity after acceptor bleaching was
observed (n = 8 kinetochores, Table 1). This finding suggests that CENP-A and CENP-B are
always incorporated in the same orientation into the kinetochore complex. However, in this
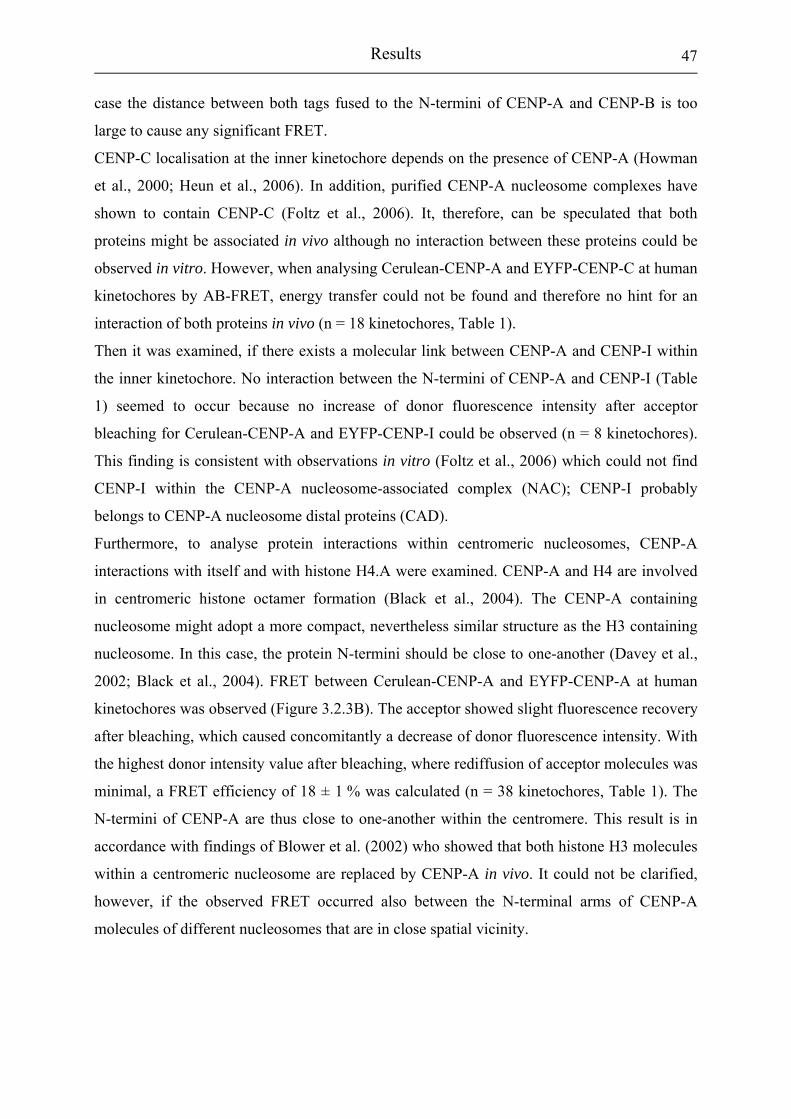
Results
47
case the distance between both tags fused to the N-termini of CENP-A and CENP-B is too
large to cause any significant FRET.
CENP-C localisation at the inner kinetochore depends on the presence of CENP-A (Howman
et al., 2000; Heun et al., 2006). In addition, purified CENP-A nucleosome complexes have
shown to contain CENP-C (Foltz et al., 2006). It, therefore, can be speculated that both
proteins might be associated in vivo although no interaction between these proteins could be
observed in vitro. However, when analysing Cerulean-CENP-A and EYFP-CENP-C at human
kinetochores by AB-FRET, energy transfer could not be found and therefore no hint for an
interaction of both proteins in vivo (n = 18 kinetochores, Table 1).
Then it was examined, if there exists a molecular link between CENP-A and CENP-I within
the inner kinetochore. No interaction between the N-termini of CENP-A and CENP-I (Table
1) seemed to occur because no increase of donor fluorescence intensity after acceptor
bleaching for Cerulean-CENP-A and EYFP-CENP-I could be observed (n = 8 kinetochores).
This finding is consistent with observations in vitro (Foltz et al., 2006) which could not find
CENP-I within the CENP-A nucleosome-associated complex (NAC); CENP-I probably
belongs to CENP-A nucleosome distal proteins (CAD).
Furthermore, to analyse protein interactions within centromeric nucleosomes, CENP-A
interactions with itself and with histone H4.A were examined. CENP-A and H4 are involved
in centromeric histone octamer formation (Black et al., 2004). The CENP-A containing
nucleosome might adopt a more compact, nevertheless similar structure as the H3 containing
nucleosome. In this case, the protein N-termini should be close to one-another (Davey et al.,
2002; Black et al., 2004). FRET between Cerulean-CENP-A and EYFP-CENP-A at human
kinetochores was observed (Figure 3.2.3B). The acceptor showed slight fluorescence recovery
after bleaching, which caused concomitantly a decrease of donor fluorescence intensity. With
the highest donor intensity value after bleaching, where rediffusion of acceptor molecules was
minimal, a FRET efficiency of 18 ± 1 % was calculated (n = 38 kinetochores, Table 1). The
N-termini of CENP-A are thus close to one-another within the centromere. This result is in
accordance with findings of Blower et al. (2002) who showed that both histone H3 molecules
within a centromeric nucleosome are replaced by CENP-A in vivo. It could not be clarified,
however, if the observed FRET occurred also between the N-terminal arms of CENP-A
molecules of different nucleosomes that are in close spatial vicinity.

Results
48
Figure 3.2.3: Acceptor bleaching in vivo lead to FRET between CENP-B-Cerulean/EYFP-CENP-A, Cerulean-CENP-A/EYFP-CENP-A and Cerulean-CENP-A/EYFP-H4.A. First column ”Confocal image”: LSM images of the analysed HEp-2 cells co-expressing the respective vectors after acceptor bleaching (overlay of DIC, Cerulean and EYFP-channel). Second column ”Intensity image”: intensity coded images with Cerulean and EYFP fluorescence before and after acceptor bleaching in the Cerulean and EYFP channel. Fluorescence intensities are encoded by colour ranging from low (blue) to high (red). The kinetochore inside the ROI (marked with a circle) was irradiated with the unattenuated Ar514 nm line (100fold iteration). This lead to a complete bleaching of the acceptor EYFP and an increase of donor fluorescence intensity which is indicative of FRET (see A – C). The analysed kinetochore is shown in the inserts at a magnified scale before and after bleaching in the Cerulean and EYFP channel. Identical image acquisitions were used to collect the prebleach and postbleach images. Third column ”Time course”: plot of the fluorescence intensities normalised to the highest fluorescence
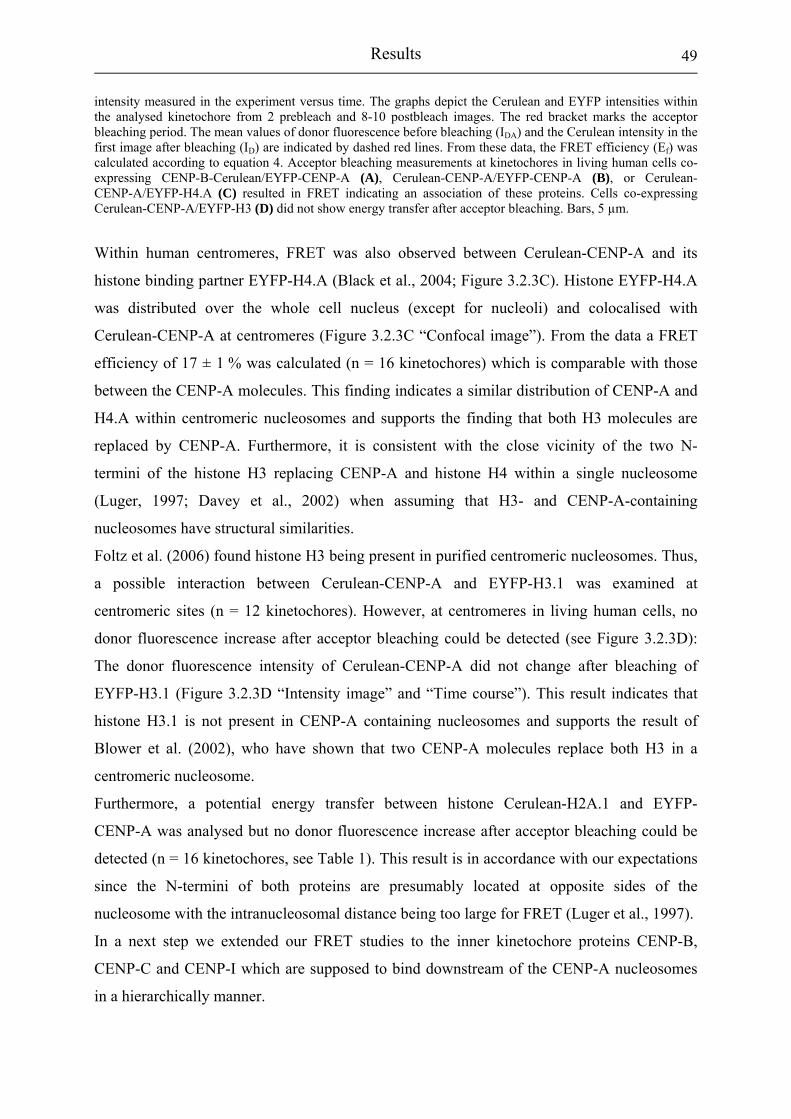
Results
49
intensity measured in the experiment versus time. The graphs depict the Cerulean and EYFP intensities within the analysed kinetochore from 2 prebleach and 8-10 postbleach images. The red bracket marks the acceptor bleaching period. The mean values of donor fluorescence before bleaching (IDA) and the Cerulean intensity in the first image after bleaching (ID) are indicated by dashed red lines. From these data, the FRET efficiency (Ef) was calculated according to equation 4. Acceptor bleaching measurements at kinetochores in living human cells co-expressing CENP-B-Cerulean/EYFP-CENP-A (A), Cerulean-CENP-A/EYFP-CENP-A (B), or Cerulean-CENP-A/EYFP-H4.A (C) resulted in FRET indicating an association of these proteins. Cells co-expressing Cerulean-CENP-A/EYFP-H3 (D) did not show energy transfer after acceptor bleaching. Bars, 5 µm.
Within human centromeres, FRET was also observed between Cerulean-CENP-A and its
histone binding partner EYFP-H4.A (Black et al., 2004; Figure 3.2.3C). Histone EYFP-H4.A
was distributed over the whole cell nucleus (except for nucleoli) and colocalised with
Cerulean-CENP-A at centromeres (Figure 3.2.3C “Confocal image”). From the data a FRET
efficiency of 17 ± 1 % was calculated (n = 16 kinetochores) which is comparable with those
between the CENP-A molecules. This finding indicates a similar distribution of CENP-A and
H4.A within centromeric nucleosomes and supports the finding that both H3 molecules are
replaced by CENP-A. Furthermore, it is consistent with the close vicinity of the two N-
termini of the histone H3 replacing CENP-A and histone H4 within a single nucleosome
(Luger, 1997; Davey et al., 2002) when assuming that H3- and CENP-A-containing
nucleosomes have structural similarities.
Foltz et al. (2006) found histone H3 being present in purified centromeric nucleosomes. Thus,
a possible interaction between Cerulean-CENP-A and EYFP-H3.1 was examined at
centromeric sites (n = 12 kinetochores). However, at centromeres in living human cells, no
donor fluorescence increase after acceptor bleaching could be detected (see Figure 3.2.3D):
The donor fluorescence intensity of Cerulean-CENP-A did not change after bleaching of
EYFP-H3.1 (Figure 3.2.3D “Intensity image” and “Time course”). This result indicates that
histone H3.1 is not present in CENP-A containing nucleosomes and supports the result of
Blower et al. (2002), who have shown that two CENP-A molecules replace both H3 in a
centromeric nucleosome.
Furthermore, a potential energy transfer between histone Cerulean-H2A.1 and EYFP-
CENP-A was analysed but no donor fluorescence increase after acceptor bleaching could be
detected (n = 16 kinetochores, see Table 1). This result is in accordance with our expectations
since the N-termini of both proteins are presumably located at opposite sides of the
nucleosome with the intranucleosomal distance being too large for FRET (Luger et al., 1997).
In a next step we extended our FRET studies to the inner kinetochore proteins CENP-B,
CENP-C and CENP-I which are supposed to bind downstream of the CENP-A nucleosomes
in a hierarchically manner.
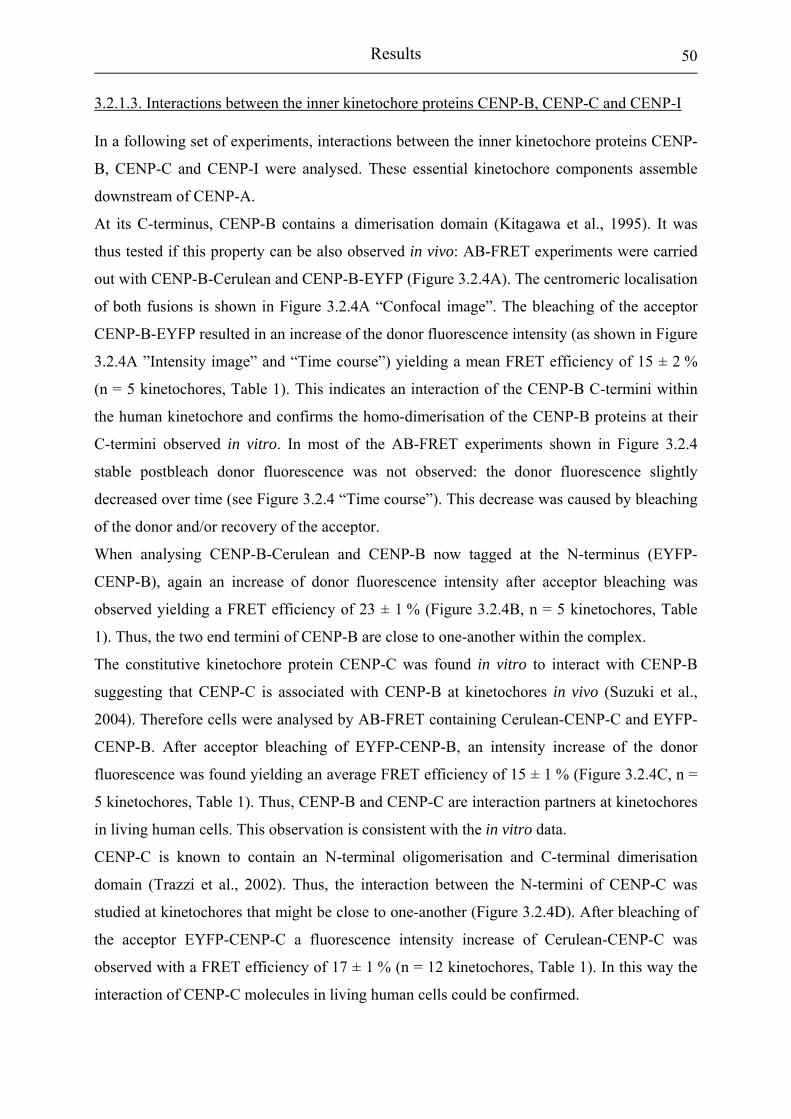
Results
50
3.2.1.3. Interactions between the inner kinetochore proteins CENP-B, CENP-C and CENP-I
In a following set of experiments, interactions between the inner kinetochore proteins CENP-
B, CENP-C and CENP-I were analysed. These essential kinetochore components assemble
downstream of CENP-A.
At its C-terminus, CENP-B contains a dimerisation domain (Kitagawa et al., 1995). It was
thus tested if this property can be also observed in vivo: AB-FRET experiments were carried
out with CENP-B-Cerulean and CENP-B-EYFP (Figure 3.2.4A). The centromeric localisation
of both fusions is shown in Figure 3.2.4A “Confocal image”. The bleaching of the acceptor
CENP-B-EYFP resulted in an increase of the donor fluorescence intensity (as shown in Figure
3.2.4A ”Intensity image” and “Time course”) yielding a mean FRET efficiency of 15 ± 2 %
(n = 5 kinetochores, Table 1). This indicates an interaction of the CENP-B C-termini within
the human kinetochore and confirms the homo-dimerisation of the CENP-B proteins at their
C-termini observed in vitro. In most of the AB-FRET experiments shown in Figure 3.2.4
stable postbleach donor fluorescence was not observed: the donor fluorescence slightly
decreased over time (see Figure 3.2.4 “Time course”). This decrease was caused by bleaching
of the donor and/or recovery of the acceptor.
When analysing CENP-B-Cerulean and CENP-B now tagged at the N-terminus (EYFP-
CENP-B), again an increase of donor fluorescence intensity after acceptor bleaching was
observed yielding a FRET efficiency of 23 ± 1 % (Figure 3.2.4B, n = 5 kinetochores, Table
1). Thus, the two end termini of CENP-B are close to one-another within the complex.
The constitutive kinetochore protein CENP-C was found in vitro to interact with CENP-B
suggesting that CENP-C is associated with CENP-B at kinetochores in vivo (Suzuki et al.,
2004). Therefore cells were analysed by AB-FRET containing Cerulean-CENP-C and EYFP-
CENP-B. After acceptor bleaching of EYFP-CENP-B, an intensity increase of the donor
fluorescence was found yielding an average FRET efficiency of 15 ± 1 % (Figure 3.2.4C, n =
5 kinetochores, Table 1). Thus, CENP-B and CENP-C are interaction partners at kinetochores
in living human cells. This observation is consistent with the in vitro data.
CENP-C is known to contain an N-terminal oligomerisation and C-terminal dimerisation
domain (Trazzi et al., 2002). Thus, the interaction between the N-termini of CENP-C was
studied at kinetochores that might be close to one-another (Figure 3.2.4D). After bleaching of
the acceptor EYFP-CENP-C a fluorescence intensity increase of Cerulean-CENP-C was
observed with a FRET efficiency of 17 ± 1 % (n = 12 kinetochores, Table 1). In this way the
interaction of CENP-C molecules in living human cells could be confirmed.

Results
51
Figure 3.2.4: Acceptor bleaching FRET measurements of the inner kinetochore proteins CENP-B, CENP-C and CENP-I in vivo. First column “Confocal image”: merge of DIC, Cerulean and EYFP channel, acquired after AB-FRET measurements. Second column “Intensity image”: colour-coded according to the rainbow scale with Cerulean (upper two images) and EYFP fluorescence intensities (lower two images) before (left) and after (right) acceptor bleaching. The analysed kinetochore inside the ROI (circle) is shown as an enlargement in the inserts. Third column ”Time course”: normalised fluorescence intensities of Cerulean (cyan line) and EYFP

Results
52
(green line) versus time. The time of bleaching is marked with a red clamp. IDA and ID are depicted as dashed red lines. After bleaching of the respective acceptor at a single kinetochore, we observed donor fluorescence increase and therefore energy transfer between CENP-B-Cerulean/CENP-B-EYFP (A), CENP-B-Cerulean/EYFP-CENP-B (B), Cerulean-CENP-C/EYFP-CENP-B (C), Cerulean-CENP-C/EYFP-CENP-C (D) and CENP-B-Cerulean/EYFP-CENP-I (E) indicating that these proteins interact with each other at human kinetochores. Bars, 5 µm
Further it was tested by AB-FRET if any interaction of CENP-I with the inner kinetochore
proteins CENP-B, and –C would be present. HEp-2 cells co-expressing CENP-B-Cerulean
and EYFP-CENP-I were analysed (Figure 3.2.4E). The colocalisation of both proteins at
human kinetochores is shown in Figure 3.2.4E ”Confocal image”. The donor fluorescence
intensity (CENP-B-Cerulean) increased when the acceptor EYFP-CENP-I was completely
bleached (Figure 3.2.4E ”Intensity image” and “Time course”). An energy transfer with an
efficiency of 13 ± 1 % (n = 12 kinetochores, Table 1) was observed. Therefore, it can be
concluded that CENP-I associates with CENP-B at human kinetochores.
When analysing energy transfer between the N-termini of CENP-C and CENP-I, an increase
of Cerulean-CENP-C fluorescence intensity after bleaching of EYFP-CENP-I could be
detected only in 2 cells (Table 1). Only very rare cells were co-transfected and the expression
levels of both proteins were quite low. However, both proteins may directly associate with
each other within the kinetochore supposed by findings that both human proteins were co-
purified with CENP-M in vitro (Foltz et al., 2006). On the other hand, Okada et al. (2006) did
not found CENP-A or CENP-C being present in CENP-I purified complexes in chicken
indicating an indirect protein association. An absence of FRET, however, does not mean that
the tagged molecules are not interacting. The relatively short working distance of FRET can
be a limitation for studying interactions between large proteins as CENP-C (107 kDa) and
CENP-I (83 kDa). Probably tagging the C-termini of CENP-C and –I would elucidate the
spatial position between both proteins within the kinetochore.
3.2.1.4. Analysis of H1.0 interactions at human centromeres
The centromere in humans is built on α-satellite DNA with a repeat length of 171 bp. Thus,
the inter-nucleosomal distance is rather short (25 bp) offering only a very limited space for
linker histone H1.0 and further chromatin binding proteins (like CENP-B and CENP-C).
Therefore, it is of essential importance if histone H1.0 is located within centromeric
chromatin. To get a more detailed insight into the structure of the human centromere, we
measured the presence of histone H1.0 by determining its direct spatial vicinity to inner
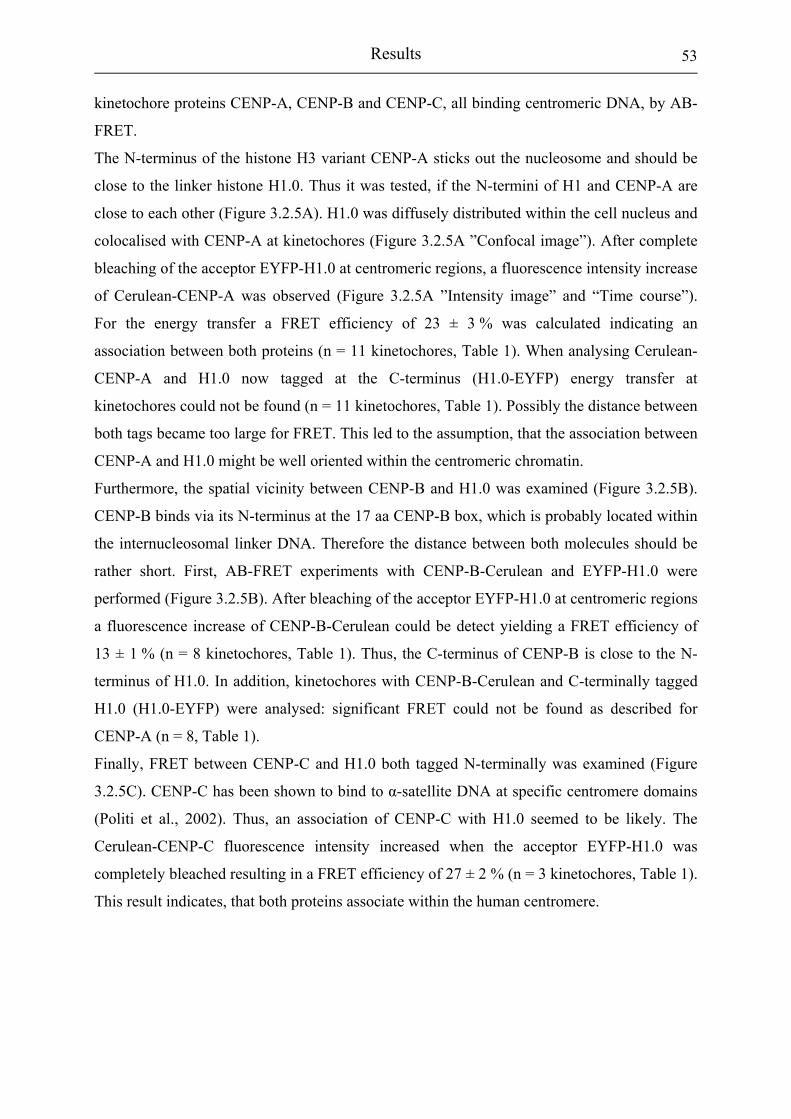
Results
53
kinetochore proteins CENP-A, CENP-B and CENP-C, all binding centromeric DNA, by AB-
FRET.
The N-terminus of the histone H3 variant CENP-A sticks out the nucleosome and should be
close to the linker histone H1.0. Thus it was tested, if the N-termini of H1 and CENP-A are
close to each other (Figure 3.2.5A). H1.0 was diffusely distributed within the cell nucleus and
colocalised with CENP-A at kinetochores (Figure 3.2.5A ”Confocal image”). After complete
bleaching of the acceptor EYFP-H1.0 at centromeric regions, a fluorescence intensity increase
of Cerulean-CENP-A was observed (Figure 3.2.5A ”Intensity image” and “Time course”).
For the energy transfer a FRET efficiency of 23 ± 3 % was calculated indicating an
association between both proteins (n = 11 kinetochores, Table 1). When analysing Cerulean-
CENP-A and H1.0 now tagged at the C-terminus (H1.0-EYFP) energy transfer at
kinetochores could not be found (n = 11 kinetochores, Table 1). Possibly the distance between
both tags became too large for FRET. This led to the assumption, that the association between
CENP-A and H1.0 might be well oriented within the centromeric chromatin.
Furthermore, the spatial vicinity between CENP-B and H1.0 was examined (Figure 3.2.5B).
CENP-B binds via its N-terminus at the 17 aa CENP-B box, which is probably located within
the internucleosomal linker DNA. Therefore the distance between both molecules should be
rather short. First, AB-FRET experiments with CENP-B-Cerulean and EYFP-H1.0 were
performed (Figure 3.2.5B). After bleaching of the acceptor EYFP-H1.0 at centromeric regions
a fluorescence increase of CENP-B-Cerulean could be detect yielding a FRET efficiency of
13 ± 1 % (n = 8 kinetochores, Table 1). Thus, the C-terminus of CENP-B is close to the N-
terminus of H1.0. In addition, kinetochores with CENP-B-Cerulean and C-terminally tagged
H1.0 (H1.0-EYFP) were analysed: significant FRET could not be found as described for
CENP-A (n = 8, Table 1).
Finally, FRET between CENP-C and H1.0 both tagged N-terminally was examined (Figure
3.2.5C). CENP-C has been shown to bind to α-satellite DNA at specific centromere domains
(Politi et al., 2002). Thus, an association of CENP-C with H1.0 seemed to be likely. The
Cerulean-CENP-C fluorescence intensity increased when the acceptor EYFP-H1.0 was
completely bleached resulting in a FRET efficiency of 27 ± 2 % (n = 3 kinetochores, Table 1).
This result indicates, that both proteins associate within the human centromere.
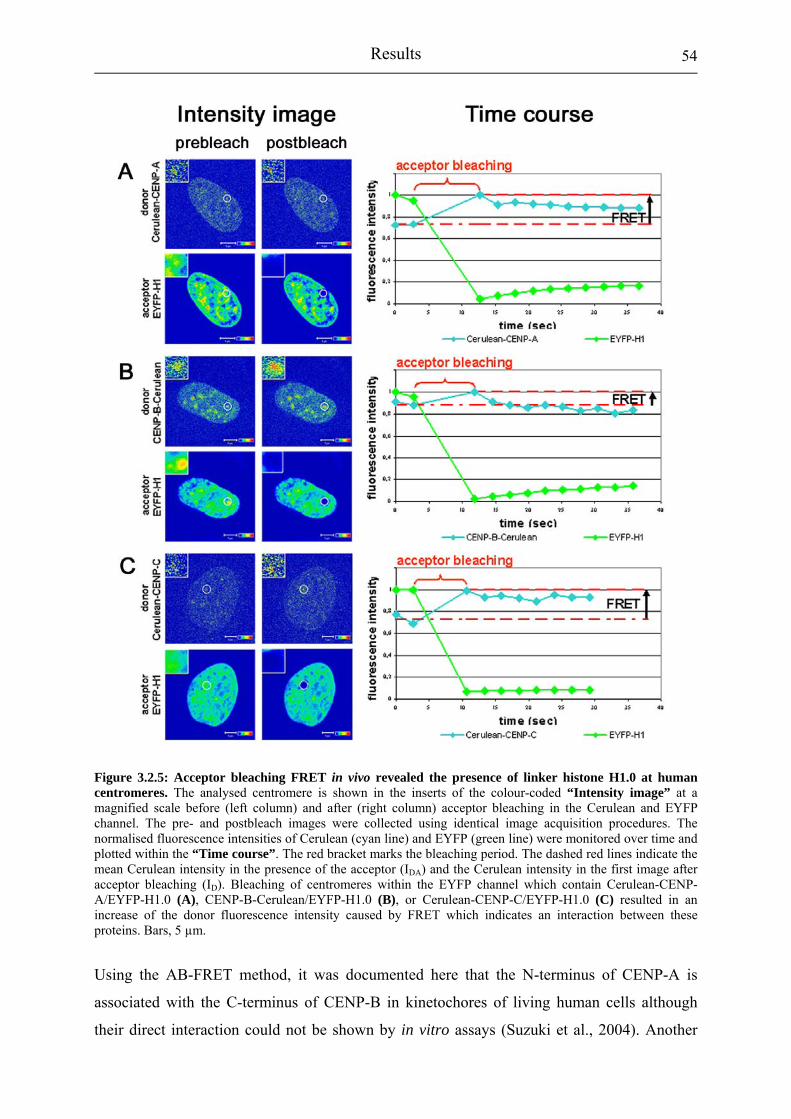
Results
54
Figure 3.2.5: Acceptor bleaching FRET in vivo revealed the presence of linker histone H1.0 at human centromeres. The analysed centromere is shown in the inserts of the colour-coded “Intensity image” at a magnified scale before (left column) and after (right column) acceptor bleaching in the Cerulean and EYFP channel. The pre- and postbleach images were collected using identical image acquisition procedures. The normalised fluorescence intensities of Cerulean (cyan line) and EYFP (green line) were monitored over time and plotted within the “Time course”. The red bracket marks the bleaching period. The dashed red lines indicate the mean Cerulean intensity in the presence of the acceptor (IDA) and the Cerulean intensity in the first image after acceptor bleaching (ID). Bleaching of centromeres within the EYFP channel which contain Cerulean-CENP-A/EYFP-H1.0 (A), CENP-B-Cerulean/EYFP-H1.0 (B), or Cerulean-CENP-C/EYFP-H1.0 (C) resulted in an increase of the donor fluorescence intensity caused by FRET which indicates an interaction between these proteins. Bars, 5 µm.
Using the AB-FRET method, it was documented here that the N-terminus of CENP-A is
associated with the C-terminus of CENP-B in kinetochores of living human cells although
their direct interaction could not be shown by in vitro assays (Suzuki et al., 2004). Another

Results
55
molecular link between CENP-A and the inner kinetochore proteins CENP-C and CENP-I
could not be detected. Furthermore, it was observed that the N-termini of CENP-A are close
to one another as well as to the N-terminus of histone H4. Furthermore the predicted
dimerisation of the CENP-B C-termini could be verified in vivo. Additionally, close vicinity
between different termini of CENP-B was observed. The dimerisation of CENP-C could be
confirmed in vivo when both molecules labelled at their N-termini suggesting a head-to-head
interaction, and an interaction between CENP-B and –C was found, both described in vitro
(Yeast two Hybrid). Finally, a so far unknown association between CENP-B and CENP-I at
human kinetochores was found. By identifying three possible interaction partners (CENP-A, -
B and –C) of H1.0 it could be shown, that linker histone H1.0 is present in centromeric
chromatin of human HEp-2 cells.
Using this AB-FRET approach, living cells with low expression levels of fusion proteins have
been examined. AB-FRET experiments however have the disadvantage that the measured
fluorescence intensities depend on the fluorophore concentrations. Therefore energy transfer
between the tagged proteins was further analysed by a second method, fluorescence lifetime
imaging (FLIM).
3.2.2 FLIM based FRET measurements
As opposed to fluorescence intensity measurements, fluorescence lifetime measurements have
the advantage that fluorescence lifetimes are independent of the actual concentration of donor
and acceptor fluorophores in the sample. Thus, the fluorescence lifetimes of the donor in the
presence and in the absence of the acceptor can be determined in different experiments. For a
reliable FLIM analysis, however, higher numbers of photons are required compared to AB-
FRET and, therefore, cells with a higher expression level had to be used. The FLIM
measurements were performed in cooperation with C. Biskup and B. Hoffmann (Institute of
Physiology, FSU Jena).
3.2.2.1. Controls
As control measurements the fluorescence lifetime of Cerulean was determined in living
HEp-2 cells expressing Cerulean alone (Figure 3.2.6A) or fused to either CENP-A (Cerulean-
CENP-A, Figure 3.2.6B) or CENP-B (CENP-B-Cerulean, Figure 3.2.6C). The left panels
(“Confocal image”) display the diffuse distribution of unfused Cerulean (Figure 3.2.6A) or
the centromere localisation of Cerulean-CENP-A (Figure 3.2.6B) and CENP-B-Cerulean

Results
56
(Figure 3.2.6C) seen as dot-like structures in the nucleus. In cells expressing Cerulean,
Cerulean-CENP-A or CENP-B-Cerulean, the fluorescence decay could be well approximated
by a monoexponential function, yielding an average fluorescence lifetime of cellmτ = 2.63 ±
0.02 ns (mean ± s.e.m., n = 8 cells), cellmτ = 2.49 ± 0.03 ns (n = 20 cells) and cell
mτ = 2.42 ±
0.02 ns (n = 15 cells), respectively (see “Fluorescence decay” of Figure 3.2.6, here
fluorescence decays at a representative spot of the presented cell, but not mean values are
shown). These lifetimes are shorter than the lifetime of the isolated Cerulean protein in Tris-
EDTA buffer (pH 8.0), which was determined to be 3.3. ns (Rizzo et al. 2004). A reason for
this difference might be a delayed maturation or an inefficient folding upon expression in
mammalian cells at 37 °C as discussed for other fluorescent proteins (Shaner et al., 2005).
Alternatively, the lifetime might be influenced by the local environment and the local
refractive index (Suhling et al., 2002; Treanor, 2005). Differences in the refractive index
could also explain the longer lifetime of unfused Cerulean diffusely distributed in the cytosol,
compared to Cerulean fused to kinetochore proteins localized in the nucleus. Furthermore,
due to the dimerisation of CENP-A and CENP-B, respectively, homotranfer between resulting
Cerulean dimers would contribute to the slightly shortened lifetimes.
In these control experiments, the fluorescence lifetime at different locations within a cell did
not vary. This is illustrated in Figure 3.2.6 by the colour coded fluorescence “Lifetime
images”, where average fluorescence lifetimes observed in one pixel are encoded by colour:
red and blue colours represent short (1.0 ns) and long lifetimes (3.0 ns), respectively;
intermediate lifetimes are encoded as specified by the colours assigned to the x-scale of the
Figure 3.2.6 “Lifetime distributions”. In these lifetime distributions the (intensity weighted)
frequency of the Cerulean lifetimes τm,i in all pixels i within the lifetime image was plotted.
The lifetime distributions of the control experiments exhibit only one narrow peak indicating
a low donor lifetime variation. As opposed to ECFP (Biskup et al. 2004b), Cerulean lifetimes
did not shorten upon prolonged excitation: the fluorescence decay remained almost mono-
exponential. These features make Cerulean a better suited tag for FRET experiments than
ECFP. The respective lifetimes determined in these control experiments served also to
calculate FRET efficiencies according to equation 5. A measured lifetime was considered to
be significantly shorter, when it was by more than 3 standard deviations lower than the
respective control values (see Materials and Methods, Equation 8). In the case of Cerulean-
CENP-A and CENP-B-Cerulean the threshold was calculated to be 2.2 ns. Thus only lifetimes
< 2.2 ns were attributed to FRET.

Results
57
Figure 3.2.6: FLIM controls. Fluorescence lifetime imaging of cells (co-)expressing Cerulean and Cerulean-EYFP fusion constructs. First column “Confocal image”: overlay of the confocal images recorded in the Cerulean- and EYFP-channel. Representative “Fluorescence decay” (second column): normalised fluorescence decay curves of Cerulean recorded in one pixel marked by an arrow in the confocal image. Donor fluorescence “Lifetime image” (third column): average fluorescence lifetimes measured in each pixel are encoded by colour as indicated by the x-axis of the lifetime distribution plot. Thus, red colours represent short lifetimes (1.0 ns) and blue colours represent long lifetimes (3.0 ns). Last column ”Lifetime distribution”: subcellular distribution of the measured fluorescence lifetimes. (A) HEp-2 cell expressing Cerulean. The fluorescence decay at the indicated spot could be approximated by a monoexponential function yielding a fluorescence lifetime of 2.72 ns. The variation of the fluorescence lifetime within the cell was small as indicated by the lifetime image and the lifetime distribution. The peak of the lifetime distribution was located at 2.7 ns. (B) HEp-2 cell expressing Cerulean-CENP-A or (C) CENP-B-Cerulean. The fluorescence lifetimes were 2.46 ns in both cases and showed only small heterogeneities as for cytosolically expressed Cerulean. They were slightly (0.26 ns) shorter than the fluorescence lifetime of unfused Cerulean. (D) HEp-2 cell co-expressing Cerulean and EYFP does not show any decrease of donor fluorescence lifetime. The monoexponential fitted fluorescence decay constituted 2.68 ns being close to control. Thus, unspecific FRET between Cerulean and EYFP that might have been caused by diffusion or aggregation of the fluorophores was negligible. (E) Hek293 cell expressing a EYFP-Cerulean hybrid protein, in which Cerulean and YFP are closely linked together by a short 10 aa peptide. The fluorescence lifetime of Cerulean decreased considerably down to 2.07 ns due to FRET between the Cerulean and YFP moiety.
Results
58
As a further control, unfused Cerulean and EYFP, co-transfected in living human cells (Figure
3.2.6D) were studied to detect any potential change of the Cerulean lifetime due to unspecific
FRET that might have been caused by random diffusion or direct interaction of the
fluorescent tags. Upon co-expression, both fluorophores distributed homogenously throughout
the cytoplasm (Figure 3.2.6D “Confocal image”). The mean Cerulean lifetime obtained by a
mono-exponential fit of the fluorescence decay yielded cellmτ = 2.59 ± 0.02 ns (n = 6 cells) and
is similar to control values of cytosolically expressed Cerulean (Figure 3.2.6A). This
measurement is in accordance with results from the AB-FRET approach (see Figure 3.2.2)
and allows us to exclude the presence of unspecific FRET at expression levels observed in
this study.
In order to assess FRET efficiency between closely neighboured Cerulean and EYFP, as a
positive control, an EYFP–Cerulean hybrid was expressed in human cells with both
fluorescent proteins closely linked by a short sequence of 10 amino acids. As visible from the
confocal image (Figure 3.2.6E), the hybrid protein was homogenously distributed over the
entire Hek293 cell. The mean fluorescence lifetime of Cerulean was significantly decreased to cellmτ = 1.89 ± 0.03 ns (n = 5 cells), indicating that FRET occurs between the two fluorophores.
By applying equation (5), a FRET efficiency of 28 % was calculated from these data. As
indicated by the homogeneous green colour in the Figure 3.2.6E “Lifetime image” and the
narrow peak in the Figure 3.2.6E “Lifetime distribution”, variations in the fluorescence
lifetime throughout the cell were low which is in agreement with our expectation, since only
one species of donor molecules existed.
3.2.2.2. Interaction studies with the inner kinetochore protein CENP-A
Using the FLIM approach in the same manner as described above, potential interaction
partners of CENP-A should be identified within the interface between centromere and inner
kinetochore.
When CENP-B-Cerulean and EYFP-CENP-A were co-expressed in HEp-2 cells, they
colocalised in all kinetochores of the nucleus (green arrow in Figure 3.2.7A “Confocal
image”). In these regions, the fluorescence lifetime of the Cerulean tag was considerably
shortened (green curve in Figure 3.2.7A “Fluorescence decay”). Since the controls (see
above) have shown that (unfused) EYFP did not influence the lifetimes of (unfused) Cerulean
when both proteins are co-expressed in HEp-2 cells, this decrease of the fluorescence lifetime

Results
59
in nuclear regions can be attributed to a specific (direct or indirect) interaction between the
proteins.
In these data, the fluorescence decay could no longer be approximated by a mono-exponential
function, but had to be fitted by a bi-exponential function (see fit quality, Materials and
Methods) yielding the mean fast and slow lifetime components = 0.60 ns and =
2.45 ns with the relative amplitudes = 44 % and = 56 %. From these values, an
average fluorescence lifetime of = 1.64 ns was calculated by applying equation (5). The
slow lifetime component was close to the lifetime measured in HEp-2 cells expressing
CENP-B-Cerulean alone. It can be attributed to unassociated CENP-B-Cerulean molecules,
whereas the fast donor lifetime arose from associated CENP-B-Cerulean molecules,
whose lifetime is quenched due to FRET to one or more acceptor molecules in its vicinity.
From the short lifetime component, a FRET efficiency of 70 % could be calculated, which
might seem astonishingly high. This value is much higher than the calculated FRET
efficiency of 28% for the EYFP-Cerulean hybrid protein (see above). Such a high FRET
efficiency could have been caused by the presence of several acceptor molecules in the
vicinity of one donor molecule.
centrfτ centr
sτ
centrfA centr
sA
centrmτ
centrsτ
centrfτ
In the cell shown in Figure 3.2.7A, CENP-B-Cerulean was slightly over-expressed so that it
was not only localised inside the nucleus but showed also a faint, diffuse distribution in the
cytosol (blue arrow in Figure 3.2.7A “Confocal image”). In the cytosol, the lifetime of the
Cerulean tag was close to control values (τm = 2.43 ns, blue curve in Figure 3.2.7A
“Fluorescence decay”) indicating that FRET between CENP-B-Cerulean and EYFP-CENP-A
did not occur at this site. This finding provides an additional internal control for the lifetime
measurements and confirms that the interaction of CENP-B-Cerulean and EYFP-CENP-A
within the kinetochore is specific: In the cytosol, CENP-B-Cerulean is not associated with
EYFP-CENP-A, so that its lifetime is not quenched. This cytosolic portion of CENP-B-
Cerulean molecules gives rise to the second peak at about 2.4 ns in Figure 3.2.7A “Lifetime
distribution”.
In the example shown in Figure 3.2.7A, fluorescence lifetimes measured in most kinetochores
are similar, as indicated by the same colour in the “Lifetime image”. Thus, FRET efficiency
and the degree of association are almost equal. However, such an uniform distribution of
fluorescence lifetimes was not observed in all cells. Sometimes, kinetochores showed a
distribution of lifetimes indicating a different degree of association between CENP-A and
CENP-B from kinetochore to kinetochore within a single nucleus.

Results
60
Results
61
Figure 3.2.7: Confocal micrographs and fluorescence lifetime measurements of single HEp-2 cells co-expressing Cerulean and EYFP fusion proteins. The first column “Confocal image” shows an overlay of the confocal micrographs obtained in the Cerulean and YFP channel. Cerulean fluorescence was excited with the Ar 458 nm line and recorded with a 470-500 nm bandpass filter. EYFP fluorescence was excited with the Ar 514 nm line and recorded with a 530 nm longpass filter. The second column ”Fluorescence decay” displays the normalized fluorescence decay curves of Cerulean measured in one pixel located within one kinetochore (see arrow in confocal image). In all cases the fluorescence decay could be approximated by a monoexponential fit yielding a lifetime shown in the text. The third column ”Lifetime image” shows donor fluorescence lifetimes measured in each pixel that are encoded by colour according to the scale shown in the lifetime distribution plot. The last column ”Lifetime distribution” presents the fluorescence lifetime distribution over the entire cell. The Cerulean lifetime is colour coded with longer fluorescence lifetimes towards blue. (A) HEp-2 cell co-expressing CENP-B-Cerulean and EYFP-CENP-A. We determined fluorescence decay curves of CENP-B-Cerulean measured in the cytosol (marked with a blue arrow) and at a kinetochore (green arrow), respectively. In the cytosol (spot 1) the fluorescence decay (blue) could be approximated by a monoexponential fit yielding a lifetime of 2.43 ns. The lifetime is close to control values indicating that CENP-B and CENP-A do not associate in thee cytosol. In the kinetochore (spot 2) the fluorescence decay was considerably accelerated. The bi-exponential fit yielded 1.64 ns indicating efficient FRET between CENP-B-Cerulean and EYFP-CENP-A. The main peak of the distribution function located at 2.5 ns represents the large fraction of unassociated CENP-B-Cerulean donor molecules in the cytosol due to overexpression. The second peak at 1.4 ns represents the fraction of associated CENP-B-Cerulean molecules at the kinetochores. Short donor fluorescence lifetimes can be found at the kinetochores as shown by the fluorescence lifetime images. (B) Switching of the protein tags lead to a decreased energy transfer efficiency. In HEp-2 cells co-transfected with Cerulean-CENP-A and CENP-B-EYFP, a donor lifetime of 1.84 ns was determined. (C) Only in a small fraction of kinetochores an association between the N-termini of CENP-A and CENP-B was found. In HEp-2 cells expressing both Cerulean-CENP-A and EYFP-CENP-B, a slight but not significant decrease of donor lifetime (2.33 ns) was observed at the marked kinetochore. The lifetime distribution plot showed a broader variation of the donor fluorescence lifetimes within the cell. (D) In cells co-expressing Cerulean-CENP-A and EYFP-CENP-C no energy transfer could be detected. The donor fluorescence lifetime is close to control (2.31 ns). (E) The N-termini of CENP-A were close to one another as indicated by the peak in the lifetime distribution plot that is shifted towards shorter lifetimes. A decreased donor fluorescence lifetime of 2.23 ns was found in the centromere of cells containing both Cerulean-CENP-A and EYFP-CENP-A, as shown by the fluorescence lifetime image. (F) CENP-A interacted with its histone binding partner H4 at centromeres. In HEp-2 cells co-expressing Cerulean-CENP-A and EYFP-H4 the donor lifetime decreased to 1.97 ns. In HEp-2 cells co-transfected with (G) Cerulean-CENP-A and EYFP-H3 or (H) Cerulean-H2A and EYFP-CENP-A no FRET was observed. The donor lifetime within the whole nucleus was close to controls. The data from one experiment are each displayed.
This heterogeneity is also reflected by the histogram of the lifetimes obtained from all
kinetochores evaluated in this study (Figure 3.2.8A). Many single kinetochores were
identified in Figure 3.2.7-3 “Lifetime image” in a number of cells (number of kinetochores
and cells are given in the text). In Figure 3.2.8, the particular lifetimes (obtained from mono-
and bi-exponential fits) of these single kinetochores were pooled in 0.1 ns steps and plotted
for the lifetime range 1.0 to 3.0 ns. While the “Lifetime distributions” in Figure 3.2.6, 3.2.7,
3.2.9 and - 3.2.10 represent the distribution of lifetimes determined for every single pixel of
the whole image (where beside the kinetochores also the rest of the cell is included), the
lifetime histograms of Figure 3.2.8 represent the more meaningful mean lifetime values of
only the kinetochores.

Results
62
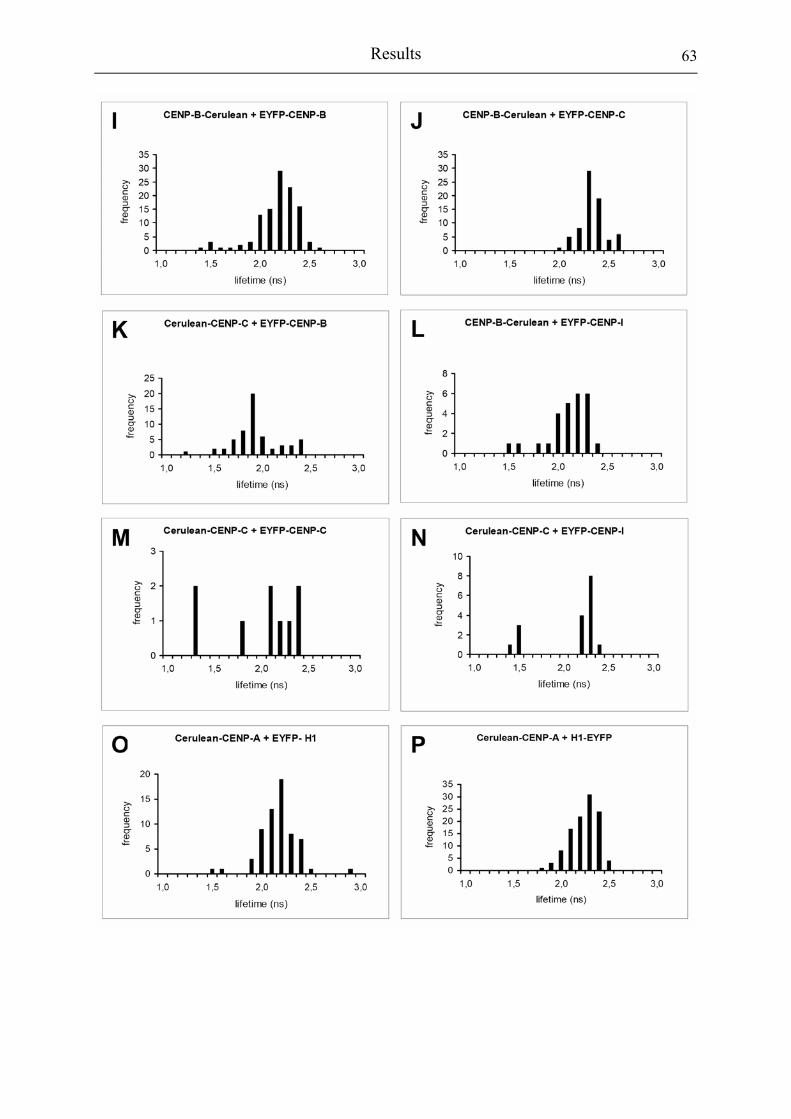
Results
63

Results
64
Figure 3.2.8: Lifetime histogram of all kinetochores evaluated in this study. The histogram plots visualize the distribution of the mean lifetimes obtained for all kinetochores evaluated for a series of co-expression experiments. The heights of the bars represent the numbers of kinetochores (x-axis) whose mean lifetime falls within the indicated 0.1 ns range (y-axis). Co-expression of (A) CENP-B-Cerulean, EYFP-CENP-A, (B) Cerulean-CENP-A, CENP-B-EYFP, (C) Cerulean-CENP-A, EYFP-CENP-B, (D) Cerulean-CENP-A, EYFP-CENP-C, (E) Cerulean-CENP-A, EYFP-CENP-A, (F) Cerulean-CENP-A, EYFP-H3.1, (G) Cerulean-CENP-A, EYFP-H4.A, (H) CENP-B-Cerulean, CENP-B-EYFP, (I) CENP-B-Cerulean, EYFP-CENP-B, (J) CENP-B-Cerulean, EYFP-CENP-C, (K) Cerulean-CENP-C, EYFP-CENP-B, (L) CENP-B-Cerulean, EYFP-CENP-I, (M) Cerulean-CENP-C, EYFP-CENP-C, (N) Cerulean-CENP-C, EYFP-CENP-I, (O) Cerulean-CENP-A, EYFP-H1.0, (P) Cerulean-CENP-A, H1.0-EYFP, (Q) CENP-B-Cerulean, EYFP-H1.0, (R) CENP-B-Cerulean, H1.0-EYFP or (S) Cerulean-CENP-C, EYFP-H1.0.
In cells expressing CENP-B-Cerulean and EYFP-CENP-A, lifetimes from 2.57 ns (which are
close to the control values) decreasing to 0.81 ns at different kinetochores were measured. At
about 36 % of all kinetochores (n = 97 kinetochores in 13 cells) lifetimes < 2.2 ns indicative
of FRET were measured. This heterogeneity can be due to variations in the distance and the
stoichiometry between donor and acceptor molecules: Centromeres and their α-satellite
sequence frames differ slightly from chromosome to chromosome. Moreover, the ratio of
CENP-B-Cerulean to EYFP-CENP-A molecules might change during the cell cycle. Further
experiments will be necessary to trace the protein interactions at single kinetochores during
the cell cycle.
As observed for AB-FRET, co-expressing fusion proteins with swapped tags (i.e. Cerulean-
CENP-A and CENP-B-EYFP) yielded different results. In the example shown in Figure
3.2.7B the donor lifetime decreased only to τm = 1.84 ns at the indicated kinetochore. In 243

Results
65
kinetochores of 37 cells, lifetimes varied from 1.33 ns to 2.62 ns with an average donor
lifetime centrmτ = 2.33 ± 0.08 ns. The lifetime histogram (Figure 3.2.8B) shows that at most
kinetochores the Cerulean lifetime is close to control values. In only 60 kinetochores (i.e.
25 % of all kinetochores) energy transfer could be detected. At the first sight, these results
might seem unexpected: exchanging the tags of proteins should not influence the extent of
FRET for a given donor-acceptor pair and lead to similar transfer efficiencies. However, this
only holds for a symmetric stoichiometry. In the case, that one CENP-B molecule is
surrounded by a surplus of CENP-A molecules, more acceptors quench the fluorescence of
the Cerulean tag when Cerulean is fused to CENP-B and EYFP is fused to CENP-A. In this
case swapping the tags would invert the donor to acceptor ratio and quenching would be
strongly reduced. In principle, the exact stoichiometry can be estimated from the ratio of the
energy transfer rate constants kt (see equation 1) obtained in both experiments. However,
variations in (i) the distance between the kinetochore proteins and (ii) the number of
unlabeled endogenous proteins in the kinetochore complex make it difficult to compare the
rate constants. Only in kinetochores with the shortest observed lifetime, it can be assumed that
the highest possible number of labelled acceptor molecules is incorporated and that distances
between the tags are minimal. The calculated FRET rate constant kt for the fastest
fluorescence lifetime observed upon co-expression of CENP-B-Cerulean and EYFP-CENP-A
( centrmτ = 0.81 ns) is approximately 2,6 times higher than the respective rate constant obtained
from experiments with cells co-expressing Cerulean-CENP-A and CENP-B-EYFP ( centrmτ =
1.33 ns). This result indicates that one CENP-B molecule is in close vicinity of at least three
CENP-A molecules.
In Figure 3.2.7A and B FRET was measured between tags at the N-terminus of CENP-A and
the C-terminus of CENP-B. To assess the impact of the localisation of the tag on the extent of
energy transfer, FRET between the tags at the N-termini of both, CENP-A and CENP-B was
studied (Figure 3.2.7C). Cerulean-CENP-A and EYFP-CENP-B colocalised at human
centromeres (Figure 3.2.7C “Confocal image”). In 76 kinetochores of 8 cells lifetimes varied
from 1.51 ns to 2.54 ns yielding an average donor lifetime of centrmτ = 2.26 ± 0.03 ns. The
lifetime histogram (Figure 3.2.8C) shows that at most kinetochores the Cerulean lifetime was
close to control values. In only 10 kinetochores (13 %) energy transfer could be detected.
Furthermore, co-expressed Cerulean-CENP-A and EYFP-CENP-C were analysed (Figure
3.2.7D). Here, both proteins showed a slightly diffuse distribution not only restricted to
kinetochores but also within the nucleus probably caused by the higher expression level

Results
66
necessary for FLIM measurements (Figure 3.2.7D “Confocal image”). The fluorescence
lifetime measured at the marked kinetochore was = 2.31 ns. Even within the whole
nucleus we found the same fluorescence decay times being close to controls. The “Lifetime
image” and the narrow peak in ”Lifetime distribution” in Figure 3.2.7D indicate a low
variation in the donor lifetime. This is affirmed by the lifetime histogram (Figure 3.2.8D): the
lifetimes differed only slightly from 2.2 ns to 2.6 ns and no kinetochore showed a significant
decrease of fluorescence lifetime which was averaged to
centrmτ
centrmτ = 2.31 ± 0.02 ns. As in AB-
FRET measurements, any energy transfer could not be detected suggesting that CENP-A and
CENP-C are not interacting in vivo.
In a next step, the energy transfer between two differently labelled CENP-A molecules tagged
with either Cerulean or EYFP at their N-termini (Figure 3.2.7E) was analysed. Both CENP-A
molecules are supposed to replace histone H3 within one nucleosome (Blower et al., 2002)
and should be close to each other. The “Confocal image” shows the co-localisation of
Cerulean-CENP-A and EYFP-CENP-A at the centromeres. In these regions the fluorescence
lifetime of Cerulean was slightly shortened to centrmτ = 2.23 ns (Figure 3.2.7E “Fluorescence
decay”) and all kinetochores showed the same decrease in fluorescence decay times. In total,
fluorescence lifetimes varied from 1.42 ns to 2.55 ns with an average fluorescence lifetime of centrmτ = 2.16 ± 0.03 ns (n = 93 kinetochores in 12 cells). 33 % of all kinetochores showed
lifetimes smaller than 2.2 ns indicating FRET. This finding is in line with the AB-FRET
measurements (see above). Interestingly, the histogram of lifetimes measured in all
experiments showed two peaks (Figure 14E), one centred at 1.7 ns the other at 2.2 ns. This
result can easily be explained by the expected presence of different combinations of CENP-A
in the centromeric nucleosomes: A strong FRET efficiency between Cerulean-CENP-A and
EYFP-CENP-A is expected when both proteins are incorporated into the same centromeric
nucleosome. This fraction of CENP-A molecules would strongly contribute to the peak
centred at 1.7 ns (corresponding to a FRET efficiency of 14 %). If, however, the second
CENP-A molecule that is incorporated into the centromeric nucleosome, is not labelled with
EYFP but instead with Cerulean (as the first) or unlabelled (i.e. endogenous CENP-A), then
only FRET to more distant CENP-A molecules within the centromeric chromatin but not
within the same centromeric nucleosome is possible. Due to the larger distance assumed for
this case, the FRET efficiency is expected to be considerably decreased. This fraction of
centromeric nucleosomes could give rise to the second peak in the lifetime histogram, which
is close to control values.

Results
67
HEp-2 cells co-transfected with Cerulean CENP-A and EYFP-H3.1, did not exhibit a
significant decrease in fluorescence lifetime (Figure 3.2.7F). Cerulean lifetimes ranging from
1.88 ns to 2.56 ns with an average of centrmτ = 2.28 ± 0.01 ns (n = 69 kinetochores in 10 cells)
were measured, which is close to control values. The lifetime histogram (Figure 3.2.8F)
displays a single distribution around 2.3 ns with only one value measured below 2.2 ns. This
result is consistent with our AB-FRET measurements and can be explained by the fact that
histone H3.1 is completely (Blower et al., 2002) or at least to a large extend (Foltz et al.,
2006) replaced by CENP-A in single centromeric nucleosomes.
Furthermore, human cells co-expressing Cerulean-CENP-A and histone EYFP-H4.A were
examined (Figure 3.2.7G). EYFP-H4.A was distributed over the entire cell nucleus whereas
Cerulean-CENP-A localised at centromeres (Figure 3.2.7G “Confocal image”). In the
example shown, the lifetime at the marked kinetochore was decreased to = 1.97 ns.
Cerulean lifetimes varied from 1.65 ns to 2.40 ns with an average of
centrmτ
centrmτ = 2.18 ± 0.02 ns
(n = 86 kinetochores in 11 cells, Figure 3.2.8G) corresponding to a FRET efficiency of 13 %.
Thus, co-expression of Cerulean-CENP-A and EYFP-H4.A yielded functional kinetochores in
which the labelled N-terminus of CENP-A is in close vicinity to the N-terminus of histone
H4.A making FRET between the fluorescence tags possible. The second peak at longer
lifetimes in Figure 3.2.8G arose from the same situation as described for CENP-A (see
above). It results from centromeric nucleosomes, where most of Cerulean-CENP-A is
incorporated together with endogenous H4 instead of EYFP-H4.A. Therefore, in these
centromeres, the donor lifetime is close to control and no energy transfer could be detected.
In cells co-expressing EYFP-CENP-A and Cerulean-H2A.1, Cerulean lifetimes did not differ
significantly from the control values (Figure 3.2.7H). The average lifetime, obtained by a
mono-exponential fit, was centrmτ = 2.38 ± 0.04 ns (n = 7 cells) suggesting that no significant
energy transfer occurred between the two fluorophores. This result is in accordance with our
AB-FRET measurements (see above) and is supposed to be due to the large distance between
the N-termini of CENP-A (similar to H3) and H2A in the nucleosome (Luger et al., 1997).
3.2.2.3. Interactions between the inner kinetochore proteins CENP-B, CENP-C and CENP-I
To obtain more information about the inner kinetochore architecture, the protein interaction
network downstream of CENP-A was analysed.
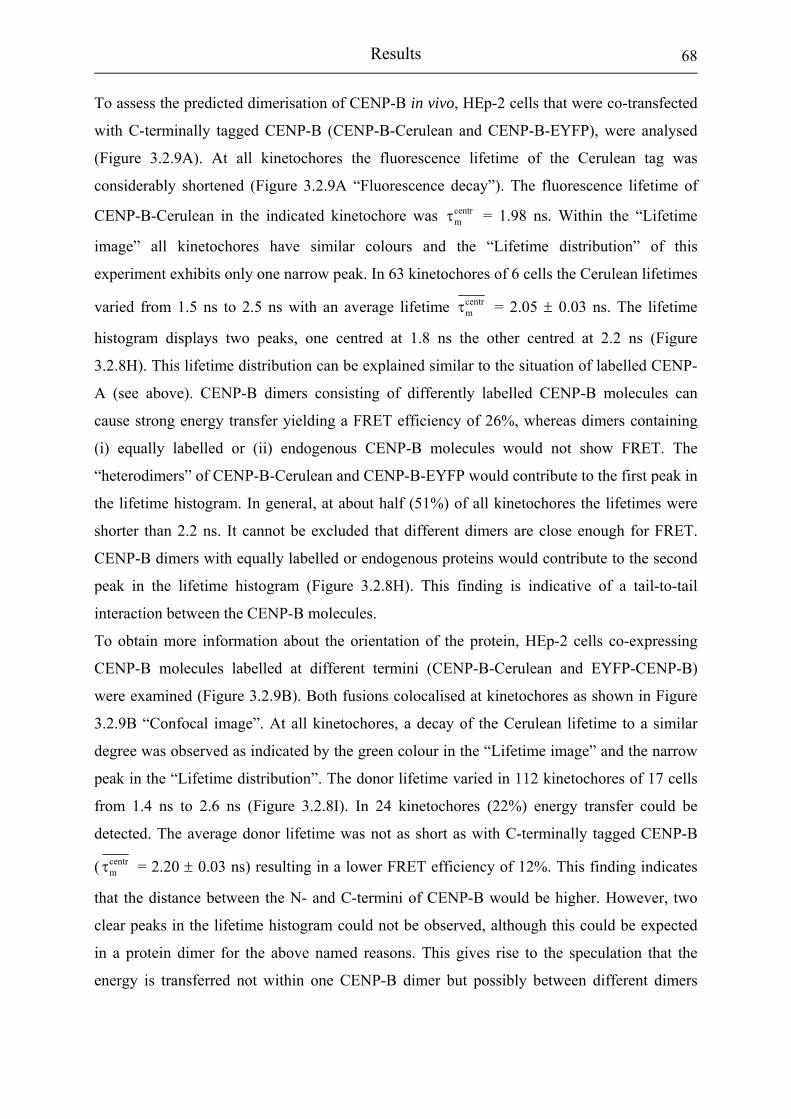
Results
68
To assess the predicted dimerisation of CENP-B in vivo, HEp-2 cells that were co-transfected
with C-terminally tagged CENP-B (CENP-B-Cerulean and CENP-B-EYFP), were analysed
(Figure 3.2.9A). At all kinetochores the fluorescence lifetime of the Cerulean tag was
considerably shortened (Figure 3.2.9A “Fluorescence decay”). The fluorescence lifetime of
CENP-B-Cerulean in the indicated kinetochore was = 1.98 ns. Within the “Lifetime
image” all kinetochores have similar colours and the “Lifetime distribution” of this
experiment exhibits only one narrow peak. In 63 kinetochores of 6 cells the Cerulean lifetimes
varied from 1.5 ns to 2.5 ns with an average lifetime
centrmτ
centrmτ = 2.05 ± 0.03 ns. The lifetime
histogram displays two peaks, one centred at 1.8 ns the other centred at 2.2 ns (Figure
3.2.8H). This lifetime distribution can be explained similar to the situation of labelled CENP-
A (see above). CENP-B dimers consisting of differently labelled CENP-B molecules can
cause strong energy transfer yielding a FRET efficiency of 26%, whereas dimers containing
(i) equally labelled or (ii) endogenous CENP-B molecules would not show FRET. The
“heterodimers” of CENP-B-Cerulean and CENP-B-EYFP would contribute to the first peak in
the lifetime histogram. In general, at about half (51%) of all kinetochores the lifetimes were
shorter than 2.2 ns. It cannot be excluded that different dimers are close enough for FRET.
CENP-B dimers with equally labelled or endogenous proteins would contribute to the second
peak in the lifetime histogram (Figure 3.2.8H). This finding is indicative of a tail-to-tail
interaction between the CENP-B molecules.
To obtain more information about the orientation of the protein, HEp-2 cells co-expressing
CENP-B molecules labelled at different termini (CENP-B-Cerulean and EYFP-CENP-B)
were examined (Figure 3.2.9B). Both fusions colocalised at kinetochores as shown in Figure
3.2.9B “Confocal image”. At all kinetochores, a decay of the Cerulean lifetime to a similar
degree was observed as indicated by the green colour in the “Lifetime image” and the narrow
peak in the “Lifetime distribution”. The donor lifetime varied in 112 kinetochores of 17 cells
from 1.4 ns to 2.6 ns (Figure 3.2.8I). In 24 kinetochores (22%) energy transfer could be
detected. The average donor lifetime was not as short as with C-terminally tagged CENP-B
( centrmτ = 2.20 ± 0.03 ns) resulting in a lower FRET efficiency of 12%. This finding indicates
that the distance between the N- and C-termini of CENP-B would be higher. However, two
clear peaks in the lifetime histogram could not be observed, although this could be expected
in a protein dimer for the above named reasons. This gives rise to the speculation that the
energy is transferred not within one CENP-B dimer but possibly between different dimers
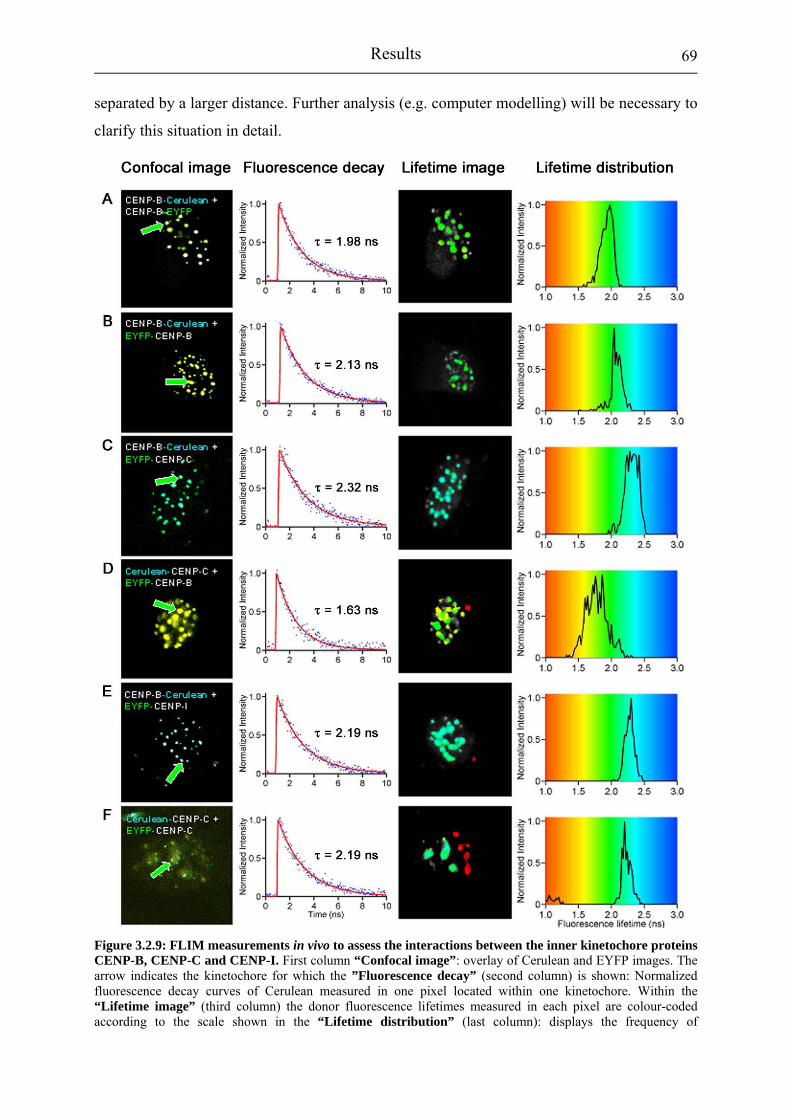
Results
69
separated by a larger distance. Further analysis (e.g. computer modelling) will be necessary to
clarify this situation in detail.
Figure 3.2.9: FLIM measurements in vivo to assess the interactions between the inner kinetochore proteins CENP-B, CENP-C and CENP-I. First column “Confocal image”: overlay of Cerulean and EYFP images. The arrow indicates the kinetochore for which the ”Fluorescence decay” (second column) is shown: Normalized fluorescence decay curves of Cerulean measured in one pixel located within one kinetochore. Within the “Lifetime image” (third column) the donor fluorescence lifetimes measured in each pixel are colour-coded according to the scale shown in the “Lifetime distribution” (last column): displays the frequency of
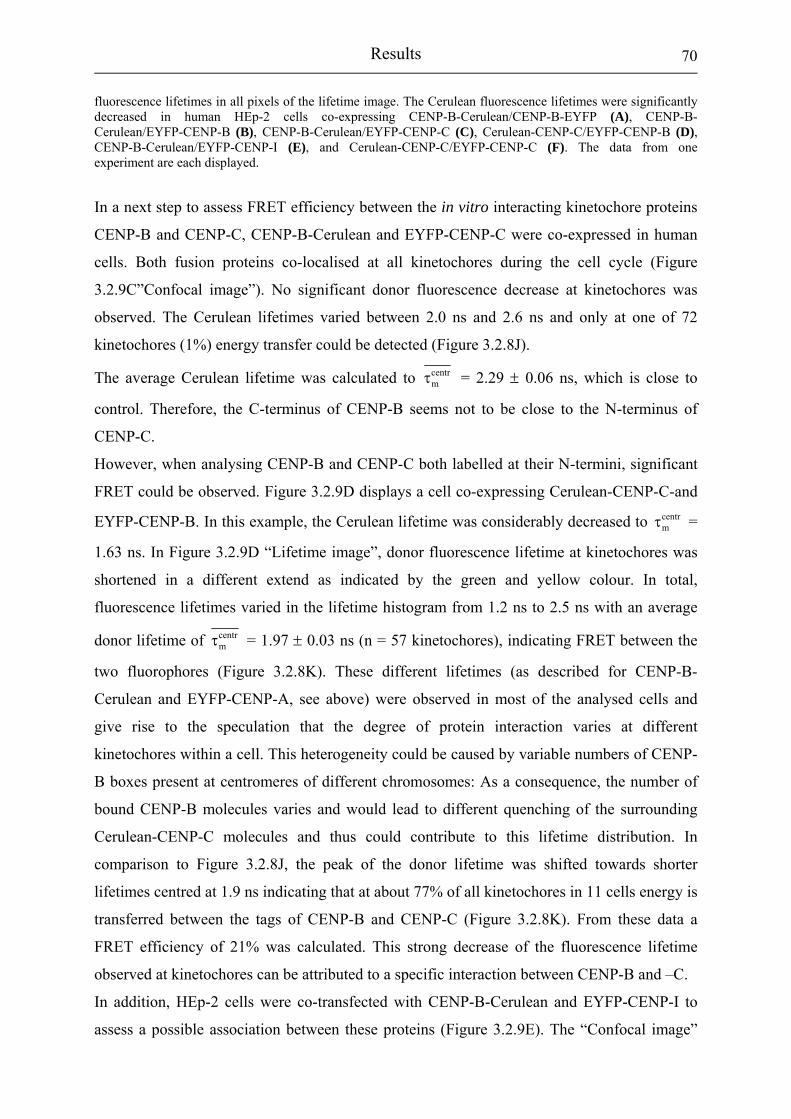
Results
70
fluorescence lifetimes in all pixels of the lifetime image. The Cerulean fluorescence lifetimes were significantly decreased in human HEp-2 cells co-expressing CENP-B-Cerulean/CENP-B-EYFP (A), CENP-B-Cerulean/EYFP-CENP-B (B), CENP-B-Cerulean/EYFP-CENP-C (C), Cerulean-CENP-C/EYFP-CENP-B (D), CENP-B-Cerulean/EYFP-CENP-I (E), and Cerulean-CENP-C/EYFP-CENP-C (F). The data from one experiment are each displayed.
In a next step to assess FRET efficiency between the in vitro interacting kinetochore proteins
CENP-B and CENP-C, CENP-B-Cerulean and EYFP-CENP-C were co-expressed in human
cells. Both fusion proteins co-localised at all kinetochores during the cell cycle (Figure
3.2.9C”Confocal image”). No significant donor fluorescence decrease at kinetochores was
observed. The Cerulean lifetimes varied between 2.0 ns and 2.6 ns and only at one of 72
kinetochores (1%) energy transfer could be detected (Figure 3.2.8J).
The average Cerulean lifetime was calculated to centrmτ = 2.29 ± 0.06 ns, which is close to
control. Therefore, the C-terminus of CENP-B seems not to be close to the N-terminus of
CENP-C.
However, when analysing CENP-B and CENP-C both labelled at their N-termini, significant
FRET could be observed. Figure 3.2.9D displays a cell co-expressing Cerulean-CENP-C-and
EYFP-CENP-B. In this example, the Cerulean lifetime was considerably decreased to =
1.63 ns. In Figure 3.2.9D “Lifetime image”, donor fluorescence lifetime at kinetochores was
shortened in a different extend as indicated by the green and yellow colour. In total,
fluorescence lifetimes varied in the lifetime histogram from 1.2 ns to 2.5 ns with an average
donor lifetime of
centrmτ
centrmτ = 1.97 ± 0.03 ns (n = 57 kinetochores), indicating FRET between the
two fluorophores (Figure 3.2.8K). These different lifetimes (as described for CENP-B-
Cerulean and EYFP-CENP-A, see above) were observed in most of the analysed cells and
give rise to the speculation that the degree of protein interaction varies at different
kinetochores within a cell. This heterogeneity could be caused by variable numbers of CENP-
B boxes present at centromeres of different chromosomes: As a consequence, the number of
bound CENP-B molecules varies and would lead to different quenching of the surrounding
Cerulean-CENP-C molecules and thus could contribute to this lifetime distribution. In
comparison to Figure 3.2.8J, the peak of the donor lifetime was shifted towards shorter
lifetimes centred at 1.9 ns indicating that at about 77% of all kinetochores in 11 cells energy is
transferred between the tags of CENP-B and CENP-C (Figure 3.2.8K). From these data a
FRET efficiency of 21% was calculated. This strong decrease of the fluorescence lifetime
observed at kinetochores can be attributed to a specific interaction between CENP-B and –C.
In addition, HEp-2 cells were co-transfected with CENP-B-Cerulean and EYFP-CENP-I to
assess a possible association between these proteins (Figure 3.2.9E). The “Confocal image”

Results
71
shows the co-localization of both fusion proteins at kinetochores. Shortened donor
fluorescence lifetimes were observed at about half of kinetochores (Figure 3.2.9E “Lifetime
image”). As examining 40 kinetochores donor fluorescence lifetimes from 1.5 ns to 2.5 ns
were found: at 31% of all kinetochores the Cerulean lifetime was significantly shortened
(Figure 3.2.8L). The fluorescence lifetime was averaged to centrmτ = 2.16 ± 0.04 ns. This
finding is in accordance to the AB-FRET measurements and indicates that CENP-B and
CENP-I are associated within the inner kinetochore. However, as mentioned above, the FLIM
set-up needs higher expression levels of the fusion proteins. This was problematic for tagged
CENP-I because only a low expression of this fusion protein resulted in proper kinetochore
localisation and was tolerated by cells. For this reason, only a few cells could be analysed by
FLIM and further measurements with an improved detector would be required.
Then HEp-2 cells were analysed co-expressing CENP-C that was N-terminally tagged with
either Cerulean or EYFP (Figure 3.2.9F). Both fusions co-localised at kinetochores (Figure
3.2.9F “Confocal image”). The lifetime histogram shows that the donor lifetimes varied from
1.3 ns to 2.5 ns with an average fluorescence lifetime of centrmτ = 2.03 ± 0.14 ns (Figure
3.2.8M). At 33% of all kinetochores (n = 9) significantly shortened lifetimes could be found
indicating FRET. As observed for AB-FRET, CENP-C molecules probably interact with each
other via the oligomerisation domain in vivo. However, the number of analysed kinetochores
is not sufficient for an educated conclusion. Only slight over-expression of CENP-C is lethal
to the cells. Thus, measurements with a more sensitive set-up are necessary to elucidate the
situation.
Furthermore, human HEp-2 cells were co-transfected with Cerulean-CENP-C and EYFP-
CENP-I. After 48 hours incubation, only 17 kinetochores in 2 cells could be analysed due to
the higher expression level necessary for FLIM (see above). However, a mean donor
fluorescence lifetime of centrmτ = 2.13 ± 0.09 ns was measured yielding a FRET efficiency of
15%. At 4 kinetochores (24%) the donor lifetime was significantly shortened (Figure 3.2.8N)
suggesting, that the N-termini of CENP-C and CENP-I are associated. This result supposes
the AB-FRET measurements, however, more cells have to be analysed to proof this finding.
3.2.2.4. Analysis of H1.0 interactions at human centromeres
The associations of linker histone H1.0 with the inner kinetochore proteins CENP-A, CENP-
B and CENP-C were analysed to elucidate if H1.0 is present within centromeric chromatin.
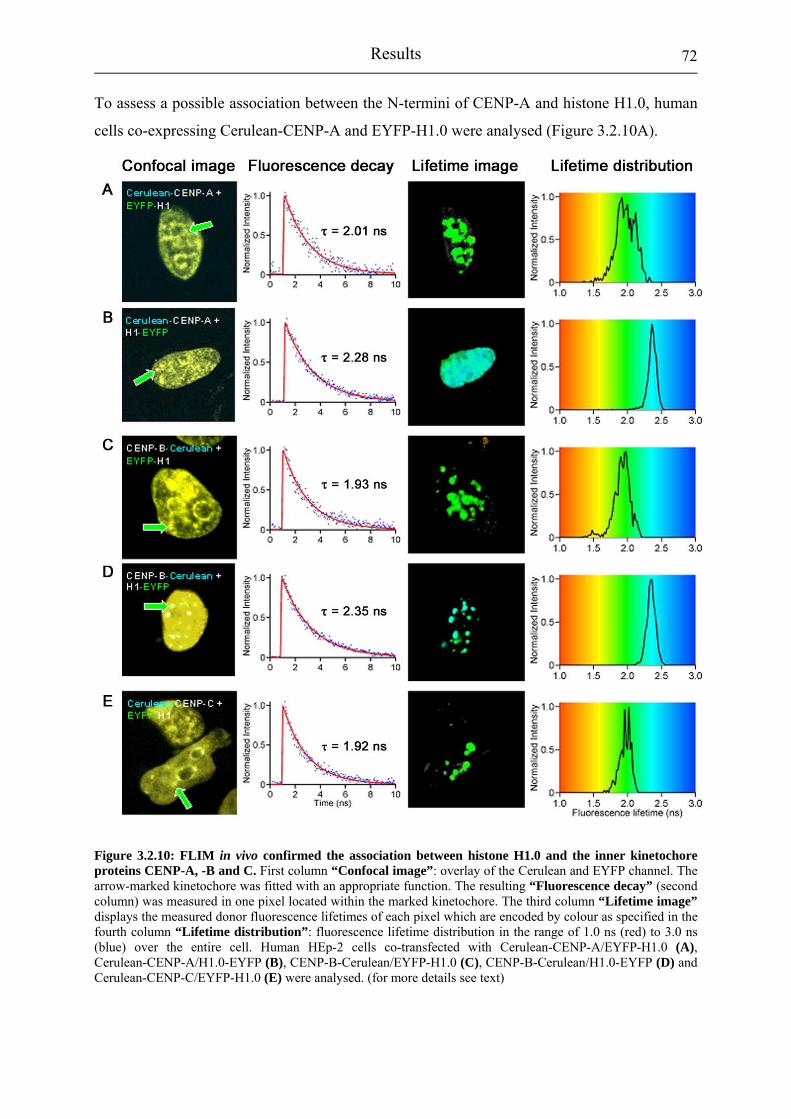
Results
72
To assess a possible association between the N-termini of CENP-A and histone H1.0, human
cells co-expressing Cerulean-CENP-A and EYFP-H1.0 were analysed (Figure 3.2.10A).
Figure 3.2.10: FLIM in vivo confirmed the association between histone H1.0 and the inner kinetochore proteins CENP-A, -B and C. First column “Confocal image”: overlay of the Cerulean and EYFP channel. The arrow-marked kinetochore was fitted with an appropriate function. The resulting “Fluorescence decay” (second column) was measured in one pixel located within the marked kinetochore. The third column “Lifetime image” displays the measured donor fluorescence lifetimes of each pixel which are encoded by colour as specified in the fourth column “Lifetime distribution”: fluorescence lifetime distribution in the range of 1.0 ns (red) to 3.0 ns (blue) over the entire cell. Human HEp-2 cells co-transfected with Cerulean-CENP-A/EYFP-H1.0 (A), Cerulean-CENP-A/H1.0-EYFP (B), CENP-B-Cerulean/EYFP-H1.0 (C), CENP-B-Cerulean/H1.0-EYFP (D) and Cerulean-CENP-C/EYFP-H1.0 (E) were analysed. (for more details see text)
Results
73
The ”Confocal image” displays the diffuse distribution of the tagged histone H1.0 within the
nucleus and the centromeric localisation of Cerulean-CENP-A. The donor fluorescence decay
at the marked kinetochore, obtained by a mono-exponential fit, was = 2.0 ns (Figure
3.2.10A “Fluorescence decay”). The Cerulean lifetimes varied from 1.5 ns to 2.6 ns at 63
centromeres of 10 cells yielding an FRET efficiency of 11% (Figure 130). At 22% of the
centromeres the fluorescence lifetime was significantly shortened indicating that CENP-A and
histone H1.0, especially their N-termini, are in close proximity at human centromeres.
centrmτ
Switching the tag to the C-terminus of H1.0 (H1.0-EYFP) did not yield similar results. As
shown in Figure 3.2.10B, the fluorescence lifetime was not significantly shortened by FRET.
In total, the lifetimes at 110 centromeres differed only slightly from 1.9 ns to 2.6 ns yielding centrmτ = 2.29 ± 0.01 ns. The peak in the lifetime histogram was close to control (Figure
3.2.8P). Thus, the distance between the N-terminal arm of CENP-A and the C-terminus of
H1.0 might be too large for FRET.
When analysing CENP-B-Cerulean and EYFP-H1.0 co-transfected into human cells,
significant energy transfer was detected (Figure 3.2.10C). At 52% of all centromeres
significantly shortened lifetimes could be found (Figure 3.2.8Q). As for CENP-A, the
fluorescence lifetime noticeably differed from 1.4 ns to 2.4 ns (average centrmτ = 2.05 ± 0.03 ns,
101 centromeres). In the lifetime histogram (Figure 3.2.8Q) one can clearly detect 2 distinct
peaks. The slow lifetime components are close to the lifetime measured in HEp2-cells
expressing CENP-B-Cerulean alone and can attributed to unassociated CENP-B-Cerulean
molecules. The left peak centred at 1.8 ns arises from CENP-B-Cerulean whose lifetime was
quenched by the close vicinity of the acceptor EYFP-H1.0 yielding a FRET efficiency of
26%. This finding indicates that two different states of protein interaction between CENP-B
and H1.0 might be present.
Tagging the C-terminus of H1.0 (H1.0-EYFP) lead to a lower energy transfer rate between
CENP-B-Cerulean and H1.0-EYFP (Figure 3.2.10D). In this case, only 16% (21 from 134) of
all centromeres showed significantly decreased fluorescence lifetimes (Figure 3.2.8R).
However, the donor lifetime variation was high (1.2 ns to 2.7 ns) with a mean fluorescence
lifetime of centrmτ = 2.17 ± 0.04 ns. Therewith an interaction between both proteins can be
adopted. However, the lower FRET efficiency gives rise to the assumption that at most
centromeres the distances between the C-termini of CENP-B and H1.0 might be too large for
energy transfer or that the dipole orientation of the fluorophores might be unfavourable.
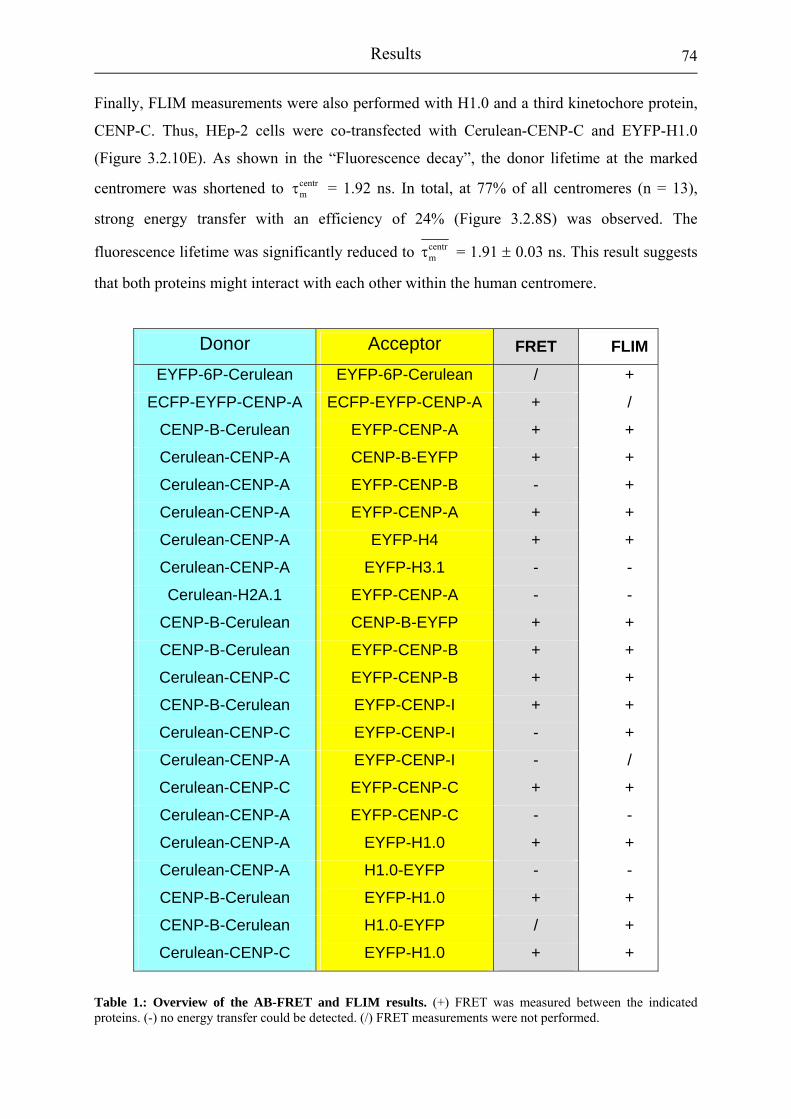
Results
74
Finally, FLIM measurements were also performed with H1.0 and a third kinetochore protein,
CENP-C. Thus, HEp-2 cells were co-transfected with Cerulean-CENP-C and EYFP-H1.0
(Figure 3.2.10E). As shown in the “Fluorescence decay”, the donor lifetime at the marked
centromere was shortened to = 1.92 ns. In total, at 77% of all centromeres (n = 13),
strong energy transfer with an efficiency of 24% (Figure 3.2.8S) was observed. The
fluorescence lifetime was significantly reduced to
centrmτ
centrmτ = 1.91 ± 0.03 ns. This result suggests
that both proteins might interact with each other within the human centromere.
Donor Acceptor FRET FLIM
EYFP-6P-Cerulean EYFP-6P-Cerulean / +
ECFP-EYFP-CENP-A ECFP-EYFP-CENP-A + /
CENP-B-Cerulean EYFP-CENP-A + +
Cerulean-CENP-A CENP-B-EYFP + +
Cerulean-CENP-A EYFP-CENP-B - +
Cerulean-CENP-A EYFP-CENP-A + +
Cerulean-CENP-A EYFP-H4 + +
Cerulean-CENP-A EYFP-H3.1 - -
Cerulean-H2A.1 EYFP-CENP-A - -
CENP-B-Cerulean CENP-B-EYFP + +
CENP-B-Cerulean EYFP-CENP-B + +
Cerulean-CENP-C EYFP-CENP-B + +
CENP-B-Cerulean EYFP-CENP-I + +
Cerulean-CENP-C EYFP-CENP-I - +
Cerulean-CENP-A EYFP-CENP-I - /
Cerulean-CENP-C EYFP-CENP-C + +
Cerulean-CENP-A EYFP-CENP-C - -
Cerulean-CENP-A EYFP-H1.0 + +
Cerulean-CENP-A H1.0-EYFP - -
CENP-B-Cerulean EYFP-H1.0 + +
CENP-B-Cerulean H1.0-EYFP / +
Cerulean-CENP-C EYFP-H1.0 + +
Table 1.: Overview of the AB-FRET and FLIM results. (+) FRET was measured between the indicated proteins. (-) no energy transfer could be detected. (/) FRET measurements were not performed.

Results
75
Using FLIM-based FRET measurements, the results from the AB-FRET approach could be
confirmed. In addition, information about the stoichiometry within the inner kinetochore was
deduced. Decreased Cerulean lifetimes indicate close vicinity between the N-terminus of
CENP-A and the C-terminus of CENP-B in kinetochores of living human cells. Furthermore,
it was observed that the N-termini of CENP-A are close to one-another as well as to the N-
terminus of histone H4. The analysis confirmed the dimerisation of CENP-B and its
interaction with CENP-C in vivo. Furthermore, energy transfer was detected between N-
terminally tagged CENP-C molecules. Potential interaction of CENP-I with CENP-B and
CENP-C were found which have to be confirmed with a more sensitive FLIM set-up. The
presence of histone H1.0 at centromeric DNA was demonstrated due to its association with
the three inner kinetochore proteins CENP-A, -B and –C.

Discussion
76
4 Discussion
The centromere kinetochore complex is imperatively required for proper distribution of the
sister chromatids during cell division. Understanding kinetochore assembly and function
requires detailed knowledge of the properties of its single components and their
interdependencies, determination of their interactions, and their dynamic coordination to form
a cohesive unit.
In earlier studies by other groups, the impact of all inner kinetochore proteins except for
CENP-H had been determined in humans. In order to elucidate if CENP-H is essential in
human kinetochores, here its function was studied by RNAi knock down in human HEp-2
cells. Comparable analyses performed in chicken DT40 cells already could describe some
CENP-H functions in chicken (Fukagawa et al., 2001; Mikami et al., 2005). However, a
comparative study of human and chicken kinetochores is imperative since despite a rather
well established overall (inner) kinetochore complex conservation between eukaryotes, its
detailed architecture and protein binding hierarchy varies from organism to organism (section
4.1).
Furthermore, by a thorough in vivo analysis, protein interactions were identified that are
important for the set-up of the inner kinetochore complex. The interactions and associations
of the foundation kinetochore proteins CENP-A, CENP-B, CENP-C and CENP-I as well as
histones were characterised in living human cells by FRET (section 4.2). This study lead to a
model of the kinetochore complex architecture describing the interface between centromeric
DNA and the inner kinetochore sub-complex.
4.1. Functional analysis of the inner kinetochore protein CENP-H
Several isoforms of CENP-H exist in human cells and the designed siRNA was able to block
each of the isoforms. However, in HEp-2 cells only the BF245236 form was detected. The
knock down of CENP-H to less than 5% after 72 hours of incubation led to the establishment
of several abnormal phenotypes as also found in chicken DT40 cells (Fukagawa et al., 2001;
Mikami et al., 2005): misaligned chromosomes, multipolar spindles and strongly condensed
chromosomes as an indicator of apoptosis. In contrast to chicken, however, neither monopolar
spindles nor metaphase arrest were found in human cells. In addition, chicken DT40 cells
showed chromosome shapes (micronuclei and apoptotic bodies) which could not been
Discussion
77
observed in human HEp-2 cells. From the strongly distorted phenotypes we conclude that
CENP-H has an important function in the human inner kinetochore that obviously cannot be
(fully) taken over by other inner kinetochore proteins (such a functional replacement was
discussed by Fukugawa et al. (2001) for CENP-C and CENP-H in chicken).
As a second step, CENP-C localisation in CENP-H deficient cells was studied. In chicken
DT40 cells, CENP-H and CENP-I are required for centromere localisation of CENP-C
(Fukagawa et al., 2001; Mikami et al., 2005). This relates to findings in human cells: the
amount of CENP-C was decreased by 28% at human kinetochores that nearly completely lack
CENP-H while it was much stronger decreased in chicken cells. It could well be, however,
that even low levels of CENP-H are still sufficient to recruit CENP-C to kinetochores and that
only a complete CENP-H knock out would abrogate CENP-C recruitment as in chicken.
Furthermore, CENP-H depleted chicken DT40 cells showed metaphase arrest resulting in
tetraploidic cells (8N) after 72 hours, indicating that the mitotic checkpoint was disrupted
after 72 hours (Fukagawa et al., 2001). In contrast, in human RNAi treated CENP-H knock
down cells mitotic arrest could not been observed and CENP-H deficient cells proceeded
through the cell cycle despite of misaligned chromosomes. This indicates that CENP-H has
little or no impact on mitotic progression in human cells.
The outer kinetochore protein ZW10 did not localise to the kinetochore in chicken cells
indicative of a disruption of the kinetochore structure and a loss of mitotic checkpoint
function in CENP-H depleted chicken DT40 cells (Fukagawa et al., 2001). Analysing the
human checkpoint protein hBubR1 in CENP-H depleted human cells, it localised at the
kinetochore of misaligned chromosomes in the same way as in control cells with CENP-H,
indicating that the mitotic checkpoint is functional at the hBubR1 level.
Then, in CENP-H depleted human cells the kinetochore-associated microtubule motor protein
CENP-E was studied which interacts with hBubR1 (Chan et al., 1998, Yao et al., 2000) and
stimulates directly its kinase activity (Mao et al., 2003, Weaver et al., 2003). In CENP-H
depleted human cells it was observed that the protein level of CENP-E at kinetochores of
misaligned chromosomes was reduced and that CENP-E localised only to about one half
(56%) of the kinetochores of not correctly aligned chromosomes and that the protein level of
CENP-E at these CENP-E containing kinetochores of misaligned chromosomes was reduced
(to 72%) indicating that CENP-E binding to CENP-H depleted kinetochores is distorted. A
reduced or lacking CENP-E level at the kinetochores might lead to a reduced hBubR1
activation (Tanudji et al., 2004; Mao et al., 2005) and thus a misregulated “wait-for-anaphase”
Discussion
78
signal, with the consequence that the cells progress into anaphase despite of misaligned
chromosomes.
Furthermore, it was observed that CENP-H depleted cells pass throughout mitosis with an
increasing cell number having misaligned chromosomes which after a few cell cycles lead to
cell death as indicated by a decreasing number of living cells. A potential interpretation is that
the reduced number of kinetochores which are associated with CENP-E and which
additionally contain a reduced CENP-E level, might not generate the correctly regulated
“wait-for-anaphase” signal to arrest cells in mitosis until each kinetochore is properly attached
to spindle microtubules. These results agree with findings of Tanudji et al. (2004) who
observed that HeLa cells with reduced levels of CENP-E showed mitotic delay but did not
prevent anaphase onset in the presence of a few unaligned chromosomes. These observations
are also in line with results obtained for CENP-I depleted human cells: Liu et al. (2003)
concluded that the collective output from many unattached kinetochores is required in these
cells to reach a threshold signal of “wait-for-anaphase” to sustain a mitotic arrest. Their
cytological and live-cell analyses of CENP-I deficient cells showed that many chromosomes
attached to microtubules and congressed normally, although in each cell several chromosomes
failed to align at the metaphase plate. Despite the lack of CENP-E at many kinetochores, the
kinetochore attachment to and the chromosome movement along the spindle microtubules
could be grossly adopted by other motor proteins like dynein/dynactin granting the
segregation of the sister chromatids.
Similar phenotypes were noticed in human cells for RNAi knock down of CENP-H, CENP-I
and CENP-E specified by (i) no mitotic arrest, (ii) reduced numbers of kinetochores
associated with CENP-E and (iii) the progression to anaphase despite the presence of
unattached chromosomes (Liu et al., 2003; Tanudji et al., 2004). This might hint at a
particular connection between these three kinetochore proteins that might be realised by direct
or indirect binding. This is supported by the (preliminary) finding that CENP-H might interact
with CENP-I (Nishihashi et al., 2002). On the other hand, the checkpoint protein hBubR1 is
not affected by the depletion of any of these three kinetochore proteins (Liu et al., 2003;
Tanudji et al., 2004).
The data presented here clearly indicate that CENP-H has an important impact on the function
of the inner kinetochore complex and probably on the mitotic checkpoint in humans.

Discussion
79
4.2. Interaction studies of inner kinetochore proteins by FRET in
vivo
4.2.1. Assembly of the inner kinetochore proteins CENP-A and CENP-B in living human cells
CENP-A is an essential histone H3 variant found in all eukaryotes examined to date
(Howman et al., 2000; Stoler et al., 1995; Regnier et al., 2003; Talbert et al., 2004). CENP-A
and histone H4 form sub-nucleosomal tetramers that are more compact and conformationally
more rigid than the corresponding tetramers of histones H3 and H4 (Black et al., 2004). No
information is available on the location of its N-terminal arm; nevertheless, we would assume
it to be located partially outside the nucleosomal structure similar to the N-terminal arm of the
homologous H3. In centromeric chromatin, regions with CENP-A containing nucleosomes
exchange with other regions of H3 containing nucleosomes (Blower et al., 2002; Amor et al.,
2004; see also Foltz et al., 2006). CENP-A seems to be the epigenetic mark that identifies the
centromeres after replication in higher eukaryotes. It is thus expected that since CENP-A
directly or indirectly recruits downstream binding proteins, it would interact with other inner
kinetochore proteins. Extensive in vitro studies, however, could not identify such interactions
(Suzuki et al., 2004, data obtained in our group). Thus the close vicinity of the inner
kinetochore protein CENP-A and CENP-B should be examined in vivo that is predicted from
the binding modes of these two proteins. CENP-B binds with its structurally resolved N-
terminus to a specific centromere sequence that is supposed to be located at the DNA exit site
from the nucleosome (Tanaka et al., 2005). Purified CENP-A nucleosome complexes have
shown to contain CENP-B (Ando et al., 2002; Foltz et al., 2006). Thus, in the inner
kinetochore complex, at least the N-terminal arm of CENP-A and parts of CENP-B should be
in direct vicinity to one-another in the centromeric chromatin complex. Surprisingly,
however, no interaction between these two proteins was observed in vitro. In order to test for
their association in vivo, CENP-A and CENP-B were labelled with the fluorescent proteins
Cerulean and EYFP and the neighbourhood relations between these proteins were analysed in
living human HEp-2 cells by measuring the extend of Förster resonance energy transfer
(FRET). An energy transfer (FRET) is measured only when a distance smaller than about 10
nm separates the two fluorophores. Due to the considerable size of these fluorescent proteins
and the lack of precise position information relative to the fused protein, we do not calculate
concrete distance values from the measured energy transfer efficiencies but interpret the

Discussion
80
occurrence of FRET as close vicinity in the range <10 nm. FRET is able to detect associations
between proteins within a stable complex that not necessarily interact with one another. In
vivo studies performed here grant correct protein folding and modification.
Two independent methods for determining the energy transfer were applied: acceptor-
bleaching (AB-) FRET in the intensity domain and FLIM in the lifetime domain. FLIM
measurements have the advantage over AB-FRET that fluorescence lifetimes are independent
of the actual concentration of donor and acceptor fluorophores in the sample. In addition,
FLIM can provide valuable information about the kinetics of the fluorescence decay and can
identify different association states of the analysed fusion proteins. However, for this detailed
information, many photons are analysed so that FLIM requires a higher expression level of
fusion proteins within the cell.
A series of control experiments were carried out. When the fluorescent proteins were
transfected without fusions, the donor Cerulean was not affected by the presence of the EYFP
acceptor and the acceptor bleaching did not alter its fluorescence properties during AB-FRET.
Incidental association of the fluorescent unfused proteins due to random diffusion in the cell
did not result in any detectable energy transfer. Fusion of the kinetochore proteins CENP-A
and CENP-B to Cerulean changed its fluorescence lifetime only to a negligible amount. These
fusions of the kinetochore proteins to Cerulean decreased the amount of Cerulean within the
cell and, under low expression levels, restricted its localisation to kinetochores in the cell
nucleus. As a positive control, fusion proteins of donor and acceptor were constructed and
strong energy transfer in AB-FRET and FLIM measurements could be found. Using these
fusions, the applicability of both methods at small nuclear structures within living human cells
could be demonstrated.
Analysing EYFP-CENP-A and CENP-B-Cerulean by AB-FRET and FLIM, an association
between these two inner kinetochore proteins was found in living human HEp-2 cells. In
particular, the N-terminus of CENP-A and the C-terminus of CENP-B showed a strong
energy transfer by both experimental approaches. Centromeric chromatin model building
would be required to enable a more detailed interpretation of our findings. Switching of the
donor and acceptor led to a lower energy transfer rate and a smaller number of kinetochores
showing quenching of the donor. This observation led to the assumption that the complex
stoichiometry might influence the energy transfer. Figure 15.1 displays a model of three
centromeric nucleosomes each separated by a 25 bp linker. From their mode of binding, clear
concepts for the position of CENP-A and CENP-B can be deduced. It was assumed that the 17
bp CENP-B box is positioned potentially at every second inter-nucleosomal linker (Yoda et

Discussion
81
al., 1998; Ando et al., 2002). We suggested that much less CENP-B than CENP-A molecules
are present within the CENP-A containing kinetochore sub-regions. Within each nucleosome,
two molecules of CENP-A are supposed to be present. It is likely that CENP-B bound to the
interspersed linker is close to both nucleosomes. Therefore, tagging CENP-B with Cerulean
would lead to a strong quenching of the fluorophore by 3 surrounding EYFP-CENP-A
molecules, a value consistent with stoichiometry considerations based on the data (see
Results). If N-terminally tagged CENP-A is used as the donor, the few CENP-B-EYFP
acceptor molecules are not sufficient to offer an efficient quenching pathway and thus to
effectively shorten the donor lifetime of all CENP-A molecules (Figure 4.1). Our data show
that both proteins associate with each other in vivo and confirm the structural concept for the
position of CENP-A and -B in the inner kinetochore.
Figure 4.1: Schematic model representation of the FRET experiments including CENP-A, CENP-B and core histones. Three nucleosomes containing CENP-A (red) instead of histone H3 are separated by 25 bp linkers (green). Within one linker, the 17 bp CENP-B box (purple) is located where CENP-B (orange) binds via its N-terminus. The N-termini of the proteins are light-coloured. The Cerulean and EYFP tags are shown as cyan and yellow barrels, respectively. The linker between the proteins and the fluorophores are depicted as black lines. In the nucleosomes, only selected histones are displayed: H2A grey, H4 green. The DNA surrounding the nucleosomes is coloured in grey (for details see text).
Discussion
82
Only weak energy transfer was observed between the N-terminus of CENP-A and the N-
terminus of CENP-B using AB-FRET although it is the N-terminus of CENP-B that binds to
the 17 bp CENP-B box and should be close to CENP-A (Tanaka et al., 2001). Fusion of the
fluorescence tag to the N-terminus of CENP-B might extend the distance between the
fluorescence tags considerably. However, using FLIM measurements, a small sub-population
of kinetochores could be detected where the N-termini of CENP-A and CENP-B are in direct
vicinity to each other. As mentioned above, tagging of CENP-B with EYFP could have lead
to a diminished quenching of Cerulean-CENP-A due to unfavourable complex stoichiometry.
The two populations of lifetimes at kinetochores as found for Cerulean-CENP-A/EYFP-
CENP-B (Figure 3.2.8C) suggest two association modes between the N-termini of CENP-A
and CENP-B. We suppose that only a portion of CENP-A molecules is very close to the
CENP-B N-terminus leading to FRET while most of the CENP-A N-terminal arms sticking
out the nucleosome are farther from the DNA binding domain of CENP-B (Figure 4.1). This
population of CENP-A molecules associated with N-terminally tagged CENP-B was not
present within each nucleosome due to the random distribution of the fusion proteins
explaining the small number of kinetochores showing FRET between both N-terminally
labelled CENP-A and CENP-B.
CENP-A, -B, and -C exist on alphoid DNA at normal human centromeres throughout the cell
cycle and were reported to be co-immunoprecipitable with the chromatin complex (Masumoto
et al., 1989; Ando et al., 2002,). Thus, a further molecular link between centromeric CENP-A
and the inner kinetochore, e.g. CENP-C might occur. When analysing the association between
N-terminally labelled CENP-A and CENP-C in vivo no FRET was found. Although
mistargeting of CENP-A to non-centromeric regions by over-expression caused misassembly
of CENP-C to the same ectopic loci but without a function as centromeres (van Hooser et al.,
2001), this aberrant localisation of CENP-C seems not to be caused by a direct interaction
between both proteins. Our results indicate that CENP-A and CENP-C seem not to interact
with each other also in vivo. This is supported by FRET measurements between the N-
terminus of CENP-C and the C-terminus of CENP-B (which we have shown to be close to
CENP-A): analysis of these protein termini did also not reveal a close vicinity. Therefore the
N-terminus of CENP-C might not be associated with the N-terminus of CENP-A. However, it
cannot be excluded that despite our measurements both proteins are associated each other
within the inner kinetochore. Based on their mode of binding it seems to be possible, that the
distance between the central DNA binding domain of CENP-C and the N-terminal arm of
CENP-A sticking out of the nucleosome might be rather short. In addition, probably the C-

Discussion
83
terminal region of CENP-C interacting with the C-terminus of CENP-B (which is associated
with the CENP-A N-terminus) might be close to CENP-A. Therefore we propose an indirect
interaction between CENP-A and CENP-C that could be mediated via the centromeric DNA
and/or CENP-B. Measurements with C-terminally labelled CENP-C would be necessary to
proof this hypothesis.
Previous studies have shown, that the incorporation of newly synthesized CENP-A into
centromeric nucleosomes was decreased in CENP-I depleted kinetochores (Okada et al.,
2006). This finding suggests a possible association or even interdependency between both
proteins. However, AB-FRET analysis of N-terminally tagged CENP-A and CENP-I did not
reveal such an association. FLIM measurements could not proof this finding, they were not
feasible due to the low protein expression in cells co-transfected with Cerulean-CENP-
A/EYFP-CENP-I or EYFP-CENP-A/Cerulean-CENP-I. In general, however, an absence of
FRET signals can be caused by various reasons (f.e. unfavourable dipole orientations).
Recently, CENP-I has been shown to be part of the CAD complex (Foltz et al., 2006). CENP-
I might thus be located more distant from the CENP-A nucleosomes, outside the range of
energy transfer. However, energy transfer between the C-terminus of CENP-B and the N-
terminus of CENP-I was observed. It was also shown that the C-terminus of CENP-B is close
to the N-terminus of CENP-A leaving an inconsistent situation. Applying a more sensitive
FLIM set-up in the future, the relative location of CENP-A and CENP-I to each other in the
human kinetochore will be elucidated.
CENP-A is supposed to replace both histones H3 in a single nucleosome (Blower et al.,
2002), however, possibly not in every centromeric nucleosome (Foltz et al., 2006). Thus, both
N-termini of CENP-A should be in close vicinity to one-another in centromeric chromatin as
confirmed by the AB-FRET and FLIM results. So far, it cannot be discriminated if the
observed energy transfer results from the fusion proteins within one nucleosome or from
different nucleosomes in the centromeric chromatin structure (Figure 4.1). Additional
experiments and model building are in progress to elucidate this result further. Tagging the C-
terminus of CENP-A located within the nucleosome led to an abnormal nuclear distribution of
CENP-A (Wieland et al., 2004). The fluorophore seems to impede the correct incorporation of
the C-terminally tagged CENP-A molecules into nucleosomes and thus this fusion construct
was discarded. Histone H3 replacement by CENP-A probably modifies but might not
completely change the nucleosome structure. Thus, as the N-terminus of H3 in nucleosomes
(Luger et al., 1997, Davey et al., 2002), also the N-terminus of CENP-A in centromeric
nucleosomes is expected to be associated with the N-terminus of histone H4. Indeed, energy
Discussion
84
transfer between the N-termini of CENP-A and H4.A was found. However, one has to
mention that fluorescent-tagged proteins are randomly incorporated within the centromeric
nucleosomes. The nevertheless relatively low energy transfer between CENP-A with itself
and with histone H4, indicated by low FRET efficiencies, is expected since not every
nucleosome contains both fluorescent-tagged proteins in the ratio 1:1. In some nucleosomes
one or both molecules of the endogenous protein could be included, other nucleosomes
possibly contain two equally labelled CENP-A molecules (Figure 4.1). Histone H3 should not
or hardly be present at CENP-A defined centromeric sites. Correspondingly, we observed no
energy transfer between Cerulean-CENP-A and EYFP-H3.1.
In the nucleosome core structure (Luger et al., 1997; Davey et al., 2002), the N-terminus of
histone H2A.1 is positioned opposite of the N-terminus of H3. It was assumed that the
CENP-A N-terminus is at a similar location as that of histone H3 and thus no energy transfer
between these fusion proteins was expected which in accordance with the findings (Figure
4.1). However, energy transfer measurements may be negative for various reasons, not only
due to a large distance between the fluorophores. Also unfavourable dipole orientations or
other spectroscopic reasons might result in no FRET signal despite the fluorophores being in
direct vicinity to one-another.
The detailed position of CENP-B in centromeric chromatin is a topic of discussion. CENP-B
was found to bind to the same kind of α-satellite DNA as CENP-C but not at the same
location (Politi et al., 2002). CENP-B was supposed to bind at boundaries of centromeric sites
and pericentrometric regions. Here it was show that at least a considerable sub-population of
CENP-B binds to CENP-A defined centromeres.
4.2.2. The inner kinetochore proteins CENP-B, CENP-C and CENP-I assemble to stabilise a centromere-specific chromatin structure in living human cells
Energy transfer measurements between the labelled kinetochore proteins CENP-B, CENP-C
and CENP-I were performed to enable a more detailed insight into the organisation of the
inner kinetochore complex.
The kinetochore protein CENP-B binds to a specific 17-bp sequence, named the CENP-B
box, which is found in subtypes of α-satellite DNA of human chromosomes (Masumoto et al.,
1989). CENP-B boxes are distributed regularly in every other monomer unit up to a few
megabases (Ikeno et al., 1994). It is assumed that CENP-B functions as a structural factor in
the centromere region because the binding of CENP-B to CENP-B boxes causes a specific
pattern of nucleosome positioning and may thus establish centromere-specific higher order

Discussion
85
structures (Yoda et al., 1998). CENP-B contains a DNA binding domain and a dimerisation
domain at its N-terminal 125 aa region and its C-terminal 59 aa region, respectively (Yoda et
al., 1992; Kitagawa et al., 1995). Using AB-FRET and FLIM it could be demonstrated that
CENP-B interacts with itself also in living human cells: Energy transfer occurred between C-
terminally labelled CENP-B molecules which confirms the homodimerisation described by
Yeast-two-Hybrid analysis (Suzuki et al., 2004). Furthermore, a close vicinity between the N-
and C-termini of CENP-B was observed. However, the distance between both termini might
be higher than between the C-termini due to the lower FRET efficiency. Alternatively, this
association might not occur within one protein dimer but between different CENP-B dimers
(Figure 4.2). Model building based on all obtained FRET data and available structural
properties (e.g. X-ray structure of the N- and C-terminal part of CENP-B) is in progress to
elucidate the position of CENP-B within the inner kinetochore in detail.
It was demonstrated by Yeast-two-Hybrid analysis that the C-terminus of CENP-B interacts
with two domains of CENP-C which are responsible for centromere targeting: one located
within aa 336-383, the second located within the C-terminus of CENP-C (aa 737-943)
(Suzuki et al., 2004). This interaction was tested here in vivo. Energy transfer was measured
between both N-terminally tagged CENP-B and CENP-C molecules. This observation
indicates that via the C-terminal (and central) interaction domain of both proteins also their N-
termini are in close vicinity within the human kinetochore. However, no FRET was found
between the C-terminus of CENP-B and the N-terminus of CENP-C that might mostly be
caused by distances too large for FRET. Thus, the obtained data suggest that the interaction of
CENP-B and CENP-C in human kinetochores seems to be well oriented (Figure 4.2). Due to
the lack of C-terminally tagged CENP-C construct, the interaction between the C-termini of
CENP-B and CENP-C were not examined in vivo. Although CENP-C is able to assemble at
the kinetochore without CENP-B (van Hooser et al., 2001), the molecular interaction between
CENP-B and CENP-C does indeed exist in human living cells. Thus, this interaction might
specify and increase the probability of the assembly of CENP-C on alphoid DNA containing
CENP-B boxes – one important step during kinetochore assembly. CENP-B would be
involved in the determination of the centromere/kinetochore structure by mediating the
linkage of the essential component CENP-C to centromeric DNA containing CENP-A
nucleosomes. Dynamic measurements using fluorescence recovery after photobleaching
(FRAP) and fluorescence correlation spectroscopy (FCS) have demonstrated that truncated
peptides containing either the DNA binding and centromere targeting N-terminal domain (aa
2-169) of CENP-B, or the central (aa 315-635) and the C-terminal region (aa 635-943) of

Discussion
86
CENP-C, localised independently to kinetochores but in contrast to the full-length proteins,
they were highly mobile at kinetochores (Weidtkamp-Peters et al., 2006). This indicates that
the DNA binding domain of CENP-B and CENP-C and the dimerisation domain of CENP-C
are each necessary but not sufficient for stable incorporation of both proteins into
kinetochores of living cells. Furthermore, dynamic studies could show that a truncated peptide
of CENP-C including the N-terminal oligomerisation domain of the protein (aa 1-315) totally
failed to localise at human kinetochores. Thus, supported by the presented in vivo interaction
studies, CENP-B and –C might exhibit multiple protein/DNA and protein/protein contacts to
establish a stable association within human kinetochores, and stable binding requires the full-
length protein (Weidtkamp-Peters et al., 2006).
CENP-B and CENP-B boxes are necessary for at least de novo MAC assembly of centromere
components on naked alphoid DNA (Harrington et al., 1997; Ohzeki et al., 2002). Therefore
associations of CENP-B with further inner kinetochore proteins were analysed. Observed
energy transfer between C-terminally labelled CENP-B and N-terminally labelled CENP-I
indicates that both proteins might interact within human kinetochores. Thus, it was concluded
that beside CENP-C a further molecular linkage exists between the kinetochore component
CENP-I and human centromeric DNA through CENP-B/CENP-B box interactions. This
newly identified interaction might contribute to CENP-C loading to human kinetochores since
it has been shown that CENP-I is required for CENP-C localisation at the complex in chicken
(Nishihashi et al., 2002).
Furthermore, the self-interaction of the constitutive kinetochore protein CENP-C was
examined in vivo which is well described in vitro (Suzuki et al., 2004). CENP-C functions as
a DNA binding protein via its central domain in vivo, and preferentially associates with the
centromeric α-satellite DNA like CENP-B but without sequence specificity (Sugimoto et al.,
1994; Yang et al., 1996; Politi et al., 2002; Song et al., 2002). In its N- and C-terminus, the
protein contains an oligomerisation and dimerisation domain, respectively (Lanini and
McKeon, 1995; Sugimoto et al., 1997). When analysing potential energy transfer between N-
terminally labelled CENP-C molecules, an interaction between CENP-C molecules was
identified. The comparison of the calculated FRET rate constant kt for the fastest and slowest
fluorescence lifetime observed by quenching gave rise to the assumption, that four N-termini
of CENP-C are in close vicinity to each other within the human kinetochore (Figure 4.2). The
data presented here confirmed the interaction of CENP-C at human kinetochores in vivo. As
mentioned above, the central domain of CENP-C responsible for DNA binding and
centromere targeting (Song et al., 2002; Trazzi et al., 2002) was not stably bound to

Discussion
87
kinetochores during dynamic measurements in living human cells (Weidtkamp-Peters et al.,
2006). This indicates that the N-terminal oligomerisation and C-terminal dimerisation domain
of CENP-C are both necessary for not only kinetochore binding but also for correct and stable
protein incorporation within the complex in vivo. Examination of more cells would be
necessary to validate the formation of tetramers. For FLIM measurements cells with higher
expression levels were required, however, quantitative expression of fluorescent-tagged
CENP-C was toxic to the cells. A more sensitive experimental set-up is in progress to solve
this problem.
CENP-ACENP-ACENP-ACENP-A
CENP-A CENP-ACENP-A CENP-A
CENP-C CENP-B CENP-B CENP-B
CENP-A
CENP-ACENP-ACENP-A
CENP-A CENP-A CENP-A
CENP-C CENP-B CENP-C CENP-B
CENP-A
CENP-C
CENP-C
CENP-C
CENP-C
CENP-C
CENP-C
CENP-C
CENP-C
CENP-C
CENP-C
CENP-C
CENP-C
CENP-ACENP-ACENP-ACENP-A
CENP-A CENP-ACENP-A CENP-A
CENP-C CENP-B CENP-B CENP-B
CENP-A
CENP-ACENP-ACENP-A
CENP-A CENP-A CENP-A
CENP-C CENP-B CENP-C CENP-B
CENP-A
CENP-C
CENP-C
CENP-C
CENP-C
CENP-C
CENP-C
CENP-C
CENP-C
CENP-C
CENP-C
CENP-C
CENP-C
Figure 4.2: Linear model of the centromere array formed by interactions of the inner kinetochore proteins CENP-B and CENP-C. CENP-B forms dimers via its C-terminal domain and binds to a specific DNA sequence via its N-terminus. Thus, the CENP-B dimers may act as a “clamp” thereby juxtaposing every two CENP-B boxes. This would establish a potential binding site for CENP-C at human centromeres. The subsequent binding of CENP-C tetramers to neighboured CENP-B “clamps” might stabilise this structure. (black) linker DNA, (red) linker DNA containing CENP-B boxes, (grey) centromeric nucleosomes containing CENP-A, (orange) CENP-B, (blue) CENP-C.
CENP-C localisation at kinetochores depends on CENP-H and CENP-I but a direct
interaction is only demonstrated with CENP-B (Howman et al., 2000; Nishihashi et al., 2002;
Suzuki et al., 2004; Regnier et al., 2005; Heun et al., 2006; own data). Therefore, a potential
interaction between CENP-C and CENP-I was studied at human kinetochores.
Here, a potential new interaction of CENP-C with CENP-I was found by energy transfer
between both N-terminally labelled proteins. This result was only obtained in FLIM
measurements. Using the AB-FRET approach, no significant energy transfer could be
observed. Previous studies could demonstrate that both CENP-C and CENP-I are present
within a so-called CENP-M complex (Foltz et al., 2006) supporting the idea that both proteins
are in close vicinity within human kinetochores. In chicken, however, CENP-A and CENP-C
were not found in CENP-I purified complexes indicating an indirect association of CENP-C
and CENP-I. However, the obtained FRET data provided evidence that CENP-C and CENP-I
may indeed be linked within the inner kinetochore and that this interaction is possibly
mediated through CENP-B. In agreement with the functional study presented here, it was

Discussion
88
assumed that a cooperative network of CENP-B, CENP-H and CENP-I interactions might
contribute to the recruitment and stable incorporation of CENP-C into the human kinetochore
complex. However, already a moderate expression of CENP-I led to its mislocalisation in the
nucleo- and cytoplasm indicating that endogenous CENP-I is present in the nucleus only to a
small amount. Therefore, only a small number of cells could be analysed by AB-FRET and
FLIM. Further experiments with C-terminally labelled molecules will be necessary to proof
the interaction between CENP-C and CENP-I in vivo.
The interaction of CENP-H with inner kinetochore proteins could not be analysed.
Fluorescent-tagged CENP-H did not localise at human kinetochores making FRET studies
with this inner kinetochore protein infeasible.
4.2.3. Linker histone H1.0 is present at human centromeres
One of the most abundant and ubiquitous groups of chromatin-binding proteins is the histone
H1 family that is a major structural component of the chromatin fibre. In vitro experiments
have demonstrated that the interaction of H1 with nucleosomes stabilise the compact, higher-
order chromatin structure, limit nucleosome mobility and facilitate the condensation of
eukaryotic chromatin (Allan et al., 1986; Harvey and Downs, 2004; Luger and Hansen, 2005;
Woodcock et al., 2006). Linker histones are small nucleosome-binding proteins that have a
short N-terminus, a central winged helix-like globular domain and a long, highly basic C-
terminal domain (Wolffe et al., 1997).
Within chromatin adjacent nucleosomes are linked via DNA that varies in length in a cell- and
species-specific manner (Widom, 1992). In centromeric DNA the linker length is determined
by 171 bp α-satellite repeat units (Alexandrov et al., 1991). Thus the linker consists of 25 bp,
one of the shortest linker lengths possible in eukaryotic chromatin. Due to the limited space
between adjacent centromeric nucleosomes and CENP-B binding at the linker DNA (Yoda et
al., 1998), it is a conceivable possibility that CENP-B might replace histone H1 in the
centromeric region. This information would give insights into CENP-B function at
kinetochores and is imperatively required for a model of the centromere kinetochore complex.
It was therefore analysed by FRET in vivo, if histone H1.0 is present within centromeric
chromatin.
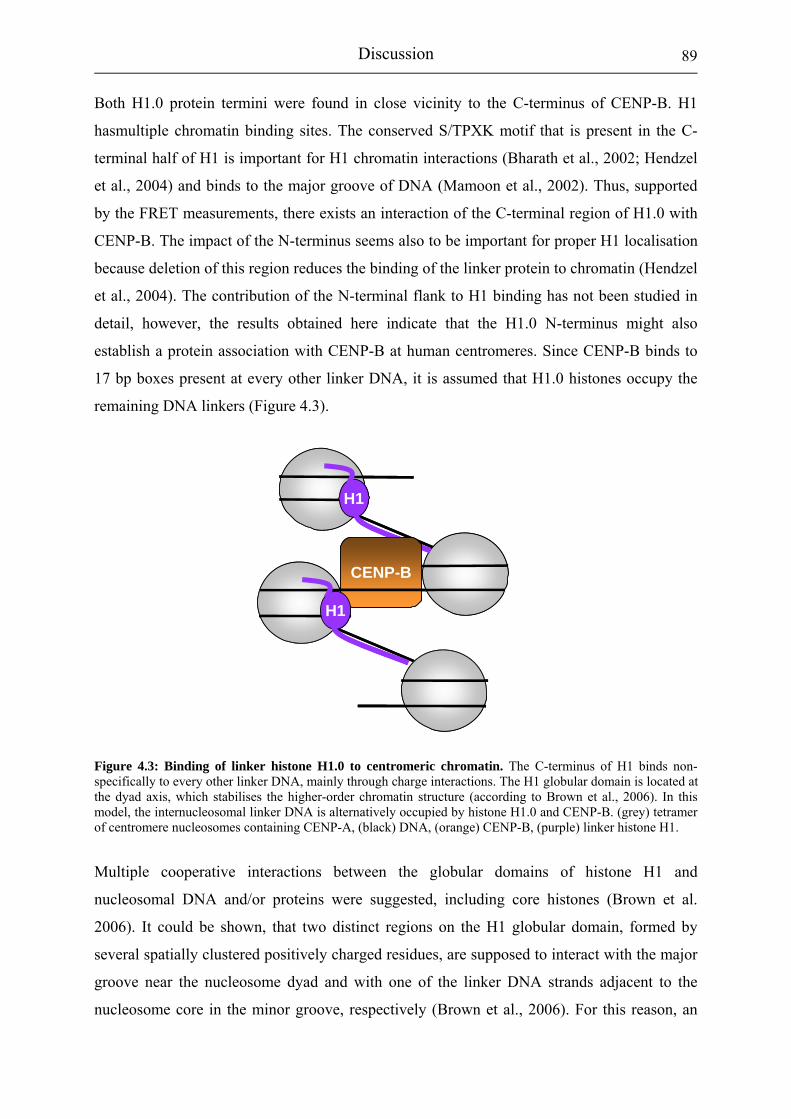
Discussion
89
Both H1.0 protein termini were found in close vicinity to the C-terminus of CENP-B. H1
hasmultiple chromatin binding sites. The conserved S/TPXK motif that is present in the C-
terminal half of H1 is important for H1 chromatin interactions (Bharath et al., 2002; Hendzel
et al., 2004) and binds to the major groove of DNA (Mamoon et al., 2002). Thus, supported
by the FRET measurements, there exists an interaction of the C-terminal region of H1.0 with
CENP-B. The impact of the N-terminus seems also to be important for proper H1 localisation
because deletion of this region reduces the binding of the linker protein to chromatin (Hendzel
et al., 2004). The contribution of the N-terminal flank to H1 binding has not been studied in
detail, however, the results obtained here indicate that the H1.0 N-terminus might also
establish a protein association with CENP-B at human centromeres. Since CENP-B binds to
17 bp boxes present at every other linker DNA, it is assumed that H1.0 histones occupy the
remaining DNA linkers (Figure 4.3).
H1
CENP-B
H1
H1
CENP-B
H1
Figure 4.3: Binding of linker histone H1.0 to centromeric chromatin. The C-terminus of H1 binds non-specifically to every other linker DNA, mainly through charge interactions. The H1 globular domain is located at the dyad axis, which stabilises the higher-order chromatin structure (according to Brown et al., 2006). In this model, the internucleosomal linker DNA is alternatively occupied by histone H1.0 and CENP-B. (grey) tetramer of centromere nucleosomes containing CENP-A, (black) DNA, (orange) CENP-B, (purple) linker histone H1.
Multiple cooperative interactions between the globular domains of histone H1 and
nucleosomal DNA and/or proteins were suggested, including core histones (Brown et al.
2006). It could be shown, that two distinct regions on the H1 globular domain, formed by
several spatially clustered positively charged residues, are supposed to interact with the major
groove near the nucleosome dyad and with one of the linker DNA strands adjacent to the
nucleosome core in the minor groove, respectively (Brown et al., 2006). For this reason, an
Discussion
90
interaction of histone H1 with the H3 variant CENP-A should be possible. Indeed, energy
transfer was found between the N-terminus of CENP-A sticking out the nucleosome and the
positively charged N-terminal region of H1.0. This is consistent with further results presented
here: the N-terminus of CENP-A was shown to be close to the CENP-B C-terminus that is
associated with H1.0.
Since the C-terminus of CENP-B is associated with H1.0, also the N-terminus of CENP-C
might be associated with the linker histone. Energy transfer between the N-termini of both
H1.0 and CENP-C revealed this interaction. The obtained data e demonstrated the association
or even interaction of H1.0 with the three inner kinetochore proteins CENP-A, CENP-B and
CENP-C which all bind to centromeric DNA, indicating that H1.0 is present within human
centromeres. However, it remains unclear which impact H1.0 might have on centromere
structure and function. As CENP-B, also the linker histone H1 is likely to direct the relative
positioning of successive nucleosomes and the pattern of nucleosome-nucleosome contacts
(Woodcock et al., 2006), possibly via its association with the core histone CENP-A. We thus
propose that the cooperative work of both H1 and CENP-B may lead to a more condensed
chromatin structure which was observed in chromatin fibres derived from the centromeric
domain of chromosome compared to the conformation of bulk chromatin (Gilbert and Allan,
2001). This highly repetitive centromeric chromatin is supposed to adopt a regular helical
conformation compatible with the canonical “30 nm fibre” (Gilbert and Allan, 2001). This
distinctive conformation of the higher-order chromatin fibre in the centromeric domain of the
mammalian chromosome might contribute to the formation of centromeric chromatin and the
determination of centromere identity (Gilbert and Allan, 2001). It is highly speculative to
assume that similar chromatin fibres might be established only due to H1.0 association with
CENP-A containing nucleosomes and CENP-C. However, both H1 and CENP-B seem to
contribute to centromere properties in a similar manner thereby providing a possible
explanation for the formation of functional neocentromeres despite they lack CENP-B and
CENP-B boxes. If similar tight packed fibres could be established only due to H1 interaction
with CENP-A containing nucleosomes and CENP-C, this could explain the formation of
neocentromeres lacking CENP-B. Thus, further studies should be carried out to elucidate if
linker H1 is present within neocentromeres.

Discussion
91
4.2.4. Model of the interface between centromeric chromatin and the inner
kinetochore sub-complex
In humans, the relationship between centromeric DNA organisation and kinetochore
formation is complex. As a consequence, the recruitment and deposition of CENP-A at
centromeric sites, one of the early essential steps during kinetochore assembly, is still poorly
understood and under speculation. Based on the results presented here and computer
animation we propose a model for the formation of kinetochores: the complex may arise by
acquisition of a small cluster of CENP-A which alters local chromatin structure. The nascent
kinetochore might extend and be maintained by a self-propagating mechanism for CENP-A
deposition as proposed by Black et al. (2004). The association between CENP-A and CENP-B
may then lead to the formation of a centromere-specific chromatin structure in the following
way: CENP-B boxes, recognition sequences of CENP-B, appear at regular intervals in human
centromeric α-satellite DNA. Therefore, CENP-B may organise a higher order structure in the
centromere by juxtaposing two CENP-B boxes in the long α-satellite array through both
DNA-protein and protein-protein interactions (Figure 4.4). This binding of CENP-B promotes
nucleosome phasing (Yoda et al., 1998). As a prerequisite CENP-B has to establish a stable
interaction with its CENP-B box located within every other linker DNA and also with itself.
One possible explanation of why this nucleosome positioning occurs is that CENP-B interacts
directly with the core histones (Yoda et al., 1998). Following their assumption it is proposed
that CENP-B acts at two levels to specify centromere structure, (i) by folding centromeric
DNA through cross-linking like a clamp (via CENP-B box interaction and dimerisation), and
(ii) by specifying nucleosome positioning via CENP-A association (Figure 4.4). Together
with the tighter compaction of CENP-A nucleosomes, CENP-B may thus create the
specialised higher-order structure of the centromere, supported by the action of linker histone
H1. This centromere-specific structure might provide a binding site for CENP-C. Its C-
terminus interacts with CENP-B and may thus form a link between two adjacent CENP-B
dimers (“clamps”) via its N-terminal oligomerisation. CENP-C might bind to the centromeric
DNA by its central part and form a tetramer bridging over the gap between two adjacent
CENP-B dimers (Figure 4.4). In this model, the well defined repeat length of the α-satellite
DNA/CENP-B box array might grant the correct spacing for CENP-C oligomerisation. This
interaction of CENP-B and CENP-C is supposed to lead to a further stabilisation of the
established centromere structure. It is assumed that the assembly of this chromatin confers a
conformational change that is the platform for recruiting outer kinetochore proteins. Thus
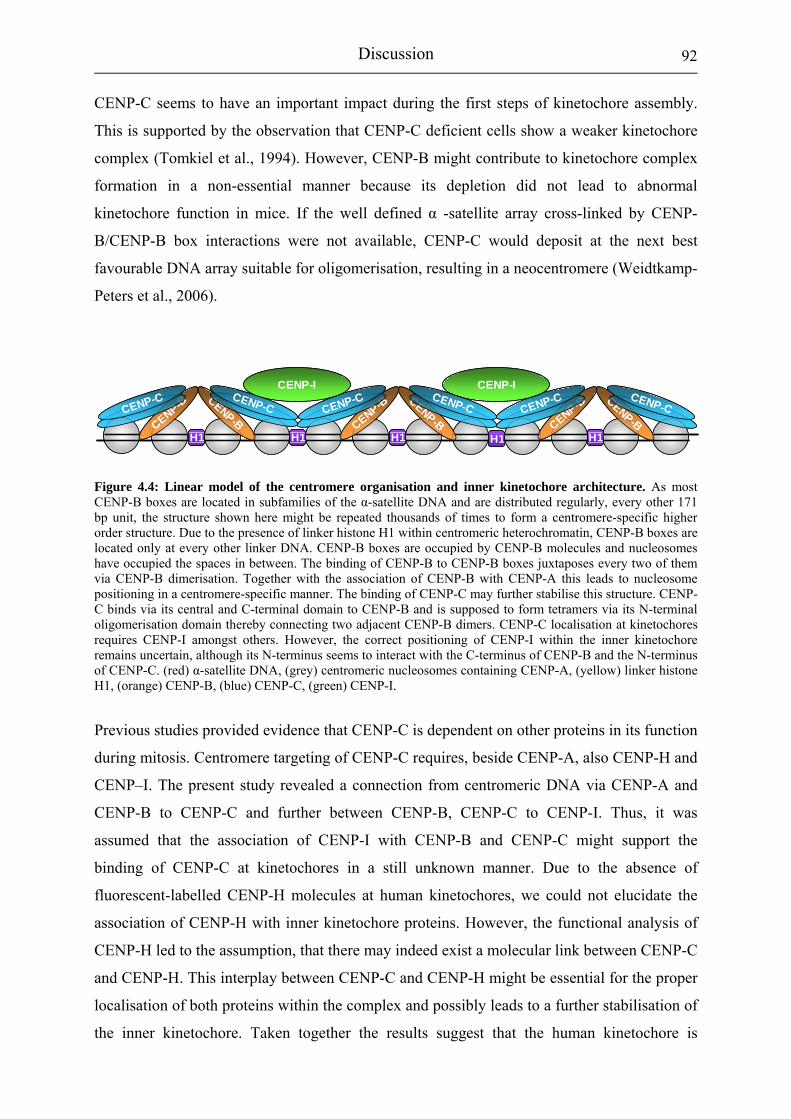
Discussion
92
CENP-C seems to have an important impact during the first steps of kinetochore assembly.
This is supported by the observation that CENP-C deficient cells show a weaker kinetochore
complex (Tomkiel et al., 1994). However, CENP-B might contribute to kinetochore complex
formation in a non-essential manner because its depletion did not lead to abnormal
kinetochore function in mice. If the well defined α -satellite array cross-linked by CENP-
B/CENP-B box interactions were not available, CENP-C would deposit at the next best
favourable DNA array suitable for oligomerisation, resulting in a neocentromere (Weidtkamp-
Peters et al., 2006).
CENP-BCENP-B CENP-BCENP-B CENP-BCENP-B
H1 H1 H1H1 H1
CENP-C CENP-CCENP-C CENP-CCENP-C CENP-C
CENP-ICENP-ICENP-BCENP-B CENP-BCENP-B CENP-BCENP-B
H1 H1 H1H1 H1
CENP-C CENP-CCENP-C CENP-CCENP-C CENP-C
CENP-ICENP-I
Figure 4.4: Linear model of the centromere organisation and inner kinetochore architecture. As most CENP-B boxes are located in subfamilies of the α-satellite DNA and are distributed regularly, every other 171 bp unit, the structure shown here might be repeated thousands of times to form a centromere-specific higher order structure. Due to the presence of linker histone H1 within centromeric heterochromatin, CENP-B boxes are located only at every other linker DNA. CENP-B boxes are occupied by CENP-B molecules and nucleosomes have occupied the spaces in between. The binding of CENP-B to CENP-B boxes juxtaposes every two of them via CENP-B dimerisation. Together with the association of CENP-B with CENP-A this leads to nucleosome positioning in a centromere-specific manner. The binding of CENP-C may further stabilise this structure. CENP-C binds via its central and C-terminal domain to CENP-B and is supposed to form tetramers via its N-terminal oligomerisation domain thereby connecting two adjacent CENP-B dimers. CENP-C localisation at kinetochores requires CENP-I amongst others. However, the correct positioning of CENP-I within the inner kinetochore remains uncertain, although its N-terminus seems to interact with the C-terminus of CENP-B and the N-terminus of CENP-C. (red) α-satellite DNA, (grey) centromeric nucleosomes containing CENP-A, (yellow) linker histone H1, (orange) CENP-B, (blue) CENP-C, (green) CENP-I.
Previous studies provided evidence that CENP-C is dependent on other proteins in its function
during mitosis. Centromere targeting of CENP-C requires, beside CENP-A, also CENP-H and
CENP–I. The present study revealed a connection from centromeric DNA via CENP-A and
CENP-B to CENP-C and further between CENP-B, CENP-C to CENP-I. Thus, it was
assumed that the association of CENP-I with CENP-B and CENP-C might support the
binding of CENP-C at kinetochores in a still unknown manner. Due to the absence of
fluorescent-labelled CENP-H molecules at human kinetochores, we could not elucidate the
association of CENP-H with inner kinetochore proteins. However, the functional analysis of
CENP-H led to the assumption, that there may indeed exist a molecular link between CENP-C
and CENP-H. This interplay between CENP-C and CENP-H might be essential for the proper
localisation of both proteins within the complex and possibly leads to a further stabilisation of
the inner kinetochore. Taken together the results suggest that the human kinetochore is

Discussion
93
maintained by multiple protein interactions and associations of the inner kinetochore proteins
CENP-A, -B, -C, and –I at a centromere-specific DNA structure.
4.3. Future perspectives
The results presented here revealed a better understanding of the in vivo kinetochore protein
core that is formed at the interface between centromeric DNA and the inner kinetochore
during interphase. This sub-complex consists of the inner kinetochore proteins CENP-A, -B,
-C, -H and –I and is essential for the maintenance of the centromeric site and the recruitment
of further kinetochore proteins during mitosis.
Based on these results, a 3-dimensional computer model of a “30 nm fibre” was established
(cooperation with J. Sühnel from the department of bio-computing). The model consists of
171 bp α-satellite repeat units that are present at human centromeres. Thus, the linker length
between the nucleosomes is determined to be 25 bp. The model reflects the centromeric DNA
array. Using the FRET results obtained in this thesis and X-ray structures of e.g. parts of the
linker histone H1 and the DNA binding and dimerisation domain of CENP-B, the inner
kinetochore proteins are integrated in this centromere-specific model. It could be shown here
by FRET in vivo, that two to three CENP-A molecules are associated with one CENP-B
molecule. Using this model, it further was demonstrated that the N-terminus of CENP-B and
histone H1 are bound to every other linker and occupy most of the linker DNA. Further
proteins e.g. CENP-C and CENP-I will be deposited onto this centromeric “30 nm fibre”. This
model is used in two different ways:
1. It enables a more detailed insight into the inner kinetochore architecture.
2. It is used for predictions that will be experimentally tested.
In this way, experimental findings can be compared with the virtual structure and vice versa
leading to a refined model and an improved understanding of the kinetochore complex
organisation. The theoretical model will be compared with AFM images of kinetochores
pulled out of human cells (work in progress in the laboratory).
Monitoring protein interactions in vivo using FRET is a new and effective approach solving
the architecture of the centromere kinetochore complex. Thus, the study will be extended to
further kinetochore proteins, e.g. to hMis12 and 11 recently identified inner kinetochore
proteins which have an important impact on kinetochore function (Foltz et al., 2006; Okada et
al., 2006). In dynamic studies analysing inner kinetochore proteins, it was shown that a
fraction of CENP-B molecules was released from the complex during mitosis (Weidtkamp-

Discussion
94
Peters et al., 2006). In addition, the inner kinetochore protein hMis12 seems to interact only
transiently with the kinetochore during interphase and gets stably incorporated into
kinetochores only during mitosis (Weidtkamp-Peters et al., 2006). The mechanism leading to
these different binding modes is not identified yet. Thus, further FRET studies should
elucidate changes of kinetochore protein interactions during the cell cycle that seem to be
important for proper kinetochore formation and function during cell division. Therefore, cells
will be analysed in long-time experiments using FLIM. In first measurements, the
applicability of this approach could be revealed when Cerulean was used as a donor.
The overall objective in our laboratory is to establish an “interactom” of the whole centromere
kinetochore complex including the outer kinetochore that contains motor proteins like CENP-
E and mitotic checkpoint proteins. Many outer kinetochore components are bound to the
complex mainly during mitosis. Thus, the main focus will be directed on kinetochore protein
complexes established during cell division. Solving the interactions of all kinetochore proteins
in vivo should elucidate the correct assembly pathway resulting in a functional kinetochore
complex and the mechanisms leading to aneuploidy due to chromosome missegregation.
Summary
95
5 Summary
The objective of this thesis was to elucidate functional and structural properties of the
kinetochore proteins CENP-A, CENP-B, CENP-C, CENP-H and CENP-I that establish the
central core of the human inner kinetochore. This sub-complex is located at the centromere
during the whole cell cycle and serves as the basis for the formation of a functional
kinetochore complex during mitosis.
In a first set of experiments the function of the constitutive inner kinetochore protein CENP-H
was studied in human HEp-2 cells. The results clearly indicate that CENP-H has an important
impact on the correct assembly and function of the human centromere kinetochore complex.
By specific RNAi knock down, the CENP-H protein level was reduced to less than 5% of its
normal state. Depletion of CENP-H resulted in a decreased cell viability and severe mitotic
phenotypes like misaligned chromosomes and multipolar spindles. However, CENP-H
knocked-down cells did not arrest neither in G2/mitosis nor in G1 phase. CENP-H deficient
kinetochores contained decreased amounts of CENP-C and CENP-E and about half of the
misaligned chromosomes totally failed to recruit CENP-E. However, the content and
localisation of hBubR1 was not affected by CENP-H reduction indicating a functional mitotic
checkpoint at this protein level. Thus, the function of CENP-H is similar in human and
chicken cells, however, important differences were observed.
Furthermore, the interactions of human kinetochore proteins CENP-A, CENP-B, CENP-C and
CENP-I were analysed in vivo at the interface between centromeric DNA and the inner
kinetochore using acceptor bleaching FRET (fluorescence resonance energy transfer) and
FLIM (fluorescence lifetime imaging). An association between the N-terminus of the
centromere-specific histone H3 variant CENP-A and CENP-B could be documented.
Additional interactions of CENP-A with the inner kinetochore proteins CENP-C and CENP-I
were not found in vivo. The interaction of CENP-B molecules via the C-terminal dimerisation
domain could be confirmed in vivo. In addition it was demonstrated that also the N-terminus
is close to the C-terminus of CENP-B within the inner kinetochore of living human cells. The
self-interaction of CENP-B and its association with CENP-A in humans may lead to a specific
chromatin structure at human centromeres. The FRET measurements further verified in vivo
the oligomerisation of N-terminally labelled CENP-C suggesting the formation of tetramers
within the inner kinetochore, and the interaction between CENP-B and CENP-C, both well
described in vitro. Based on the well defined length of centromeric α-satellite DNA and

Summary
96
structurally resolved parts of CENP-B it is assumed that CENP-C tetramers build-up a
connection between neighboured CENP-B dimers.
Additional new interactions within the inner kinetochore were observed: In vivo studies
indicate that both CENP-B and CENP-C interact with CENP-I within the inner human
kinetochore. This interaction might reinforce the binding of CENP-C at centromeric regions.
Finally, the presence of linker histone H1.0 within the human centromere could be
demonstrated by determining its direct vicinity to the inner kinetochore proteins CENP-A,
CENP-B and CENP-C. The binding of CENP-B at CENP-B boxes, probably located within
the linker DNA, suggests that both CENP-B and H1.0 are associated with every other linker.
Based on these results and structural information of inner kinetochore proteins, a 3-
dimensional computer-model of centromeric chromatin was established that consists of α-
satellite DNA. It is consistent with the here presented FRET data and the dynamic behaviour
of inner kinetochore proteins. This model allows a more detailed insight into the inner
kinetochore organisation and suggests the formation of a specific three dimensional chromatin
structure (i) by a specific chromosomal DNA region and (ii) by multiple interactions between
the inner kinetochore proteins CENP-A, CENP-B, CENP-C, CENP-H and CENP-I. These
structural properties of centromeric chromatin are suggested to be essential for the localisation
and the formation of the inner kinetochore sub-complex within humans.

Zusammenfassung
97
6 Zusammenfassung
Im Rahmen dieser Arbeit wurden funktionelle und strukturelle Eigenschaften der
Kinetochorproteine CENP-A, CENP-B, CENP-C, CENP-H und CENP-I, die den zentralen
Kern des humanen inneren Kinetochors aufbauen, analysiert. Die Ausbildung des inneren
Kinetochor-Komplexes an den Centromeren stellt den ersten Schritt bei der Etablierung eines
funktionellen Kinetochors dar und ist somit der Grundstein für eine akkurate
Chromosomensegregation während der Zellteilung.
Im ersten Teil dieser Arbeit wurde die Funktion des konstitutiven inneren Kinetochorproteins
CENP-H in humanen HEp-2-Zellen untersucht. Es konnte gezeigt werden, dass CENP-H eine
essentielle Bedeutung für den korrekten Aufbau und die Funktion des humanen
Centromer/Kinetochor-Komplexes hat. Durch Inhibierung seiner Neusynthese mittels RNAi
wurde die Proteinmenge von CENP-H auf weniger als 5% seines normalen Gehaltes
reduziert. Diese CENP-H-Depletion führte zu einer verringerten Lebensfähigkeit der Zellen.
Phänotypen mit schwerwiegenden Defekten in der Mitose, z.B. inkorrekt angeheftete
Chromosomen und multipolare Mitosespindeln, wurden beobachtet. Allerdings arretierten
diese humanen Zellen weder in G2/Mitose noch in der G1-Phase. Kinetochor-
Proteinkomplexe mit einem reduzierten CENP-H-Gehalt enthielten sowohl weniger CENP-C
als auch weniger CENP-E. Bei etwa der Hälfte der inkorrekt angeheftete Chromosomen
konnte überhaupt kein CENP-E nachgewiesen werden. Der Proteingehalt und die Lage von
hBubR1, einem essentiellen Checkpoint-Protein, wurden dagegen nicht durch CENP-H-
Depletion beeinflusst. Dies weist darauf hin, dass der mitotische Checkpoint auf dieser
Proteinebene noch funktionell intakt ist. Die Funktion von CENP-H ist demnach in Huhn und
Mensch ähnlich, weist aber in wichtigen Punkten auch Unterschiede auf.
Die Interaktionen der humanen Kinetochorproteine CENP-A, CENP-B, CENP-C und CENP-I
wurden an der Grenzfläche zwischen centromerischer DNA und dem inneren Kinetochor
mittels acceptor bleaching FRET (Fluoreszenz-Resonanz-Energietransfer) und FLIM
(Fluoreszenz-Lebenszeit-Messungen) in vivo untersucht. Es konnte eine Assoziation zwischen
der N-terminalen Proteinregion der centromer-spezifischen Histon H3-Variante CENP-A und
einem weiteren inneren Kinetochorprotein, CENP-B, nachgewiesen werden. Interaktionen
von CENP-A mit den inneren Kinetochorproteinen CENP-C und CENP-I wurden im Rahmen
dieser in vivo Studien nicht gefunden. Weiterhin konnte in vivo die Dimerisierung von CENP-
B-Molekülen mittels ihrer C-terminalen Domäne bestätigt werden. Zusätzlich wurde bei den
FRET-Untersuchungen gezeigt, dass auch N- und C-Terminus der CENP-B-Moleküle
Zusammenfassung
98
miteinander assoziiert sind. Die beobachteten Interaktionen von CENP-B mit sich selbst und
CENP-A führen vermutlich zu einer spezifischen Chromatin-Struktur am humanen
Centromer. Die im Rahmen der Arbeit durchgeführten FRET-Messungen bestätigten in vivo
die Interaktion N-terminal markierter CENP-C-Moleküle, die möglicherweise im inneren
Kinetochor in Form von Tetrameren vorliegen. Die Interaktion zwischen CENP-B und
CENP-C, die ebenfalls in vitro beobachtet wurde, konnte in dieser Arbeit auch in lebenden
Zellen bestätigt werden. Aufgrund der definierten Länge der am Centromer vorkommenden
α-Satelliten-DNA und Kristallstrukturinformationen über CENP-B wird angenommen, dass
die CENP-C-Tetramere eine Verbindung zwischen benachbarten CENP-B-Dimeren innerhalb
des Kinetochors herstellen. Zusätzlich konnten bislang noch unbekannte Interaktionen im
inneren Kinetochor nachgewiesen werden: Die in vivo Untersuchungen deuten darauf hin,
dass sowohl CENP-B als auch CENP-C mit CENP-I im humanen Kinetochor interagieren.
Diese Protein-Interaktionen verstärken möglicherweise die Bindung von CENP-C am
Kinetochor. Schließlich konnte festgestellt werden, dass Linker-Histons H1.0 am humanen
Centromer vorhanden ist: es interagiert mit den inneren Kinetochorproteinen CENP-A,
CENP-B und CENP-C. Da CENP-B vermutlich ebenfalls die Linker-Region zwischen den
centromerischen Nucleosomen besetzt, wird vermutet, dass CENP-B und H1.0 jeweils jede
zweite Linker-DNA binden.
Basierend auf diesen Ergebnissen und bekannten Strukturdaten innerer Kinetochorproteine
wurde ein 3-dimensionales Computermodell von centromerischem Chromatin erstellt, das aus
α-Satelliten-DNA aufgebaut ist. Es ist konsistent mit den hier erhaltenen Energietransfer-
Daten und dem dynamischen Verhalten der Proteine des inneren Kinetochors. Das Modell
erlaubt einen detaillierten Einblick in die Architektur des inneren Kinetochors. Es postuliert,
dass strukturelle Eigenschaften des centromerischen Chromatins, induziert durch multiple
Kinetochorprotein-Interaktionen, für die Lage und den Aufbau des inneren Kinetochor-
Subkomplexes im Menschen von essentieller Bedeutung sind.

References
99
7 References
Abrieu A, Kahana JA, Wood KW and Cleveland DW (2000) CENP-E as an essential component of the mitotic checkpoint in vitro. Cell 102: 817-826
Albig W, Meergans T and Doenecke D (1997) Characterization of the H1.5 gene completes the set of human H1 subtype genes. Gene (Amsterdam) 184: 141-148
Alexandrov IA, Mashkova TD, Akopian TA, Medvedev LI, Kisselev LL, Mitkevich SP and Yurov YB (1991) Chromosome-specific alpha satellites: two distinct families on human chromosome 18. Genomics 11: 15-23
Alexandrov I, Kazakov A, Tumeneva I, Shepelev V and Yurov Y (2001) α-satellite DNA of primates: old and new families. Chromosoma 110: 253-266
Allan J, Hartman PG, Crane-Robinson C and Aviles FX (1980) The structure of histone H1 and its location in chromatin. Nature 288: 675-679
Allan J, Mitchell T, Harborne N, Bohm L and Crane-Robinson C (1986) Roles of H1 domains in determining higher order chromatin structure and H1 location. J. Mol. Biol. 187: 591-601
Amor DL and Choo KH (2002) Neocentromeres: role in human disease, evolution, and centromere study. Am. J. Hum. Genet. 71: 695-714
Amor DJ, Kalitsis P, Sumer H and Choo KHA (2004) Building the centromere: from foundation proteins to 3D organisation. Trends Cell Biol. 14: 359-368
Ando S, Yang H, Nozaki N, Okazaki T and Yoda K (2002) Cenp-A, Cenp-B and Cenp-C chromatin complex that contains the I-type alpha-satellite array constitutes the prekinetochore in HeLa cells. Mol. Cell Biol. 22: 2229-2241
Basu J, Stromberg G, Compitello G, Willard HF and van Bokkelen G (2005) Rapid creation of BAC-based human artificial chromosome vectors by transposition with synthetic alpha-satellite arrays. Nucl. Acid Res. 33: 587-596
Bernard P (2001) Requirement of heterochromatin for cohesion at centromeres. Science 294: 2539-2542 Berney C and Danuser G (2003) FRET or no FRET: a quantitative comparison. Biophys. J. 84: 3992-4010 Bharath MM, Ramesh S, Chandra NR and Rao MR (2002) Identification of a 34 amino acid stretch within the C-
terminus of histone H1 as the DNA-condensing domain by site-directed mutagenesis. Biochemistry 41: 7617-7627
Biskup C, Kelbauskas L, Zimmer T, Benndorf K, Bergmann A, Becker W, Ruppersberg JP, Stockklausner C and Klöcker N (2004a) Interaction of PSD-95 with potassium channels visualized by fluorescence- lifetime based resonance energy transfer imaging. J. Biomed. Opt. 9: 753-759.
Biskup C, Zimmer T and Benndorf K (2004b) FRET between cardiac Na+ channel subunits measured with a confocal microscope and a streak camera. Nat. Biotechnol. 22: 220-224
Biskup C, Kelbauskas L, Zimmer T, Hoffmann B, Klöcker N, Becker W, Bergmann A and Benndorf K (2006) Multi-dimensional fluorescence lifetime and FRET measurements. in preparation
Black BE, Foltz DR, Chakravarthy S, Luger K, Woods VL Jr and Cleveland DW (2004) Structural determinants for generating centromeric chromatin. Nature 430: 578-582
Blower MD and Karpen GH (2001) The role of Drosophila CID in kinetochore formation, cell-cycle progress and heterochromatin interactions. Nat. Cell Biol. 3: 730-739
Blower MD, Sullivan BA and Karpen GH (2002) Conserved organisation of centromeric chromatin in flies and humans. Dev. Cell 2: 319-330
Brown D, Izard T and Misteli T (2006) Mapping the interaction surface of the linker H1 with the nucleosome of native chromatin in vivo. Nat. Struct. Mol. Biol. 13: 250-255
Chan GK, Schaar BT and Yen TJ (1998) Characterization of the kinetochore binding domain of CENP-E reveals interactions with the kinetochore proteins CENP-F and hBUBR1. J. Cell Biol. 143: 49–63
Chan GK, Liu ST and Yen TJ (2005) Kinetochore structure and function. Trends Cell Biol. 15: 589-598 Choo KHA (1997) The centromere. Oxford University Press, Oxford Cimini D and Degrassi F (2005) Aneuploidy: a matter of bad connections. Trends Cell Biol. 15: 442-451 Clegg RM (1996) Fluorescence resonance energy transfer. In: Fluorescence Imaging Spectroscopy and
Microscopy. Wang XF, Herman B, editors. John Wiley & Sons, Chemical Analysis Series, Vol 137, New York, pp.179-251
Cleveland DW, Mao Y and Sullivan KF (2003) Centromeres and Kinetochores: from epigentics to mitotic checkpoint signalling. Cell 112: 407-421
Cole RD (1987) Microheterogeneity in H1 histones and its consequences. Int. J. Pept. Protein Res. 30 : 433-449 Cooke CA, Bernat RL and Earnshaw WC (1990) CENP-B: a major human centromere protein located beneath
the kinetochore. J. Cell Biol. 110: 1475–1488 Creemers TM, Lock AJ, Subramaniam V, Jovin TM and Völker S (1999) Three photoconvertible forms of green
fluorescent protein identified by spectral hole-burning. Nat. Struct. Biol. 6: 557-560

References
100
Croston GE, Kerrigan LA, Lira LM, Marshak DR and Kadonaga J (1991) Sequence-specific antirepression of histone H1-mediated inhibition of basal RNA polymerase II transcription. Science 251: 643-649
Davey CA, Sargent DF, Luger K, Maeder AW and Richmond TJ (2002) Solvent mediated interactions in the structure of the nucleosome core particle at 1.9 Ả resolution. J. Mol. Biol. 319: 1097-1113
DeLuca JG, Dong Y, Hergert P, Strauss J, Hickey JM, Salmon ED and McEwen BF (2005) Hec1 and Nuf2 are core components of the kinetochore outer plate essential for organising microtubule attachment sites. Mol. Biol. Cell 16: 519- 531
Earnshaw WC, Sullivan KF, Machlin PS, Cooke CA, Kaiser DA, Pollard TD, Rothfield NF and Cleveland DW (1987) Molecular cloning of cDNA for CENP-B, the major human centromere autoantigen. J. Cell Biol. 104: 817–829
Elbashir SM, Harborth J, Lendeckel W, Yalcin A, Weber K and Tuschl T (2001) Duplexes of 21-nucleotide RNAs mediate RNA interference in cultured mammalian cells. Nature 411: 494-498
Fischle W, Wang Y and Allis CD (2003) Histone and chromatin cross-talk. Curr. Opin. Cell Biol. 15: 172-183 Fletcher TM and Hansen JC (1996) The nucleosomal array: structure/function relationships. Crit. Rev. Eukaryot.
Gene Expr. 6:149-188 Foltz DR, Jansen LET, Black BE, Bailey AO, Yates III JR and Cleveland DW (2006) The human CENP-A
centromeric complex. Nat. Cell Biol. 8:458-469 Förster T (1948) Zwischenmolekulare Energiewanderung und Fluoreszenz. Ann. Phys. 2: 55-75 Förster T (1949a) Versuche zum zwischenmolekularen Übergang von Elektronenanregungsenergie. Z.
Elektrochem. 53: 93-99 Förster T (1949b) Experimentelle und theoretische Untersuchung des zwischenmolekularen Überganges von
Elektronenanregungsenergie. Z. Naturforsch. 4A: 321-327 Förster T (1959) Transfer mechanisms of electronic excitation. Discuss. Faraday Soc. 27: 7-17 Fukagawa T and Brown W (1997) Efficient conditional mutation of the vertebrate CENP-C gene. Hum. Mol.
Genet. 6: 2301-2308 Fukagawa T, Pendon C, Morris J and Brown W (1999) CENP-C is necessary but not sufficient to induce
formation of functional centromere. EMBO J. 18: 4196-4209 Fukagawa T, Mikami Y, Nishihashi A, Regnier V, Haraguchi T, Hiraoka Y, Sugata N, Todokoro K, Brown W
and Ikemura T (2001) CENP-H, a constitutive centromere component, is required for centromere targeting of CENP-C in vertebrate cells. EMBO J. 20: 4603-4617
Furrer P, Bednar J, Dubochet J, Hamiche A and Prunell A (1995) DNA at the entry-exit of the nucleosome observed by cryoelectron microscopy. J. Struct. Biol. 114: 177-183
Ge Y, Wagner MJ, Siciliano M and Wells DE (1992) Sequence, higher order repeat structure, and long-range organization of alpha-satellite DNA specific to chromosome 8. Genomics 13: 585-593
Gilbert N and Allan J (2001) Distinctive higher-order chromatin structure at mammalian centromeres. Proc. Natl. Acad. Sci. USA 98: 11949-11954
Goldman RD and Spector DL (2005) Live cell imaging. A laboratory manual. Cold Spring Harbor Laboratory Press, Cold Spring Harbor, N.Y.
Goshima G, Kiyomitsu T, Yoda K and Yanagida M (2003) Human centromere chromatin protein hMis12, essential for equal segregation, is independent of CENP-A loading pathway. J. Cell Biol. 160: 25-39
Harrington JJ, Bokkelen GV, Mays RW, Gustashaw K and Willard HF (1997) Formation of de novo centromeres and construction of first-generation human artificial minichromosomes. Nature Genet. 15: 1-11
Harris L, Davenport J, Neale G and Goorha R (2005) The mitotic checkpoint gene BubR1 has two distinct functions in mitosis. Exp. Cell Res. 308: 85-100
Harvey AC and Downs JA (2004) What functions do linker histones provide? Mol. Microbiol. 53: 771-775 Hendzel MJ, Lever MA, Crawford E and Th´ng JP (2004) The C-terminal domain is the primary determinant of
histone H1 binding to chromatin in vivo. J. Biol. Chem. 279: 20028-20034 Henikoff S and Dalal Y (2005) Centromeric chromatin: what makes it unique? Curr. Opin. Gen. Dev. 15: 177-
184 Heun P, Erhardt S, Blower MD, Weiss S, Skora A and Karpen GH (2006) Mislocation of the Drosophila
centromere-specific histone CID promotes formation of functional ectopic kinetochores. Dev. Cell 10: 303-315
Hink MA, Visser NV, Borst JW, van Hoek A and Visser AJWG (2003) Practical use of corrected fluorescence excitation and emission spectra of fluorescent proteins in Förster resonance energy transfer (FRET) studies. J. Fluoresc. 13: 185-188.
van Hooser AA, Ouspenski II, Gregson HC, Starr DA, Yen TJ, Goldberg ML, Yokomori K, Earnshaw WC, Sullivan KF and Brinkley BR (2001) Specification of kinetochore-forming chromatin by the histone H3 variant CENP-A. J. Cell Sci. 114: 3529-3542
Howman EV, Fowler KJ, Newson AJ, Redward S, MacDonald AC, Kalitsis P and Choo KHA (2000) Early disruption of centromeric chromatin organisation in centromere protein A (CENP-A) null mice. Proc. Natl. Acad. Sci. USA 97: 1148-1153

References
101
Hudson DF, Fowler KJ, Earle E, Saffery R, Kalitsis P, Trowell H, Hill J, Wereford NG, de Kretser DM, Cancilla MR, Howman E, Hii L, Cutts SM, Irvine DV and Choo KH (1998) Centromere protein B null mice are mitotically and meiotically normal but have lower body and testis weights. J. Cell Biol. 141: 309-319
Ikeno M, Masumoto H and Okazaki T (1994) Distribution of CENP-B boxes reflected in CREST centromere antigenic sites on long-range α-satellite DNA arrays of human chromosome 21. Hum. Mol. Genet. 3: 1245-1257
Ikeno M, Grimes B, Okazaki T, Nakano M, Saitoh K, Hoshino H, McGill NI, Cooke H and Masumoto H (1998) Construction of YAC based mammalian artificial chromosomes. Nature Biotech. 16: 431-439
Jin W, Melo JR, Nagaki K, Talbert PB, Henikoff S, Dawe RK and Jiang J (2004) Maize centromeres: organisation and functional adaptation in the genetic background of oat. Plant Cell 16: 571-581
Karpova TS, Baumann CT, He L, Wu X, Grammer A, Lipsky P, Hager GL, and McNally JG (2003) Fluorescence resonance energy transfer from cyan to yellow fluorescent protein detected by acceptor photobleaching using confocal microscopy and a single laser. J. Mciroscopy 209: 56-70
Kenworthy A (2001) Imaging protein-protein interactions using fluorescence resonance energy transfer microscopy. Methods 24: 289-296
Kiesslich A, von Mikecz A and Hemmerich P (2002) Cell cycle-dependent association of PML bodies with sizes of active transcription in nuclei of mammalian cells. J. Struct. Biol. 140: 167-179
Kimura H and Cook P (2001) Kinetics of core histones in living human cells: little exchange of H3 and H4 and some rapid exchange of H2B. J. Cell Biol. 153: 1341-1351
Kipling D and Warburton PE (1997) Centromeres, CENP-B and Tigger too. Trends Genet. 13: 141-145 Kitagawa K, Masumoto H, Ikeda M and Okazaki T (1995) Analysis of protein-DNA and protein-protein
interactions of centromere protein B (CENP-B) and properties of the DNA-CENP-B complex in the cell cycle. Mol. Cell Biol. 15: 1602-1612
Kops GJ, Weaver BA and Cleveland DW (2005) On the road to cancer: aneuploidy and the mitotic checkpoint. Nat. Rev. Cancer 10: 773-785
Kornberg RD (1977) Structure of chromatin. Annu. Rev. Biochem. 46: 931–954 Kornberg RD and Lorch Y (1995) Interplay between chromatin structure and transcription. Curr. Opin. Cell
Biol. 7: 371-375 Lakowicz JR (1999) "Principles of fluorescence spectroscopy", Kluwer Academic / Plenum Publishers, New
York Lanini L and McKeon F (1995) Domain required for CENP-C assembly at the kinetochore. Mol. Biol. Cell 6:
1049-1059 Li X and Nicklas RB (1995) Mitotic forces control a cell-cycle checkpoint. Nature 373: 630-632 Liu ST, Hittle JC, Jablonski SA, Campbell MS, Yoda K and Yen TJ (2003) Human CENP-I specifies
localisation of CENP-F, Mad1 and Mad2 to kinetochores and is essential for mitosis. Nat. Cell Biol. 5: 341-345
Luger K, Mäder AW, Richmond RK, Sargent DF and Richmond TJ (1997) Crystal structure of the nucleosome core particle at 2.8 Ǻ resolution. Nature 389: 251-260
Luger K and Hansen JC (2005) Nucleosome and chromatin fiber dynamics. Curr. Opin. Struct. Biol. 15: 188-196 Malvezzi-Campeggi F, Jahnz M, Heinze KG, Dittrich P and Schwille P (2001) Light-induced flickering of
DsRed provides evidence for distinct and interconvertible fluorescent states. Biophys. J. 81: 882-887 Mamoon N, Song Y and Wellman SE (2002) Histone H1(0) and its carboxyl-terminal domain bind in the major
groove of DNA. Biochemistry 41: 9222-9228 Mao Y, Abrieu A and Cleveland DW (2003) Activating and silencing the mitotic checkpoint through CENP-E
dependent activation/inactivation of BubR1. Cell 114: 87-98 Mao Y, Desai A and Cleveland DW (2005) Microtubule capture by CENP-E silences BubR1-dependent mitotic
checkpoint signalling. J. Cell Biol. 170: 873-880 Masumoto H, Masukata H, Muro Y, Nozaki N and Okazaki T (1989) A human centromere antigen (CENP-B)
interacts with a short specific sequence in alphoid DNA, a human centromeric satellite. J. Cell Biol. 109: 1963-1973
Masumoto H, Ikeno M, Nakano M, Okazaki T, Grimes B, Cooke H and Suzuki N (1998) Assay of centromere function using a human artificial chromosome. Chromosoma 107: 406-416
Measdy V, Hailey DW, Pot I, Givan SA, Hyland KM, Cagney G, Fields S, Davis TN and Hieter P (2002) Ctf3, the Mis6 budding yeast homolog, interacts with Mcm22p and Mcm16p at the yeast outer kinetochore. Genes Dev. 16: 101-113
Meluh PB, Yang P, Glowczewski L, Koshland D and Smith MM (1998) Cse4p is a component of the core centromere of Sacharomyces cerevisiae. Cell 94: 607-613
Mikami Y, Hori T, Kimura H and Fukagawa T (2005) The functional region of CENP-H interacts with the Nuf2 complex that localises to centromere during mitosis. Mol. Cell Biol. 25: 1958-1970
von Mikecz A, Zhang S, Montminy M, Tan EM and Hemmerich P (2000) CREB-binding protein (CBP)/p300 and RNA polymerase II colocalise in transcriptionally active domains in the nucleus. J. Cell Biol. 150: 265-273
References
102
Muro Y, Sugimoto K, Himeno M and Ohashi M (1992) The clinical expression in anticentromere antibody-positive patients is not specified by the epitope recognition of CENP-B antigen. J. Dermatol. 19: 584-91
Nishihasi A, Haraguchi T, Hiraoka Y, Ikemura T, Regnier V, Dodson H, Earnshaw WC and Fukagawa T (2002) CENP-I is essential for centromere function in vertebrate cells. Dev. Cell 2: 463-476
Nonaka N (2002) Recruitment of cohesin to heterochromatic regions by Swi6/HP1 in fission yeast. Nat. Cell Biol. 4: 89-93
Obuse C, Iwasaki O, Kiyomitsu T, Goshima G, Toyoda Y and Yanagida M (2004) A conserved Mis12 centromere complex is linked to heterochromatic HP1 and outer kinetochore protein Zwint-1. Nat. Cell Biol. 6: 1135-1141
O´Connor DV and Phillips D (1984). Time correlated single photon counting. Academic Press, New York Ohzeki J, Nakano M, Okada T and Masumoto H (2002) CENP-B box is required for de novo centromere
chromatin assembly on human alphoid DNA. J. Cell Biol. 159: 765-775 Okada M, Cheeseman IM, Hori T, Okawa K, McLeod IX, Yates III JR, Desai A and Fukagawa T (2006) The
CENP-H-I complex is required for the efficient incorporation of newly synthesized CENP-A into centromeres. Nat. Cell Biol. 8: 446-457
Orthaus S, Ohndorf S and Diekmann S (2006) RNAi knock down of human kinetochore protein CENP-H. BBRC 348: 36-46
Patterson GH, Knobel SM, Sharif WD, Kain SR and Piston DW (1997) Use of the green fluorescent protein and its mutants in quantitative fluorescence microscopy. Biophys. J. 73: 2782-2790
Patterson GH, Piston DW and Barisas BG (2000) Förster distances between green fluorescent protein pairs. Anal. Biochem. 284: 438-440
Perrin J (1927) Fluorescence et induction moléculaire par résonance. C. R. Hebd. Seances Acad. Sci. 184: 1097-1100
Pluta AF, Saitoh N, Goldberg I and Earnshaw WC (1992) Identification of a subdomain of CENP-B that is necessary and sufficient for localization to the human centromere. J. Cell Biol. 116: 1081–1093
Pluta AF, Mackay AM, Ainszein AM, Goldberg IG and Earnshwa WC (1995) The centromere: hub of chromosomal activities. Science 270: 1591-1594
Politi V, Perini G, Trazzi S, Pliss A, Rask I, Earnshaw WC and Della Valle G (2002) CENP-C binds the alpha-satellite DNA in vivo at specific centromere domains. J. Cell Sci. 115: 2317-2327
Putkey FR, Cramer T, Morphew MK, Silk AD, Johnson RS, McIntosh JR and Cleveland DW (2002) Unstable kinetochore-microtubule capture and chromosomal instability following deletion of CENP-E. Dev. Cell 3: 351-365
Ramakrishnan V (1997) Histone H1 and chromatin higher-order structure. Crit. Rev. Eukaryot. Gene Express. 7: 215-230
Regnier V, Novelli J, Fukagawa T, Vagnarelli P and Brown W (2003) Characterisation of chicken CENP-A and comparative sequence analysis of vertebrate centromere-specific histone H3-like proteins. Gene 316: 39-46
Regnier V, Vagnarelli P, Fukagawa T, Zerjal T, Burns E, Trouche D, Earnshaw W and Brown W (2005) CENP-A is required for accurate chromosome segregation and sustained kinetochore association of BubR1. Mol. Cell Biol. 25: 3967-3981
Rieder CL, Schultz A, Cole R and Sluder G (1994) Anaphase onset in vertebrate somatic cells is controlled by a checkpoint that monitors sister kinetochore attachment to the spindle. J. Cell Biol. 127: 1301-1310
Rizzo M, Springer G, Granada B and Piston D (2004) An improved cyan fluorescent protein variant useful for FRET. Nat. Biotech. 22: 445-449
Schueler MG, Higgins AW, Rudd MK, Gustashaw K and Willard HF (2001) Genomic and genetic definition of a functional human centromere. Science 294: 109-115
Shaner NC, Steinbach PA and Tsien RY (2005) A guide to choosing fluorescent proteins. Nature Methods 2: 905-909
Shelby RD, Vafa O and Sullivan KD (1997) Assembly of CENP-A into centromeric chromatin requires a cooperative array of nucleosomal DNA contact sites. J. Cell Biol. 136: 501-513
Shelby RD, Monier K, and Sullivan KF (2000) Chromatin assembly at kinetochores is uncoupled from DNA replication. J. Cell Biol. 151: 1113-1118
Sivolob A and Prunell A (2003) Linker histone-dependent organisation and dynamics of nucleosome entry/exit DNAs. J. Mol. Biol. 331: 1025-1040
Song K, Gronemeyer B, Lu W, Eugster E and Tomkiel JE (2002) Mutational analysis of the central centromere targeting domain of human centromere protein C (CENP-C). Exp. Cell Res. 275: 81-91
Stoler S, Keith KC, Curnick KE and Fitzgerald-Hayes M (1995) A mutation in CSE4, en essential gene encoding a novel chromatin-associated protein in yeast, causes chromosome nondisjunction and cell cycle arrest at mitosis. Genes Dev. 9: 573-586
Strahl BD and Allis CD (2000) The language of bivalent histone modifications. Nature 403: 41-45 Stryer L (1978) Annu. Rev. Biochem. 67: 509

References
103
Sugata N, Munekata E and Todokoro K (1999) Characterisation of a novel kinetochore protein, CENP-H. J. Biol. Chem. 274: 27343-27346
Sugata N, Li S, Earnshaw WC, Yen TJ, Yoda K, Masumoto H, Munekata E, Warburton PE and Todokoro K (2000) Human CENP-H multimers colocalize with CENP-A and CENP-C at active centromere-kinetochore complexes. Hum. Mol. Genet. 9: 2919-2926
Sugimoto K, Yata H, Muro Y and Himeno M (1994) Human centromere protein C (CENP-C) is a DNA-binding protein which possesses a novel DNA-binding motif. J. Biochem. 116: 877-881
Sugimoto K, Kuriyama K, Shibata A and Himeno M (1997) Characterization of internal DNA-binding and C-terminal dimerisation domains of human centromere/kinetochore autoantigen CENP-C in vitro: role of DNA-binding and self-associating activities in kinetochore organization. Chrom. Res. 5: 581-592
Suhling K, Siegel J, Phillips D, French PMW, Lévêque-Fort S, Webb SED and Davis DM (2002) Imaging the environment of green fluorescent protein. Biophys. J. 83: 3589-3595
Sullivan BA and Schwartz S (1995) Identification of centromeric antigens in dicentric Robertsonian translocations: CENP-C and CENP-E are necessary components of functional centromeres. Hum. Mol. Genet. 4: 2189-2197
Sullivan BA, Blower MD and Karpen GH (2001) Determining centromere: cyclical stories and forking paths. Nature Review 2: 584–589
Suzuki N, Nagano M, Nozaki N, Egashira S, Okazaki T and Masumoto H (2004) CENP-B interacts with CENP-C domains containing Mif2 regions responsible for centromere localization. J. Biol. Chem. 279: 5934-5946
Takahashi K, Chen ES and Yanagida M (2000) Requirement of Mis6 centromere connector for localising a CENP-A like protein in fission yeast. Science 288: 2215-2219
Talbert PB, Bryson TD and Henikoff S (2004) Adaptive evolution of centromere proteins in plants and animals. J. Biol. 3: 18
Tanaka Y, Nureki O, Kurumizaka H, Fukai S, Kawaguchi S, Ikuta M, Iwahara J, Okazaki T and Yokoyama S (2001) Crystal structure of the CENP-B protein-DNA complex: the DNA-binding domains of CENP-B induce kinks in the CENP-B box DNA. EMBO J 20: 6612-6618
Tanaka Y, Tachiwana H, Yoda K, Masumoto H and Okazaki T (2005) Human centromere protein B induces translational positioning of nucleosomes on α-satellite sequences. J. Biol. Chem. 280: 41609-41618
Tanudji M, Shoemaker J, L´Italien L, Russell L, Chin G and Schebye XM (2004) Gene silencing of CENP-E by small interfering RNA in HeLa cells leads to missegregation of chromosomes after a mitotic delay. Mol. Biol. Cell 15: 3771-3781
Tawaramoto MS, Park SY, Tanaka Y, Nureki O, Kurumizaka H and Yokoyama S (2003) Crystal structure of the human centromere protein B (CENP-B) dimerization domain at 1.65-Ả resolution. J. Biol. Chem. 278: 51454–51461
Thoma F and Koller T (1977) The influence of histone H1 on chromatin structure. Cell 12: 101-107 Thomas JO (1999) Histone H1: location and role. Curr. Opin. Cell Biol. 11: 312-317 Tomkiel J, Cooke CA, Saitoh H, Bernat RL and Earnshaw WC (1994) CENP-C is required for maintaining
proper kinetochore size and for a timely transition to anaphase. J. Cell Biol. 125: 531-545 Tomonaga T, Matsushita K, Ishibashi M, Nezu M, Shimada H, Ochiai T, Yoda K and Nomura F (2005)
Centromere protein H is up-regulated in primary human colorectal cancer and its overexpression induces aneuploidy. Cancer Res. 65: 4683-4689
Trazzi S, Bernardoni R, Diolaiti D, Politi V, Earnshaw WC, Perini G and Della Valle G (2002) In Vivo functional dissection of human inner kinetochore protein CENP-C. J. Struct. Biol. 140: 39-48
Treanor B, Lanigan PM, Suhling K, Schreiber T, Munro I, Neil MAA, Philipps D, Davis DM and French PWM (2005) Imaging fluorescence lifetime heterogenity applied to GFP-tagged MHC protein at an immunological synapse. J Microsc 217: 36-43
Van der Meer BW, Coker III G and Chen SY (1994) Resonance energy transfer: theory and data. New York: VCH Publishers
Verreault A (2003) Histone deposition at the replication fork: a matter of urgency. Mol Cell 11: 283-284 Wachsmuth M, Weidemann T, Muller G, Hoffmann-Rohrer UW, Knoch TA, Waldeck W and Langowski J
(2003) Analyzing intracellular binding and diffusion with continuous fluorescence photo-bleaching. Biophys J 84: 3353-3363
Weaver BAA, Bonday ZQ, Putkey FR, Silk AD and Cleveland DW (2003) CENP-E is essential for the mammalian mitotic checkpoint to prevent aneuploidy from single chromosome loss. J. Cell Biol. 162: 551-63
Weidemann T, Wachsmuth M, Knoch TA, Muller G, Waldeck W and Langowski J (2003) Counting nucleosomes in living cells with a combination of fluorescence correlation spectroscopy and confocal imaging. J. Mol. Biol. 334: 229-240
Weidtkamp-Peters S, Hoischen C, Schmiedeberg L, Erliandri I and Diekmann S (2006) Centromere maintenance trough stable and dynamic binding of inner kinetochore proteins. submitted to J. Cell Biol.

References
104
Westermann S, Cheeseman IM, Anderson S, Yates III JR, Drubin DG and Barnes G (2003) Architecture of the budding yeast kinetochore reveals a conserved molecular core. JCB 163: 215-222
Whitlock JP Jr and Simpson RT (1976) Removal of histone H1 exposes a fifty base pair DNA segment between nucleosomes. Biochemistry 15: 3307-3314
Widom J (1992) A relationship between the helical twist of DNA and the ordered positioning of nucleosomes in all eukaryotic cells. Proc. Nat. Acad. Sci USA 89: 1095-1099
Wieland G, Orthaus S, Ohndorf S, Diekmann S and Hemmerich P (2004) Functional complementation of human centromere Protein A (CENP-A) by Cse4 from S. cerevisiae. Mol Cell Biol 24: 6620-6630
Wolffe AP, Khochbin S and Dimitrov S (1997) What do linker histones do in chromatin? Bioessays 19: 249-255 Woodcock CL, Skoutchi AI and Fan Y (2006) Role of linker histone in chromatin structure and function: H1
stoichiometry and nucleosome repeat length. Chromosome Res. 14: 17-25 Yang CH, Tomkiel J, Saitoh H, Johnson D and Earnshaw WC (1996) Identification of overlapping DNA-binding
and centromere-targeting domains in the human kinetochore protein CENP-C. Mol Cell Boil 16: 3576-3586
Yao X, Abrieu A, Zheng Y, Sullivan KF and Cleveland DW (2000) CENP-E forms a link between attachment of spindle microtubules to kinetochores and the mitotic checkpoint. Nature Cell Biol 2: 484-491
Yoda K, Kitagawa K, Masumoto H, Muro Y and Okazaki T (1992) A human centromere protein, CENP-B, has a DNA binding domain containing four potential alpha helices at the NH2 terminus, which is separable from dimerising activity. J Cell Biol 119: 1413-1427
Yoda K, Ando S, Okuda A, Kikuchi A and Okazaki T (1998) In vitro assembly of the CENP-B/α-satellite DNA/core histone complex: CENP-B causes nucleosome positioning. Gene. Cell 3: 533-548
Zacharias D, Violin J, Newton A and Tsien R (2002) Partitioning of lipid-modified monomeric GFPs into membrane microdomains of living cells. Science 296: 913-916
Zlatanova J, Caiafa P and Van Holde K (2000) Linker histone binding and displacement: versatile mechanism for transcriptional regulation. FASEB J. 14: 1697-1704

Selbständigkeitserklärung i
• Hiermit erkläre ich, dass mir die geltende Promotionsordnung der Biologisch-
Pharmazeutischen Fakultät der Friedrich-Schiller-Universität Jena bekannt ist,
ich die vorliegende Dissertation selbst angefertigt habe und alle benutzten
Hilfsmittel, persönlichen Mitteilungen und benutzten Quellen angegeben habe.
• Alle Personen, die mich bei der Auswahl und Auswertung des Materials sowie
bei der Herstellung des Manuskripts unterstützt haben, habe ich benannt.
• Ich habe nicht die Hilfe eines Promotionsberaters in Anspruch genommen.
• Dritte Personen haben weder unmittelbar noch mittelbar geldwerte Leistungen
von mir für Arbeiten erhalten, die im Zusammenhang mit dem Inhalt der
vorgelegten Dissertation stehen.
• Die vorliegende Arbeit wurde nicht als Prüfungsarbeit für eine staatliche oder
andere wissenschaftliche Prüfung eingereicht. Sie wurde ebenso auch nicht als
Dissertation bei einer anderen Hochschule eingereicht.
Jena, den 10. August 2006

Curriculum vitae ii
Sandra Orthaus [email protected]
OFFICE Leibniz Institute for Age Research Fritz Lipmann Institute e.V. Department of Molecular Biology Beutenbergstraße 11 D-07745 Jena Germany +49 (0)3641 656 185
HOME Friedrich-Engels-Str. 55 D-07749 Jena Germany +49 (0)3641 666 070
ACADEMIC EDUCATION
Since May 2003 Ph.D. Thesis
“Towards the architecture of the human inner kinetochore”
Leibniz Institute for Age Research, Fritz Lipmann Institute e.V. Department of Molecular Biology Advisor: Prof. Dr. Stephan Diekmann
May 2002 – February 2003 Diploma Thesis
“Structural and Functional Homologies of the Inner and Outer Kinetochor Proteins between Saccharomyces cerevisiae and Human”
Institute for Molecular Biotechnology e.V., Jena Department of Molecular Biology Advisor: Prof. Dr. Stephan Diekmann Grade: 1,3
October 1993 – February 2003 Study of Biology
Friedrich Schiller University, Jena Grade: 1,2
HONORS EXIST High Technology Entrepreneurship Post-graduate Program (HighTEPP) 03EXHT02, founded by BMBF
PREACADEMIC EDUCATION
1993 general qualification for university entrance (“Abitur”)
Adolf Reichwein Gymnasium, Jena Grade: 1,2
1985 – 1993 High School (Gymnasium) Adolf Reichwein Gymnasium, Jena
1983 – 1985 Secondary school Polytechnische Oberschule „Julius Schaxel“, Jena
1981 – 1983 Primary school Polytechnische Oberschule „Emil Wölk“, Jena
DATE OF BIRTH 2nd of July, 1974
PLACE OF BIRTH Jena

Publications, posters and scientific talks iii
Wieland G, Orthaus S, Ohndorf S, Diekmann S, Hemmerich P (2004) Functional
complementation of human centromere protein A (CENP-A) by Cse4 from S. cerevisiae. Mol
Cell Biol 24: 6620-6630
Parts of this thesis have been published and presented as follows:
Publication
S. Orthaus, S. Ohndorf and S. Diekmann (2006) RNAi knock-down of human kinetochore
protein CENP-H. BBRC 348: 36-46
S. Orthaus, C. Biskup, B. Hoffmann, S. Ohndorf, C. Hoischen, K. Benndorf and S.
Diekmann, Assembly of the inner kinetochore proteins CENP-A and CENP-B in living
human cells. in preparation
S. Orthaus, C. Biskup, B. Hoffmann, I. Erliandri, S. Pfeifer, C. Hoischen, and S. Diekmann,
Interaction studies of the inner kinetochore proteins CENP-B, CENP-C and CENP-I in living
human cells. in preparation
S. Orthaus, C. Biskup, B. Hoffmann, M. Koch C. Hoischen, and S. Diekmann, Linker histone
H1 is present in centromeric chromatin of living human cells. in preparation
Scientific talks
S. Orthaus: Associations of inner kinetochore proteins. Workshop Cell Biology and
Microscopy, Altleiningen, December 2005
S. Orthaus: Molecular networks of human kinetochore proteins as measured by FRET and
FLIM. 8. VBMF Methoden-Kolloquium “Kinetic Microscopy: in vivo analysis of subcellular
structures“, May 2006
Poster
S. Orthaus; C. Biskup, B. Hoffmann, C. Hoischen and S. Diekmann: Molecular networks of
human kinetochore proteins as measured by FRET and FLIM. International Symposium
“Optical Analysis of Biomolecular Machines”, MDC Berlin, July 2006

Danksagung
An dieser Stelle möchte ich mich bei all den Menschen bedanken, die zum Gelingen der
vorliegenden Arbeit beigetragen haben:
Prof. Stephan Diekmann für die Möglichkeit, diese Arbeit unter seiner Betreuung durchführen
zu können. Seine Begeisterungsfähigkeit einhergehend mit einer Gabe für konstruktive Kritik
haben mich immer aufs neue motiviert. Er ließ mir viel Freiraum bei der Durchführung
meiner Arbeit, trotzdem stand seine Tür immer offen für Diskussionen und Vorschläge.
Dr. Christoph Biskup und Dipl. Chem. Birgit Hoffmann vom Institut für Physiologie der FSU
Jena für die Einführung in die Mysterien der Fluoreszenz-Lebenszeit und ihre enorme
Unterstützung bei den FLIM-Messungen. Unermüdlich justierten sie die Messanlage und
scheuten auch nachts oder am Wochenende bei schönstem Sonnenschein nicht vor langen
Messreihen zurück. Ganz besonders herzlichen Dank gilt ihnen für ihre Hilfe bei der
Datenauswertung und beim Erstellen der Publikationen.
Dr. Christian Hoischen, dem „Clone-Manager“ in unserer Abteilung, für sein
unerschöpfliches Wissen über Kozak-Sequenzen, Restriktionsenzyme, Klonier-Kniffe ect.
und seine unermüdliche Hilfe bei der Planung und Durchführung der enormen Menge an
Klonierungen.
PD Dr. Peter Hemmerich für seine konstruktiven wissenschaftlichen Ratschläge und seine
Hilfe bei der Erstellung der vorliegenden Arbeit.
Dr. Klaus Huse, Dr. Katrin Reichwald und Uta Petz aus der Abteilung Genomanalyse des FLI
für die EST-Analyse und Sequenzierung der CENP-H-Konstrukte. Ganz besonders möchte
ich mich bei Klaus Huse für seine unvoreingenommene Sicht der Dinge und die vielen guten
Bücher bedanken.
Dr. Jürgen Sühnel von der Abteilung Biocomputing des FLI für die Erstellung des Centromer-
Modells, den Diskussionen und den daraus gewonnenen Erkenntnissen, welche die
Ergebnisse erst so richtig ins rechte Licht gerückt haben.

David Baddeley vom Kirchhoff-Institut für Physik in Heidelberg für die Gelegenheit, mit
einem neuen hochauflösenden mikroskopischen Verfahren (SMI) humane Centromere
vermessen zu können.
Prof. Werner Zuschratter, Mini Jose und Deepak Nair vom Leibniz-Institut für Neurobiologie
in Magdeburg für ihre konstruktiven Diskussionen und die Möglichkeit, in ihrem Labor
FLIM-Messungen durchführen zu können.
Großen Dank schulde ich auch den übrigen Mitarbeitern der Abteilung Molekularbiologie für
die gute und sehr freundliche Arbeitsatmosphäre und die stete Hilfsbereitschaft. Besonders
erwähnen möchte ich Sabine Ohndorf für ihre Hilfe bei den Western Blots und ihren Einsatz,
der ein funktionierendes Labor am Laufen hält; Sylke Pfeifer, Marianne Koch und Indri
Erliandri für die Erstellung vieler Plasmide, die in dieser Arbeit genutzt wurden; Steffi
Weidtkamp-Peters, die ihr Wissen über Mikroskopie-Techniken und alle Probleme im
Laboralltag immer großzügig geteilt hat und Tobias Ulbricht für seinen enormen Bonbon-
Vorrat und die Hilfe beim Korrigieren der Arbeit.
Esther Kamphausen, mit der ich über jedes wissenschaftliche und weniger wissenschaftliche
Thema reden konnte. Mit keinem anderen Storchenfreund hätte ich das Labor lieber teilen
wollen.
Ganz besonders möchte ich meiner Familie für den großen Rückhalt, ihre Zuversicht und ihre
moralische Unterstützung bei allen Problemen danken. Ihre Hilfe hat wesentlich zum
Gelingen dieser Arbeit beigetragen. Der Herde möchte ich besonders für die lustigen
Ablenkungen danken, die mir in schwierigen Zeiten wieder zu einem klaren Kopf und neuer
Tatkraft verhalfen.
Top Related