


Languages
Pages
Legal


Three-fluorophore FRET-FLIM enables the study of trimeric protein interactions
1
Three-fluorophore FRET-FLIM enables the study of trimeric protein interactions and complex formation with nanoscale resolution in living plant cells
Nina Glöcknera, Sven zur Oven-Krockhausa, Frank Wackenhutb, Moritz Burmeisterb,
Friederike Wankea, Eleonore Holzwartc, Alfred J. Meixnerb, Sebastian Wolfc and Klaus
Hartera
a Center for Plant Molecular Biology, Eberhard Karls University Tübingen, Germany b Institut for Physical & Theoretical Chemistry, Eberhard Karls University Tübingen, Germany c Centre for Organismal Studies, Ruprecht-Karls-Universität Heidelberg, Germany
Summary
Integration of signalling on the cellular level is essential for the survival of organisms.
Protein-protein interaction studies provide valuable insights in these signalling events.
One of the best understood signalling pathways in plants is the brassinosteroid (BR)
hormone signalling pathway, which is mediated by the receptor BRASSINOSTEROID
INSENSITIVE 1 (BRI1) with its co-receptor BRI1-ASSOCIATED KINASE (BAK1). Both BRI1
and BAK1 have been shown to interact with RECEPTOR LIKE PROTEIN 44 (RLP44), which
was implicated in cell wall integrity sensing by modulation of BL signalling. Here we
provide evidence by quantitative in vivo three-fluorophore FRET-FLIM measurements,
that RLP44, BRI1 and BAK1 form a trimeric complex in the plasma membrane of
N. benthamiana leaf cells, with an estimated distance between them below 15 nm. The
immune receptor FLAGELLIN SENSING 2 (FLS2), which is also a receptor-like kinase like
BRI1, is not integrated in a similar complex with RLP44 and BAK1. Our study supports
that BRI1 and FLS2 are localized in distinct nanodomains in the PM. As the
fluorescence lifetime of the donor is monitored, our method circumvents the extensive
calculations necessitated by intensity-based FRET interaction assays and thus
provides a feasible base for studying the sub-compartmentalization in the plasma
membrane of living plant cells with a nanoscale resolution.
not certified by peer review) is the author/funder. All rights reserved. No reuse allowed without permission. The copyright holder for this preprint (which wasthis version posted August 1, 2019. . https://doi.org/10.1101/722124doi: bioRxiv preprint
Three-fluorophore FRET-FLIM enables the study of trimeric protein interactions
2
Graphical abstract
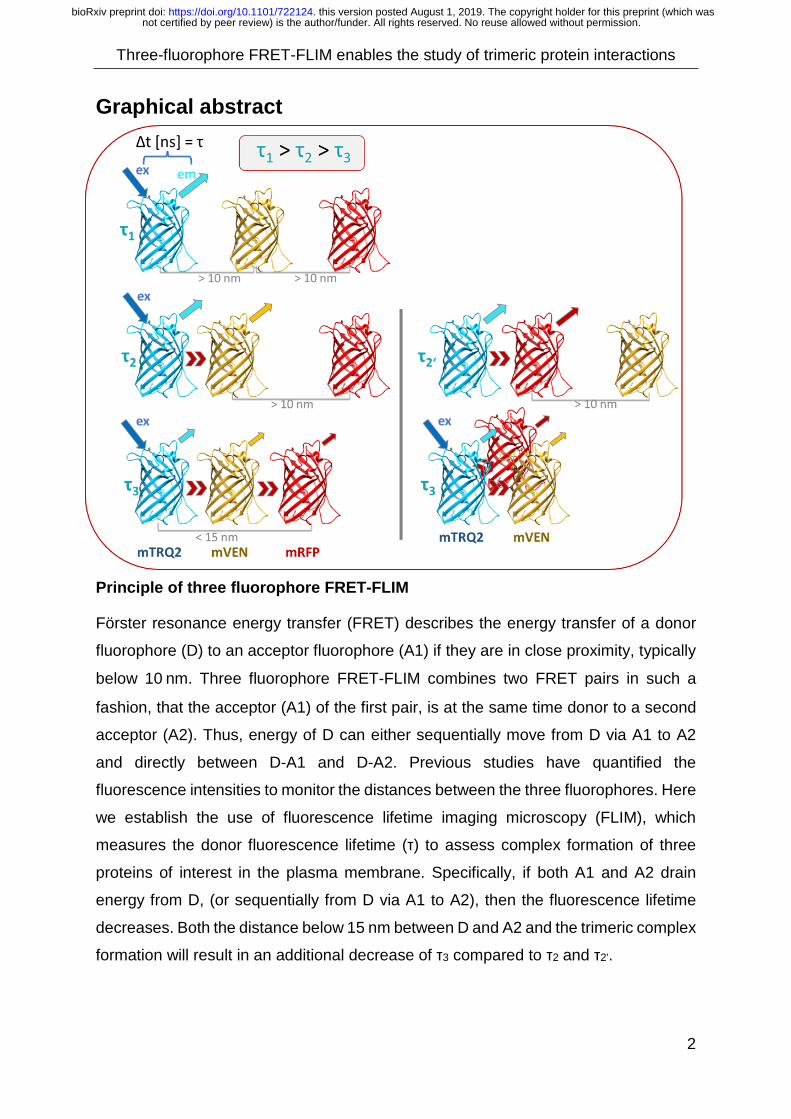
Principle of three fluorophore FRET-FLIM
Förster resonance energy transfer (FRET) describes the energy transfer of a donor
fluorophore (D) to an acceptor fluorophore (A1) if they are in close proximity, typically
below 10 nm. Three fluorophore FRET-FLIM combines two FRET pairs in such a
fashion, that the acceptor (A1) of the first pair, is at the same time donor to a second
acceptor (A2). Thus, energy of D can either sequentially move from D via A1 to A2
and directly between D-A1 and D-A2. Previous studies have quantified the
fluorescence intensities to monitor the distances between the three fluorophores. Here
we establish the use of fluorescence lifetime imaging microscopy (FLIM), which
measures the donor fluorescence lifetime (τ) to assess complex formation of three
proteins of interest in the plasma membrane. Specifically, if both A1 and A2 drain
energy from D, (or sequentially from D via A1 to A2), then the fluorescence lifetime
decreases. Both the distance below 15 nm between D and A2 and the trimeric complex
formation will result in an additional decrease of τ3 compared to τ2 and τ2’.
not certified by peer review) is the author/funder. All rights reserved. No reuse allowed without permission. The copyright holder for this preprint (which wasthis version posted August 1, 2019. . https://doi.org/10.1101/722124doi: bioRxiv preprint
Three-fluorophore FRET-FLIM enables the study of trimeric protein interactions
3
Introduction
Integration of different signalling cues on the cellular level is essential for the survival
of any living organism, as only a fine-tuned response incorporating all available
information will mediate an optimal cellular response. For example, upon infection with
pathogens or mechanical damaging of the cell wall, the cellular growth response must
be attenuated while the resources are e.g. redistributed to immune responses or the
integrity of the cell wall. With the advent of superresolution techniques (Betzig, 1995;
Klar et al., 2000; Betzig et al., 2006), the discovery of proteins specifically enriched in
a detergent-resistant-fraction (Ott 2017; Malinsky et al. 2013; Lu and Fairn 2018), and
the specific distribution of phosphoinositides (Mamode Cassim et al. 2019), the
discussions on the spatial distribution of receptors and the other proteins involved in
signal transduction (e.g. co-receptors) in the plasma membrane have grown (Ott 2017;
Konrad and Ott 2015; Burkart and Stahl 2017; Gronnier et al. 2018). This motivated
new questions, for example to which extent the receptors/co-receptors undergo
diffusion and to which extent they are restricted into signalling complexes. One of the
best understood pathways in plants is the brassinosteroid (BR) hormone signal
transduction. It is mediated by the plasma membrane (PM) -resident leucin rich repeat
receptor like kinases (LRR-RLK) BRASSINOSTEROID INSENSITIVE 1 (BRI1) and a co-
receptor BRI1-ASSOCIATED KINASE (BAK1) which is also called SOMATIC EMBRYOGENESIS
RECEPTOR-LIKE KINASE 3 (SERK3) (Clouse et al., 1996; Li and Chory, 1997;
Friedrichsen et al., 2000; Li et al., 2002; Nam and Li, 2002). Biochemical and structural
data show that in vitro, the interaction of the extracellular domains is strictly dependent
on presence of the ligand (Santiago et al., 2013; Hohmann et al., 2017; Hohmann et
al., 2018b), but evidence has been presented that BRI1-BAK1 form heterodimers in
absence of the ligand (Nam and Li, 2002; Wang et al., 2005b; Yun et al., 2009; Bücherl
et al., 2013). In the absence of BR, the activation by trans-phosphorylation events
between the cytoplasmic kinase domains is inhibited by the cytoplasmic BRI1 KINASE
INHIBITOR1 (BKI1) protein and a BAK1-INTERACTING LRR-RK (BIR3) (Wang and
Chory, 2006; Wang et al., 2014; Imkampe et al., 2017). BIR3 seems to keep BAK1
and the receptor in close proximity, and, at the same time, acts as an inhibitor on
signalling in the absence of the hormone (Imkampe et al., 2017; Hohmann et al.,
2018a; Großeholz et al., 2019). Binding of BR to the extracellular island domain of the
receptor (Wang et al., 2001) acts as molecular glue between BRI1 and BAK1 and
not certified by peer review) is the author/funder. All rights reserved. No reuse allowed without permission. The copyright holder for this preprint (which wasthis version posted August 1, 2019. . https://doi.org/10.1101/722124doi: bioRxiv preprint
Three-fluorophore FRET-FLIM enables the study of trimeric protein interactions
4
enhances interaction (Wang et al., 2005a; Hothorn et al., 2011; Santiago et al., 2013;
Sun et al., 2013). This leads to the auto- and trans-phosphorylation of the Ser/Thr-
kinase domains, the dissociation of BKI1 from the PM (Friedrichsen et al., 2000; Oh
et al., 2000; Wang et al., 2005a; Wang et al., 2008; Jaillais et al., 2011) and the partial
release of BIR3 (Imkampe et al., 2017), increasing interaction (Wang et al., 2005a;
Bücherl et al., 2013). These events at the PM then lead to the activation or repression
of BR-responsive genes by a signalling cascade mediated via several cytoplasmic
proteins (Mora-García et al., 2004; Yin et al., 2005; Vert and Chory, 2006; Zhu et al.,
2017) and the fast activation of PM-resident P-type proton pumps (AHAs) within 20
minutes (Caesar et al., 2011; Witthöft et al., 2014). The plasma membrane-localized
pool of BRI1 and is signalling competent and the endocytosis of BRI1 is required for
BR signal attenuation (Russinova et al., 2004; Irani et al., 2012; Di Rubbo et al., 2013;
Wen et al., 2014; Martins et al., 2015; Liang et al., 2016; Peng et al., 2018). Proteins
associate to homo- or heterodimers with a certain affinity and their dissociation rate is
described by the dissociation constant (Kd). The determination of Kd is a highly
desirable in protein biochemistry for the understanding of signalling events (Lin et al.,
2018). It is defined as the state, when half of the overall acceptor sites are occupied
at equilibrium (Kuemmerle H., 1991; Vuignier et al., 2010). With the same Kd and a
decrease in relative concentration of A (compared to B), the equilibrium for A + B ⇔
AB will shift to the left (Lin et al., 2018). This is relevant for transient expression studies,
as the addition of a third protein that interacts with A may change the steady state of
AB complex formation.
The RECEPTOR-LIKE PROTEIN 44 (RLP44) was previously described to play a role in cell
wall integrity sensing via modulation of brassinosteroid-mediated responses (Wolf et
al., 2014). It directly interacts with both BRI1 and BAK1 (Wolf et al., 2014; Holzwart et
al., 2018) (Holzwart et al., 2019). A recent study also showed that RLP44 plays a role
in vascular development, which involves phytosulfokine hormone signalling (Holzwart
et al., 2018). The phospho-state of the short, C-terminal tail of RLP44 is important for
the interaction with BRI1 and determines, whether RLP44 is located at the PM or
internalized into intracellular compartments (Garnelo Gomez et al., 2019). This
suggests, that RLP44 directly modulates BR-signalling upon input from cell wall
integrity signalling cues. If RLP44, BRI1 and BAK1 are in a preformed complex in vivo,
not certified by peer review) is the author/funder. All rights reserved. No reuse allowed without permission. The copyright holder for this preprint (which wasthis version posted August 1, 2019. . https://doi.org/10.1101/722124doi: bioRxiv preprint
Three-fluorophore FRET-FLIM enables the study of trimeric protein interactions
5
this would enable the fast integration of signalling cues and the efficient internalization
after signalling or upon cell wall damage signalling.
To test this hypothesis, we developed the three-fluorophore Förster resonance energy
transfer (FRET) by fluorescence lifetime imaging microscopy (FLIM) (Three-
fluorophore FRET-FLIM) in N. benthamiana leaves. FRET describes the energy
transfer (without emission of a photon) from a donor-fluorophore (D) to an acceptor
fluorophore (A) (Förster, 1948). FRET is only possible at small distances (typically
below 10 nm), and strongly depends on the relative orientation of the dipole moments
of A and D. If A drains energy from D, then the fluorescence intensity of D decreases.
The acceptor can then emit photons itself, noticeable as an increased fluorescence
intensity at a higher wavelength compared with the donor. This effect is measured in
intensity-based FRET assays. FRET also influences the fluorophore's excited state
life time (FLT), i.e. the time the fluorophore stays in the excited state undergoing
vibrational relaxation/internal conversion before emitting a photon. The alternative
relaxation path from D to A provided by FRET consequently decreases the radiative
decay rate of the donor, quantifiable as an apparently reduced FLT, which is the basis
for FRET-FLIM experiments (Noomnarm and Clegg, 2009). The FLT is independent
of the local concentration, the local excitation intensity and provides good time
resolution (Lakowicz et al., 1992; Hum et al., 2012). However, it is sensitive to changes
in chemical parameters that can quench D, like pH, polarity, temperature or the
refractive index of the medium (Caesar et al., 2011; Ishikawa-Ankerhold et al., 2012;
Hochreiter et al., 2015). Currently, correctly performed FLIM is considered the most
accurate way to determine FRET, as it allows the examination of the physical
nanoenvironment of the protein with very high accuracy and avoids typically error-
prone intensity measurements (Hochreiter et al., 2015). Three-fluorophore FRET-
FLIM investigates the energy transfer between fluorophores that will be referred to as
D, A1 and A2 for the rest of this study. This order reflects their spectral characteristics,
with D as the most blue-shifted fluorophore, A2 as the most red-shifted fluorophore
and A1 as the intermediate between these spectral positions. Therefore, the following
FRET paths are possible: D to A1, D to A2 and A1 to A2.
not certified by peer review) is the author/funder. All rights reserved. No reuse allowed without permission. The copyright holder for this preprint (which wasthis version posted August 1, 2019. . https://doi.org/10.1101/722124doi: bioRxiv preprint

Three-fluorophore FRET-FLIM enables the study of trimeric protein interactions
6
The FRET efficiency (EFRET) between a donor (D) and an acceptor fluorophore (A) is
given by:
EFRET = 11+(RDA R0⁄ )6
, (1)
with EFRET as the FRET efficiency, RDA the distance between the donor and acceptor
fluorophore and R0 the Förster distance. R0 is defined as the distance between D and
A, with 50% energy transfer efficiency. It can be calculated by:
𝑅𝑅0 = 0.2108 [𝜅𝜅2 𝜙𝜙0 𝑛𝑛−4 J ]1/6 . (2)
Here, κ2 represents the dipole orientation factor between D and A (usually assumed
to be 2/3 for freely rotating fluorophores); ϕ0 the quantum yield of D; n the refractive
index of the medium (1.4 for buffer salts dissolved in water) and J the spectral overlap
integrand (in M-1 cm-1 nm4) between D fluorescence and A absorbance, given by:
J = ∫ F𝐷𝐷(λ) εA(λ) λ4 dλ∞0 , (3)
where FD (λ) represents the emission spectrum of D, which was normalized so that the
sum of the integral equals one; εA (λ) the absorption spectrum of A, scaled to the molar
attenuation coefficient (extinction coefficient) of A (in M-1cm-1) (Wu and Brand, 1994;
Hink et al., 2002; Lakowicz, 2006).
As evident in equation (2), the dipole orientation factor κ2 has a strong influence on
the calculated R0 and thus the FRET efficiency:
𝜅𝜅2 = 𝑐𝑐𝑐𝑐𝑐𝑐2 𝜔𝜔 (1 + 3𝑐𝑐𝑐𝑐𝑐𝑐2𝜃𝜃) . (4)
Where ω is the angle between the electric field vector of D at the location of A and the
absorption dipole orientation of A. θ is the angle between the emission dipole
orientation of D and the separation vector of D-A (Lakowicz, 2006; Vogel et al., 2014).
For the standard assumption of κ2 = 2/3 to be true, the rotational diffusion of a
fluorophore has to be faster than the FLT of D (Hink et al., 2002; Müller et al., 2013).
However, this may not be true for genetically-encoded fluorescent proteins used in
FRET studies for several reasons: the fluorophore barrel is large and has a rotation
correlation time of about 20–30 ns whereas the FLT is in a range of 1–4 ns (Vogel et
al., 2012); the fluorophores are attached to the proteins of interest with a flexible linker
(George and Heringa, 2002; Chen et al., 2013, 2013; van Rosmalen et al., 2017). A
linker length of 15 amino acids is assumed to allow free rotation of the fluorophore
not certified by peer review) is the author/funder. All rights reserved. No reuse allowed without permission. The copyright holder for this preprint (which wasthis version posted August 1, 2019. . https://doi.org/10.1101/722124doi: bioRxiv preprint

Three-fluorophore FRET-FLIM enables the study of trimeric protein interactions
7
(Szöllosi et al., 2006; Chen et al., 2013; Shrestha et al., 2015; van Rosmalen et al.,
2017; Ujlaky-Nagy et al., 2018). Even if the assumption is not entirely met, the
introduced error is a systematic shift for all samples. Hink et al. (2002) proposed to
use κ2 = 0.476, which is the value of the orientation factor for a rigid, randomized
ensemble of D-A pairs (Steinberg, 1971), which effectively reduces the calculated
Förster distance. It is important to keep in mind, that the FRET efficiency does not
correspond to fixed real distances (Müller et al., 2013): The presence of FRET means
that the proteins of interest are in close spatial proximity, but how close exactly can
rarely be precisely determined, especially in live-cell imaging. The distance R that is
accessible through FRET-measurements is in average 0.5 R0 ≤ R ≤ 1.5 R0 (Gadella,
2009; Müller et al., 2013). Most FRET pairs have Förster distances between 4 and
7 nm (Bajar et al., 2016; Mastop et al., 2017) and hence, FRET is restricted to
distances below ~ 10 nm.
Most three-fluorophore FRET approaches in the mammalian field use a combination
of fluorescent proteins that emit in the blue, yellow and red spectral region (Galperin
et al., 2004; He et al., 2005; Seidel et al., 2010, 2010; Sun et al., 2010; Pauker et al.,
2012; Fábián et al., 2013; Hoppe et al., 2013; Krause et al., 2013; Wallrabe et al.,
2013; Woehler, 2013; Fried et al., 2014; Scott and Hoppe, 2015; Kastantin et al., 2017)
or organic dyes as Cy-, Atto- or Alexa- chromophores (Hohng et al., 2004; Lee et al.,
2010; Kastantin et al., 2017). Rarely, the intermediate fluorophore emits in the green
spectral region (Hur et al., 2016; Kuo et al., 2018). One report demonstrates the close
proximity of three proteins of interest by labelling one protein with a blue-emitting
fluorophore, and the other two with the same yellow-emitting fluorophore (Yu et al.,
2013).
In order to establish three-fluorophore FRET-FLIM for the first time in plants, we need
to consider, which fluorophores can be used in planta and how the dynamic range
between D and A2 changes with the presence of A1 between them. Furthermore, the
influence of different spatial arrangements on the FRET efficiency and other factors,
which influence the dynamic range, need to be taken into account. We then establish
three-fluorophore FRET by following the example of an early, intensity-based FRET
measurement by acquisition of spectra with continuous excitation of D (Haustein et
al., 2003) for the three proteins RLP44, BRI1 and BAK1 respectively fused to D, A1
and A2. We will show, that a different sequence of labelling does not inhibit energy
not certified by peer review) is the author/funder. All rights reserved. No reuse allowed without permission. The copyright holder for this preprint (which wasthis version posted August 1, 2019. . https://doi.org/10.1101/722124doi: bioRxiv preprint

Three-fluorophore FRET-FLIM enables the study of trimeric protein interactions
8
transfer to A2. Lastly, we will demonstrate, that RLP44-D, BRI1-A1 and BAK1-A2 are
in proximity in three-fluorophore FRET-FLIM and demonstrate, that changes in donor-
acceptor stoichiometry are not a major factor influencing the FLT.
not certified by peer review) is the author/funder. All rights reserved. No reuse allowed without permission. The copyright holder for this preprint (which wasthis version posted August 1, 2019. . https://doi.org/10.1101/722124doi: bioRxiv preprint
Three-fluorophore FRET-FLIM enables the study of trimeric protein interactions
9
Results
To ensure similar expression levels of at least two fusion proteins, we chose the
previously published 2in1 vector system that was developed for FRET-FLIM studies
(Grefen and Blatt, 2012; Hecker et al., 2015; Lin et al., 2018). The D fluorophore was
mTRQ2, the A1 fluorophore was mVEN and the A2 fluorophore was mRFP. The vector
for the expression of the A2-fusion proteins, was pB7RWG2-Dest by (Karimi et al.,
2002), as it also contained the 35S promoter and was successfully applied in previous
FRET-FLIM approaches (Boutant et al., 2010; Schoberer et al., 2013; Ladwig et al.,
2015; Holzwart et al., 2018; Mohrholz et al., 2019). To facilitate the nomenclature,
whenever protein X was labelled with D, protein Y was labelled with A1 and protein Z
with A2, then only the sequence of the proteins will be written without mentioning the
fluorophores: X-Y-Z. If for example instead Y was labelled with D and X with A1, then
the writing would change to Y-X-Z.
Physicochemical properties of the fluorophores mTRQ2, mVEN and mRFP
When investigating protein-protein interactions by FRET-FLIM, the physicochemical
properties of the fluorophores substantially influence the quality of data. Using mTRQ2
as D provided numerous advantages: a long, mono-exponential lifetime, relative fast
maturation, low pH-sensitivity, high photostability, and the highest quantum yield of a
monomeric fluorescent protein (Goedhart et al., 2012). The spectral overlap between
D emission and A1 absorbance was high, yielding the largest Förster distance R0 for
comparable CFP-YFP fluorophores (Müller et al., 2013; Hecker et al., 2015; Martin et
al., 2018). For values on quantum yield, extinction coefficient, molecular brightness,
maturation time, photostability, pH stability and portion of monomeric state see (Supp.
Mat. 1). The maturation time is an important factor for FRET efficiency (Miyawaki and
Tsien, 2000; Nagai et al., 2002). In our three-fluorophore system, both A1 and A2 had
faster maturation rates than D, ensuring favourable FRET conditions with a surplus of
acceptors. All fluorophores were monomeric, minimizing false-positive FRET
originating from aggregation.
not certified by peer review) is the author/funder. All rights reserved. No reuse allowed without permission. The copyright holder for this preprint (which wasthis version posted August 1, 2019. . https://doi.org/10.1101/722124doi: bioRxiv preprint

Three-fluorophore FRET-FLIM enables the study of trimeric protein interactions
10
Characterization of FRET properties
To determine the operational FRET range for the chosen fluorophores, the
corresponding Förster distances (R0) were calculated (1). For the more complex flow
of energy in a three-fluorophore setting, an adjusted R0 value was calculated for the
D-A2 pair, considering the effect of the intermediate fluorophore A1 and different
spatial arrangements (2). As the planar fluorophore distribution in the PM and the
donor-to-acceptor ratio influences FRET (Bunt and Wouters, 2017), we lastly
assessed how these effects may influence R0 (3). (1) To characterize the FRET properties of the chosen fluorophores, we plotted their
absorption and emission spectra (Fig. 1A). The emission of D had spectral overlap
with the absorption of both A1 and A2 (Fig. 1A, light and dark grey areas, respectively),
while the emission of A1 significantly overlapped with the absorption of A2 (Fig. 1A,
brown area). Therefore, energy transfer is possible between D-A1, A1-A2 and D-A2.
The R0 was calculated with n = 1.4 and k2 = 2/3 as described by (Hink et al., 2002).
With the known R0, the FRET-efficiency (EFRET) in dependence of the distance (R) for
each donor-acceptor pair was plotted (Fig. 1B). Calculation of R0 for the D-A1 (blue),
A1-A2 (orange) and D-A2 (red) pairs yielded values of 5.7 nm, 5.1 nm and 4.6 nm (Fig.
1B, grey lines and Table 1). Therefore, highest EFRET was obtained between D and
A1, and lowest between D and A2 (Fig. 1B). Furthermore, in contrast to the fluorescent
dye-based study of (Haustein et al. 2003), FRET was not limited to sequential energy
transfer from D via A1 to A2 (Fig. 1C top). With our genetically encoded fluorophores,
both sequential (D-A1-A2) and direct FRET (D-A2) was possible (Fig. 1C bottom). A
similar study in animal COS-1 cells, using CFP, YFP and mRFP calculated a
proportion of 45% direct FRET from CFP to mRFP and the remaining 55% as the result
of the sequential FRET, showing for the first time that both FRET modes occurred
simultaneously (Galperin et al., 2004).
(2) For large distances between D and A2, no direct FRET is possible and the
introduction of an intermediate acceptor A1 should increase the dynamic range
between them. To estimate this long-range effect, we calculated how the presence of
an intermediate acceptor may change the effective R0 between D and A2 according
to Haustein et al. (2003). The Förster distance R0 is not defined for three-way
interactions. But by calculating an adjusted R0, this was taken as an estimate on the
effective dynamic range. For the D-A2 pair, this resulted in an increase from 4.6 nm to
not certified by peer review) is the author/funder. All rights reserved. No reuse allowed without permission. The copyright holder for this preprint (which wasthis version posted August 1, 2019. . https://doi.org/10.1101/722124doi: bioRxiv preprint
Three-fluorophore FRET-FLIM enables the study of trimeric protein interactions
11
9.2 nm (Fig. 1D red vs. black and Table 1), which was in agreement with values
previously reported (Haustein et al., 2003). They used a DNA-helix to fix the distances
between fluorophores to calculate the FRET increase for A1 between D and A2. This
setting, however, seemed artificial for our dynamic in vivo system. Therefore, the
average EFRET for all possible positions of A1 between the D and the A2 fluorophore
with a step size of Δ 1 nm was calculated for each distance between D-A2 (Supp.
Material 2). This more realistic representation of a system with possibly changing
distances resulted in an increase from R0 = 4.6 nm to R0 = 6.8 nm for D-A2 (Fig. 1D
grey and Table 1). Hence, long-range interactions can be studied with three-
fluorophore FRET.
(3) The third factor, influencing the likelihood of FRET is the dipole orientation κ2. For
membrane-localized proteins, the distribution of k2 is drastically changed (Bunt and
Wouters, 2017). Also, the faster maturation time of both A1 and A2 compared to D
causes a surplus of acceptors which increases the likelihood of FRET (‘Antenna
effect’) (Bunt and Wouters, 2017). Another important aspect is to what extent the
planar distribution and a favourable donor-to-acceptor ratio can influence the average
FRET efficiency. As a measure for this, again an adjusted R0 was calculated. Bunt and
Wouters (2017) proposed a correction for EFRET in planar systems for different ratios
between donor and acceptor fluorophores: We calculated an adjusted R0 for a donor-
to-acceptor ratio of 1:5 and values were listed in Table 1. With a variable position of
A1, this additional correction yielded an adjusted R0 of 11.7 nm for D-A2 (Table 1). A
projection of the FRET efficiency with variable position of A1 to a stoichiometry of 1:5
showed, that 10% FRET would occur at distances below 15 nm (SI Fig. 1).
In summary, depending on the donor-to-acceptor ratios, long-range energy transfer
between D and A2 may occur already below 15 nm. Hence, long-range trimeric protein
interaction can be tested by fusing mTRQ2, mVen and mRFP to the proteins of
interest.
not certified by peer review) is the author/funder. All rights reserved. No reuse allowed without permission. The copyright holder for this preprint (which wasthis version posted August 1, 2019. . https://doi.org/10.1101/722124doi: bioRxiv preprint

Three-fluorophore FRET-FLIM enables the study of trimeric protein interactions
12
Table 1: Förster distances (R0) in nm for the FRET-pairs D-A1, A1-A2 and D-A2 (bold) and adjusted R0, with mTRQ2 as (D), mVEN as (A1) and mRFP (A2). Fluorophore in italic brackets (A1) assumes presence of A1 between D and A2 and the listed distance represents the adjusted R0 for D-A2. For a stochiometry of 1:5 of plasma membrane-resident proteins, a factor of 1.725 was used to calculate the adjusted R0 (Bunt and Wouters, 2017).
D » A1 A1 » A2 D » A2 D » (A1) » A2
middle D » (A1) » A2*
variable
R0 [nm] 5.67 5.14 4.63 9.2 6.8
R0 [nm] 1:5, planar 9.7 8.9 8.0 15.9 11.7
To assess, how a dynamic range of 15 nm relates to the sizes of our proteins, we
combined the cytoplasmic domains of RLP44, BRI1 and BAK1 with the respectively
attached fluorophores and the adjusted R0 between D-A2 in scale in a graph (Fig. 1E).
The size of each intracellular domain (ProteinCyto) was calculated from the distance of
Δ 5.4 Å from one turn to the next in the secondary protein structure of helical alpha-
barrels. The structures of the fluorophore-barrels, BRI1Cyto and BAK1Cyto were
resolved previously (Rekas et al., 2002; Yan et al., 2012; Bojar et al., 2014) and a
solvent-accessible surface representation was chosen. The orientations of the two
kinase domains of BRI1 (yellow) and BAK1 (brown) were depicted according to the
highest probability in molecular docking analyses (Großeholz et al., 2019). The
structure of RLP44Cyto (blue) and the Gateway®-linkers (grey) was not resolved and
thus predicted with PEP-FOLD3. For clarity, all structure-predicted proteins were
depicted as Cartoon. On average, the stoichiometry-adjusted R0 for plasma
membrane-resident proteins were 8-9 nm (Table 1) and can thus span the distance of
two kinase domains, which possess diameters of ~4.5 nm. The adjusted R0 for our
three-fluorophore FRET-FLIM of 15 nm reached from RLP44 well beyond the linear
arrangement of BRI1 and BAK1 (Fig. 1E).
In summary, direct FRET is possible for each donor-acceptor pair. For our three-
fluorophore FRET, the calculated 15 nm may well reach beyond one assumed
signalling module of RLP44, BRI1 and BAK1. Depending on the density and the
not certified by peer review) is the author/funder. All rights reserved. No reuse allowed without permission. The copyright holder for this preprint (which wasthis version posted August 1, 2019. . https://doi.org/10.1101/722124doi: bioRxiv preprint

Three-fluorophore FRET-FLIM enables the study of trimeric protein interactions
13
arrangement of the components in the PM, three-fluorophore FRET may occur even
between different signalling modules.
Determination of background in spectra with simulations
In the last years, many studies have assessed three-fluorophore FRET with intensity-
based methods in animal cells (Galperin et al., 2004; Hohng et al., 2004; He et al.,
2005; Lee et al., 2007; Shyu et al., 2008; Seidel et al., 2010; Pauker et al., 2012;
Hoppe et al., 2013; Wallrabe et al., 2013; Woehler, 2013; Fried et al., 2014; Scott and
Hoppe, 2015; Hur et al., 2016; Cotnoir-White et al., 2018), specifically by acquisition
of spectra (Haustein et al., 2003; Galperin et al., 2004; He et al., 2005; Sun et al.,
2010; Hoppe et al., 2013; Woehler, 2013). Therefore, we decided to first assess the
trimeric complex formation for our proteins with such an established method and to
then test, whether complex formation can be detected with FRET-FLIM.
For intensity-based FRET measurements, the expression levels are important. To
assess the influence of FRET compared to different expression levels on the
detectable emission spectra, calculations with MatlabTM were performed (Fig. 2) (see
Supp. Material 3A), assuming equidistant fluorophores. For a 1:1:1 ratio of
fluorophores with distances > 10 nm (no FRET in D-A1, A1-A2, D-A2) and an
excitation wavelength of 458 nm, a peak at 520 nm due to cross excitation appears
(Fig. 2A top). With distances below 10 nm, FRET can occur and the energy transfer
from D to A1 and A2 was visible in the spectra, as the D peak decreased and the A1
and A2 peaks increased (Fig. 2A).
In the absence of FRET, the bleed-through and cross excitation strongly depended on
the donor-to-acceptor ratio of the fluorophores (Fig. 2B). For changes in the MatlabTM
script, see (Supp. Material 3B). Importantly, bleed-through and cross excitation had a
larger influence on the mVEN signal than effects due to FRET: A donor-to-acceptor
ratio of 1:3 resulted in a similar peak intensity at 520 nm in the spectra as a Förster
distance of 6 nm (Fig. 2A,B).
This means, that for intensity-based FRET measurements, careful calibrations of the
fluorescence intensity for each fluorophore-tagged protein are essential (Galperin et
al., 2004; Hohng et al., 2004; He et al., 2005; Lee et al., 2007; Shyu et al., 2008; Seidel
et al., 2010; Pauker et al., 2012; Hoppe et al., 2013; Wallrabe et al., 2013; Woehler,
2013; Fried et al., 2014; Scott and Hoppe, 2015; Hur et al., 2016; Cotnoir-White et al.,
not certified by peer review) is the author/funder. All rights reserved. No reuse allowed without permission. The copyright holder for this preprint (which wasthis version posted August 1, 2019. . https://doi.org/10.1101/722124doi: bioRxiv preprint

Three-fluorophore FRET-FLIM enables the study of trimeric protein interactions
14
2018). High FRET efficiency requires high spectral overlap, which in turn increases
the spectral bleed through and cross-excitation. Therefore, corrections for these
factors have to be performed. The bleed through and cross-excitation were quantified
in the absorption and emission spectra as well as in confocal images (see Supp.
Material 4). All following experiments were performed with identical excitation and
emission settings.
Determination of background in the acquired spectra due to cross-excitation and bleed-through
It was shown previously, that BRI1–BAK1, RLP44–BRI1 and RLP44–BAK1 form
heterodimers (Nam and Li, 2002; Wolf et al., 2014; Holzwart et al., 2018). As a
negative control, the immune-response mediating FLAGELLIN SENSING2 FLS2 was
used as it is a plasma membrane-localized LRR-RLK like BRI1, that did not interact
with RLP44 or BRI1 previously (Bücherl et al., 2017; Garnelo Gomez et al., 2019). The
spectra were acquired in transiently transformed N. benthamiana leaves. All fusion-
proteins were expressed at the plasma membrane after two days (see SI Fig. 2).
The excitation wavelength for all shown spectra was at 458 nm. As spectral bleed
through and cross-excitation were important factors, in a first step the background in
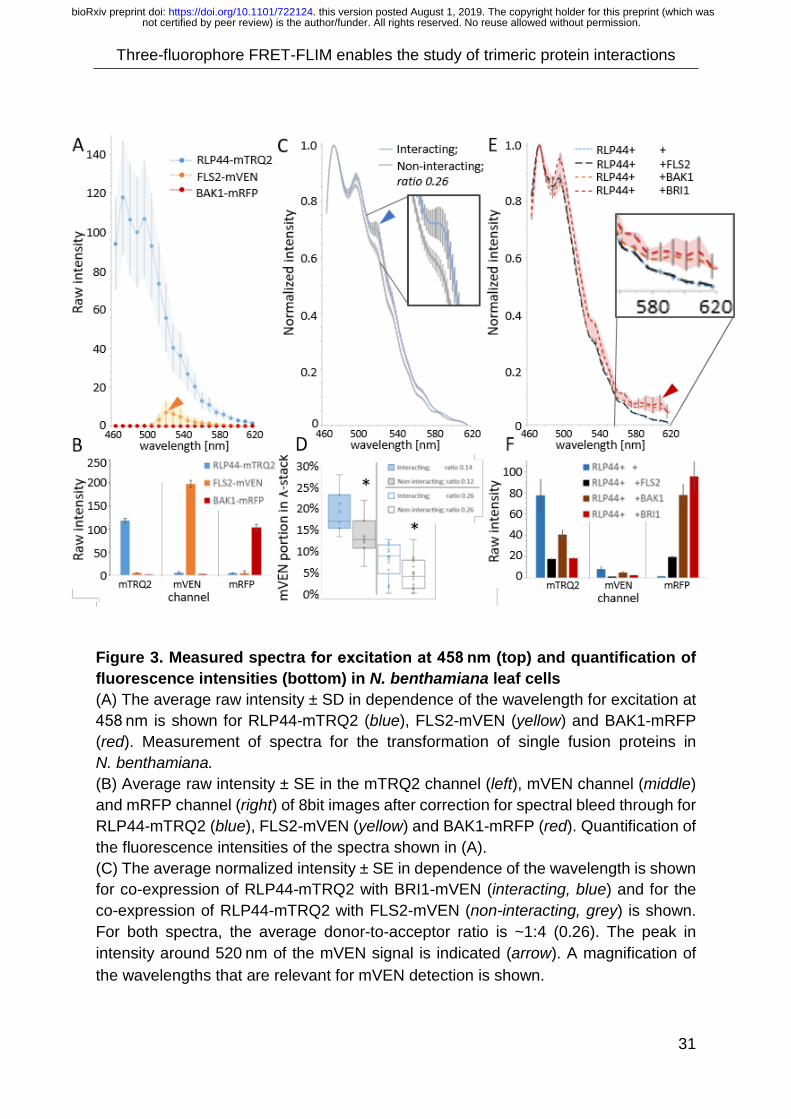
the spectra due to cross-excitation was determined (Fig 3A). Expression of RLP44-D
resulted in a peak at 480 nm in the spectrum (Fig. 3A blue). The expression of FLS1-
A1 yielded a peak at 520 nm due to cross-excitation (yellow arrow) and BAK1-A2 did
not lead to a visible peak (Fig. 3A red).
As the expression level is an important factor for intensity-based FRET, the
fluorescence intensity was taken as an estimate of the expression level. Thus, the
respective average raw intensity (as arbitrary unit) at the plasma membrane (PM) was
quantified for each channel. In a second step, the background due to cross-excitation
and bleed through was determined. Thus, the fluorescence intensities for
simultaneous excitation with 458 nm, 514 nm and 651 nm is shown (Fig. 1B) and will
below always be discussed in a separate section.
The quantification of the fluorescence intensity of RLP44-D showed, that the average
raw intensity of 120 at the PM (Fig. 3B blue) also caused a peak-intensity of 120 in the
spectrum (Fig. 3A). A relative high expression levels of FLS2-A1 with an average raw
intensity of 200 (Fig. 3B yellow) caused a much smaller background-signal of 8
not certified by peer review) is the author/funder. All rights reserved. No reuse allowed without permission. The copyright holder for this preprint (which wasthis version posted August 1, 2019. . https://doi.org/10.1101/722124doi: bioRxiv preprint

Three-fluorophore FRET-FLIM enables the study of trimeric protein interactions
15
arbitrary units in the spectrum (Fig. 3A yellow). The expression of BAK1-A2 with an
average raw intensity of 110 (Fig. 3B red) did not cause a distinct peak in the spectrum
(Fig. 3A red). Different expression levels lead to the same shape of spectra, only with
variations in the peak-value (see SI Fig. 3).
Protein-protein interaction study by spectra acquisition:
FRET from D to A1
First, we assessed FRET from D to A1. Since simulations of the spectra showed, that
the expression levels have a larger influence on the shape of the spectra than FRET,
a correction for the expression levels were performed. Therefore, we compared the
spectra with the same donor-to-acceptor ratio of interacting RLP44–BRI1 samples with
that of non-interacting RLP44–FLS2 samples. To this end, each recorded spectrum at
the plasma membrane of cells was interpolated (see Supp. Material 5) and subjected
to spectral unmixing in MatlabTM to calculate the proportion of D, A1 and A2 in it (see
Supp. Material 6). Then, the spectral unmixing information was combined with the
respective estimates on the expression level. For all consecutive quantifications of the
fluorescence intensities, each channel was imaged with sequential excitation right
before acquisition of the spectra (excitation with only 458 nm, then only 514 nm, lastly
only 561 nm).
The average of the spectra with the same expression levels of interacting RLP44–
BRI1 vs. non-interacting RLP44–FLS2 samples was calculated (Fig. 3C). In the
spectra with the same donor-to-acceptor ratio, the average peak value at 520 nm
(arrow) was higher for the interacting proteins (RLP44–BRI1, Fig. 3C blue) than for
non-interacting proteins (RLP44–FLS2, Fig. 3C grey).
The combination of spectral unmixing and identical donor-to-acceptor ratios revealed,
that the A1 proportion in the spectra of interacting samples differed significantly
(p<0.05) from non-interacting samples (Fig. 3D stars). This was true for both donor-
to-acceptor ratios of approximately 1:10 (Fig. 3D left two samples with ratio: 0.12) and
of 1:4 (Fig. 1D right two samples with ratio: 0.26). In summary, FRET from RLP44-D
to BRI1-A1 was demonstrated with the acquisition of spectra. But only, after careful
comparison to non-FRET signal.
not certified by peer review) is the author/funder. All rights reserved. No reuse allowed without permission. The copyright holder for this preprint (which wasthis version posted August 1, 2019. . https://doi.org/10.1101/722124doi: bioRxiv preprint

Three-fluorophore FRET-FLIM enables the study of trimeric protein interactions
16
FRET from D to A2
We next tested, whether the energy transfer from D to A2 was visible in the spectra.
For co-expression of RLP44-D with FLS2-A2 (RLP44– –FLS2), no significant elevation
at 610 nm was detected (black) compared to the absence of a red fluorophore (blue)
(Fig. 3E). Co-expression of interacting BAK1-A2 (brown) or BRI1-A2 (red) lead to
significant elevations of the intensity at 610 nm compared to control samples (Fig. 3E
arrow).
The ratio in the fluorescence intensity between D and A2 was 1:1 for RLP44– –FLS2
(Fig. 3D black). However, the fluorescence intensity ratio revealed, that RLP44– –BRI1
(red) and RLP44– –BAK1 (brown) had higher expression levels of the A2 fusion, with
respective ratios of 1:2 (Fig 3F brown) and 1:5 (Fig. 3F red). The difference in
expression level may have had an influence on the detected A2 signal.
The energy from D was transmitted via A1 to A2
If RLP44, BRI1 and BAK1 form a complex, then the average distance between
RLP44–BAK1 may differ from that of RLP44–BRI1–BAK1. For example, BRI1 may be
located between RLP44 and BAK1, increasing the distance between them. It might
also decrease the total number of RLP44–BAK1 interactions as new pairs (RLP44–
BRI1 or BAK1-BRI1) are formed (Galperin et al., 2004). To test for this possibility, we
labelled BRI1 with the non-fluorescent HA-tag (BRI1HA) (SI Fig. 4). Again, for the
intensity-based FRET measurements, effects due to different donor-to-acceptor ratios
have to be excluded and thus the expression levels by quantification of the
fluorescence intensity are discussed in a separate section after the FRET
measurement.
Non-fluorescent BRI1 disrupted the FRET from RLP44-D to BAK1-A2
Co-expression of HA-tagged BRI1 did not change the shape of the RLP44-D spectrum
(compare Fig. 4A blue and Fig. 3A blue). As before, co-expression of BAK1-A2 yielded
a small intensity elevation around 610 nm (Fig. 4A red). This elevation was not present
anymore when BRI1HA was co-expressed (Fig. 4A black), In contrast to this, the co-
expression of the non-interacting RLP44–FLS2–BRI1 did not lead to a disappearance
of the intensity peak at 610 nm (SI Fig. 5 black). Thus, the addition of HA-tagged BRI1
increased the average distance between RLP44 and BAK1 or lead to conformational
not certified by peer review) is the author/funder. All rights reserved. No reuse allowed without permission. The copyright holder for this preprint (which wasthis version posted August 1, 2019. . https://doi.org/10.1101/722124doi: bioRxiv preprint

Three-fluorophore FRET-FLIM enables the study of trimeric protein interactions
17
changes, that influences the relative dipole orientation (Galperin et al., 2004; Bunt and
Wouters, 2017) or lead to changes in expression level.
However, the expression of different protein combinations did not change the donor-
to-acceptor ratio: The ratio between RLP44 and BAK1 was 1:1.1 for RLP44– –BAK1
(bright red), 1:1.2 for RLP44–(BRI1HA)–BAK1 (black) (Fig. 4B). This means, that
indeed the distance or the dipole orientation between RLP44 and BAK1 changed upon
BRI1HA co-expression.
Using instead BRI1-A1, restored the FRET from RLP44-D to BAK1-A2
As a positive control and negative control for D-A2 FRET, the spectra of RLP44– –
BAK1 and RLP44–(BRI1HA)–BAK1 from Fig. 4A were included. When using the
fluorophore-tagged BRI1-A1 instead, the peak in intensity at 610 nm was restored
(Fig. 5A dark red). We showed earlier, that the presence of an intermediate
fluorophore increases the Förster distance between D and A2 (Fig. 1D). This increase
in in the dynamic FRET range between D-A2 with an intermediate acceptor likely
restored the A2 peak (Haustein et al., 2003; Galperin et al., 2004), assuming the
donor-to-acceptor ratio stayed the same.
At the same time, an energy transfer from A1 to A2 was visible for the interacting
samples: the peak at 520 nm (yellow arrow) strongly decreased for
RLP44–BRI1–BAK1 (dark red) in comparison to RLP44–BRI1 (yellow) expression
(Fig. 4C). An influence of cross-excitation of A1 and subsequent FRET directly from
A2 could not be fully excluded. But as no energy transfer from A1 to A2 was observed
for RLP44–FLS2–FLS2 with high A2 fluorescence intensity levels (ratio of ~1:10 for
D:A1) this effect was likely of minor importance, (see SI Fig. 5 brown). In summary,
the intensity peak at 610 nm that was disrupted by BRI1HA was restored by BRI1-A1
and the intensity peak at 520 nm was reduced, if BAK1-A2 was present. This energy
transfer from D to A1 (yellow arrow) to A2 (red arrow) fits the expectations of three-
fluorophore FRET-FLIM, unless it was due to changes in the expression level.
Also here, the expression of different protein combinations did not change the donor-
to-acceptor ratios: For RLP44–BRI1–BAK1, the RLP44:BAK1 ratio was 1:1.2 (Fig. 4D
dark red). The ratio between RLP44 and BRI1 stayed constant with ratios of 1:2 for
RLP44–BRI1 (yellow) and 1:1.4 for RLP44–BRI1–BAK (Fig. 4B red). This supported
not certified by peer review) is the author/funder. All rights reserved. No reuse allowed without permission. The copyright holder for this preprint (which wasthis version posted August 1, 2019. . https://doi.org/10.1101/722124doi: bioRxiv preprint
Three-fluorophore FRET-FLIM enables the study of trimeric protein interactions
18
the interpretation, that the energy from A1 was transferred to A2 specifically for
interacting proteins.
In summary, the unaltered ratios suggest, that the addition of BRIHA increased the
average distance or changed the dipole orientation between RLP44 and BAK1, thus
disrupting the energy transfer from D to A2 (Galperin et al., 2004). Addition of BRI1-
A1 as interacting intermediate, restored the energy transfer from RLP44-D to BAK1-
A2, meaning that RLP44, BRI1 and BAK1 were in close spatial proximity, enabling
FRET between them.
Determination of complex formation by spectra acquisition
We next asked, whether the energy transfer from D via A1 to A2 was also possible, if
the fluorophores were swapped. We therefore tagged BAK1 with A1 and BRI1 with A2
(RLP44–BAK1–BRI1). As controls, the spectra of RLP44–– (blue),
RLP44–BRI1–FLS2 (red) and RLP44-BAK1–FLS2 (brown) were measured (Fig. 5A).
For both combinations with FLS2-A2, a large peak in intensity at 520 nm (orange
arrow) and no peak at 610 nm (red arrow) was detectable, indicating that energy from
D was exclusively transferred to A1, but not to A2. The 520 nm intensity peak includes
signal due to cross-excitation.
The D:A1 ratios were 1:3 for RLP44-BRI1-FLS2 and 1:4 for RLP44-BAK1-FLS2 (Fig.
5B). This increase in A1 for RLP44-BAK1-FLS2 compared to RLP44-BRI1-FLS2 did
not increase the peak value in the spectrum at 520 nm. The D:A2 ratio was 1:3 for
RLP44–BRI1–FLS2 and 1:4 for RLP44–BAK1–FLS2. Thus, the absence of a peak at
610 nm was not due to weak expression, as an energy transfer to A2 was previously
detected already for a ratio of 1:1 (e.g. Fig. 4C with RLP44–BRI1–BAK1, dark red).
For interacting proteins, namely RLP44–BRI1-BAK1 (red) and RLP44–BAK1–BRI1
(brown) (Fig. 5C) two effects were visible: the peak value at 520 nm decreased (yellow
arrow) and a peak at 610 nm appeared (red arrow) (Fig. 5C) compared to the
FLS2-A2 samples (Fig. 5A). This suggests, that the energy from A1 was specifically
transferred to A2, provided that the protein ratios were unaltered. The peak at 520 nm
was higher for RLP44–BAK1–BRI1 (brown) than for RLP44–BRI1-BAK1 (red)
(Fig. 5C).
The D:A1 ratio was 1:2 for RLP44–BRI1–BAK1 and 1:3 for RLP44–BAK1–BRI1 (Fig.
5D). This increase in A1 expression for RLP44–BRI1–BAK1 may be responsible for
not certified by peer review) is the author/funder. All rights reserved. No reuse allowed without permission. The copyright holder for this preprint (which wasthis version posted August 1, 2019. . https://doi.org/10.1101/722124doi: bioRxiv preprint

Three-fluorophore FRET-FLIM enables the study of trimeric protein interactions
19
the observed higher peak at 520 nm. The D:A1 ratio of the interacting protein
sequences was slightly lower (Fig. 4D) than that for the combinations with FLS-A2
(Fig. 4B). Consequently, a part of the decrease at 520 nm can be due to decreased
expression. But as the D:A1 ratio in RLP44–BAK1–BRI1 was the same as in RLP44-
BRI1-FLS2, similar characteristics was expected, when there is no FRET. This was
clearly not the case, indicating FRET between BAK1-A1 and BRI1-A2.
The D:A2 ratio was 1:2 for RLP44–BRI1–BAK1 and 1:3 for RLP44–BAK1–BRI1.
Higher A2 expression for RLP44–BAK1–BRI1 did not lead to a higher peak intensity
at 610 nm. Also, higher expression levels of FLS2-A2 (with D:A2 ratios of 1:3 and 1:4)
did previously not lead to a detectible peak at 610 nm (Fig. 5A).
In summary, FRET from D via A1 to A2 was shown specifically for RLP44–BRI1–BAK1
and RLP44–BAK1–BRI1. As we could establish three-fluorophore FRET, we now
tested, whether the complex formation could also be shown with fluorescence lifetime
imaging (FLIM), which can be carried out more accurately.
RLP44, BRI1 and BAK1 form a multiprotein complex in vivo
When studying three-way interactions with intensity-based methods, the ratio between
donor and acceptor molecules is of major importance, as spectral bleed-through and
cross excitation mask FRET. In contrast, when monitoring the fluorescence lifetime
FLT of D (τ) with FLIM, no such careful calibrations are necessary and hence
circumvents the extensive correction analysis. We therefore tested, whether complex
formation of RLP44, BRI1 and BAK1 could be shown by monitoring the FLT of the D
fluorophore (Fig 5).
The average FLT of RLP44-D was 4 ns (Fig 5A), which was in accordance with
previously published studies (Goedhart et al., 2012; Hecker et al., 2015). Co-
expression of BRI1 coupled to either A1 or A2 caused a significant decrease in τ,
meaning that FRET was possible from D to both A1 and A2. As the Förster distance
of the D-A1 fluorophore pair was larger than that of D-A2, this could account for the
slightly lower τ for RLP44–BRI1 compared to RLP44– –BRI1.
Co-expression of FLS2 with RLP44-D did not cause a significant decrease in τ,
irrespective of the acceptor fluorophore (Fig 5A,B). The expression of FLS2-A2 with
the RLP44–BRI1 pair did not further change the τ significantly. In contrast, the
not certified by peer review) is the author/funder. All rights reserved. No reuse allowed without permission. The copyright holder for this preprint (which wasthis version posted August 1, 2019. . https://doi.org/10.1101/722124doi: bioRxiv preprint
Three-fluorophore FRET-FLIM enables the study of trimeric protein interactions
20
expression of BAK1-A2 with the RLP44–BRI1 pair lead to a significant decrease in τ
compared to both RLP44–BRI1 and RLP44–BRI1–FLS2.
Importantly, if only RLP44-BRI1 heterodimers and RLP44-BAK1 heterodimers were
present, then the fluorescence lifetime would be expected to be the average between
them. But as the τ further decreased, both BRI1 and BAK1 must have drained energy
from RLP44-D at the same time. This clearly indicates, that RLP44, BRI1 and BAK1
formed a trimeric complex in vivo. In summary, in comparison to the intensity-based
FRET, we could fast and conveniently show the specific complex formation of RLP44,
BRI1 and BAK1 with three-fluorophore FRET-FLIM.
Differences in fluorophore stoichiometry were not a significant factor influencing the fluorescence lifetimes
It was shown previously, that FRET-FLIM is independent of the donor concentration
(Becker, 2012). However, the relative amount of acceptor in comparison to the donor
(the donor-to-acceptor ratio) may influence the measured FLT (Sun et al., 2010; Bunt
and Wouters, 2017). Therefore, we tested, whether different fluorescent protein
ratios were an additional factor, that influenced the measured lifetimes of Fig. 6A.
We thus quantified, whether the ratios in fluorescence intensity for each FRET-pair
changed for different co-expression in N. benthamiana leaves (see Supplemental
Material 7, SI Fig. 6B). Only the donor-to-acceptor ratio D:A2 between RLP44–BRI1–
FLS2 and RLP44–BRI1–BAK1 was changed significantly, meaning that FLS2-A2 was
significantly less abundant than BAK1-A2 when co-expressed with RLP44-BRI1 (SI
Fig. 6B). Indeed, the fluorescence lifetime was slightly higher for RLP44–BRI1–FLS2
compared to RLP44–BRI1.
However, as only one donor-to-acceptor ratio was changed significantly, differences
in expression strength were not a major factor that influenced the fluorescence
lifetimes. Only if the donor-to-acceptor ratio would be changed at the same time, the
additional decrease in FLT for RLP44–BRI1–BAK1 compared to RLP44–BRI1 and
RLP44– –BAK1 could be explained with only heterodimers. But as ratios were not
significantly changed, trimeric interaction must have been present. Furthermore, our
data indicate, that if the fusion proteins are expressed from one plasmid, no further
measurement of the donor-to-acceptor ratios are necessary and thus simplify the work
flow. In summary, we could establish an interaction test for three proteins in vivo.
not certified by peer review) is the author/funder. All rights reserved. No reuse allowed without permission. The copyright holder for this preprint (which wasthis version posted August 1, 2019. . https://doi.org/10.1101/722124doi: bioRxiv preprint
Three-fluorophore FRET-FLIM enables the study of trimeric protein interactions
21
Discussion Many studies in the animal field have independently established a set of fluorophores
for studying the complex formation of three proteins within the cellular context
(localization) and in time (Scott and Hoppe, 2015). Here we provide three-fluorophore-
FRET and FLIM measurements with the best and widely tested donor fluorophore
mTRQ2, mVenus as intermediate and mRFP as second acceptor in plant cells, namely
the epidermal leaf cells of N. benthamiana. Lin et al 2018 found, that with the
expression of a donor-acceptor pair from one vector, a linear relationship between
FRET efficiency and Kd existed, and that different orientation factors had only a minor
influence compared to 10-fold differences in affinity. Importantly they concluded, that
if [A] and [B] are at the same concentration, the equilibrium, A + B ⇔ AB, will be driven
toward an increase in [AB] when the affinity increases. This means, that as long as A
and B have the same concentration, the actual molarity of both (nM, µM, …) is of minor
importance. This is only true until a certain concentration, at which a correction factor
f has to be included, as additional density-dependent nonspecific aggregation effects
happen (Oravcova´ et al., 1996; Mallik et al., 2008; Vuignier et al., 2010). Relative
fluorescent quantifications are thus a means to compare two samples with each other,
as both the correction factor and the molarity are in the same order of magnitude.
Interaction studies in N. benthamiana leaves may provide a first glimpse on native
cellular dynamics.
A comparative study on viable fluorophores has found that mTRQ2, YPet and mCherry
is the most promising combination for three-fluorophore FRET (Scott and Hoppe,
2015). Even though mVenus is less bright than e.g. YPet, it importantly is a monomer
(Bajar et al., 2016). We reasoned, that a reduced Förster distance is of less concern
than the tendency to form homo-oligomer aggregates at high concentrations or when
confined, which is the case for plasma membrane-resident proteins (Miyawaki, 2011;
Bajar et al., 2016). Surprisingly, high brightness fluorophores like Ruby2 or TagRFPs
were outperformed by mCherry, that overcompensates its low brightness with its fast
maturation rate (Hoppe et al., 2013).Even though mRFP is by now out-performed by
newer fluorophores, the maturation time is very short, which makes it an appropriate
A2 fluorophore. Future studies may consider using mCherry instead of mRFP.
Especially, since mCherry has been shown to only weakly oligomerize even under
harsh oxidizing environments such as in the lumen of the ER and Golgi stacks
not certified by peer review) is the author/funder. All rights reserved. No reuse allowed without permission. The copyright holder for this preprint (which wasthis version posted August 1, 2019. . https://doi.org/10.1101/722124doi: bioRxiv preprint

Three-fluorophore FRET-FLIM enables the study of trimeric protein interactions
22
(Costantini et al., 2015). The usage of a blue, yellow and red fluorophore was the most
abundant application for triple-FRET studies, as it provides a good compromise
between large Förster distances due to high spectral overlap, and enough differences
in excitation and emission spectra to detect each one separately. Until now, no study
circumvented the direct FRET between D-A2 for genetically encoded fluorophores (He
et al., 2005; Sun et al., 2010; Pauker et al., 2012; Hoppe et al., 2013; Wallrabe et al.,
2013; Kuo et al., 2018). Possibly, because corrections for cross-talk would be still
necessary and because it provides an additional layer of information on how the two
fluorophores are located relative to each other. The use of dyes would have provided
even better detection boundaries with excellent physicochemical properties. For plant
cells, however, this may prove very challenging, as the cell wall likely interferes with
in vivo labelling. Already in animal cells, which are rendered permeable as a matter of
routine, different labelling efficiencies have shown to be problematic for three-
fluorophore-FRET as the correction for directly excited acceptor fluorescence
becomes difficult (Fazekas et al., 2008; Becker, 2012; Fábián et al., 2013).
As of yet only one study has tried to estimate, what distances between the
fluorophores represent the dynamic range of their set. We think, that a realistic
estimation of the variability/boundaries of a system (due to secondary factors) is
important for the interpretation of data. For example, the general rule of thumb for
FRET to happen (below 10 nm) may be unprecise or incorrect. In this study, we have
calculated adapted Förster distances to take several factors into account: first, the
spatial arrangement of the fluorophores and secondly, two factors that influence the
dipole orientation factor (stoichiometry and planar distribution). Indeed, for the
fluorophores mTRQ2, mVEN and mRFP, the adjusted Förster distance can span up
to ~12 nm, with 10% FRET occurring below distances of 15 nm. When imagining how
receptors with their signalling components are dispersed in the plasma membrane, not
only monomers, dimers and trimers have to be considered. Also, intermediate forms
are possible, where the A1 of another signalling complex can function as acceptor,
relaying the energy to an even further located A2 of a completely different signalling
complex (Fig. 7A). Consequently, triple-FRET in plasma membrane applications can
possibly span to other, not that far distanced signalling components.
not certified by peer review) is the author/funder. All rights reserved. No reuse allowed without permission. The copyright holder for this preprint (which wasthis version posted August 1, 2019. . https://doi.org/10.1101/722124doi: bioRxiv preprint

Three-fluorophore FRET-FLIM enables the study of trimeric protein interactions
23
If the intermediate fluorophore A1 is located between D and A2, the energy moving to
A1 can be transferred to A2, thus increasing the range. Our calculation on long-
distance FRET with an intermediate A1 did not account for the additionally present
direct FRET between D-A2. Direct D-A2 FRET reduces the energy that can be
transferred along D-A1-A2, as two acceptors drain energy from D. We assumed, that
the distance between D and A2 was too large for direct FRET, as we were interested
in the FRET efficiency at larger distances. Consequently, our calculations on the D-
A2 FRET efficiency are underestimations for small D-A2 distances. When assuming
D is located in the middle, the likelihood of energy moving via A1 to A2 decreases, as
the distance between A1 and A2 increases. These spatial arrangements may be
considered with intensity-based FRET measurements. For FLIM-based FRET
measurements, the differences between spatial conformations may not be visible, as
no information is available on where the energy is transferred to. In exchange, FLIM-
based measurements have the advantage of a higher sensitivity, as the signal-to-noise
ratio in intensity-based FRET measurements is worse after unmixing and sensitized
emission calculations. Secondly, the planar distribution of plasma membrane-resident
proteins increases the likelihood of FRET to happen, as the standard assumption of
κ2 = 2/3 is modified. Lastly, the ratio in donor-to-acceptor fluorophore ratios may
influence FRET, making energy transfer more likely with a surplus of acceptors.
Another study estimated the influence to be even more severe, so that with multiple
acceptors (n) proximal to a single donor fluorophore, the operational R0 becomes n-
times R0 (Jares-Erijman and Jovin, 2003; Müller et al., 2013). All these factors mask
the possibly linear relationship between FRET and the dissociation constant.
Therefore, no conclusions on affinity can be drawn and only limited information on the
distance between the three fluorophores.
It was previously not clear, whether RLP44 interacts with both BRI1 and BAK1 in vivo
at the same time, forming a trimeric complex. In this study, we provided evidence that
RLP44 is located in close proximity to both the brassinosteroid-sensing receptor BRI1
and its co-factor BAK1 (below 15 nm) by applying both FRET and FRET-FLIM
measurements. We observed an additional decrease in the FLT upon addition of
BAK1-A2 to the RLP44-D / BRI1-A1 pair. Also, in FRET measurements the energy
transfer from D via A1 to A2 was detectable specifically for RLP44–BRI1–BAK1 and
RLP44–BAK1–BRI1. This is only possible, if either trimers (Fig. 7B) or intermediate
not certified by peer review) is the author/funder. All rights reserved. No reuse allowed without permission. The copyright holder for this preprint (which wasthis version posted August 1, 2019. . https://doi.org/10.1101/722124doi: bioRxiv preprint

Three-fluorophore FRET-FLIM enables the study of trimeric protein interactions
24
spatial arrangements (Fig. 7A) are present. If only heterodimers are formed, then the
measured FLT of RLP44‒BRI‒BAK1 would be the average of RLP44‒BRI1 and
RLP44‒ ‒BAK1. (Or the FLT would increase, as D-A1 and D-A2 pairs would be split,
as new pairs A1-A2 are formed.) Only with a changed donor-to-acceptor ratio, the
additional decrease in FLT could be explained with only heterodimers. But as ratios
were not significantly changed, intermediate forms and/or trimeric arrangements must
have been present. The restoration of the A2 peak and the energy transfer from A1 to
A2 visible in the spectra of RLP44–BRI1–BAK1 compared to RLP44–BRI1–FLS2 is
an additional evidence for close complex formation.
Interestingly, FLS2 must have been distanced more than 15 nm from the RLP44-BAK1
and RLP44-BRI1 heterodimers. However, FLS2 and BAK1 were shown to only
associate upon flg2 treatment (Somssich et al., 2015). Throughout the study, the
expression level of FLS2-A2 was much lower than for the other A2-fusion proteins. An
influence on expression level due to differences in size was unlikely, as FLS2 with
1173 amino acids was as large as BRI1 with 1196 AA. Possibly, the overexpression
of growth-/development-mediating proteins decreases the level of FLS2 in the PM. In
theory, the lower expression of FLS2 could mask a possible interaction between
RLP44 and FLS2 in intensity-based FRET measurements. However, no interaction
between them was observed in the more sensitive FRET-FLIM measurements and
previously, no interaction was found in BiFC (Garnelo Gomez et al., 2019). Our
observation that BRI1 and FLS2 are located in distinct sub-compartments in the PM
is in accordance with previous evidence by variable angle epifluorescence microscopy
(VAEM) using BRI1-eGFP and FLS2-RFP (Bücherl et al., 2017).
not certified by peer review) is the author/funder. All rights reserved. No reuse allowed without permission. The copyright holder for this preprint (which wasthis version posted August 1, 2019. . https://doi.org/10.1101/722124doi: bioRxiv preprint

Three-fluorophore FRET-FLIM enables the study of trimeric protein interactions
25
Material and methods Plasmid construction
The cDNA sequence of the gene of interest wo stop was brought into pDONR221-
P3P2 (donor) or pDONR221-P1P4 (first acceptor) or pENTR™/D-TOPO® (second
acceptor) as described by guidelines in the Gateway manual (Life Technologies) with
primers listed in Supp. material 8. The coding sequence of BRI1 and BAK1 was
brought in the pENTR-D-TOPO previously (Caesar et al., 2011; Witthöft et al., 2014).
For the generation of BRI1-HA, primer previously published were used (Wolf et al.,
2014) to bring CDS of BRI1 in pDONR207 and an LR with pGWB14 was performed.
The LR into pB7RWG2 (RFP) (Karimi et al., 2002) and the 2in1 FRET vector pFRETtv-
2in1-CC (Hecker et al., 2015) was performed as described previously (Grefen and
Blatt, 2012; Hecker et al., 2015).
Localization and FRET-FLIM studies Transformation of N. benthamiana was performed as described by (Hecker et al.,
2015; Ladwig et al., 2015), omitting the washing step with sterile water. For
transformations with multiple constructs, an OD600 of 0.1 was set and mixed 1:1:1 with
silencing inhibitor p19. Plants were watered and left to ambient conditions (24°C) with
lid on top and imaged two days past transformation at the SP8 confocal laser scanning
microscope (CLSM) (Leica Microsystems GMBH) with LAS AF and SymPhoTime
software using a 63x/1.20 water immersion objective (Ladwig et al., 2015; Mohrholz
et al., 2019). Data were derived from measurements of the lower epidermis, avoiding
guard cells and stomata, with at least two biological replicates, comprising in average
20 data points and 11 data points for mTRQ2 – mRFP controls. Localization and
quantification were performed with a minimum 3-fold line average for mTRQ2, mVEN
and mRFP with Argon laser set to 2 % and excitations of 458 nm 40 %, 514 nm 20 %
and 594 nm 30 % and emission detection with 465-505 nm 400 % on HyD, 525-565 nm
400 % on SMD HyD and 605-650 nm 300 % on SMD HyD, respectively. For the FLIM
study, excitation of fluorophores was simultaneous due to the inability in Leica
software to use sequential excitation while in FLIM-mode.
FLIM measurements were performed with a 440 nm puled laser (LDH-P-C-470) with
40 MHz repetition rate and a reduced speed yielding, with an image resolution of
256x256, a pixel dwell time of ~20 µs. Max count rate was set to ~2000 cps.
not certified by peer review) is the author/funder. All rights reserved. No reuse allowed without permission. The copyright holder for this preprint (which wasthis version posted August 1, 2019. . https://doi.org/10.1101/722124doi: bioRxiv preprint

Three-fluorophore FRET-FLIM enables the study of trimeric protein interactions
26
Measurements were stopped, when the brightest pixel had a photon count of 500.
Only measurements with an even intensity distribution at the PM were included. The
corresponding emission was detected with a Leica HyD SMD detector from 455 nm to
505 nm by time-correlated single-photon counting using a Picoharp 300 module
(PicoQuant, Berlin). The calculation of FLTs was performed by iterative reconvolution,
i.e. the instrument response function was convolved with exponential test functions to
minimize the error with regard to the original TCSPC histograms in an iterative
process. While the donor-only samples were fitted with monoexponential decay
functions, the energy transfer to fluorophores in the other samples resulted in
additional decay rates. These histograms necessitated biexponential fitting functions,
from which the fluorescent lifetime was derived by intensity weighted averaging. For
the fastFLIM measurements, the max. count rate was increased.
Acquisition of λ-stacks (spectra)
Expression of relevant fluorophores were checked via fluorescence level prior λ-stack
acquisition. For λ-stacks, both sequential excitation and simultaneous excitation was
used as mentioned in results and an average of at least 6 ROI of the PM with different
expression levels of at least 2 biological replicates. At the Leica SP8 excitation at
458 nm 80 % was used with SMD HyD ~250 %, measuring 460-625 nm with Δ7.5 nm
with 256x256 resolution, a pixel dwell time of ~20 µs and three-fold line accumulation.
At Zeiss LSM880 excitation at 485 nm with 30%, NF458, 800 V of airy-scan detectors
were used, measuring 460-650 nm or 560-650 nm with Δ4.5 nm, resolution of
256x256, speed 2, digital gain set to 2, pinhole set to 14.25 airy units and a three-fold
line accumulation. If over-all expression was very high, then for all samples measured
that day line average was taken instead.
Protein structures and sizes
The intracellular domain of BRI1 and BAK1 as well as the fluorophore barrel
(GFP/KKK. A redesigned GFP with improved solubility) was exported from Protein
Data Base (PDB). As viewer JSmol (JavaScript) with solvent accessible depiction was
chosen and color of proteins were changed. The secondary structure of linkers and
the intracellular RLP44 domain was predicted with PEP-FOLD 3.5, de-novo prediction,
with standard settings and always model no1 (of 10) was used. Aminoacid sequences
not certified by peer review) is the author/funder. All rights reserved. No reuse allowed without permission. The copyright holder for this preprint (which wasthis version posted August 1, 2019. . https://doi.org/10.1101/722124doi: bioRxiv preprint

Three-fluorophore FRET-FLIM enables the study of trimeric protein interactions
27
were HPTFLYKVGQLLGTS for the donor-linker, NPAFLYKVVSRLGTS for the
acceptor-linker, KGGRADPAFLYKVVIS for the second acceptor linker and
CLWLRITEKKIVEEEGKISQSMPDY for RLP44Cyto. The size of intracellular domains
was calculated from the known distance of the alpha-barrel secondary structure, which
is Δ5.4 Å from turn-to-turn and 4 Å inner diameter.
Scripts
Calculation of Förster distance and FRET-efficiency was performed with excel sheet
provided by Mark Hink (2003), which was adapted by Nina Visser (2011) and values
in Supp. Material Table 1. Calculation of FRET-efficiency for variable position of mVEN
was performed with python script in Supp. Material 2 and executed online in “Coding
Ground – Execute Python online” (Python v2.7.13).
Simulation of spectra with mTRQ2, mVEN and mRFP were performed in
MatLabR2017b or MatLabR2018b with the script in Supp. Material 4A. For simulation
of cross-talk with different fluorophore ratios, changes in Supp. Material 4B were
applied. Spectra were interpolated from data points with Supp. Material 5 and then
subjected to spectral unmixing with the Matlab script in Supp. Material 6.
Statistics Images were generated with Microsoft Excel v1809, SAS JMP 14 or MatLabR2017b
and MatLabR2018b, also using those programs for calculation of average, standard
error (SE) and standard deviation (SD). To test for homogeneity of variance Levene’s
test (p < 0.05) was employed and statistical significance for non-parametic
distributions was calculated by a two-tailed, all-pair Kruskal-Wallis test followed by a
Steel-Dwass post hoc correction using SAS JMP version 14.0.0 (Ohmi et al., 2016).
For small sample numbers in Fig. 3d the 2-sample t-test was chosen (de Winter, J. C
.F., 2013).
not certified by peer review) is the author/funder. All rights reserved. No reuse allowed without permission. The copyright holder for this preprint (which wasthis version posted August 1, 2019. . https://doi.org/10.1101/722124doi: bioRxiv preprint
Three-fluorophore FRET-FLIM enables the study of trimeric protein interactions
28
Figures with legends
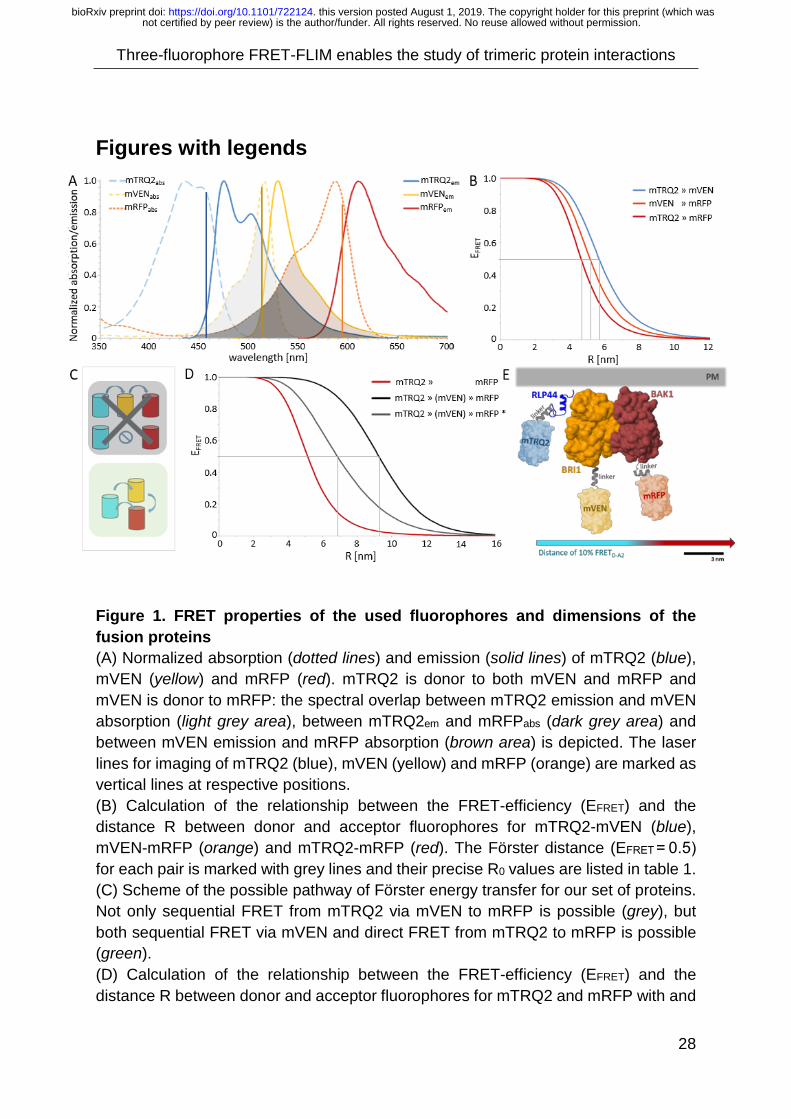
Figure 1. FRET properties of the used fluorophores and dimensions of the fusion proteins (A) Normalized absorption (dotted lines) and emission (solid lines) of mTRQ2 (blue), mVEN (yellow) and mRFP (red). mTRQ2 is donor to both mVEN and mRFP and mVEN is donor to mRFP: the spectral overlap between mTRQ2 emission and mVEN absorption (light grey area), between mTRQ2em and mRFPabs (dark grey area) and between mVEN emission and mRFP absorption (brown area) is depicted. The laser lines for imaging of mTRQ2 (blue), mVEN (yellow) and mRFP (orange) are marked as vertical lines at respective positions. (B) Calculation of the relationship between the FRET-efficiency (EFRET) and the distance R between donor and acceptor fluorophores for mTRQ2-mVEN (blue), mVEN-mRFP (orange) and mTRQ2-mRFP (red). The Förster distance (EFRET = 0.5) for each pair is marked with grey lines and their precise R0 values are listed in table 1. (C) Scheme of the possible pathway of Förster energy transfer for our set of proteins. Not only sequential FRET from mTRQ2 via mVEN to mRFP is possible (grey), but both sequential FRET via mVEN and direct FRET from mTRQ2 to mRFP is possible (green). (D) Calculation of the relationship between the FRET-efficiency (EFRET) and the distance R between donor and acceptor fluorophores for mTRQ2 and mRFP with and
not certified by peer review) is the author/funder. All rights reserved. No reuse allowed without permission. The copyright holder for this preprint (which wasthis version posted August 1, 2019. . https://doi.org/10.1101/722124doi: bioRxiv preprint

Three-fluorophore FRET-FLIM enables the study of trimeric protein interactions
29
without and intermediate acceptor fluorophore. The Förster distance (R0) for mTRQ2-mRFP (red) is shown. Calculation of an adjusted R0 between mTRQ2 and mRFP, if mVEN is in the middle (black) as calculated by (Haustein et al., 2003). For an in vivo system, the intermediate fluorophore is unlikely to be precisely in the middle between donor and second acceptor. Calculation of the average FRET-efficiency of each possible distance of mVEN between mTRQ2 and mRFP with Δ 1 nm step size (grey). (E) Composite image of the cytoplasmic domains of RLP44 (blue), BRI1 (orange) and BAK1 (brown) fused with 15 amino acid-long Gateway®-linker to mTRQ2 (light blue), mVEN (light yellow) and mRFP (light red). Proteins with known structure were depicted as solvent-accessible surface models (BRI1Cyto, BAK1Cyto, Fluorophore-barrel: GFP (1EMA) in RCSB). Structures of RLP44Cyto and the three Gateway®-linker (grey) were predicted with PEP-FOLD3 and depicted as cartoons. The plasma membrane was located above. The distance, at which 10% FRET between mTRQ2 and mRFP occurs for a stochiometry of 1:5 in the plasma membrane is shown below (blue-to-red arrow).
not certified by peer review) is the author/funder. All rights reserved. No reuse allowed without permission. The copyright holder for this preprint (which wasthis version posted August 1, 2019. . https://doi.org/10.1101/722124doi: bioRxiv preprint
Three-fluorophore FRET-FLIM enables the study of trimeric protein interactions
30
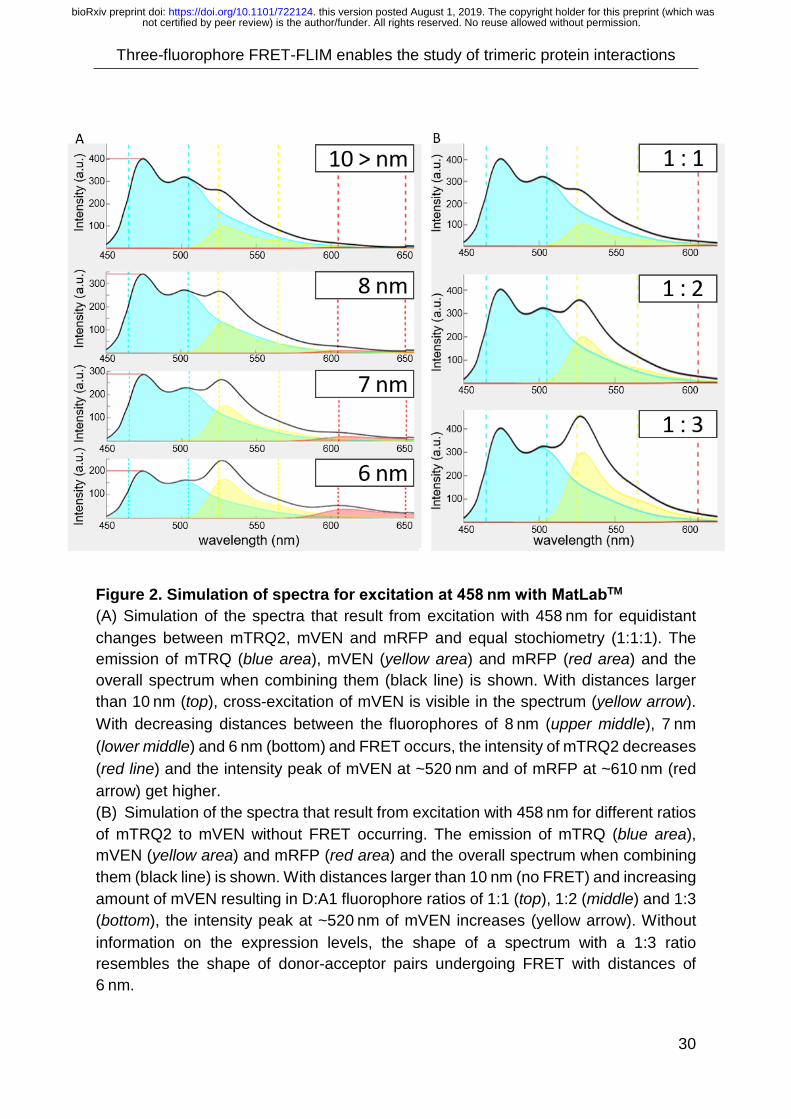
Figure 2. Simulation of spectra for excitation at 458 nm with MatLabTM (A) Simulation of the spectra that result from excitation with 458 nm for equidistant changes between mTRQ2, mVEN and mRFP and equal stochiometry (1:1:1). The emission of mTRQ (blue area), mVEN (yellow area) and mRFP (red area) and the overall spectrum when combining them (black line) is shown. With distances larger than 10 nm (top), cross-excitation of mVEN is visible in the spectrum (yellow arrow). With decreasing distances between the fluorophores of 8 nm (upper middle), 7 nm (lower middle) and 6 nm (bottom) and FRET occurs, the intensity of mTRQ2 decreases (red line) and the intensity peak of mVEN at ~520 nm and of mRFP at ~610 nm (red arrow) get higher. (B) Simulation of the spectra that result from excitation with 458 nm for different ratios of mTRQ2 to mVEN without FRET occurring. The emission of mTRQ (blue area), mVEN (yellow area) and mRFP (red area) and the overall spectrum when combining them (black line) is shown. With distances larger than 10 nm (no FRET) and increasing amount of mVEN resulting in D:A1 fluorophore ratios of 1:1 (top), 1:2 (middle) and 1:3 (bottom), the intensity peak at ~520 nm of mVEN increases (yellow arrow). Without information on the expression levels, the shape of a spectrum with a 1:3 ratio resembles the shape of donor-acceptor pairs undergoing FRET with distances of 6 nm.
not certified by peer review) is the author/funder. All rights reserved. No reuse allowed without permission. The copyright holder for this preprint (which wasthis version posted August 1, 2019. . https://doi.org/10.1101/722124doi: bioRxiv preprint
Three-fluorophore FRET-FLIM enables the study of trimeric protein interactions
31
Figure 3. Measured spectra for excitation at 458 nm (top) and quantification of fluorescence intensities (bottom) in N. benthamiana leaf cells (A) The average raw intensity ± SD in dependence of the wavelength for excitation at 458 nm is shown for RLP44-mTRQ2 (blue), FLS2-mVEN (yellow) and BAK1-mRFP (red). Measurement of spectra for the transformation of single fusion proteins in N. benthamiana. (B) Average raw intensity ± SE in the mTRQ2 channel (left), mVEN channel (middle) and mRFP channel (right) of 8bit images after correction for spectral bleed through for RLP44-mTRQ2 (blue), FLS2-mVEN (yellow) and BAK1-mRFP (red). Quantification of the fluorescence intensities of the spectra shown in (A). (C) The average normalized intensity ± SE in dependence of the wavelength is shown for co-expression of RLP44-mTRQ2 with BRI1-mVEN (interacting, blue) and for the co-expression of RLP44-mTRQ2 with FLS2-mVEN (non-interacting, grey) is shown. For both spectra, the average donor-to-acceptor ratio is ~1:4 (0.26). The peak in intensity around 520 nm of the mVEN signal is indicated (arrow). A magnification of the wavelengths that are relevant for mVEN detection is shown.
not certified by peer review) is the author/funder. All rights reserved. No reuse allowed without permission. The copyright holder for this preprint (which wasthis version posted August 1, 2019. . https://doi.org/10.1101/722124doi: bioRxiv preprint
Three-fluorophore FRET-FLIM enables the study of trimeric protein interactions
32
(D) Proportion of mVEN signal in the recorded spectra with the same donor-to-acceptor ratio for excitation at 458 nm. Ratios of 0.26 (filled boxes, left) and ratios of ~ 0.12 (empty boxes, right) of interacting (RLP44–BRI1, blue) and non-interacting samples (RLP44–FLS2, grey) are shown. The ratio of 0.26 comprises n=7 measurements and the 0.12 ratio n=12 measurements. Significant changes in a two-sided 2-sample t-test with p<0.05 is indicated by an asterisk. (E) The average normalized intensity ± SE in dependence of the wavelength is shown for the expression of RLP44-mTRQ2 (blue), RLP44-mTRQ with FLS2-mRFP (black), RLP44-mTRQ with BAK1-mRFP (brown) and for RLP44-mTRQ with BRI1-mRFP (red). Förster resonance energy transfer from mTRQ2 to mRFP for interacting proteins (brown, red) in comparison to non-interacting proteins (black) is indicated (arrow). A magnification of the wavelengths that are relevant for mRFP detection is shown. (F) Average raw intensity ± SE in the mTRQ2 channel (left), mVEN channel (middle) and mRFP channel (right) of 8bit images for of RLP44-mTRQ2 (blue), RLP44-mTRQ with FLS2-mRFP (black), RLP44-mTRQ with BAK1-mRFP (brown) and for RLP44-mTRQ with BRI1-mRFP (red). Quantification of the fluorescence intensities of the spectra shown in (E).
not certified by peer review) is the author/funder. All rights reserved. No reuse allowed without permission. The copyright holder for this preprint (which wasthis version posted August 1, 2019. . https://doi.org/10.1101/722124doi: bioRxiv preprint

Three-fluorophore FRET-FLIM enables the study of trimeric protein interactions
33
Figure 4. Measured spectra for excitation at 458 nm and quantification of fluorescence intensities in N. benthamiana leaf cells (A) The average normalized intensity ± SE in dependence of the wavelength is shown for the expression of RLP44-mTRQ2 with the non-fluorescent BRI1-HA (BRIHA) (blue), RLP44-mTRQ with BAK1-mRFP (red) and RLP44 with BRI1HA and BAK1-mRFP (black). A magnification of the wavelengths that are relevant for mRFP detection is shown. (B) Average raw intensity ± SE in the mTRQ2 channel (left), mVEN channel (middle) and mRFP channel (right) of 8bit images for RLP44-mTRQ2 with BRI1-HA (BRIHA) (blue), RLP44-mTRQ2 with BAK1-mRFP (red) and RLP44-mTRQ2 with BRI1HA and BAK1-mRFP (black). Quantification of the fluorescence intensities of the spectra shown in (A). Each channel was excited sequentially.
not certified by peer review) is the author/funder. All rights reserved. No reuse allowed without permission. The copyright holder for this preprint (which wasthis version posted August 1, 2019. . https://doi.org/10.1101/722124doi: bioRxiv preprint

Three-fluorophore FRET-FLIM enables the study of trimeric protein interactions
34
(C) The average normalized intensity ± SE in dependence of the wavelength is shown for the expression of RLP44-mTRQ with BAK1-mRFP (red1), RLP44-mTRQ2 with BRI1HA and BAK1-mRFP (black1), RLP44-mTRQ2 with BRI1-mVEN (yellow) and of RLP44-mTRQ2 with BRI1-mVEN and BAK1-mRFP (dark red). A magnification of the wavelengths that are relevant for mRFP detection is shown. [note1: same curves as in A]. (D) Average raw intensity ± SE in the mTRQ2 channel (left), mVEN channel (middle) and mRFP channel (right) of 8bit images for RLP44-mTRQ2 with BRI1HA and BAK1-mRFP (black1), RLP44-mTRQ2 with BRI1-mVEN (yellow) and of RLP44-mTRQ2 with BRI1-mVEN and BAK1-mRFP (dark red). Quantification of the fluorescence intensities of the spectra shown in (C). Each channel was excited sequentially.
not certified by peer review) is the author/funder. All rights reserved. No reuse allowed without permission. The copyright holder for this preprint (which wasthis version posted August 1, 2019. . https://doi.org/10.1101/722124doi: bioRxiv preprint

Three-fluorophore FRET-FLIM enables the study of trimeric protein interactions
35
Figure 5. Measured spectra for excitation at 458 nm and quantification of
fluorescence intensities in N. benthamiana leaf cells (A) The average normalized intensity ± SE in dependence of the wavelength is shown for the expression of RLP44-mTRQ2 (blue), RLP44-mTRQ2 with BRI1-mVEN and FLS-mRFP (red) and RLP44-mTRQ2 with BAK1-mVEN and FLS2-mRFP (brown). The peak in the spectrum of mVEN (yellow arrow) and of mRFP (red arrow) is marked. (B) Average raw intensity ± SE after correction for bleed-through and cross excitation in the mTRQ2 channel (left), mVEN channel (middle) and mRFP channel (right) of 8bit images for RLP44-mTRQ2 (blue), RLP44-mTRQ2 with BRI1-mVEN and FLS-mRFP (red) and RLP44-mTRQ2 with BAK1-mVEN and FLS2-mRFP (brown). Quantification of the fluorescence intensities of the spectra shown in (A).
not certified by peer review) is the author/funder. All rights reserved. No reuse allowed without permission. The copyright holder for this preprint (which wasthis version posted August 1, 2019. . https://doi.org/10.1101/722124doi: bioRxiv preprint

Three-fluorophore FRET-FLIM enables the study of trimeric protein interactions
36
(C) The average normalized intensity ± SE after correction for bleed-through and cross excitation in dependence of the wavelength is shown for the expression of RLP44-mTRQ (blue1), RLP44-mTRQ2 with BRI1-mVEN and BAK1-mRFP (red) and RLP44-mTRQ2 with BAK1-mVEN and BRI1-mRFP (brown). The peak in the spectrum of mVEN (yellow arrow) and of mRFP (red arrow) is marked. [note1: same curve as in A]. (D) Average raw intensity ± SE in the mTRQ2 channel (left), mVEN channel (middle) and mRFP channel (right) of 8bit images for RLP44-mTRQ (blue1), RLP44-mTRQ2 with BRI1-mVEN and BAK1-mRFP (red) and RLP44-mTRQ2 with BAK1-mVEN and BRI1-mRFP (brown). Quantification of the fluorescence intensities of the spectra shown in (B).
not certified by peer review) is the author/funder. All rights reserved. No reuse allowed without permission. The copyright holder for this preprint (which wasthis version posted August 1, 2019. . https://doi.org/10.1101/722124doi: bioRxiv preprint

Three-fluorophore FRET-FLIM enables the study of trimeric protein interactions
37
Figure 6. Fluorescence lifetime imaging in N. benthamiana leaf cells (A) Fluorescence lifetime τ ± SE of RLP44-mTRQ2 measured with FLIM. A pulsed excitation at 440 nm is used. Expression of RLP44-mTRQ2 alone, or in combination with BRI1-mVEN as first acceptor and BAK1-mRFP or FLS2-mRFP as second acceptor. An exemplary part of the PM with color-coded τ is displayed below. Asterisks indicate statistically significant differences from RLP44-mTRQ2 and from the co-expression of RLP44-mTRQ2 with FLS2-mRFP (p<0.001, black stars) and from RLP44+BRI1+FLS2 and RLP44-BRI1 (p=0.005, red star) in an ANOVA followed by Tukey-Kramer HSD post-hoc test. (B) Fluorescence lifetime τ ± SE of RLP44-mTRQ2 measured with Fast-FLIM. A pulsed excitation at 440 nm is used. Expression of RLP44-mTRQ2 alone, or in combination with FLS2-mVEN. An exemplary part of the PM with color-coded τ is displayed below. Statistical significance was tested with ANOVA followed by Tukey-Kramer HSD post-hoc test.
not certified by peer review) is the author/funder. All rights reserved. No reuse allowed without permission. The copyright holder for this preprint (which wasthis version posted August 1, 2019. . https://doi.org/10.1101/722124doi: bioRxiv preprint

Three-fluorophore FRET-FLIM enables the study of trimeric protein interactions
38
Figure 7. Three-fluorophore FRET-FLIM is possible for intermediate distances and for trimeric interaction Scheme of a possible spatial distribution of RLP44 (blue), BRI1 (red) and BAK1 (brown) in the plasma membrane. For simplicity, the labelling fluorophore was not depicted. In this example, RLP44-D, BRI1-A1 and BAK1-A2 fusions are present. FRET between D and A1 (white arrow), between A1 and A2 (yellow arrow) and between D and A2 (red arrow) are shown. Proteins and distances are not in scale. (A) Three-fluorophore FRET is possible between different signalling complexes. If one complex is located close to another distinct signalling complex, FRET is possible. In theory, a different complex containing the appropriately labelled fluorophore can function as relay to a further distanced complex. (B) FRET is possible between a complex without any relay.
not certified by peer review) is the author/funder. All rights reserved. No reuse allowed without permission. The copyright holder for this preprint (which wasthis version posted August 1, 2019. . https://doi.org/10.1101/722124doi: bioRxiv preprint

Three-fluorophore FRET-FLIM enables the study of trimeric protein interactions
39
Acknowledgements
The authors would like to thank Florian Fässler for critical reading of the manuscript.
Research in our laboratories was supported by the German Research Foundation
(DFG) with grants to SW (WO 1660/6-1, WO 1660/2) and to KH (HA 2146/22-1; CRC
1101-D02).
References
Bajar, B.T., Wang, E.S., Zhang, S., Lin, M.Z., and Chu, J. (2016). A Guide to
Fluorescent Protein FRET Pairs. Sensors (Basel, Switzerland) 16.
Becker, W. (2012). Fluorescence lifetime imaging--techniques and applications.
Journal of microscopy 247, 119-136.
Betzig, E. (1995). Proposed method for molecular optical imaging. Opt. Lett. 20, 237.
Betzig, E., Patterson, G.H., Sougrat, R., Lindwasser, O.W., Olenych, S., Bonifacino,
J.S., Davidson, M.W., Lippincott-Schwartz, J., and Hess, H.F. (2006). Imaging
intracellular fluorescent proteins at nanometer resolution. Science (New York, N.Y.)
313, 1642-1645.
Bojar, D., Martinez, J., Santiago, J., Rybin, V., Bayliss, R., and Hothorn, M. (2014).
Crystal structures of the phosphorylated BRI1 kinase domain and implications for
brassinosteroid signal initiation. The Plant journal : for cell and molecular biology 78,
31-43.
Boutant, E., Didier, P., Niehl, A., Mély, Y., Ritzenthaler, C., and Heinlein, M. (2010).
Fluorescent protein recruitment assay for demonstration and analysis of in vivo
protein interactions in plant cells and its application to Tobacco mosaic virus
movement protein. The Plant journal : for cell and molecular biology 62, 171-177.
Bücherl, C.A., Jarsch, I.K., Schudoma, C., Segonzac, C., Mbengue, M., Robatzek,
S., MacLean, D., Ott, T., and Zipfel, C. (2017). Plant immune and growth receptors
share common signalling components but localise to distinct plasma membrane
nanodomains. eLife 6.
not certified by peer review) is the author/funder. All rights reserved. No reuse allowed without permission. The copyright holder for this preprint (which wasthis version posted August 1, 2019. . https://doi.org/10.1101/722124doi: bioRxiv preprint
Three-fluorophore FRET-FLIM enables the study of trimeric protein interactions
40
Bücherl, C.A., van Esse, G.G., Kruis, A., Luchtenberg, J., Westphal, A.H., Aker, J.,
van Hoek, A., Albrecht, C., Borst, J.W., and Vries, S.C.d. (2013). Visualization of
BRI1 and BAK1(SERK3) membrane receptor heterooligomers during brassinosteroid
signaling. Plant Physiology 162, 1911-1925.
Bunt, G., and Wouters, F.S. (2017). FRET from single to multiplexed signaling
events. Biophysical reviews 9, 119-129.
Caesar, K., Elgass, K., Chen, Z., Huppenberger, P., Witthöft, J., Schleifenbaum, F.,
Blatt, M.R., Oecking, C., and Harter, K. (2011). A fast brassinolide-regulated
response pathway in the plasma membrane of Arabidopsis thaliana. The Plant
journal : for cell and molecular biology 66, 528-540.
Chen, X., Zaro, J.L., and Shen, W.-C. (2013). Fusion protein linkers. Property,
design and functionality. Advanced drug delivery reviews 65, 1357-1369.
Clouse, S.D., Langford, M., and McMorris, T.C. (1996). A Brassinosteroid-Insensitive
Mutant in Arabidopsis thaliana Exhibits Multiple Defects in Growth and Development.
Plant Physiology 111, 671-678.
Costantini, L.M., Baloban, M., Markwardt, M.L., Rizzo, M., Guo, F., Verkhusha, V.V.,
and Snapp, E.L. (2015). A palette of fluorescent proteins optimized for diverse
cellular environments. Nature Communications 6, 7670 EP -.
Cotnoir-White, D., El Ezzy, M., Boulay, P.-L., Rozendaal, M., Bouvier, M., Gagnon,
E., and Mader, S. (2018). Monitoring ligand-dependent assembly of receptor ternary
complexes in live cells by BRETFect. Proceedings of the National Academy of
Sciences of the United States of America 115, E2653-E2662.
de Winter, J. C .F. (2013). Using the Student's "t"-Test with Extremely Small Sample
Sizes. Practical Assessment, Research & Evaluation 18.
Di Rubbo, S., Irani, N.G., Kim, S.Y., Xu, Z.-Y., Gadeyne, A., Dejonghe, W.,
Vanhoutte, I., Persiau, G., Eeckhout, D., and Simon, S., et al. (2013). The clathrin
adaptor complex AP-2 mediates endocytosis of brassinosteroid insensitive1 in
Arabidopsis. The Plant cell 25, 2986-2997.
Fábián, Á., Horváth, G., Vámosi, G., Vereb, G., and Szöllősi, J. (2013). TripleFRET
measurements in flow cytometry. Cytometry. Part A : the journal of the International
Society for Analytical Cytology 83, 375-385.
not certified by peer review) is the author/funder. All rights reserved. No reuse allowed without permission. The copyright holder for this preprint (which wasthis version posted August 1, 2019. . https://doi.org/10.1101/722124doi: bioRxiv preprint
Three-fluorophore FRET-FLIM enables the study of trimeric protein interactions
41
Fazekas, Z., Petrás, M., Fábián, A., Pályi-Krekk, Z., Nagy, P., Damjanovich, S.,
Vereb, G., and Szöllosi, J. (2008). Two-sided fluorescence resonance energy
transfer for assessing molecular interactions of up to three distinct species in
confocal microscopy. Cytometry. Part A : the journal of the International Society for
Analytical Cytology 73, 209-219.
Förster, T. (1948). Zwischenmolekulare Energiewanderung und Fluoreszenz. Ann.
Phys. 437, 55-75.
Fried, S., Reicher, B., Pauker, M.H., Eliyahu, S., Matalon, O., Noy, E., Chill, J., and
Barda-Saad, M. (2014). Triple-color FRET analysis reveals conformational changes
in the WIP-WASp actin-regulating complex. Science signaling 7, ra60.
Friedrichsen, D.M., Joazeiro, C.A.P., Li, J., Hunter, T., and Chory, J. (2000).
Brassinosteroid-Insensitive-1 Is a Ubiquitously Expressed Leucine-Rich Repeat
Receptor Serine/Threonine Kinase. Plant Physiology 123, 1247-1256.
Gadella, T.W.J. (2009). FRET and FLIM techniques (Amsterdam, London: Elsevier).
Galperin, E., Verkhusha, V.V., and Sorkin, A. (2004). Three-chromophore FRET
microscopy to analyze multiprotein interactions in living cells. Nature Methods 1, 209
EP -.
Garnelo Gomez, B., Lozano-Duran, R., and Wolf, S. (2019). Phosphorylation-
dependent routing of RLP44 towards brassinosteroid or phytosulfokine signalling.
Supplemental Material.
George, R.A., and Heringa, J. (2002). An analysis of protein domain linkers. Their
classification and role in protein folding. Protein engineering 15, 871-879.
Goedhart, J., Stetten, D.v., Noirclerc-Savoye, M., Lelimousin, M., Joosen, L., Hink,
M.A., van Weeren, L., Jr, T.W.J.G., and Royant, A. (2012). Structure-guided
evolution of cyan fluorescent proteins towards a quantum yield of 93%. Nature
Communications 3, 751.
Grefen, C., and Blatt, M.R. (2012). A 2in1 cloning system enables ratiometric
bimolecular fluorescence complementation (rBiFC). BioTechniques 53, 311-314.
not certified by peer review) is the author/funder. All rights reserved. No reuse allowed without permission. The copyright holder for this preprint (which wasthis version posted August 1, 2019. . https://doi.org/10.1101/722124doi: bioRxiv preprint

Three-fluorophore FRET-FLIM enables the study of trimeric protein interactions
42
Großeholz, R., Feldman-Salit, A., Wanke, F., Schulze, S., Glöckner, N., Kemmerling,
B., Harter, K., and Kummer, U. (2019). Specifying the role of BAK1-interacting
receptor-like kinase 3 in brassinosteroid signaling. Journal of integrative plant
biology.
Haustein, E., Jahnz, M., and Schwille, P. (2003). Triple FRET. A tool for studying
long-range molecular interactions. Chemphyschem : a European journal of chemical
physics and physical chemistry 4, 745-748.
He, L., Wu, X., Simone, J., Hewgill, D., and Lipsky, P.E. (2005). Determination of
tumor necrosis factor receptor-associated factor trimerization in living cells by CFP-
YFP-mRFP FRET detected by flow cytometry. Nucleic acids research 33, e61.
Hecker, A., Wallmeroth, N., Peter, S., Blatt, M.R., Harter, K., and Grefen, C. (2015).
Binary 2in1 Vectors Improve in Planta (Co)localization and Dynamic Protein
Interaction Studies. Plant Physiology 168, 776-787.
Hink, M., Visser, A.J.W.G., Vysotski, E.S., and Lee, J. (2002). Critical Transfer
Distance Determination Between FRET Pairs.
Hochreiter, B., Garcia, A.P., and Schmid, J.A. (2015). Fluorescent proteins as
genetically encoded FRET biosensors in life sciences. Sensors (Basel, Switzerland)
15, 26281-26314.
Hohmann, U., Lau, K., and Hothorn, M. (2017). The Structural Basis of Ligand
Perception and Signal Activation by Receptor Kinases. Annual review of plant
biology 68, 109-137.
Hohmann, U., Nicolet, J., Moretti, A., Hothorn, L.A., and Hothorn, M. (2018a). The
SERK3 elongated allele defines a role for BIR ectodomains in brassinosteroid
signalling. Nature Plants 4, 345-351.
Hohmann, U., Santiago, J., Nicolet, J., Olsson, V., Spiga, F.M., Hothorn, L.A.,
Butenko, M.A., and Hothorn, M. (2018b). Mechanistic basis for the activation of plant
membrane receptor kinases by SERK-family coreceptors. Proceedings of the
National Academy of Sciences of the United States of America 115, 3488-3493.
Hohng, S., Joo, C., and Ha, T. (2004). Single-molecule three-color FRET.
Biophysical journal 87, 1328-1337.
not certified by peer review) is the author/funder. All rights reserved. No reuse allowed without permission. The copyright holder for this preprint (which wasthis version posted August 1, 2019. . https://doi.org/10.1101/722124doi: bioRxiv preprint

Three-fluorophore FRET-FLIM enables the study of trimeric protein interactions
43
Holzwart, E., Glöckner, N., Höfte, H., Harter, K. and Wolf, S. (2019). A novel mutant
allele uncouples brassinosteroid-dependent and independent functions of BRI1.
https://www.biorxiv.org/content/10.1101/605923v1. 01.05.2019.
Holzwart, E., Huerta, A.I., Glöckner, N., Garnelo Gómez, B., Wanke, F., Augustin, S.,
Askani, J.C., Schürholz, A.-K., Harter, K., and Wolf, S. (2018). BRI1 controls
vascular cell fate in the Arabidopsis root through RLP44 and phytosulfokine
signaling. Proceedings of the National Academy of Sciences of the United States of
America 115, 11838-11843.
Hoppe, A.D., Scott, B.L., Welliver, T.P., Straight, S.W., and Swanson, J.A. (2013). N-
way FRET microscopy of multiple protein-protein interactions in live cells. PloS one
8, e64760.
Hothorn, M., Belkhadir, Y., Dreux, M., Dabi, T., Noel, J.P., Wilson, I.A., and Chory, J.
(2011). Structural basis of steroid hormone perception by the receptor kinase BRI1.
Nature 474, 467-471.
Hum, J.M., Siegel, A.P., Pavalko, F.M., and Day, R.N. (2012). Monitoring biosensor
activity in living cells with fluorescence lifetime imaging microscopy. International
journal of molecular sciences 13, 14385-14400.
Hur, K.-H., Chen, Y., and Mueller, J.D. (2016). Characterization of Ternary Protein
Systems In Vivo with Tricolor Heterospecies Partition Analysis. Biophysical journal
110, 1158-1167.
Imkampe, J., Halter, T., Huang, S., Schulze, S., Mazzotta, S., Schmidt, N.,
Manstretta, R., Postel, S., Wierzba, M., and Yang, Y., et al. (2017). The Arabidopsis
Leucine-Rich Repeat Receptor Kinase BIR3 Negatively Regulates BAK1 Receptor
Complex Formation and Stabilizes BAK1. The Plant cell 29, 2285-2303.
Irani, N.G., Di Rubbo, S., Mylle, E., van den Begin, J., Schneider-Pizoń, J., Hniliková,
J., Šíša, M., Buyst, D., Vilarrasa-Blasi, J., and Szatmári, A.-M., et al. (2012).
Fluorescent castasterone reveals BRI1 signaling from the plasma membrane. Nature
chemical biology 8, 583-589.
Ishikawa-Ankerhold, H.C., Ankerhold, R., and Drummen, G.P.C. (2012). Advanced
fluorescence microscopy techniques--FRAP, FLIP, FLAP, FRET and FLIM.
Molecules (Basel, Switzerland) 17, 4047-4132.
not certified by peer review) is the author/funder. All rights reserved. No reuse allowed without permission. The copyright holder for this preprint (which wasthis version posted August 1, 2019. . https://doi.org/10.1101/722124doi: bioRxiv preprint

Three-fluorophore FRET-FLIM enables the study of trimeric protein interactions
44
Jaillais, Y., Hothorn, M., Belkhadir, Y., Dabi, T., Nimchuk, Z.L., Meyerowitz, E.M.,
and Chory, J. (2011). Tyrosine phosphorylation controls brassinosteroid receptor
activation by triggering membrane release of its kinase inhibitor. Genes &
development 25, 232-237.
Jares-Erijman, E.A., and Jovin, T.M. (2003). FRET imaging. Nature Biotechnology
21, 1387-1395.
Karimi, M., Inzé, D., and Depicker, A. (2002). GATEWAY vectors for Agrobacterium-
mediated plant transformation. Trends in plant science 7, 193-195.
Kastantin, M., Faulón Marruecos, D., Grover, N., Yu McLoughlin, S., Schwartz, D.K.,
and Kaar, J.L. (2017). Connecting Protein Conformation and Dynamics with Ligand-
Receptor Binding Using Three-Color Förster Resonance Energy Transfer Tracking.
Journal of the American Chemical Society 139, 9937-9948.
Klar, T.A., Jakobs, S., Dyba, M., Egner, A., and Hell, S.W. (2000). Fluorescence
microscopy with diffraction resolution barrier broken by stimulated emission.
Proceedings of the National Academy of Sciences of the United States of America
97, 8206-8210.
Krause, C.D., Izotova, L.S., and Pestka, S. (2013). Analytical use of multi-protein
Fluorescence Resonance Energy Transfer to demonstrate membrane-facilitated
interactions within cytokine receptor complexes. Cytokine 64, 298-309.
Kuemmerle H., S.T. (1991). Human pharmacology. The basis of clinical
pharmacology. Methods in drug protein binding analysis pp 235–282 (Amsterdam
u.a.: Elsevier).
Kuo, H.-L., Ho, P.-C., Huang, S.-S., and Chang, N.-S. (2018). Chasing the signaling
run by tri-molecular time-lapse FRET microscopy. Cell Death Discovery 4, 45.
Ladwig, F., Dahlke, R.I., Stührwohldt, N., Hartmann, J., Harter, K., and Sauter, M.
(2015). Phytosulfokine Regulates Growth in Arabidopsis through a Response
Module at the Plasma Membrane That Includes CYCLIC NUCLEOTIDE-GATED
CHANNEL17, H+-ATPase, and BAK1. The Plant cell 27, 1718-1729.
Lakowicz, J.R. (2006). Principles of Fluorescence Spectroscopy.
Lakowicz, J.R., Szmacinski, H., Nowaczyk, K., Berndt, K.W., and Johnson, M.
(1992). Fluorescence lifetime imaging. Analytical Biochemistry 202, 316-330.
not certified by peer review) is the author/funder. All rights reserved. No reuse allowed without permission. The copyright holder for this preprint (which wasthis version posted August 1, 2019. . https://doi.org/10.1101/722124doi: bioRxiv preprint
Three-fluorophore FRET-FLIM enables the study of trimeric protein interactions
45
Lee, N.K., Kapanidis, A.N., Koh, H.R., Korlann, Y., Ho, S.O., Kim, Y., Gassman, N.,
Kim, S.K., and Weiss, S. (2007). Three-color alternating-laser excitation of single
molecules. Monitoring multiple interactions and distances. Biophysical journal 92,
303-312.
Lee, S., Lee, J., and Hohng, S. (2010). Single-molecule three-color FRET with both
negligible spectral overlap and long observation time. PloS one 5, e12270.
Li, J., and Chory, J. (1997). A Putative Leucine-Rich Repeat Receptor Kinase
Involved in Brassinosteroid Signal Transduction. Cell 90, 929-938.
Li, J., Wen, J., Lease, K.A., Doke, J.T., Tax, F.E., and Walker, J.C. (2002). BAK1, an
Arabidopsis LRR Receptor-like Protein Kinase, Interacts with BRI1 and Modulates
Brassinosteroid Signaling. Cell 110, 213-222.
Liang, X., Ding, P., Lian, K., Wang, J., Ma, M., Li, L., Li, L., Li, M., Zhang, X., and
Chen, S., et al. (2016). Arabidopsis heterotrimeric G proteins regulate immunity by
directly coupling to the FLS2 receptor. eLife 5, e13568.
Lin, T., Scott, B.L., Hoppe, A.D., and Chakravarty, S. (2018). FRETting about the
affinity of bimolecular protein-protein interactions. Protein science : a publication of
the Protein Society 27, 1850-1856.
Mallik, R., Yoo, M.J., Chen, S., and Hage, D.S. (2008). Studies of verapamil binding
to human serum albumin by high-performance affinity chromatography. Journal of
chromatography. B, Analytical technologies in the biomedical and life sciences 876,
69-75.
Martin, K.J., McGhee, E.J., Schwarz, J.P., Drysdale, M., Brachmann, S.M., Stucke,
V., Sansom, O.J., and Anderson, K.I. (2018). Accepting from the best donor;
analysis of long-lifetime donor fluorescent protein pairings to optimise dynamic FLIM-
based FRET experiments. PloS one 13, e0183585.
Martins, S., Dohmann, E.M.N., Cayrel, A., Johnson, A., Fischer, W., Pojer, F., Satiat-
Jeunemaître, B., Jaillais, Y., Chory, J., and Geldner, N., et al. (2015). Internalization
and vacuolar targeting of the brassinosteroid hormone receptor BRI1 are regulated
by ubiquitination. Nature Communications 6, 6151.
not certified by peer review) is the author/funder. All rights reserved. No reuse allowed without permission. The copyright holder for this preprint (which wasthis version posted August 1, 2019. . https://doi.org/10.1101/722124doi: bioRxiv preprint

Three-fluorophore FRET-FLIM enables the study of trimeric protein interactions
46
Mastop, M., Bindels, D.S., Shaner, N.C., Postma, M., Gadella, T.W.J., and
Goedhart, J. (2017). Characterization of a spectrally diverse set of fluorescent
proteins as FRET acceptors for mTurquoise2. Scientific Reports 7, 11999.
Miyawaki, A. (2011). Development of probes for cellular functions using fluorescent
proteins and fluorescence resonance energy transfer. Annual Review of
Biochemistry 80, 357-373.
Miyawaki, A., and Tsien, R.Y. (2000). Monitoring protein conformations and
interactions by fluorescence resonance energy transfer between mutants of green
fluorescent protein. In Cell biology and physiology, J. Thorner, ed. (San Diego, Calif.:
Acad. Press), pp. 472–500.
Mohrholz, A., Sun, H., Gloeckner, N., Hummel, S., Kolukisaoglu, U., Schneeberger,
K., and Harter, K. (2019). The striking flower-in-flower phenotype of Arabidopsis
thaliana Nossen (No-0) is caused by a novel LEAFY allele. Supplemental Figures
and Tables.
Mora-García, S., Vert, G., Yin, Y., Caño-Delgado, A., Cheong, H., and Chory, J.
(2004). Nuclear protein phosphatases with Kelch-repeat domains modulate the
response to brassinosteroids in Arabidopsis. Genes & development 18, 448-460.
Müller, S.M., Galliardt, H., Schneider, J., Barisas, B.G., and Seidel, T. (2013).
Quantification of Förster resonance energy transfer by monitoring sensitized
emission in living plant cells. Frontiers in plant science 4, 413.
Nagai, T., Ibata, K., Park, E.S., Kubota, M., Mikoshiba, K., and Miyawaki, A. (2002).
A variant of yellow fluorescent protein with fast and efficient maturation for cell-
biological applications. Nature Biotechnology 20, 87-90.
Nam, K.H., and Li, J. (2002). BRI1/BAK1, a Receptor Kinase Pair Mediating
Brassinosteroid Signaling. Cell 110, 203-212.
Noomnarm, U., and Clegg, R.M. (2009). Fluorescence lifetimes. Fundamentals and
interpretations. Photosynthesis research 101, 181-194.
Oh, M.-H., Ray, W.K., Huber, S.C., Asara, J.M., Gage, D.A., and Clouse, S.D.
(2000). Recombinant Brassinosteroid Insensitive 1 Receptor-Like Kinase
Autophosphorylates on Serine and Threonine Residues and Phosphorylates a
Conserved Peptide Motif in Vitro. Plant Physiology 124, 751-766.
not certified by peer review) is the author/funder. All rights reserved. No reuse allowed without permission. The copyright holder for this preprint (which wasthis version posted August 1, 2019. . https://doi.org/10.1101/722124doi: bioRxiv preprint

Three-fluorophore FRET-FLIM enables the study of trimeric protein interactions
47
Oravcova´, J., Bo¨hs, B., and Lindner, W. (1996). Drug-protein binding studies new
trends in analytical and experimental methodology. Journal of Chromatography B:
Biomedical Sciences and Applications 677, 1-28.
Pauker, M.H., Hassan, N., Noy, E., Reicher, B., and Barda-Saad, M. (2012).
Studying the dynamics of SLP-76, Nck, and Vav1 multimolecular complex formation
in live human cells with triple-color FRET. Science signaling 5, rs3.
Peng, Y., Chen, L., Li, S., Zhang, Y., Xu, R., Liu, Z., Liu, W., Kong, J., Huang, X.,
and Wang, Y., et al. (2018). BRI1 and BAK1 interact with G proteins and regulate
sugar-responsive growth and development in Arabidopsis. Nature Communications
9, 1522.
Rekas, A., Alattia, J.-R., Nagai, T., Miyawaki, A., and Ikura, M. (2002). Crystal
structure of venus, a yellow fluorescent protein with improved maturation and
reduced environmental sensitivity. J. Biol. Chem. 277, 50573-50578.
Russinova, E., Borst, J.-W., Kwaaitaal, M., Caño-Delgado, A., Yin, Y., Chory, J., and
Vries, S.C. de (2004). Heterodimerization and endocytosis of Arabidopsis
brassinosteroid receptors BRI1 and AtSERK3 (BAK1). The Plant cell 16, 3216-3229.
Santiago, J., Henzler, C., and Hothorn, M. (2013). Molecular mechanism for plant
steroid receptor activation by somatic embryogenesis co-receptor kinases. Science
(New York, N.Y.) 341, 889-892.
Schoberer, J., Liebminger, E., Botchway, S.W., Strasser, R., and Hawes, C. (2013).
Time-resolved fluorescence imaging reveals differential interactions of N-glycan
processing enzymes across the Golgi stack in planta. Plant Physiology 161, 1737-
1754.
Scott, B.L., and Hoppe, A.D. (2015). Optimizing fluorescent protein trios for 3-Way
FRET imaging of protein interactions in living cells. Scientific Reports 5, 10270 EP -.
Seidel, T., Seefeldt, B., Sauer, M., and Dietz, K.-J. (2010). In vivo analysis of the 2-
Cys peroxiredoxin oligomeric state by two-step FRET. Journal of biotechnology 149,
272-279.
Shrestha, D., Jenei, A., Nagy, P., Vereb, G., and Szöllősi, J. (2015). Understanding
FRET as a research tool for cellular studies. International journal of molecular
sciences 16, 6718-6756.
not certified by peer review) is the author/funder. All rights reserved. No reuse allowed without permission. The copyright holder for this preprint (which wasthis version posted August 1, 2019. . https://doi.org/10.1101/722124doi: bioRxiv preprint

Three-fluorophore FRET-FLIM enables the study of trimeric protein interactions
48
Shyu, Y.J., Suarez, C.D., and Hu, C.-D. (2008). Visualization of ternary complexes in
living cells by using a BiFC-based FRET assay. Nature Protocols 3, 1693 EP -.
Somssich, M., Ma, Q., Weidtkamp-Peters, S., Stahl, Y., Felekyan, S., Bleckmann, A.,
Seidel, C.A.M., and Simon, R. (2015). Real-time dynamics of peptide ligand-
dependent receptor complex formation in planta. Science signaling 8, ra76.
Steinberg, I.Z. (1971). Long-range nonradiative transfer of electronic excitation
energy in proteins and polypeptides. Annual Review of Biochemistry 40, 83-114.
Sun, Y., Han, Z., Tang, J., Hu, Z., Chai, C., Zhou, B., and Chai, J. (2013). Structure
reveals that BAK1 as a co-receptor recognizes the BRI1-bound brassinolide. Cell
Research 23, 1326 EP -.
Sun, Y., Wallrabe, H., Booker, C.F., Day, R.N., and Periasamy, A. (2010). Three-
color spectral FRET microscopy localizes three interacting proteins in living cells.
Biophysical journal 99, 1274-1283.
Szöllosi, J., Damjanovich, S., Nagy, P., Vereb, G., and Mátyus, L. (2006). Principles
of resonance energy transfer. Current protocols in cytometry Chapter 1, Unit1.12.
Ujlaky-Nagy, L., Nagy, P., Szöllősi, J., and Vereb, G. (2018). Flow Cytometric FRET
Analysis of Protein Interactions. Methods in molecular biology (Clifton, N.J.) 1678,
393-419.
van Rosmalen, M., Krom, M., and Merkx, M. (2017). Tuning the Flexibility of Glycine-
Serine Linkers To Allow Rational Design of Multidomain Proteins. Biochemistry 56,
6565-6574.
Vert, G., and Chory, J. (2006). Downstream nuclear events in brassinosteroid
signalling. Nature 441, 96-100.
Vogel, S.S., van der Meer, B.W., and Blank, P.S. (2014). Estimating the distance
separating fluorescent protein FRET pairs. Methods (San Diego, Calif.) 66, 131-138.
Vuignier, K., Schappler, J., Veuthey, J.-L., Carrupt, P.-A., and Martel, S. (2010).
Drug-protein binding. A critical review of analytical tools. Analytical and bioanalytical
chemistry 398, 53-66.
not certified by peer review) is the author/funder. All rights reserved. No reuse allowed without permission. The copyright holder for this preprint (which wasthis version posted August 1, 2019. . https://doi.org/10.1101/722124doi: bioRxiv preprint
Three-fluorophore FRET-FLIM enables the study of trimeric protein interactions
49
Wallrabe, H., Cai, Y., Sun, Y., Periasamy, A., Luzes, R., Fang, X., Kan, H.-M.,
Cameron, L.-C., Schafer, D.A., and Bloom, G.S. (2013). IQGAP1 interactome
analysis by in vitro reconstitution and live cell 3-color FRET microscopy.
Cytoskeleton (Hoboken, N.J.) 70, 819-836.
Wang, J., Jiang, J., Wang, J., Chen, L., Fan, S.-L., Wu, J.-W., Wang, X., and Wang,
Z.-X. (2014). Structural insights into the negative regulation of BRI1 signaling by
BRI1-interacting protein BKI1. Cell Research 24, 1328-1341.
Wang, X., and Chory, J. (2006). Brassinosteroids regulate dissociation of BKI1, a
negative regulator of BRI1 signaling, from the plasma membrane. Science (New
York, N.Y.) 313, 1118-1122.
Wang, X., Goshe, M.B., Soderblom, E.J., Phinney, B.S., Kuchar, J.A., Li, J., Asami,
T., Yoshida, S., Huber, S.C., and Clouse, S.D. (2005a). Identification and functional
analysis of in vivo phosphorylation sites of the Arabidopsis BRASSINOSTEROID-
INSENSITIVE1 receptor kinase. The Plant cell 17, 1685-1703.
Wang, X., Kota, U., He, K., Blackburn, K., Li, J., Goshe, M.B., Huber, S.C., and
Clouse, S.D. (2008). Sequential transphosphorylation of the BRI1/BAK1 receptor
kinase complex impacts early events in brassinosteroid signaling. Developmental
cell 15, 220-235.
Wang, X., Li, X., Meisenhelder, J., Hunter, T., Yoshida, S., Asami, T., and Chory, J.
(2005b). Autoregulation and homodimerization are involved in the activation of the
plant steroid receptor BRI1. Developmental cell 8, 855-865.
Wang, Z.-Y., Seto, H., Fujioka, S., Yoshida, S., and Chory, J. (2001). BRI1 is a
critical component of a plasma-membrane receptor for plant steroids. Nature 410,
380-383.
Wen, R., Wang, S., Xiang, D., Venglat, P., Shi, X., Zang, Y., Datla, R., Xiao, W., and
Wang, H. (2014). UBC13, an E2 enzyme for Lys63-linked ubiquitination, functions in
root development by affecting auxin signaling and Aux/IAA protein stability. The
Plant journal : for cell and molecular biology 80, 424-436.
not certified by peer review) is the author/funder. All rights reserved. No reuse allowed without permission. The copyright holder for this preprint (which wasthis version posted August 1, 2019. . https://doi.org/10.1101/722124doi: bioRxiv preprint
Three-fluorophore FRET-FLIM enables the study of trimeric protein interactions
50
Witthöft, J., Caesar, K., Elgass, K., Huppenberger, P., Kilian, J., Schleifenbaum, F.,
Oecking, C., and Harter, K. (2014). The activation of the Arabidopsis P-ATPase 1 by
the brassinosteroid receptor BRI1 is independent of threonine 948 phosphorylation.
Plant Signaling & Behavior 6, 1063-1066.
Woehler, A. (2013). Simultaneous quantitative live cell imaging of multiple FRET-
based biosensors. PloS one 8, e61096.
Wolf, S., van der Does, D., Ladwig, F., Sticht, C., Kolbeck, A., Schürholz, A.-K.,
Augustin, S., Keinath, N., Rausch, T., and Greiner, S., et al. (2014). A receptor-like
protein mediates the response to pectin modification by activating brassinosteroid
signaling. Proceedings of the National Academy of Sciences of the United States of
America 111, 15261-15266.
Wu, P.G., and Brand, L. (1994). Resonance Energy Transfer. Methods and
Applications. Analytical Biochemistry 218, 1-13.
Yan, L., Ma, Y., Liu, D., Wei, X., Sun, Y., Chen, X., Zhao, H., Zhou, J., Wang, Z., and
Shui, W., et al. (2012). Structural basis for the impact of phosphorylation on the
activation of plant receptor-like kinase BAK1. Cell Research 22, 1304-1308.
Yin, Y., Vafeados, D., Tao, Y., Yoshida, S., Asami, T., and Chory, J. (2005). A new
class of transcription factors mediates brassinosteroid-regulated gene expression in
Arabidopsis. Cell 120, 249-259.
Yu, H., Zhang, J., Li, H., and Chen, T. (2013). Ma-PbFRET. Multiple acceptors FRET
measurement based on partial acceptor photobleaching. Microscopy and
microanalysis : the official journal of Microscopy Society of America, Microbeam
Analysis Society, Microscopical Society of Canada 19, 171-179.
Yun, H.S., Bae, Y.H., Lee, Y.J., Chang, S.C., Kim, S.-K., Li, J., and Nam, K.H.
(2009). Analysis of phosphorylation of the BRI1/BAK1 complex in arabidopsis
reveals amino acid residues critical for receptor formation and activation of BR
signaling. Molecules and Cells 27, 183-190.
Zhu, J.-Y., Li, Y., Cao, D.-M., Yang, H., Oh, E., Bi, Y., Zhu, S., and Wang, Z.-Y.
(2017). The F-box Protein KIB1 Mediates Brassinosteroid-Induced Inactivation and
Degradation of GSK3-like Kinases in Arabidopsis. Molecular cell 66, 648-657.e4.
not certified by peer review) is the author/funder. All rights reserved. No reuse allowed without permission. The copyright holder for this preprint (which wasthis version posted August 1, 2019. . https://doi.org/10.1101/722124doi: bioRxiv preprint
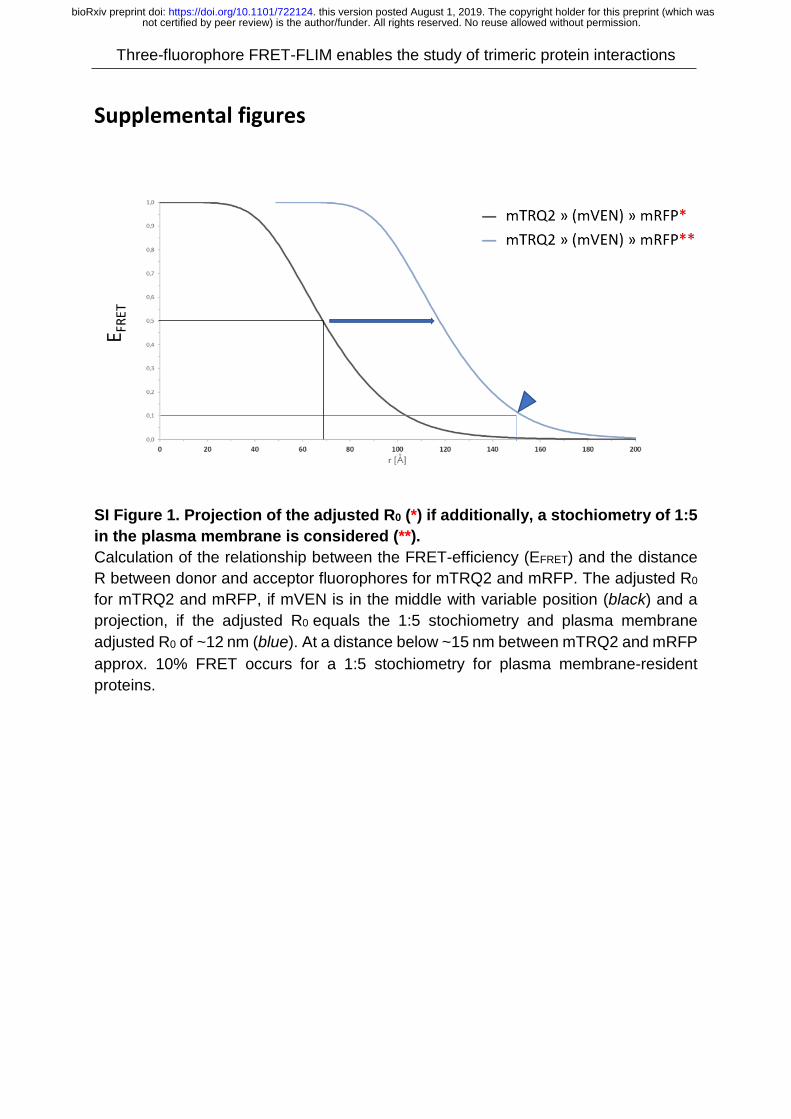
Three-fluorophore FRET-FLIM enables the study of trimeric protein interactions
Supplemental figures
SI Figure 1. Projection of the adjusted R0 (*) if additionally, a stochiometry of 1:5 in the plasma membrane is considered (**). Calculation of the relationship between the FRET-efficiency (EFRET) and the distance R between donor and acceptor fluorophores for mTRQ2 and mRFP. The adjusted R0 for mTRQ2 and mRFP, if mVEN is in the middle with variable position (black) and a projection, if the adjusted R0 equals the 1:5 stochiometry and plasma membrane adjusted R0 of ~12 nm (blue). At a distance below ~15 nm between mTRQ2 and mRFP approx. 10% FRET occurs for a 1:5 stochiometry for plasma membrane-resident proteins.
not certified by peer review) is the author/funder. All rights reserved. No reuse allowed without permission. The copyright holder for this preprint (which wasthis version posted August 1, 2019. . https://doi.org/10.1101/722124doi: bioRxiv preprint

Three-fluorophore FRET-FLIM enables the study of trimeric protein interactions
SI Figure 2. Representative image of the fluorescence signals in Nicotiana benthamiana epidermal leaf cells two days after transformation with RLP44-mTRQ2, BRI1-mVEN and BAK1-mRFP. Representative images of the fluorescence intensity in the mTRQ2 channel, the mVEN channel and the mRFP channel and a merge with a bright field image with the used setting and different combinations of switched-on excitation laser lines. Blue channel for detection of RLP44-mTRQ was 465-505 nm, yellow channel for detection of BRI1-mVEN was 525-565 nm and red channel for detection of mRFP was 605-650 nm. Merge additionally contains bright-field. Scale bar represents 20 µm.B efore the
not certified by peer review) is the author/funder. All rights reserved. No reuse allowed without permission. The copyright holder for this preprint (which wasthis version posted August 1, 2019. . https://doi.org/10.1101/722124doi: bioRxiv preprint

Three-fluorophore FRET-FLIM enables the study of trimeric protein interactions acquisition of spectra or the fluorescence intensity, the expression of each fusion-construct was tested with sequential excitation, meaning that one laser line was switched on at a time.
not certified by peer review) is the author/funder. All rights reserved. No reuse allowed without permission. The copyright holder for this preprint (which wasthis version posted August 1, 2019. . https://doi.org/10.1101/722124doi: bioRxiv preprint

Three-fluorophore FRET-FLIM enables the study of trimeric protein interactions
SI Figure 3. Raw intensity in dependence of the wavelength for different regions of interest with changing expression strengths. The raw intensity for different regions of interest in the plasma membrane with different expression strength in dependence of the wavelength for excitation at 458 nm is shown for RLP44-mTRQ2 (left), RLP44-mTRQ2 with FLS2-mRFP (middle) and RLP44-mTRQ2 with FLS2-mRFP (right).
not certified by peer review) is the author/funder. All rights reserved. No reuse allowed without permission. The copyright holder for this preprint (which wasthis version posted August 1, 2019. . https://doi.org/10.1101/722124doi: bioRxiv preprint

Three-fluorophore FRET-FLIM enables the study of trimeric protein interactions
SI Figure 4. Western blot of BRI1HA expression. Western blot (left) and proteins on the membrane, stained with Ponceau S after transfer (right) of a N. benthamiana leaf two days after transformation with the silencing inhibitor p19 or with p19 and BRI1HA. The sizes of the protein ladder are indicated. Primary antibody was α-HA (rat), Roche, 1:1000 and secondary antibody was α-rat-AP (goat), Sigma, 1:7000.
not certified by peer review) is the author/funder. All rights reserved. No reuse allowed without permission. The copyright holder for this preprint (which wasthis version posted August 1, 2019. . https://doi.org/10.1101/722124doi: bioRxiv preprint

Three-fluorophore FRET-FLIM enables the study of trimeric protein interactions
SI Figure 5. Measured spectra for excitation at 458 nm. The average normalized intensity ± SE in dependence of the wavelength is shown for the expression of RLP44-mTRQ2 with the non-fluorescent BRI1-HA (BRIHA) (blue), RLP44-mTRQ with BAK1-mRFP (red), RLP44 with FLS2-mVEN and FLS2-mRFP (brown) and RLP44 with FLS2-mVEN and BRI1-mRFP (brown). A magnification of the wavelengths that are relevant for mRFP detection is shown.
not certified by peer review) is the author/funder. All rights reserved. No reuse allowed without permission. The copyright holder for this preprint (which wasthis version posted August 1, 2019. . https://doi.org/10.1101/722124doi: bioRxiv preprint

Three-fluorophore FRET-FLIM enables the study of trimeric protein interactions
SI Figure 6. The overall donor to acceptor ratios did not change significantly. (A-C) Ratios of fluorescence intensity for donor-acceptor pairs. Data points were left-right scattered (black dots) and combined with boxplot information, permitting outliers. RLP44 was always fused to mTRQ2, BRI1 always to mVEN and as second acceptor, either BAK1 or FLS2 fused to mRFP was expressed. The ratios for mTRQ2-mVEN (A), mTRQ2-mRFP (B) and mVEN-mRFP (C) were tested for significant differences with a two-tailed, all-pair Kruskal-Wallis test followed by a Steel-Dwass post hoc correction. Background-level ratios (ratio that is present only because of bt and ce in respective samples) were marked in grey. Asterisk marks the only significant change (p<0.05) in donor-to-acceptor ratio, which was the mTRQ2:mRFP ratio between RLP44–BRI1–BAK1 and RLP44–BRI1–FLS2.
not certified by peer review) is the author/funder. All rights reserved. No reuse allowed without permission. The copyright holder for this preprint (which wasthis version posted August 1, 2019. . https://doi.org/10.1101/722124doi: bioRxiv preprint

Three-fluorophore FRET-FLIM enables the study of trimeric protein interactions
1
Supplemental material
Supp. Material 1
Physicochemical properties of the fluorophores
SI Table 1: Parameters of fluorophores in this study: quantum yield (QY), extinction coefficient (ExCoeff), molecular brightness (MolBright), maturation time as half-maximal intensity (Imax 2-
1) and as half-time at 37°C in E. coli (t50), photostability (PhotStab) as time until half-maximal intensity decrease when excited with 80uW, pH stability (pKa) and proportion of monomeric state (MS). For comparison: EGFP has a brightness of 33.60 10-3 M-1 cm-1 and a Photostability of 159.6 s until a 50% decrease with 80uW is reached. pKa of EGFP lies at 6.0.
Supp. Material 2
Python script for calculation of FRET-efficiency with variable distances of middle fluorophore:
In a system of three fluorophores, which are donor (1), acceptor (2) and second acceptor (3) (Haustein et al. 2003) reported, that the overall FRET efficiency (E) from 1 to 3 (via 2) can be estimated by E_13= E_12 * E_23 with r_13 the distance between 1 and 3. We now keep the distance between 1 and 3 constant, and move 2 stepwise from 1 to 3: for example Zero 1_____3 distance13: r_13=5 distance12: 0 distance23: 5 First step: 12____3 distance13: r_13=5 distance12: 1 distance23: 4 Second step: 1_2___3 distance13: r_13=5 distance12: 2 distance23: 3 Third step: 1__2__3 distance13: r_13=5 distance12: 3 distance23: 2 Fourth step: 1____23 distance13: r_13=5 distance12: 4 distance23: 1 Nth step: 1_____3 distance13: r_13=5 distance12: 5 distance23: 0 For each step we calculate E and list each value in an intermediate list (E_int). Then the average of the E_int is calculated and listed as the nth entry in the list E_13. Then, empty E_int before new round. This is repeated for each next larger r_13 For example several steps later, at r = 11 Å for First step: 12___________3 r_13:11 r_12: 1 r_23: 10 Second step: 1_2__________3 r_13:11 r_12: 2 r_23: 9 (…) Nth step: 1____________3 r_13:11 r_12: 11 r_23: 0
QY ExCoeff [M-1 cm-1]
MolBright [10-3 M-1 cm-1]
Maturation Imax 2-1
/ t50 PhotStab t50(80uW) [s]
pH stability pKa
MS [%]
mTRQ2 0.93 30 27.9 5.5 h / 33.5 min 71.7 3.1 93.8
(Goedhart et al., 2012; Scott and Hoppe, 2015; Cranfill et al., 2016; Balleza et al., 2018)
mVEN 0.64 105 67.2 / 4.1 min 26.4 6.0 83.9 (Kremers et al., 2006; Cranfill et al., 2016; Balleza et al., 2018)
mRFP 0.25 44 12.5 1 h / 24 min 26.3 4.5 95.8 (Campbell et al., 2002; Cranfill et al., 2016; Balleza et al., 2018)
not certified by peer review) is the author/funder. All rights reserved. No reuse allowed without permission. The copyright holder for this preprint (which wasthis version posted August 1, 2019. . https://doi.org/10.1101/722124doi: bioRxiv preprint
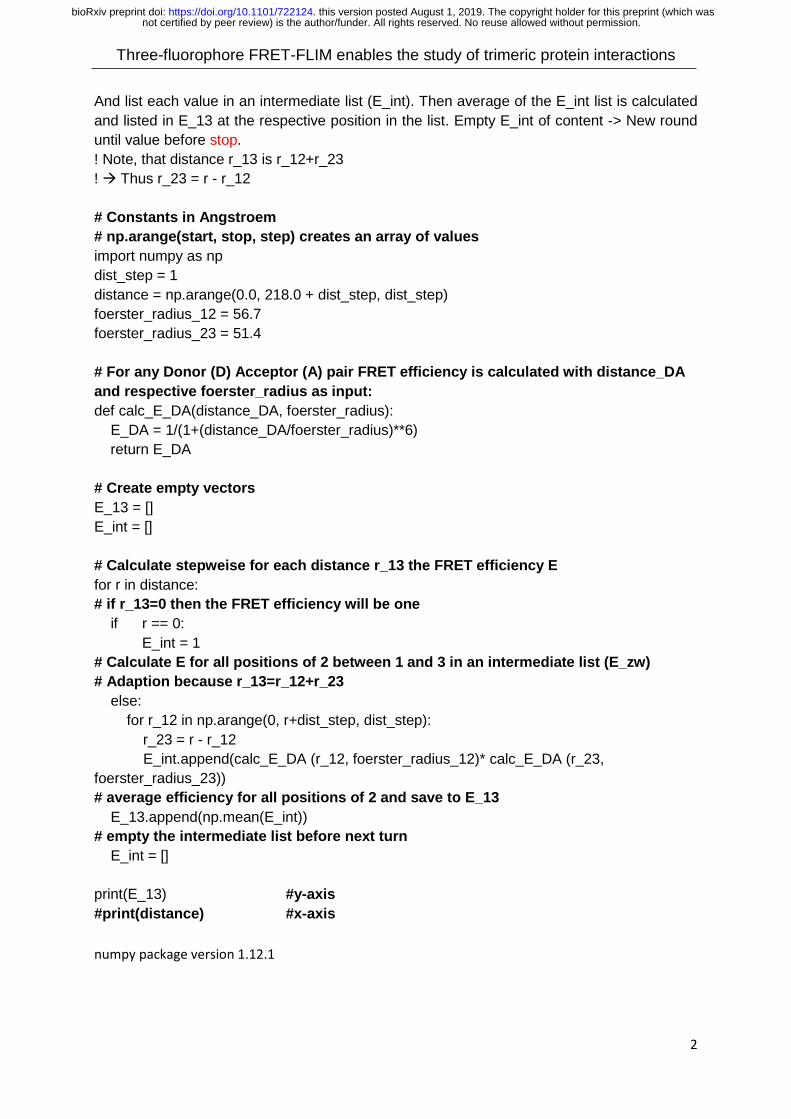
Three-fluorophore FRET-FLIM enables the study of trimeric protein interactions
2
And list each value in an intermediate list (E_int). Then average of the E_int list is calculated and listed in E_13 at the respective position in the list. Empty E_int of content -> New round until value before stop. ! Note, that distance r_13 is r_12+r_23 ! Thus r_23 = r - r_12 # Constants in Angstroem # np.arange(start, stop, step) creates an array of values import numpy as np dist_step = 1 distance = np.arange(0.0, 218.0 + dist_step, dist_step) foerster_radius_12 = 56.7 foerster_radius_23 = 51.4 # For any Donor (D) Acceptor (A) pair FRET efficiency is calculated with distance_DA and respective foerster_radius as input: def calc_E_DA(distance_DA, foerster_radius): E_DA = 1/(1+(distance_DA/foerster_radius)**6) return E_DA # Create empty vectors E_13 = [] E_int = [] # Calculate stepweise for each distance r_13 the FRET efficiency E for r in distance: # if r_13=0 then the FRET efficiency will be one if r == 0: E_int = 1 # Calculate E for all positions of 2 between 1 and 3 in an intermediate list (E_zw) # Adaption because r_13=r_12+r_23 else: for r_12 in np.arange(0, r+dist_step, dist_step): r_23 = r - r_12 E_int.append(calc_E_DA (r_12, foerster_radius_12)* calc_E_DA (r_23, foerster_radius_23)) # average efficiency for all positions of 2 and save to E_13 E_13.append(np.mean(E_int)) # empty the intermediate list before next turn E_int = [] print(E_13) #y-axis #print(distance) #x-axis numpy package version 1.12.1
not certified by peer review) is the author/funder. All rights reserved. No reuse allowed without permission. The copyright holder for this preprint (which wasthis version posted August 1, 2019. . https://doi.org/10.1101/722124doi: bioRxiv preprint
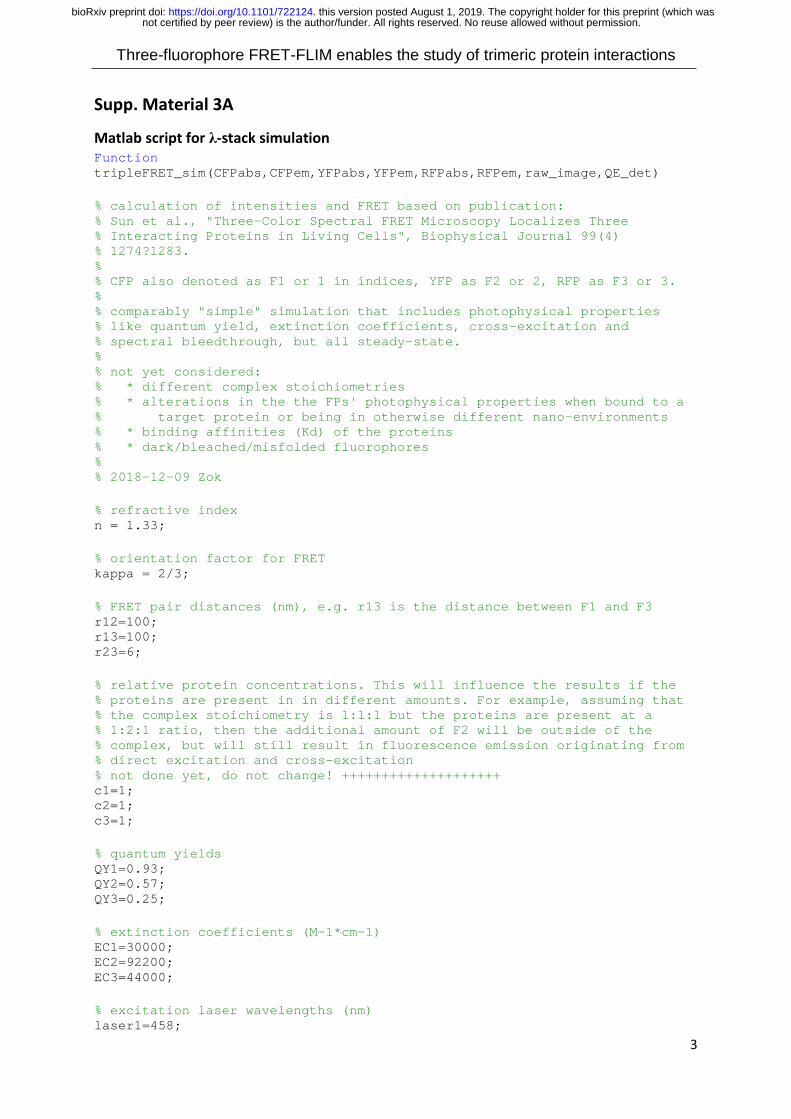
Three-fluorophore FRET-FLIM enables the study of trimeric protein interactions
3
Supp. Material 3A
Matlab script for λ-stack simulation Function tripleFRET_sim(CFPabs,CFPem,YFPabs,YFPem,RFPabs,RFPem,raw_image,QE_det) % calculation of intensities and FRET based on publication: % Sun et al., "Three-Color Spectral FRET Microscopy Localizes Three % Interacting Proteins in Living Cells", Biophysical Journal 99(4) % 1274?1283. % % CFP also denoted as F1 or 1 in indices, YFP as F2 or 2, RFP as F3 or 3. % % comparably "simple" simulation that includes photophysical properties % like quantum yield, extinction coefficients, cross-excitation and % spectral bleedthrough, but all steady-state. % % not yet considered: % * different complex stoichiometries % * alterations in the the FPs' photophysical properties when bound to a % target protein or being in otherwise different nano-environments % * binding affinities (Kd) of the proteins % * dark/bleached/misfolded fluorophores % % 2018-12-09 Zok % refractive index n = 1.33; % orientation factor for FRET kappa = 2/3; % FRET pair distances (nm), e.g. r13 is the distance between F1 and F3 r12=100; r13=100; r23=6; % relative protein concentrations. This will influence the results if the % proteins are present in in different amounts. For example, assuming that % the complex stoichiometry is 1:1:1 but the proteins are present at a % 1:2:1 ratio, then the additional amount of F2 will be outside of the % complex, but will still result in fluorescence emission originating from % direct excitation and cross-excitation % not done yet, do not change! ++++++++++++++++++++ c1=1; c2=1; c3=1; % quantum yields QY1=0.93; QY2=0.57; QY3=0.25; % extinction coefficients (M-1*cm-1) EC1=30000; EC2=92200; EC3=44000; % excitation laser wavelengths (nm) laser1=458;
not certified by peer review) is the author/funder. All rights reserved. No reuse allowed without permission. The copyright holder for this preprint (which wasthis version posted August 1, 2019. . https://doi.org/10.1101/722124doi: bioRxiv preprint

Three-fluorophore FRET-FLIM enables the study of trimeric protein interactions
4
laser2=514; laser3=651; % relative laser intensities laserint1=1; laserint2=0; laserint3=0; % absorption factors for all relevant wavelengths % e.g. A12: absorption factor of fluorophore 2 at excitation wavelength 1 % missing combinations are assumed to be not absorbing % (e.g. CFP does not absorb at the excitation wavelength for RFP) A11=EC1*CFPabs(CFPabs(:,1)==laser1, 2); A12=EC2*YFPabs(YFPabs(:,1)==laser1, 2); A13=EC3*RFPabs(RFPabs(:,1)==laser1, 2); A22=EC2*YFPabs(YFPabs(:,1)==laser2, 2); A23=EC3*RFPabs(RFPabs(:,1)==laser2, 2); A33=EC3*RFPabs(RFPabs(:,1)==laser3, 2); % emission filter boundaries (nm) BP1=[465 505]; BP2=[525 565]; BP3=[605 650]; % x-axis wavelength plot range x_plotrange=[450 700]; % area normalization of emission spectra CFPem_norm=CFPem; CFPem_norm(:,2)=CFPem(:,2)/trapz(CFPem(:,1),CFPem(:,2)); YFPem_norm=YFPem; YFPem_norm(:,2)=YFPem(:,2)/trapz(YFPem(:,1),YFPem(:,2)); RFPem_norm=RFPem; RFPem_norm(:,2)=RFPem(:,2)/trapz(RFPem(:,1),RFPem(:,2)); % get R0's for all possible FRET pairs R0_12 = calculateR0(CFPem,YFPabs,n,kappa,QY1,EC2); R0_13 = calculateR0(CFPem,RFPabs,n,kappa,QY1,EC3); R0_23 = calculateR0(YFPem,RFPabs,n,kappa,QY2,EC3); % calculate FRET efficiencies E12 = (R0_12*r13)^6/((R0_12*r13)^6 + (R0_13*r12)^6 + (r12*r13)^6); E13 = (R0_13*r12)^6/((R0_13*r12)^6 + (R0_12*r13)^6 + (r12*r13)^6); E23 = R0_23^6/(R0_23^6 + r23^6); % calculations for fluorophores in the complex % ---------------------------------------------- % emission factors for F1 % ---------------------- % when excited by laser1 (->I11) % QY1*laserint1*A11 -> fluorescence following direct excitation % *(1-E12-E13) -> fluorescence fraction lost due to FRET from 1->2 and 2->3 I11=QY1*laserint1*A11*(1-E12-E13); % emission factors for F2 % ---------------------- % when excited by laser1 (->I12) % QY2*laserint1*A11*E12 -> fluorescence of F2 due to FRET from 1->2
not certified by peer review) is the author/funder. All rights reserved. No reuse allowed without permission. The copyright holder for this preprint (which wasthis version posted August 1, 2019. . https://doi.org/10.1101/722124doi: bioRxiv preprint

Three-fluorophore FRET-FLIM enables the study of trimeric protein interactions
5
% *(1-E23) -> fluorescence fraction lost due to FRET 2->3 % + QY2*laserint1*A12 -> fluorescence of F2 due to cross-excitation % *(1-E23) -> fluorescence fraction lost due to FRET 2->3 (from cross-exc.) I12=QY2*laserint1*A11*E12*(1-E23)+QY2*laserint1*A12*(1-E23); % when excited by laser2 (->I22) % QY2*laserint2*A22 -> fluorescence following direct excitation % *(1-E23) -> lost fraction due to FRET from 2->3 I22=QY2*laserint2*A22*(1-E23); % emission factors for F3 % ---------------------- % when excited by laser1 (->I13) % QY3*laserint1*A11*E13 -> fluorescence of F3 due to FRET from 1->3 % +QY3*laserint1*A11*E12*E23 -> FRET from 1->2->3 % +QY3*laserint1*A12*E23 -> FRET from 2->3 (via cross-excited F2) % +QY3*laserint1*A13 -> cross-excitation I13=QY3*laserint1*A11*E13+QY3*laserint1*A11*E12*E23+QY3*laserint1*A12*E23+QY3*laserint1*A13; % when excited by laser2 (->I23) % QY3*laserint2*A22*E23 -> fluorescence of F3 due to FRET from 2->3 % +QY3*laserint2*A23 -> fluorescence of F3 due to cross-excitation I23=QY3*laserint2*A22*E23+QY3*laserint2*A23; % when excited by laser3 (->I33), -> direct excitation of F3 I33=QY3*laserint3*A33; % calculations for free fluorophores (++++++++++++doesn't work!!!+++++++++) % will be changes in a future version % these could also be included in the calculations for fluorophores in the % complex as fractional amounts (unbound/bound ratios). However, for better % readability, the emission of free fluorophores will be calculated % separately. %--------------------------------------------- % normalize the ratios to the smallest protein concentration. Subtract 1, % then c contains the free fluorophore fractions c=[c1 c2 c3]/min([c1 c2 c3])-1; % emission factors for free F1 % laser1 I11free = QY1*laserint1*A11*c(1); % emission factors for free F2 % laser1 (cross-exc.) I12free = QY2*laserint1*A12*c(2); % laser2 (direct exc.) I22free = QY2*laserint2*A22*c(2); % emission factors for free F3 % laser1 (cross-exc.) I13free = QY3*laserint1*A13*c(3); % laser2 (cross-exc.) I23free = QY3*laserint2*A23*c(3); % laser3 (direct exc.) I33free = QY3*laserint3*A33*c(3);
not certified by peer review) is the author/funder. All rights reserved. No reuse allowed without permission. The copyright holder for this preprint (which wasthis version posted August 1, 2019. . https://doi.org/10.1101/722124doi: bioRxiv preprint

Three-fluorophore FRET-FLIM enables the study of trimeric protein interactions
6
% spectra addition % ---------------- % find smallest/largest wavelength minwave=min(vertcat(CFPem(:,1),YFPem(:,1),RFPem(:,1))); maxwave=max(vertcat(CFPem(:,1),YFPem(:,1),RFPem(:,1))); % wavelength scale for all spectra sumspec=(minwave:1:maxwave)'; sumspec(:,2:5)=0; % find wavelength indices for CFP and position into sumspec CFP_waveindstart=find(CFPem(1,1)==sumspec(:,1)); CFP_waveindend=find(CFPem(end,1)==sumspec(:,1)); sumspec(CFP_waveindstart:CFP_waveindend,2)=CFPem_norm(:,2); % find wavelength indices for YFP and position into sumspec YFP_waveindstart=find(YFPem(1,1)==sumspec(:,1)); YFP_waveindend=find(YFPem(end,1)==sumspec(:,1)); sumspec(YFP_waveindstart:YFP_waveindend,3)=YFPem_norm(:,2); % find wavelength indices for RFP and position into sumspec RFP_waveindstart=find(RFPem(1,1)==sumspec(:,1)); RFP_waveindend=find(RFPem(end,1)==sumspec(:,1)); sumspec(RFP_waveindstart:RFP_waveindend,4)=RFPem_norm(:,2); % duplicate for each laser excitation wavelength [sumspec1, sumspec2, sumspec3] = deal(sumspec); % multiply each column with corresponding emission factor and % sum up in 5th column sumspec1(:,2:4)=sumspec1(:,2:4).*[I11+I11free I12+I12free I13+I13free]; sumspec1(:,5)=sum(sumspec1(:,2:4),2); sumspec2(:,2:4)=sumspec2(:,2:4).*[0 I22+I22free I23+I23free]; sumspec2(:,5)=sum(sumspec2(:,2:4),2); sumspec3(:,2:4)=sumspec3(:,2:4).*[0 0 I33+I33free]; sumspec3(:,5)=sum(sumspec3(:,2:4),2); % add everything up, restore wavelength scale sumspec_all=sumspec1+sumspec2+sumspec3; sumspec_all(:,1)=sumspec(:,1); % correct for detector sensitivity % first interpolate QE_det to wavelength scale QE_det_vector=interp1(QE_det(:,1),QE_det(:,2),sumspec(:,1)); sumspec_all(:,2:4)=sumspec_all(:,2:4).*QE_det_vector; % find emission intensity per BP (channel) CFP_BPstartind=find(sumspec(:,1)==BP1(1)); CFP_BPendind=find(sumspec(:,1)==BP1(2)); CFP_channelint=trapz(sumspec(CFP_BPstartind:CFP_BPendind,1),sumspec_all(CFP_BPstartind:CFP_BPendind,5)); YFP_BPstartind=find(sumspec(:,1)==BP2(1)); YFP_BPendind=find(sumspec(:,1)==BP2(2)); YFP_channelint=trapz(sumspec(YFP_BPstartind:YFP_BPendind,1),sumspec_all(YFP_BPstartind:YFP_BPendind,5));
not certified by peer review) is the author/funder. All rights reserved. No reuse allowed without permission. The copyright holder for this preprint (which wasthis version posted August 1, 2019. . https://doi.org/10.1101/722124doi: bioRxiv preprint

Three-fluorophore FRET-FLIM enables the study of trimeric protein interactions
7
RFP_BPstartind=find(sumspec(:,1)==BP3(1)); RFP_BPendind=find(sumspec(:,1)==BP3(2)); RFP_channelint=trapz(sumspec(RFP_BPstartind:RFP_BPendind,1),sumspec_all(RFP_BPstartind:RFP_BPendind,5)); % normalize intensity factors int_factors=[CFP_channelint, YFP_channelint, RFP_channelint]/max([CFP_channelint, YFP_channelint, RFP_channelint]); raw_image=rescale(raw_image); rgb=zeros(200,200,3); close all; fig=figure; fig.Units='normalized'; fig.OuterPosition=[0.5 0.5 0.5 0.5]; fig.MenuBar='none'; fig.ToolBar='none'; fig.NumberTitle='off'; fig.Name='tripleFRET simulation'; subplot(2,3,1); image_CFP=rgb; image_CFP(:,:,2)=raw_image; image_CFP(:,:,3)=raw_image; image(image_CFP*int_factors(1)); axis image; axis off; title('CFP channel') subplot(2,3,2); image_YFP=rgb; image_YFP(:,:,1)=raw_image; image_YFP(:,:,2)=raw_image; image(image_YFP*int_factors(2)); axis image; axis off; title('YFP channel') subplot(2,3,3); image_RFP=rgb; image_RFP(:,:,1)=raw_image; image(image_RFP*int_factors(3)); axis image; axis off; title('RFP channel') subplot(2,3,[4,5,6]) EdgeColor_list = {'c', 'y', 'r', 'k'}; FaceColor_list = {'c', 'y', 'r', 'none'}; LineWidth_list = [1 1 1 2]; hold on % areas for emission spectra for i = 1:4 area(sumspec_all(:,1),sumspec_all(:,i+1),... 'EdgeColor','none',... 'FaceColor',FaceColor_list{i},... 'FaceAlpha',0.3)
not certified by peer review) is the author/funder. All rights reserved. No reuse allowed without permission. The copyright holder for this preprint (which wasthis version posted August 1, 2019. . https://doi.org/10.1101/722124doi: bioRxiv preprint

Three-fluorophore FRET-FLIM enables the study of trimeric protein interactions
8
end % plot positions of emission filters ylimits = ylim; BPs=horzcat(BP1,BP2,BP3); BPcolors={'c--','c--','y--','y--','r--','r--'}; for i = 1:6 plot([BPs(i) BPs(i)],ylimits,BPcolors{i},'LineWidth',2); end % plot lines for emission spectra for i = 1:4 plot(sumspec_all(:,1),sumspec_all(:,i+1),... 'Color',EdgeColor_list{i},... 'LineWidth',LineWidth_list(i)); end xlabel('wavelength (nm)') ylabel('intensity (a.u.)') xlim(x_plotrange) hold off end function R0 = calculateR0(don_spec,acc_spec,n,kappa,QY,epsilon) % get axis limits from both spectra lims=[min(don_spec(:,1)) max(don_spec(:,1)) min(acc_spec(:,1)) max(acc_spec(:,1))]; % create new x_axis for merged spectra new_spec=(min(lims):max(lims))'; % find positions for donor and put it into the second column pos_don_start=find(new_spec==lims(1)); pos_don_end=find(new_spec==lims(2)); new_spec(pos_don_start:pos_don_end,2)=don_spec(:,2); % find position for acceptor and put it into the third column pos_acc_start=find(new_spec==lims(3)); pos_acc_end=find(new_spec==lims(4)); new_spec(pos_acc_start:pos_acc_end,3)=acc_spec(:,2); % calculate cumulative normalization factor F=sum(new_spec(:,2)); % calculate spectral overlap integrand J=(new_spec(:,1).^4).*epsilon.*new_spec(:,2).*new_spec(:,3)./F; % sum up for integral J=sum(J); % calculate R0 R0 = 0.02108*((kappa*(n^-4)*QY*J)^(1/6)); End %command: tripleFRET_sim_NG(TRQabs,TRQem,VENabs,VENem,RFPabs,RFPem,raw_image,QEdetuse)
not certified by peer review) is the author/funder. All rights reserved. No reuse allowed without permission. The copyright holder for this preprint (which wasthis version posted August 1, 2019. . https://doi.org/10.1101/722124doi: bioRxiv preprint
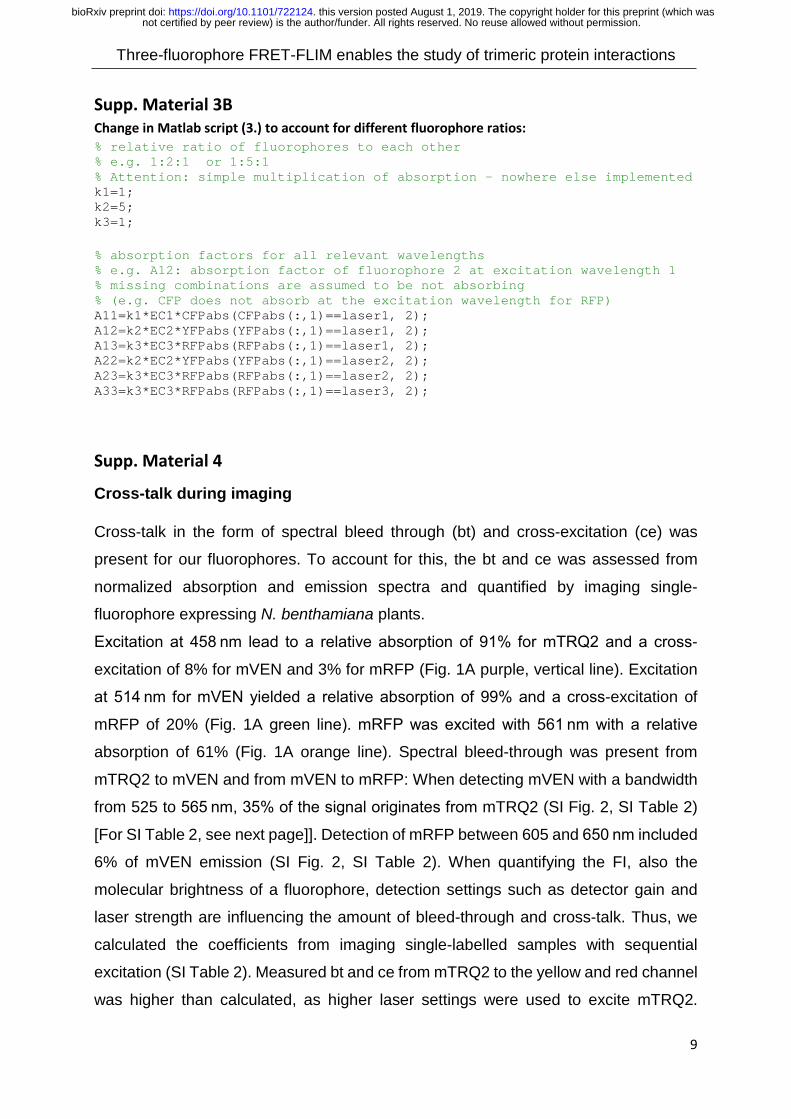
Three-fluorophore FRET-FLIM enables the study of trimeric protein interactions
9
Supp. Material 3B Change in Matlab script (3.) to account for different fluorophore ratios: % relative ratio of fluorophores to each other % e.g. 1:2:1 or 1:5:1 % Attention: simple multiplication of absorption - nowhere else implemented k1=1; k2=5; k3=1; % absorption factors for all relevant wavelengths % e.g. A12: absorption factor of fluorophore 2 at excitation wavelength 1 % missing combinations are assumed to be not absorbing % (e.g. CFP does not absorb at the excitation wavelength for RFP) A11=k1*EC1*CFPabs(CFPabs(:,1)==laser1, 2); A12=k2*EC2*YFPabs(YFPabs(:,1)==laser1, 2); A13=k3*EC3*RFPabs(RFPabs(:,1)==laser1, 2); A22=k2*EC2*YFPabs(YFPabs(:,1)==laser2, 2); A23=k3*EC3*RFPabs(RFPabs(:,1)==laser2, 2); A33=k3*EC3*RFPabs(RFPabs(:,1)==laser3, 2);
Supp. Material 4
Cross-talk during imaging
Cross-talk in the form of spectral bleed through (bt) and cross-excitation (ce) was
present for our fluorophores. To account for this, the bt and ce was assessed from
normalized absorption and emission spectra and quantified by imaging single-
fluorophore expressing N. benthamiana plants.
Excitation at 458 nm lead to a relative absorption of 91% for mTRQ2 and a cross-
excitation of 8% for mVEN and 3% for mRFP (Fig. 1A purple, vertical line). Excitation
at 514 nm for mVEN yielded a relative absorption of 99% and a cross-excitation of
mRFP of 20% (Fig. 1A green line). mRFP was excited with 561 nm with a relative
absorption of 61% (Fig. 1A orange line). Spectral bleed-through was present from
mTRQ2 to mVEN and from mVEN to mRFP: When detecting mVEN with a bandwidth
from 525 to 565 nm, 35% of the signal originates from mTRQ2 (SI Fig. 2, SI Table 2)
[For SI Table 2, see next page]]. Detection of mRFP between 605 and 650 nm included
6% of mVEN emission (SI Fig. 2, SI Table 2). When quantifying the FI, also the
molecular brightness of a fluorophore, detection settings such as detector gain and
laser strength are influencing the amount of bleed-through and cross-talk. Thus, we
calculated the coefficients from imaging single-labelled samples with sequential
excitation (SI Table 2). Measured bt and ce from mTRQ2 to the yellow and red channel
was higher than calculated, as higher laser settings were used to excite mTRQ2.
not certified by peer review) is the author/funder. All rights reserved. No reuse allowed without permission. The copyright holder for this preprint (which wasthis version posted August 1, 2019. . https://doi.org/10.1101/722124doi: bioRxiv preprint
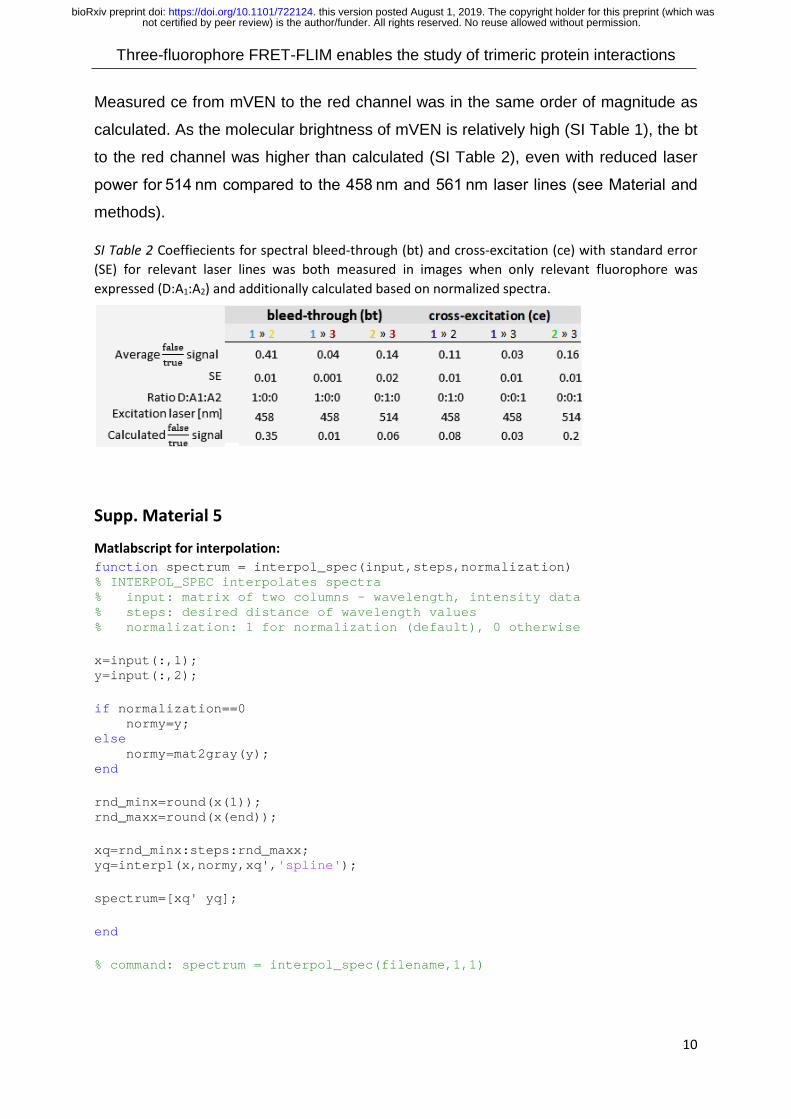
Three-fluorophore FRET-FLIM enables the study of trimeric protein interactions
10
Measured ce from mVEN to the red channel was in the same order of magnitude as
calculated. As the molecular brightness of mVEN is relatively high (SI Table 1), the bt
to the red channel was higher than calculated (SI Table 2), even with reduced laser
power for 514 nm compared to the 458 nm and 561 nm laser lines (see Material and
methods).
SI Table 2 Coeffiecients for spectral bleed-through (bt) and cross-excitation (ce) with standard error (SE) for relevant laser lines was both measured in images when only relevant fluorophore was expressed (D:A1:A2) and additionally calculated based on normalized spectra.
Supp. Material 5
Matlabscript for interpolation: function spectrum = interpol_spec(input,steps,normalization) % INTERPOL_SPEC interpolates spectra % input: matrix of two columns - wavelength, intensity data % steps: desired distance of wavelength values % normalization: 1 for normalization (default), 0 otherwise x=input(:,1); y=input(:,2); if normalization==0 normy=y; else normy=mat2gray(y); end rnd_minx=round(x(1)); rnd_maxx=round(x(end)); xq=rnd_minx:steps:rnd_maxx; yq=interp1(x,normy,xq','spline'); spectrum=[xq' yq]; end % command: spectrum = interpol_spec(filename,1,1)
not certified by peer review) is the author/funder. All rights reserved. No reuse allowed without permission. The copyright holder for this preprint (which wasthis version posted August 1, 2019. . https://doi.org/10.1101/722124doi: bioRxiv preprint

Three-fluorophore FRET-FLIM enables the study of trimeric protein interactions
11
Supp. Material 6
Matlabscript for spectral unmixing function [ ratios ] = unmix_tripleFRET(spec,CFP,YFP,RFP) % unmix_tripleFRET linear combination of original fluorescence data % Being provided with the original spectra of CFP, YFP, RFP (first column % wavelength, second column emission intensity), this program tries to % find a linear combination of these three spectra to calculate the % relative ratios of the components in a measured spectrum (spec). % The component spectra CFP,YFP,RFP will be interpolated and area % normalized. % results vector: % ratios(peak intensities), ratios(areas), area(rawdata), area(fitspectrum) % % Get wavelengths of the component spectra & look for maxima % ------------------------------------------------------------------ wave_spec=spec(:,1); int_spec=spec(:,2); wave1=CFP(:,1); wave2=YFP(:,1); wave3=RFP(:,1); comp1=CFP(:,2); comp2=YFP(:,2); comp3=RFP(:,2); % component maxima [~,I(1)]=max(comp1); [~,I(2)]=max(comp2); [~,I(3)]=max(comp3); % get the wavelengths comp1_maxwave=wave1(I(1)); comp2_maxwave=wave2(I(2)); comp3_maxwave=wave3(I(3)); % wavelength window in which to search for the exact maximum width=20; % get row indices when the windows start and end. [~,comp1_start]=min(abs(wave_spec-round(comp1_maxwave-0.5*width))); [~,comp1_end]=min(abs(wave_spec-round(comp1_maxwave+0.5*width))); [~,comp2_start]=min(abs(wave_spec-round(comp2_maxwave-0.5*width))); [~,comp2_end]=min(abs(wave_spec-round(comp2_maxwave+0.5*width))); [~,comp3_start]=min(abs(wave_spec-round(comp3_maxwave-0.5*width))); [~,comp3_end]=min(abs(wave_spec-round(comp3_maxwave+0.5*width))); % shift and interpolation of the component spectra %------------------------------------------------------- % search for the maxima (row indices) in measured spectrum after some % smoothing. checkmax = sgolayfilt(int_spec,7,33); [~,J1]=max(checkmax(comp1_start:comp1_end)); [~,J2]=max(checkmax(comp2_start:comp2_end)); [~,J3]=max(checkmax(comp3_start:comp3_end)); % translate to wavelengths spec_maxwave1=wave_spec(J1+comp1_start);
not certified by peer review) is the author/funder. All rights reserved. No reuse allowed without permission. The copyright holder for this preprint (which wasthis version posted August 1, 2019. . https://doi.org/10.1101/722124doi: bioRxiv preprint

Three-fluorophore FRET-FLIM enables the study of trimeric protein interactions
12
spec_maxwave2=wave_spec(J2+comp2_start); spec_maxwave3=wave_spec(J3+comp3_start); % this results in the shift of the components (in nm) shift1=spec_maxwave1-comp1_maxwave; shift2=spec_maxwave2-comp2_maxwave; shift3=spec_maxwave3-comp3_maxwave; % Interpolation of the components to the same wavelength scale as the % measured data, also shift them. Replace NaN with 0. shifted_comps(:,1)=interp1(wave1,comp1,wave_spec-shift1); shifted_comps(:,2)=interp1(wave2,comp2,wave_spec-shift2); shifted_comps(:,3)=interp1(wave3,comp3,wave_spec-shift3); shifted_comps(isnan(shifted_comps))=0; % area normalization of the component spectra A(1)=trapz(wave_spec,shifted_comps(:,1)); A(2)=trapz(wave_spec,shifted_comps(:,2)); A(3)=trapz(wave_spec,shifted_comps(:,3)); shifted_comps(:,1)=shifted_comps(:,1)/A(1); shifted_comps(:,2)=shifted_comps(:,2)/A(2); shifted_comps(:,3)=shifted_comps(:,3)/A(3); % weight and background %-------------------------------------------------------------- % create weight vectors (regions with less fluorescence - i.e. worse s/n - % are considered less in the fit). % To reduce outliers, the spectra will be smoothed significantly for this. smoothspec=sgolayfilt(int_spec,7,151); weight=zeros(size(int_spec)); for i = 1:size(int_spec,2) weight(:,i) = mat2gray(smoothspec(:,i)); end % the background (vector of constants) can be included as an additional % component, this sometimes leads to better fits. If it is only a minor % contribution or was subtracted before, replace "ones" with "zeros". The % matrix will be "rank deficient" (but this does not change the results). % The warning will be suppressed anyway. comps_final=[zeros(size(wave_spec)) shifted_comps]; %comps_final=[ones(size(wave_spec)) shifted_comps]; warning('off','MATLAB:rankDeficientMatrix'); % Calculation of the components' contribution to the spectrum (unmixing) %-------------------------------------------------------------- % Pre-allocation of the results vector ratios = zeros(size(int_spec,2),8); % erste Spalte laufende Nummer ratios(:,1)=(1:(size(int_spec,2)))'; for i=1:size(int_spec,2) % weight is multiplied with each column. Without it, the formula would % just be C=comps_final\spec
not certified by peer review) is the author/funder. All rights reserved. No reuse allowed without permission. The copyright holder for this preprint (which wasthis version posted August 1, 2019. . https://doi.org/10.1101/722124doi: bioRxiv preprint
Three-fluorophore FRET-FLIM enables the study of trimeric protein interactions
13
%c=([weight(:,i) weight(:,i) weight(:,i) weight(:,i)] .* comps_final)\(int_spec(:,i) .* weight(:,i)); c=lsqnonneg([weight(:,i) weight(:,i) weight(:,i) weight(:,i)] .* comps_final,int_spec(:,i) .* weight(:,i)); % to refine the results, the fit spectrum is defined as a new % weight factor weight(:,i)=mat2gray(comps_final*c); % re-calculation % c=([weight(:,i) weight(:,i) weight(:,i) weight(:,i)] .* comps_final)\(int_spec(:,i) .* weight(:,i)); c=lsqnonneg([weight(:,i) weight(:,i) weight(:,i) weight(:,i)] .* comps_final,int_spec(:,i) .* weight(:,i)); % CFP/YFP/RFP ratios and intensities % ----------------------------------------------------------- % via max intensities of the measured spectra Imax1=max(spec(comp1_start:comp1_end,i+1)); Imax2=max(spec(comp2_start:comp2_end,i+1)); Imax3=max(spec(comp3_start:comp3_end,i+1)); ratio_int=[Imax1 Imax2 Imax3]/(Imax1+Imax2+Imax3); % overall intensity of the measured spectrum int_total1 = trapz(wave_spec,spec(:,i+1)); % via unmixing ratio_comp=[c(2) c(3) c(4)]/(c(2)+c(3)+c(4)); % overall intensity of the fit spectrum int_total2 = trapz(wave_spec,[ones(size(wave_spec)) shifted_comps]*c); % results vector % ------------------------------------------------------------ ratios(i,:) = [ratio_int ratio_comp int_total1 int_total2]; end % if input was only one measured spectrum, then show plot if size(ratios,1)==1 plot(spec(:,1),spec(:,2)); hold on; plot(spec(:,1),[ones(size(wave_spec)) shifted_comps]*c); plot(spec(:,1),comps_final(:,2:4).*c(2:4)'); end warning('on','MATLAB:rankDeficientMatrix'); end % command: [ ratios ] = unmix_tripleFRET(Interpolatedspectra,TRQem,VENem,mRFP1em)
not certified by peer review) is the author/funder. All rights reserved. No reuse allowed without permission. The copyright holder for this preprint (which wasthis version posted August 1, 2019. . https://doi.org/10.1101/722124doi: bioRxiv preprint

Three-fluorophore FRET-FLIM enables the study of trimeric protein interactions
14
Supp. Material 7
Expression ratios of fluorescence lifetime measurements
As the fluorescence intensities were quantified with the simultaneous excitation of all
fluorophores, the background levels due to cross-excitation (ce) and bleed through (bt)
of control samples were coloured in grey (SI Fig. 6A-C). For example, when comparing
the ratio between mTRQ2 and mVEN (SI Fig. 6A), all samples not expressing mVEN
were control samples (RLP44– – , RLP44– –BAK1, RLP44– –BRI1, RLP44– –FLS2).
The fluorescence intensity was taken as estimation on expression level.
The ratio between RLP44 and BRI1 was not altered significantly between co-
expression of RLP44–BRI1, RLP44–BRI1–BAK1 and RLP44–BRI1–FLS2 (SI Fig. 6A).
There was a tendency of reduced BRI1 expression when FLS2 was co-expressed (SI
Fig. 6A), even reaching into levels in which BRI1 was not expressed (SI Fig. 6A grey
shade). Only the ratio of RLP44 to BAK1 (in RLP44–BRI1–BAK1) was significantly
lower compared to that of RLP44 to FLS44 (in RLP44–BRI1–FLS2) (SI Fig. 6B red
star). Or in other words, only FLS2 was significantly less abundant in triple-
coexpressions than BAK1 (p<0.01) (SI Fig. 6B). The ratio between BRI1 and BAK1 (in
RLP44–BRI1–BAK1) was not significantly different to that of BRI1 and FLS2 (in
RLP44–BRI1–FLS2) (SI Fig. 6C). There was a tendency, though, of reduced FLS2
expression level SI Fig. 6C).
not certified by peer review) is the author/funder. All rights reserved. No reuse allowed without permission. The copyright holder for this preprint (which wasthis version posted August 1, 2019. . https://doi.org/10.1101/722124doi: bioRxiv preprint

Three-fluorophore FRET-FLIM enables the study of trimeric protein interactions
15
Supp. Material 8
Primer list
GOI – vector Forward primer 5‘ » 3‘ Reverse primer 5‘ » 3‘ RLP44 - pDONR221-P3P2
GGGGACAACTTTGTATAATAAAGTTGtaATGACAAGGAGTCACCGGTTAC
GGGGACCACTTTGTACAAGAAAGCTGGGTtGTAATCAGGCATAGATTGAC
BRI1 - pDONR221-P1P4
GGGGACAAGTTTGTACAAAAAAGCAGGCTtaATGAAGACTTTTTCAAGCTTCTT
GGGGACAACTTTGTATAGAAAAGTTGGGTGTAATTTTCCTTCAGGAACTTCTT
FLS2 - pDONR221-P1P4
GGGGACAAGTTTGTACAAAAAAGCAGGCTtaATGAAGTTACTCTCAAAGAC
GGGGACAACTTTGTATAGAAAAGTTGGGTGAACTTCTCGATCCTCGTTACG
FLS2 - pDONR207
GGGGACAAGTTTGTACAAAAAAGCAGGCTtaATGAAGTTACT
GGGGACCACTTTGTACAAGAAAGCTGGGTgAACTTCTCGATCCT
References Balleza, E., Kim, J.M., and Cluzel, P. (2018). Systematic characterization of maturation time of fluorescent proteins in living cells. Nature Methods 15, 47-51.
Campbell, R.E., Tour, O., Palmer, A.E., Steinbach, P.A., Baird, G.S., Zacharias, D.A., and Tsien, R.Y. (2002). A monomeric red fluorescent protein. Proceedings of the National Academy of Sciences of the United States of America 99, 7877-7882.
Cranfill, P.J., Sell, B.R., Baird, M.A., Allen, J.R., Lavagnino, Z., Gruiter, H.M. de, Kremers, G.-J., Davidson, M.W., Ustione, A., and Piston, D.W. (2016). Quantitative assessment of fluorescent proteins. Nature Methods 13, 557-562.
Goedhart, J., Stetten, D.v., Noirclerc-Savoye, M., Lelimousin, M., Joosen, L., Hink, M.A., van Weeren, L., Jr, T.W.J.G., and Royant, A. (2012). Structure-guided evolution of cyan fluorescent proteins towards a quantum yield of 93%. Nature Communications 3, 751.
Kremers, G.-J., Goedhart, J., van Munster, E.B., and Gadella, T.W.J., JR (2006). Cyan and yellow super fluorescent proteins with improved brightness, protein folding, and FRET Forster radius. Biochemistry 45, 6570-6580.
Scott, B.L., and Hoppe, A.D. (2015). Optimizing fluorescent protein trios for 3-Way FRET imaging of protein interactions in living cells. Scientific Reports 5, 10270 EP -.
not certified by peer review) is the author/funder. All rights reserved. No reuse allowed without permission. The copyright holder for this preprint (which wasthis version posted August 1, 2019. . https://doi.org/10.1101/722124doi: bioRxiv preprint
Top Related