


Languages
Pages
Legal

The Ups and Downs, Ins and Outs of Transportation
10th Annual Rocky Mountain Commercial Real Estate Expo
November 12, 2004

Current State of The Airline Industry
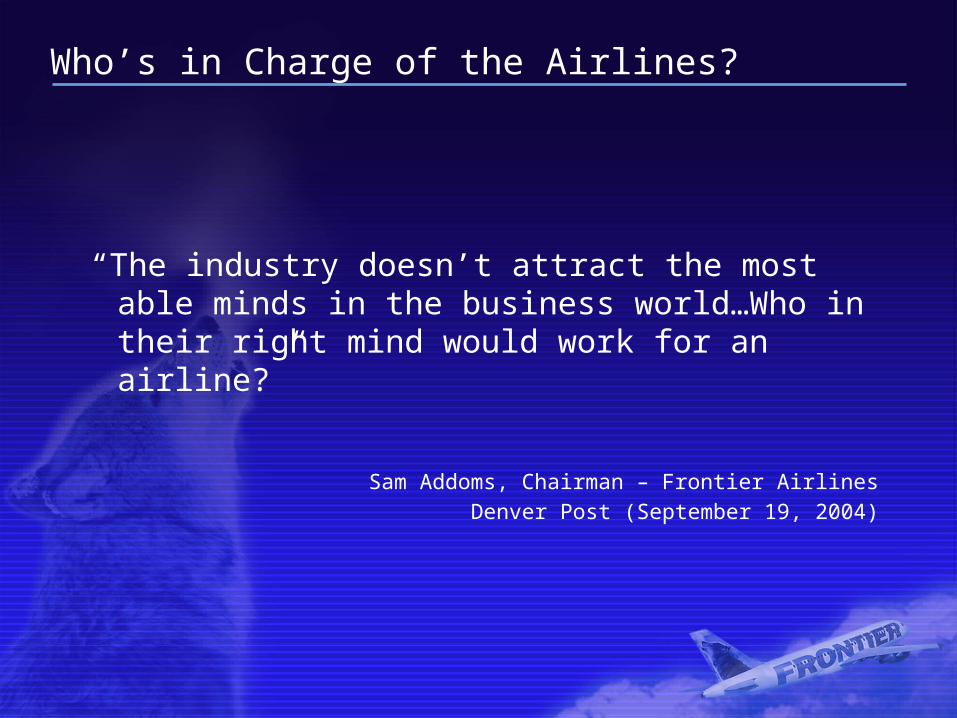
Who’s in Charge of the Airlines?
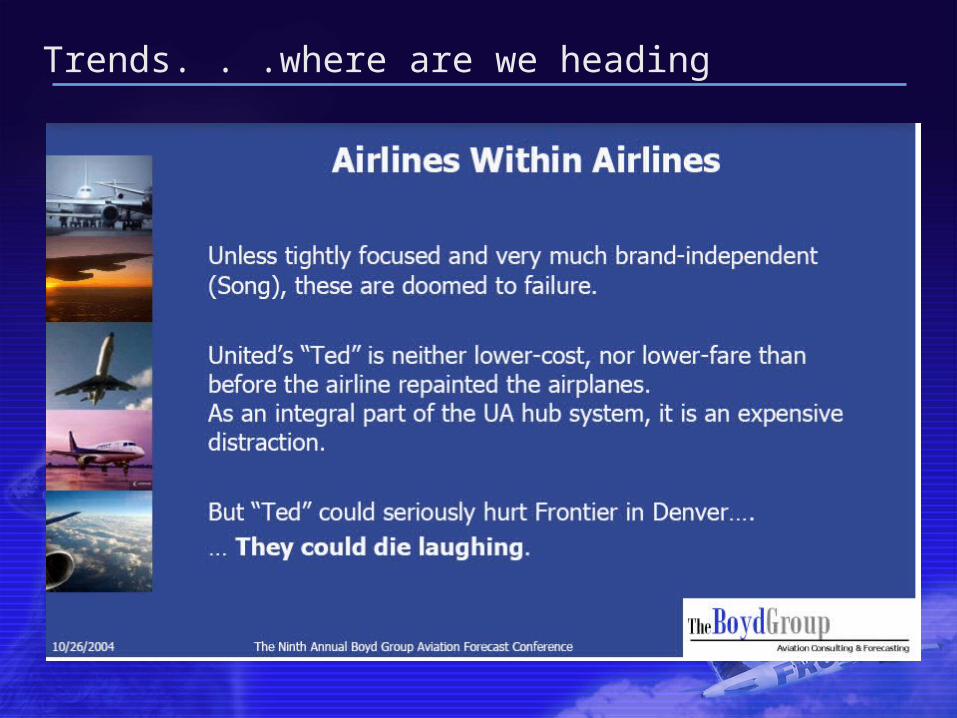
“The industry doesn’t attract the most able minds in the business world…Who in their right mind would work for an airline?”
Sam Addoms, Chairman – Frontier Airlines
Denver Post (September 19, 2004)
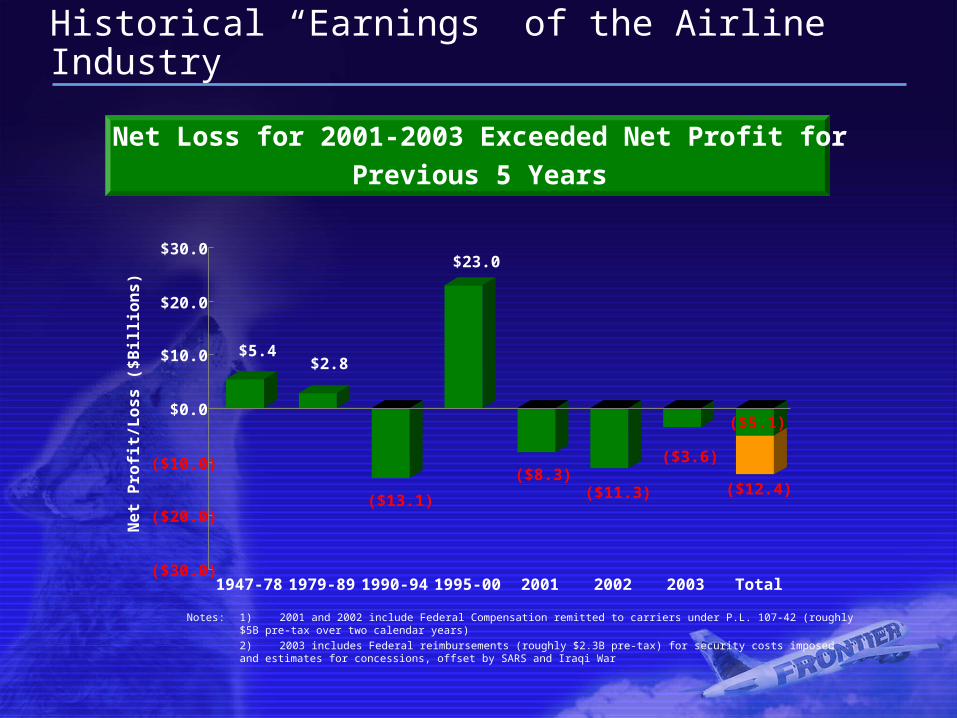
Historical “Earnings” of the Airline Industry
Net Loss for 2001-2003 Exceeded Net Profit for
Previous 5 Years
Notes: 1) 2001 and 2002 include Federal Compensation remitted to carriers under P.L. 107-42 (roughly $5B pre-tax over two calendar years)
2) 2003 includes Federal reimbursements (roughly $2.3B pre-tax) for security costs imposed and estimates for concessions, offset by SARS and Iraqi War
$5.4$2.8
($13.1)
$23.0
($8.3)($11.3)
($3.6)
($5.1)
($12.4)
($30.0)
($20.0)
($10.0)
$0.0
$10.0
$20.0
$30.0
Ne
t P
rofi
t/L
os
s (
$B
illi
on
s)
1947-78 1979-89 1990-94 1995-00 2001 2002 2003 Total
Industry Overview
“We believe the next 12 months will see more change in the industry than the past three years combined.” Morgan Stanley – September 7, 2004
“High oil prices will only accelerate the inevitable – i.e. an industry restructuring – and we believe some carriers will be forced to retrench further or may even go out of business.” Merrill Lynch – September 8, 2004
Delta: Announced restructuring on September 8, 2004— Dallas/Ft. Worth flights to be reduced from 254 flights to 21— Song to increase from 36 to 48 aircraft
United: Continues to operate in bankruptcy and is seeking pension relief
US Airways: Seeking further concessions; second bankruptcy filing
ATA: Announced bankruptcy and likely Chapter 7
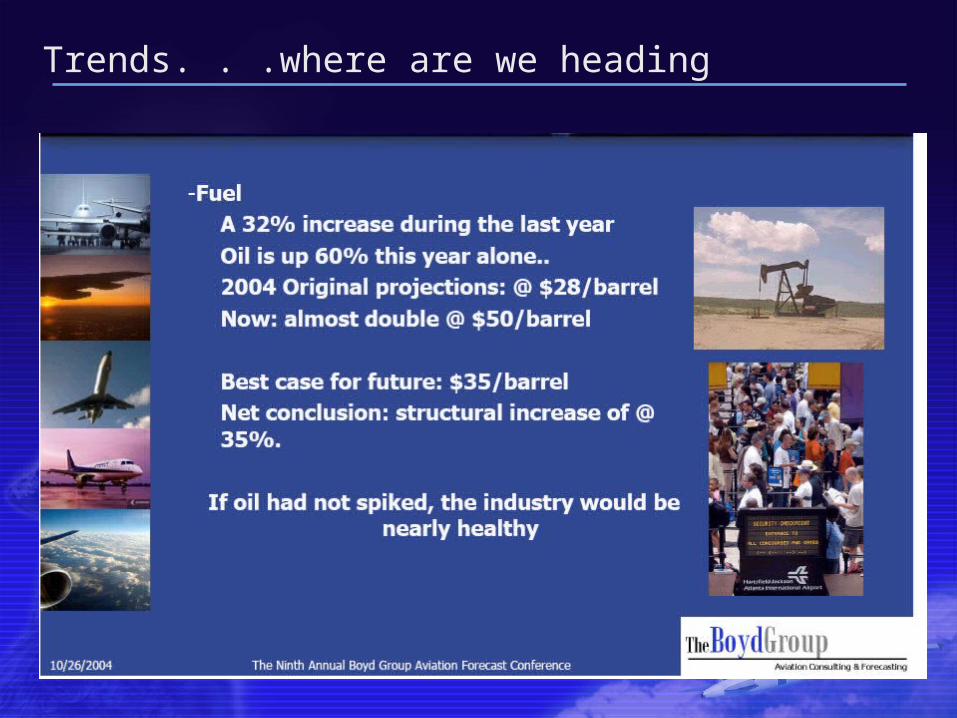
Trends. . .where are we heading

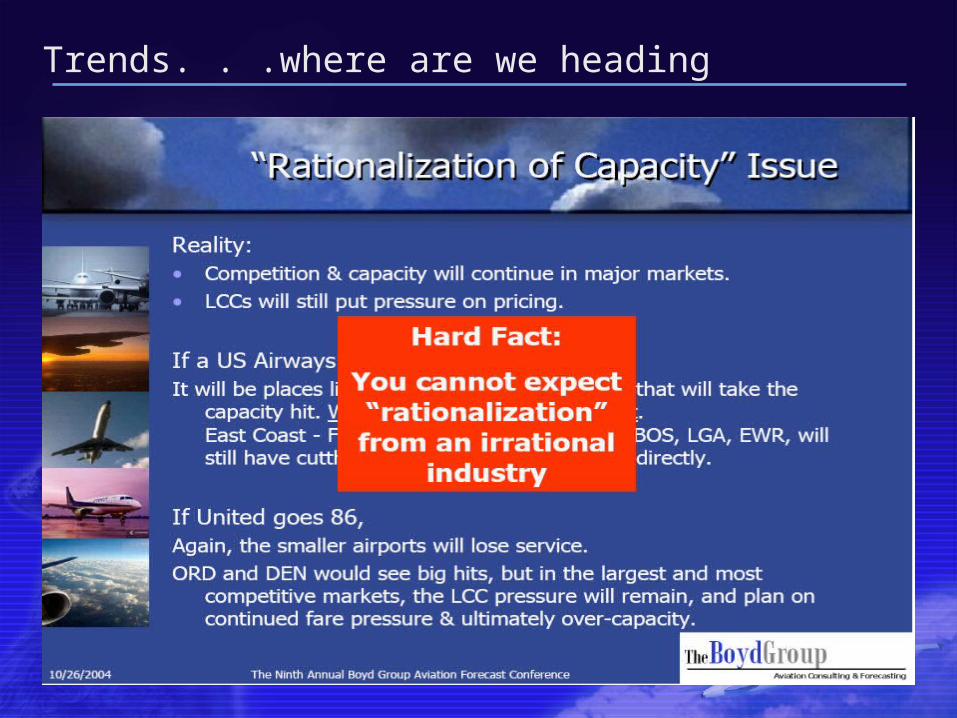
Trends. . .where are we heading
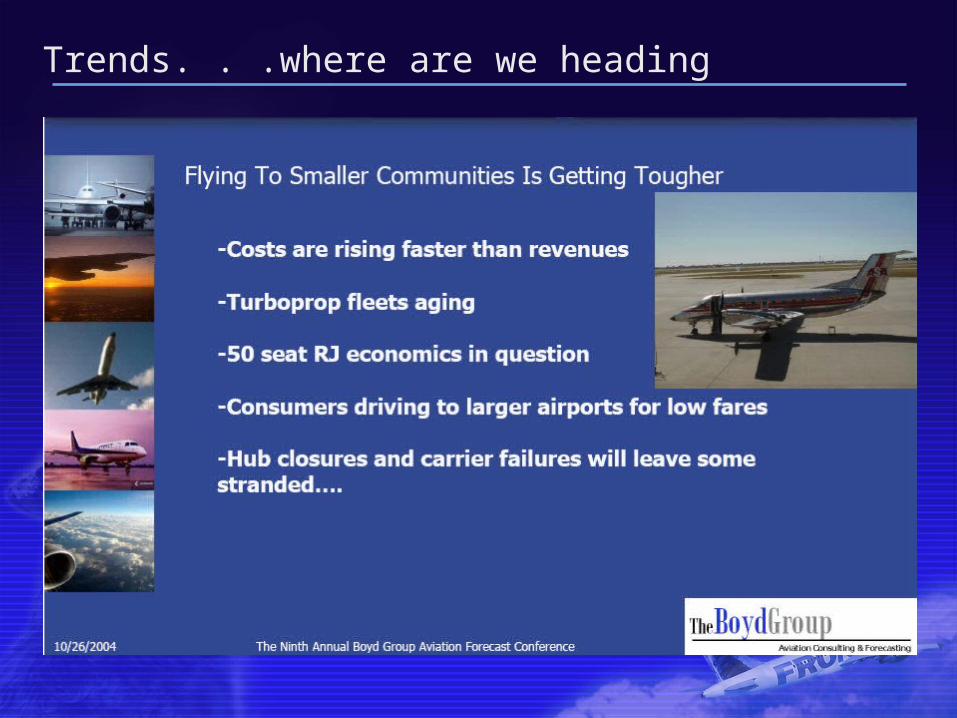
Trends. . .where are we heading
Trends. . .where are we heading
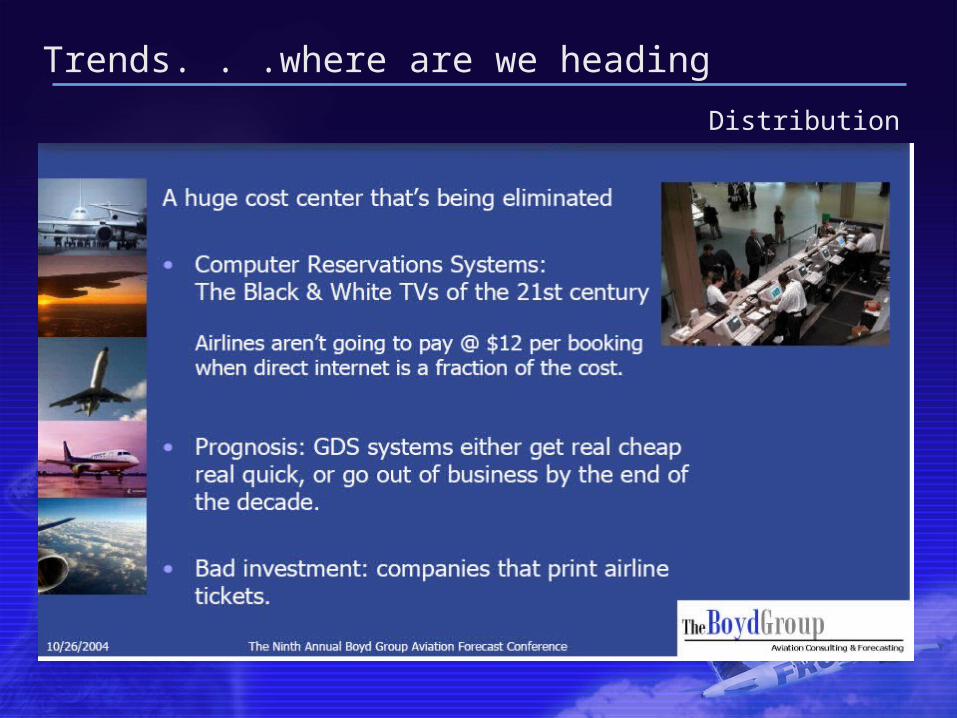
Distribution
Trends. . .where are we heading

Trends. . .where are we heading
Trends. . .where are we heading

As Colorado Grows. . .
3.0
3.5
4.0
4.5
5.0
5.5
6.0
6.5
7.0
7.5
8.0
2005 2010 2015 2020 2025 2030
Po
pu
latio
n (M
illio
ns
)
Forecasted Population for Colorado
2004 - 2030
4.6 Million
7.2 Million
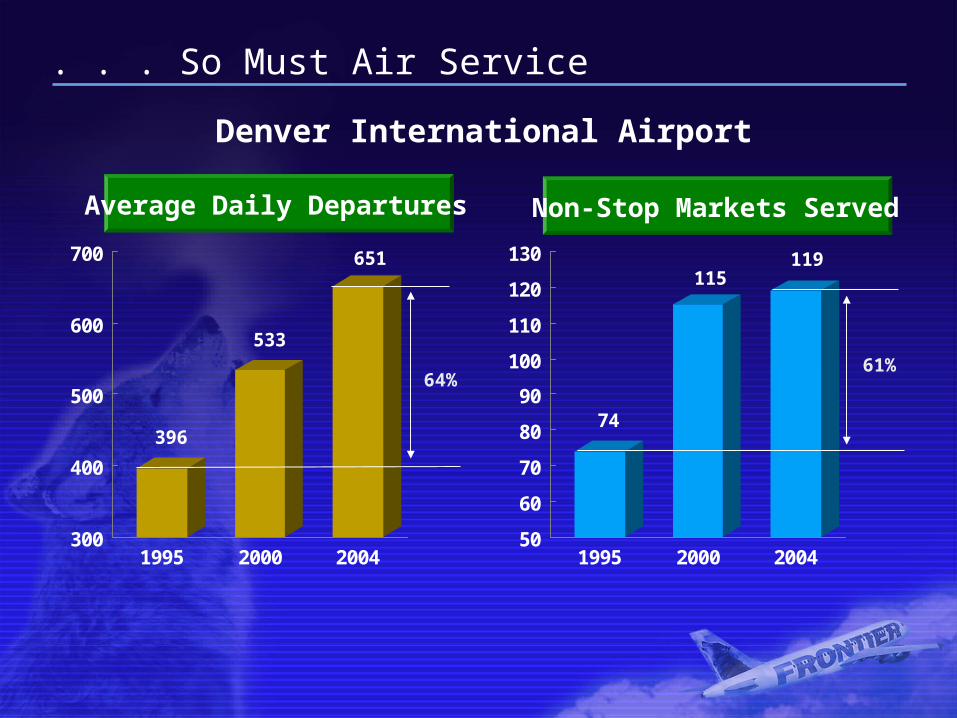
. . . So Must Air Service
396
533
651
300
400
500
600
700
1995 2000 2004
74
115119
50
60
70
80
90
100
110
120
130
1995 2000 2004
61%64%
Average Daily Departures Non-Stop Markets Served
Denver International Airport
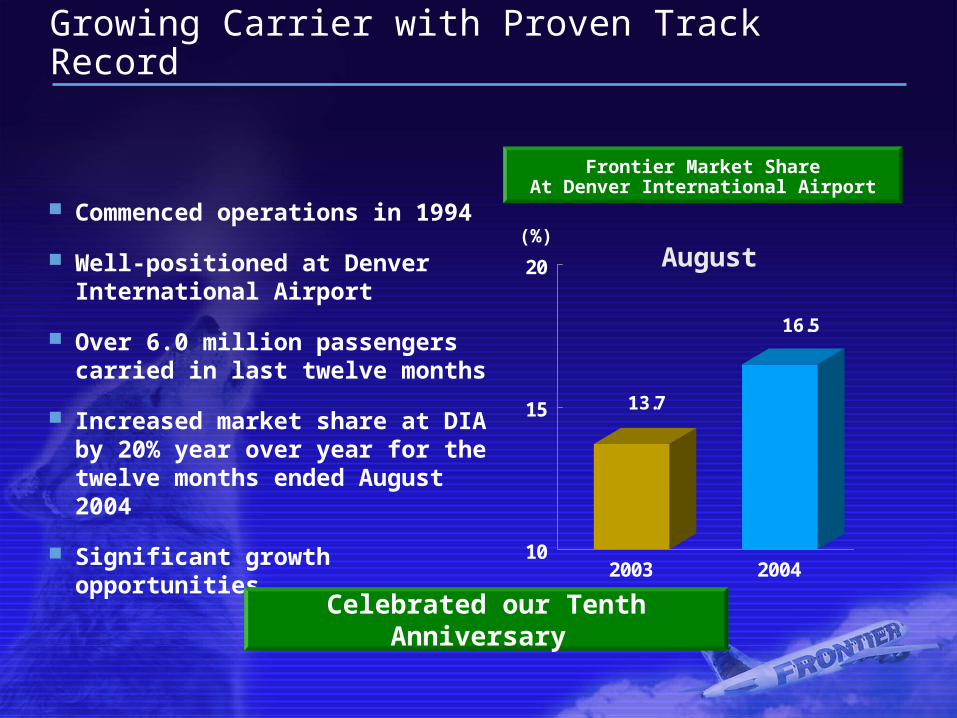
13.7
16.5
10
15
20
2003 2004
Growing Carrier with Proven Track Record
Commenced operations in 1994
Well-positioned at Denver International Airport
Over 6.0 million passengers carried in last twelve months
Increased market share at DIA by 20% year over year for the twelve months ended August 2004
Significant growth opportunities
Frontier Market ShareAt Denver International Airport
(%)August
Celebrated our Tenth Anniversary
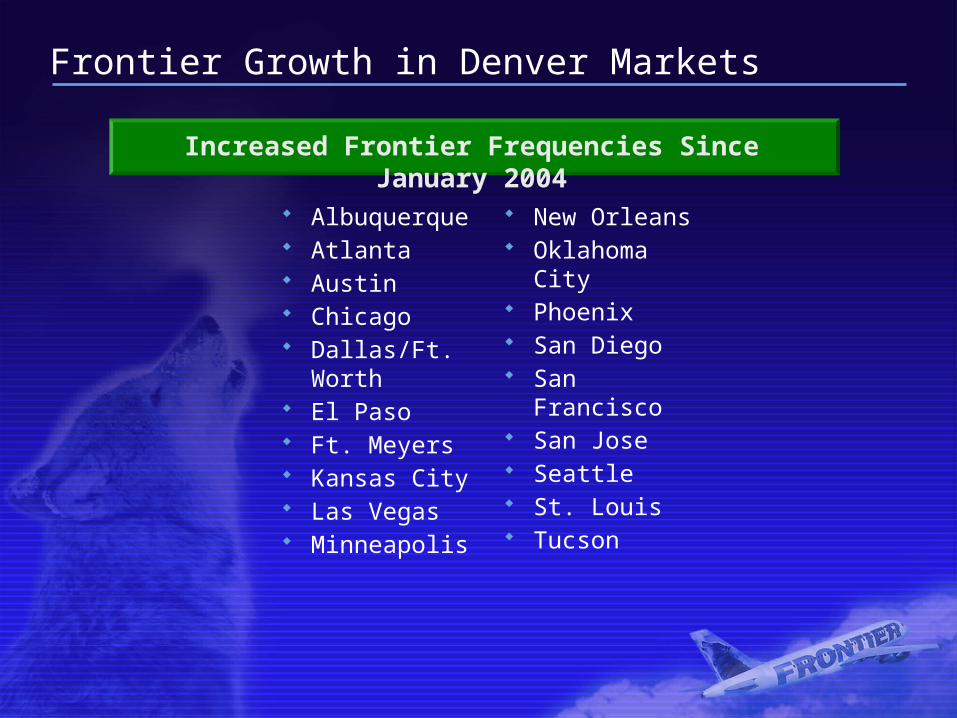
Frontier Growth in Denver Markets
Albuquerque Atlanta Austin Chicago Dallas/Ft.
Worth El Paso Ft. Meyers Kansas City Las Vegas Minneapolis
New Orleans Oklahoma City Phoenix San Diego San Francisco San Jose Seattle St. Louis Tucson
Increased Frontier Frequencies Since January 2004
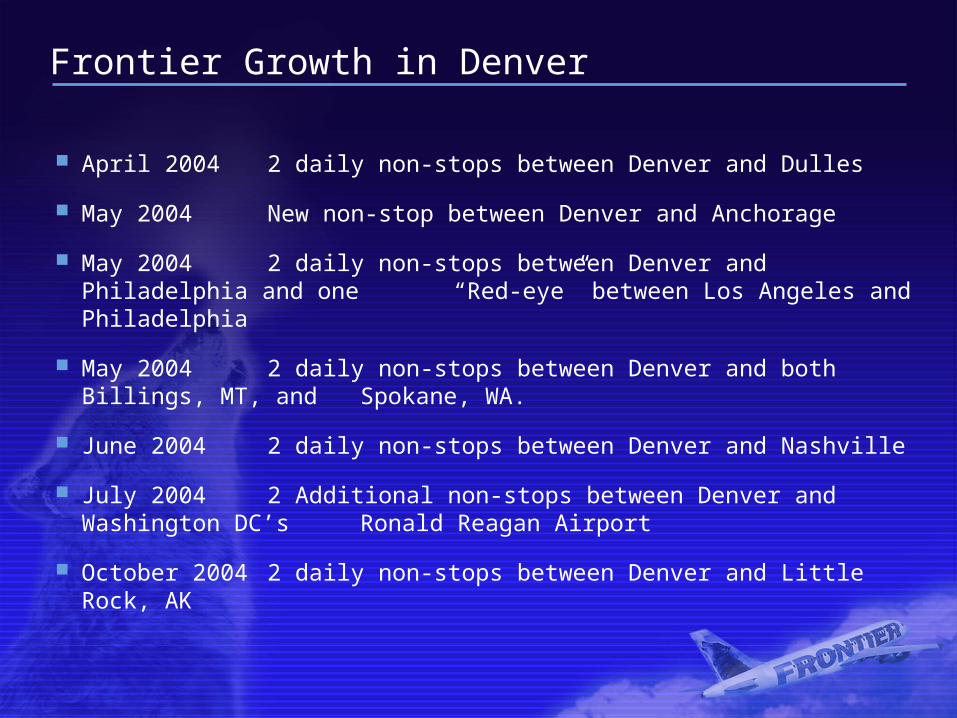
Frontier Growth in Denver
April 2004 2 daily non-stops between Denver and Dulles
May 2004 New non-stop between Denver and Anchorage
May 2004 2 daily non-stops between Denver and Philadelphia and one “Red-eye” between Los Angeles and Philadelphia
May 2004 2 daily non-stops between Denver and both Billings, MT, and Spokane, WA.
June 2004 2 daily non-stops between Denver and Nashville
July 2004 2 Additional non-stops between Denver and Washington DC’s Ronald Reagan Airport
October 2004 2 daily non-stops between Denver and Little Rock, AK
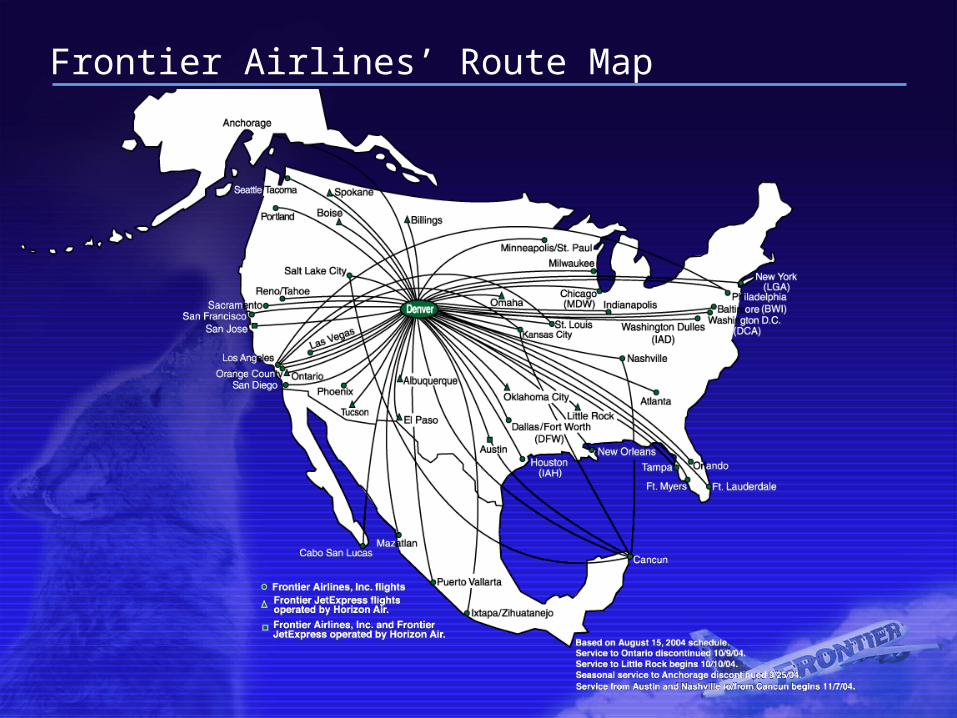
Frontier Airlines’ Route Map
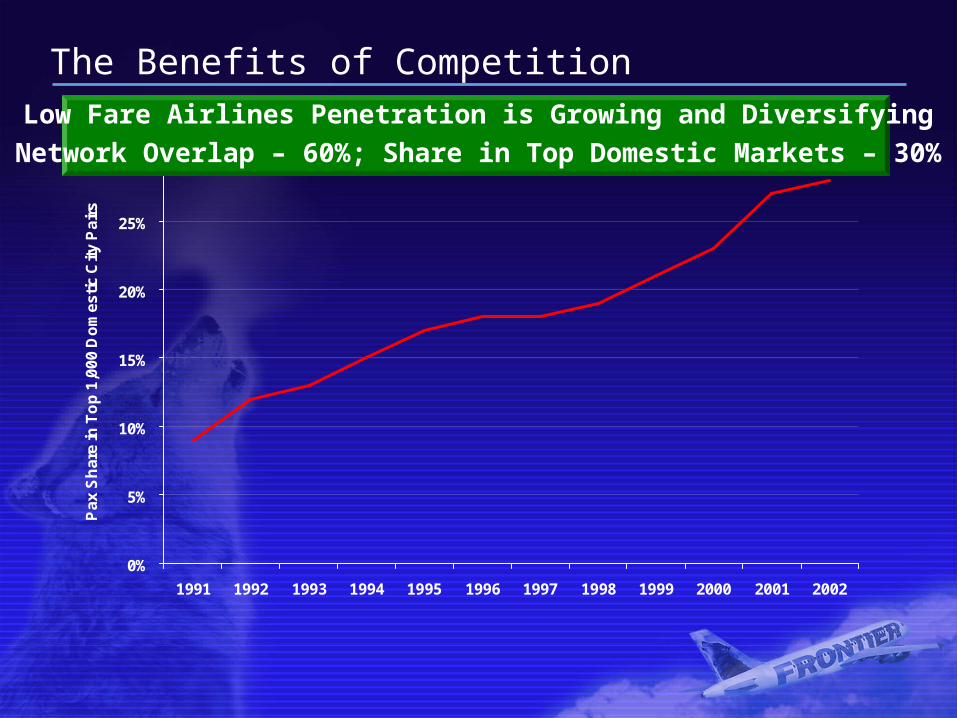
The Benefits of Competition
0%
5%
10%
15%
20%
25%
30%
1991 1992 1993 1994 1995 1996 1997 1998 1999 2000 2001 2002
Pax
Sh
are
in T
op
1,0
00 D
om
estic
City
Pai
rs
Low Fare Airlines Penetration is Growing and Diversifying
Network Overlap – 60%; Share in Top Domestic Markets – 30%
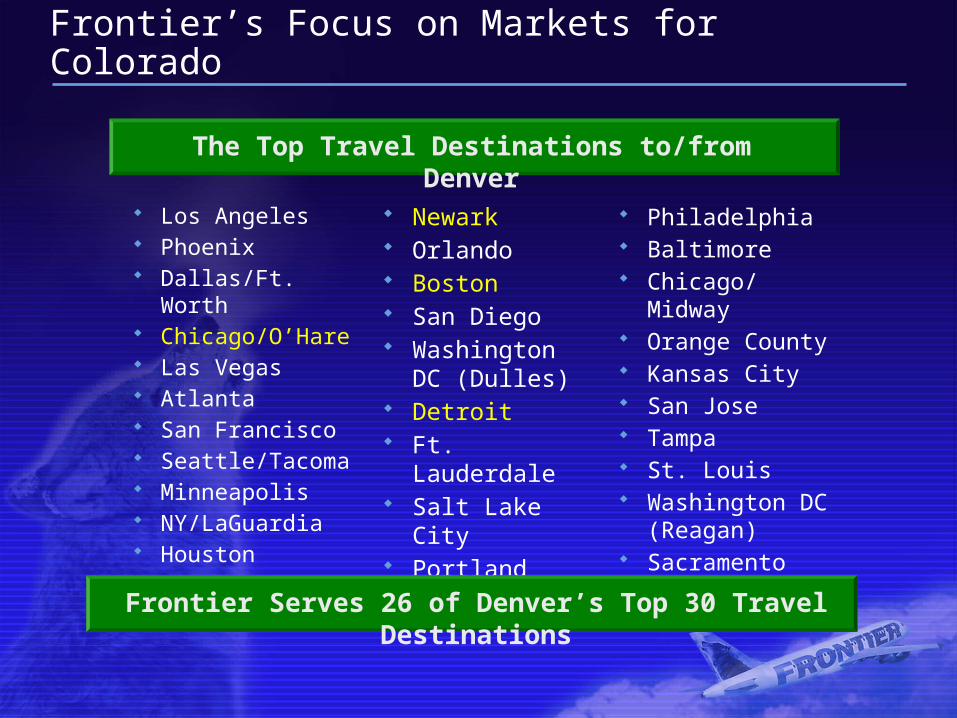
Frontier’s Focus on Markets for Colorado
Los Angeles Phoenix Dallas/Ft. Worth Chicago/O’Hare Las Vegas Atlanta San Francisco Seattle/Tacoma Minneapolis NY/LaGuardia Houston
Newark Orlando Boston San Diego Washington DC
(Dulles) Detroit Ft. Lauderdale Salt Lake City Portland
The Top Travel Destinations to/from Denver
Philadelphia Baltimore Chicago/Midway Orange County Kansas City San Jose Tampa St. Louis Washington DC
(Reagan) Sacramento
Frontier Serves 26 of Denver’s Top 30 Travel Destinations
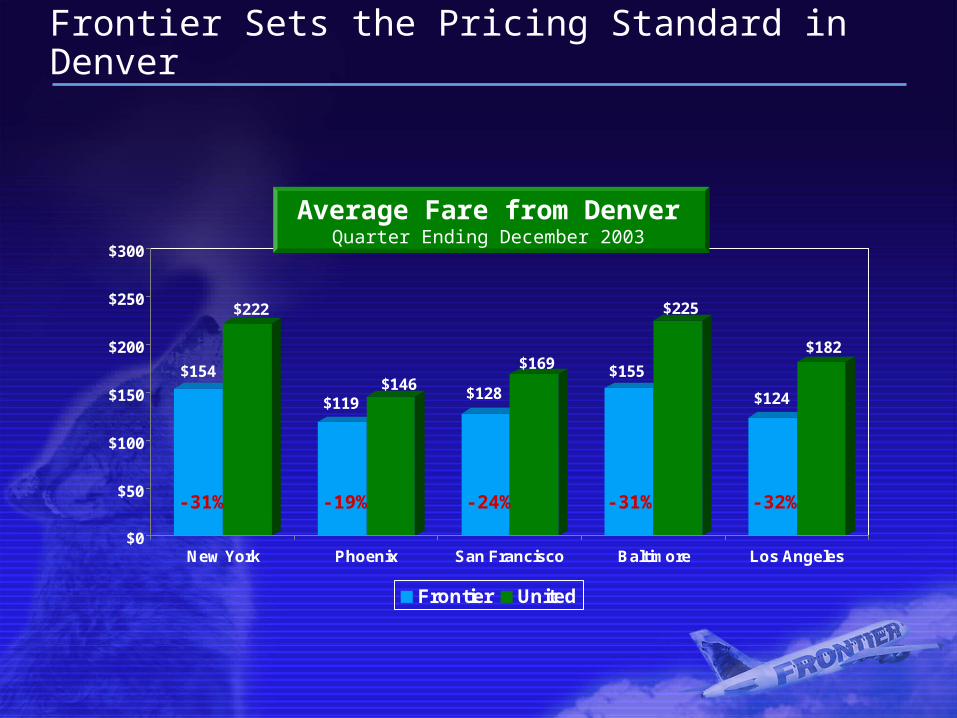
Frontier Sets the Pricing Standard in Denver
$154
$222
$119$146
$128
$169 $155
$225
$124
$182
$0
$50
$100
$150
$200
$250
$300
New York Phoenix San Francisco Baltimore Los Angeles
Frontier United
Average Fare from DenverQuarter Ending December 2003
-31% -19% -24% -31% -32%
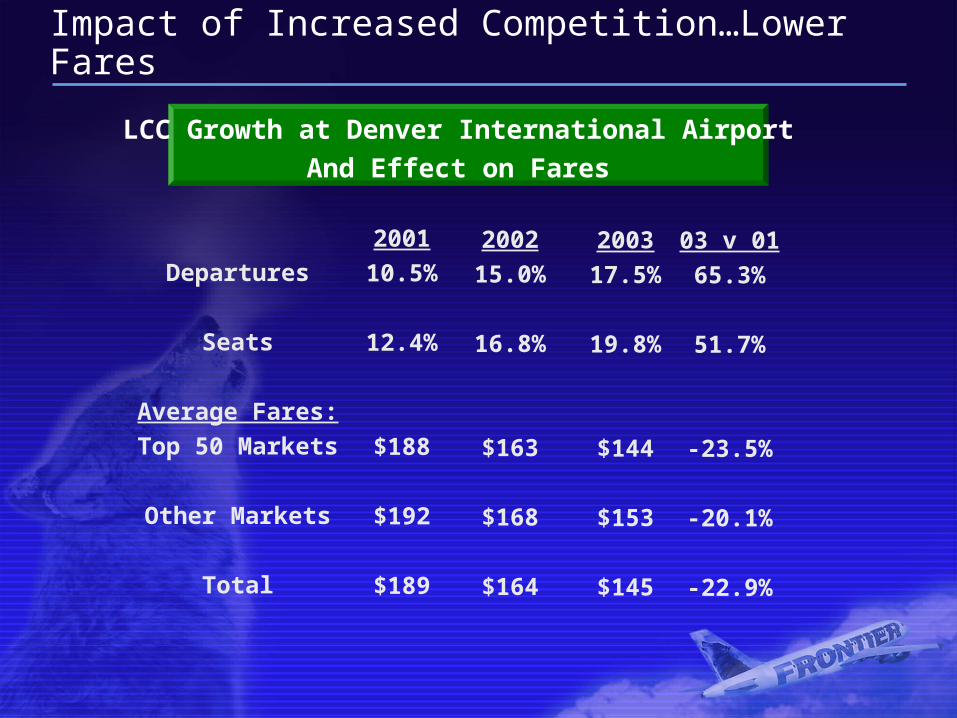
Impact of Increased Competition…Lower Fares
LCC Growth at Denver International Airport
And Effect on Fares
Departures
Seats
Average Fares:
Top 50 Markets
Other Markets
Total
2001
10.5%
12.4%
$188
$192
$189
2002
15.0%
16.8%
$163
$168
$164
2003
17.5%
19.8%
$144
$153
$145
03 v 01
65.3%
51.7%
-23.5%
-20.1%
-22.9%
7
18
1
7
17
7
3
16
18
11
28
7
4
44
9
50
9
57
9
62
9
0
10
20
30
40
50
60
70
80
FY 2001 FY 2002 FY 2003 FY 2004 FY 2005 FY 2006 FY 2007 FY 2008
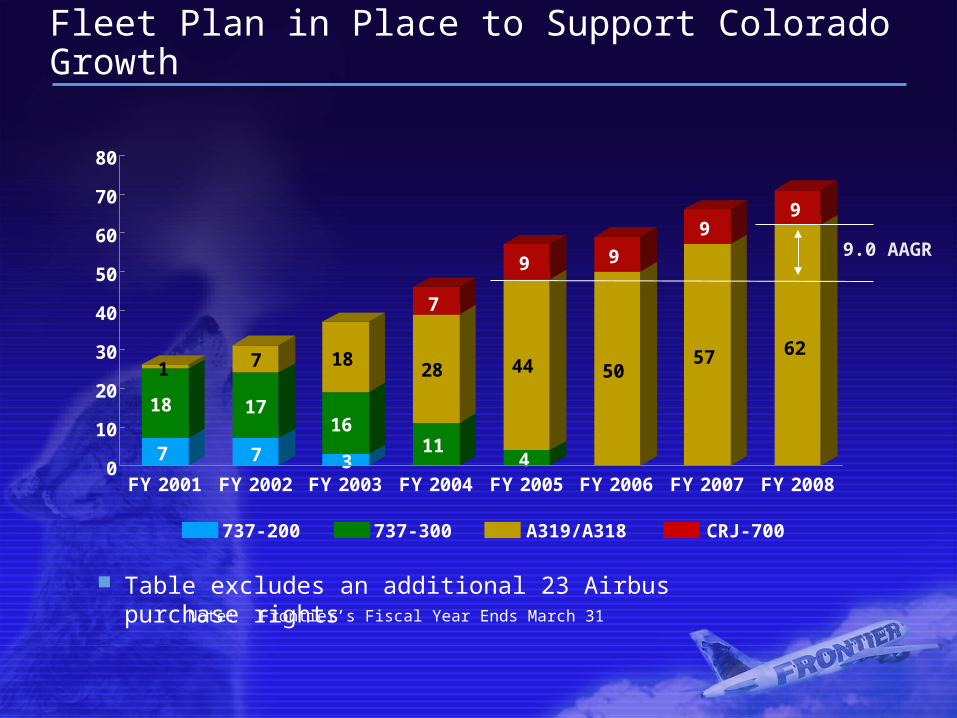
Fleet Plan in Place to Support Colorado Growth
Note: Frontier’s Fiscal Year Ends March 31
Table excludes an additional 23 Airbus purchase rights
737-200 737-300 A319/A318 CRJ-700
9.0 AAGR
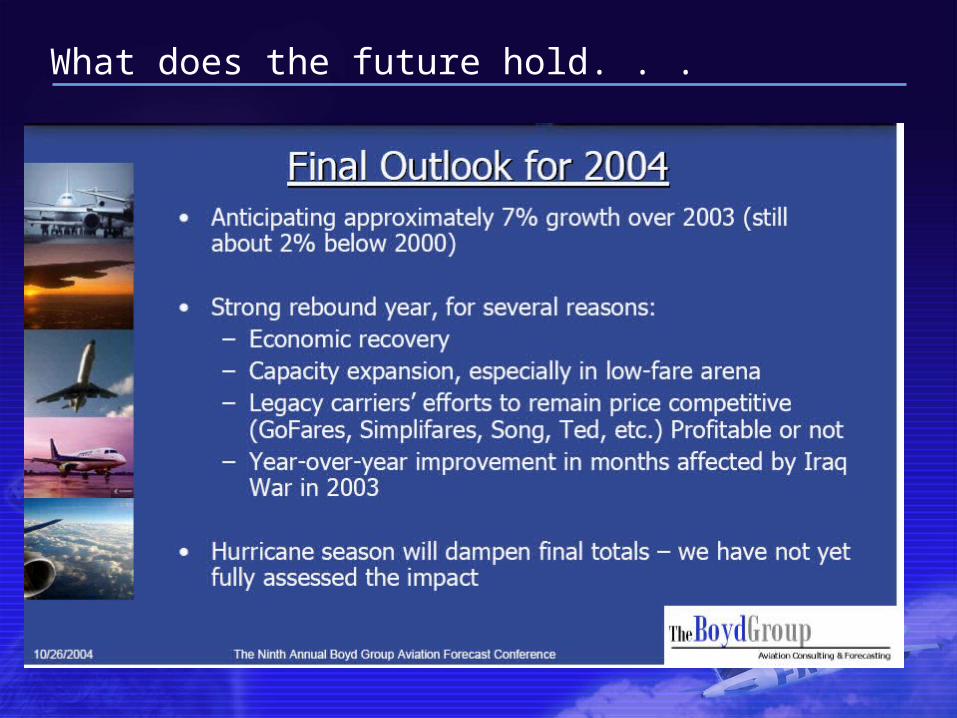
What does the future hold. . .
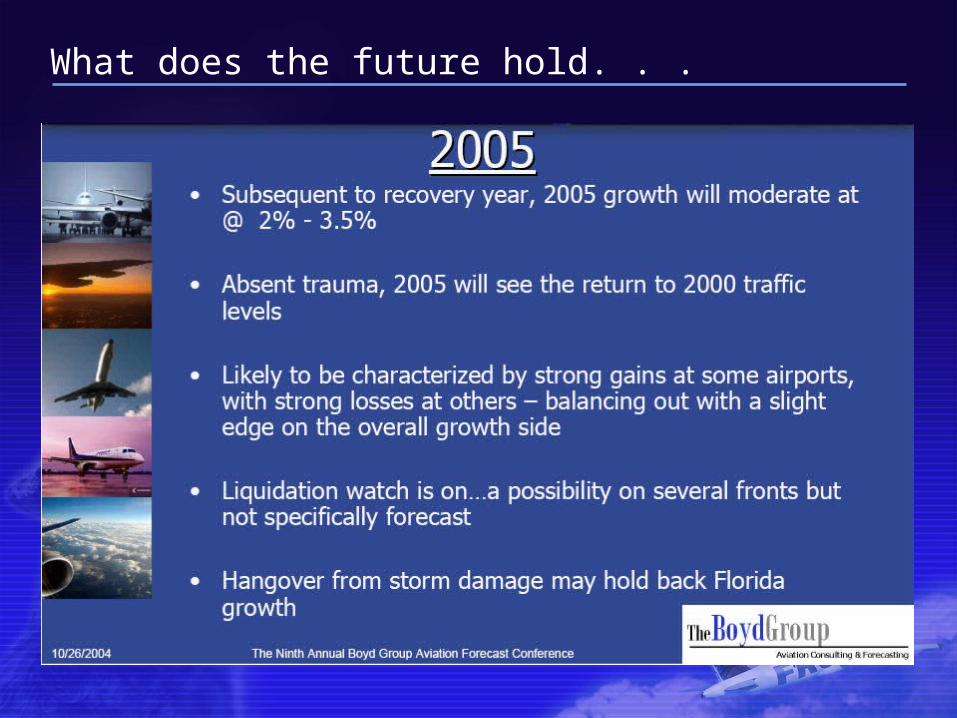
What does the future hold. . .

What does the future hold. . .
What does the future hold. . .

What does the future hold. . .
What does the future hold. . .

What does the future hold. . .
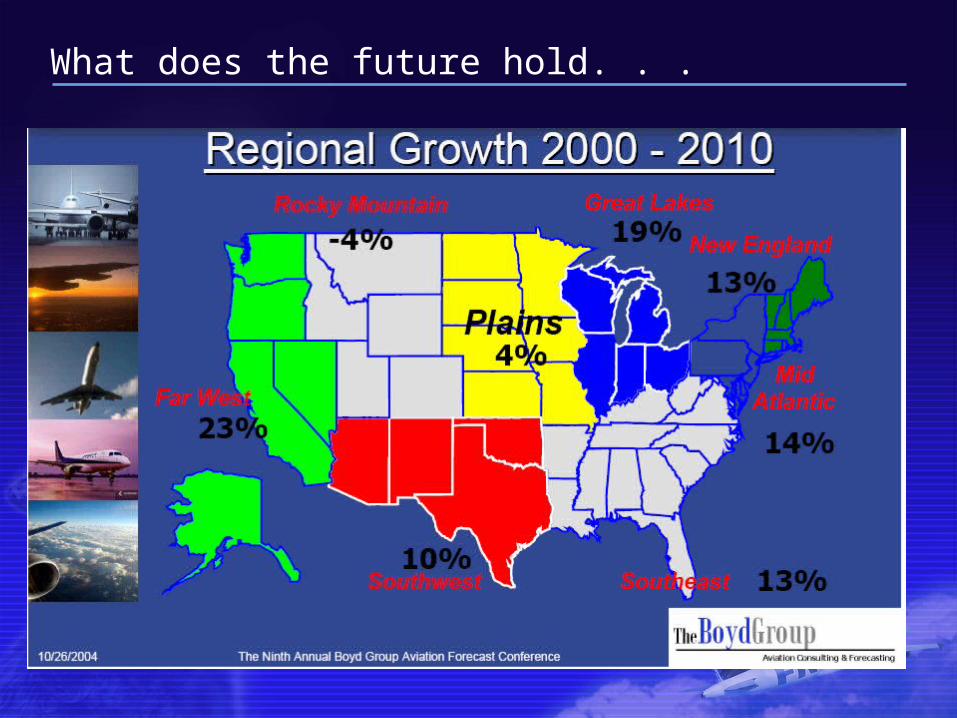
What does the future hold. . .
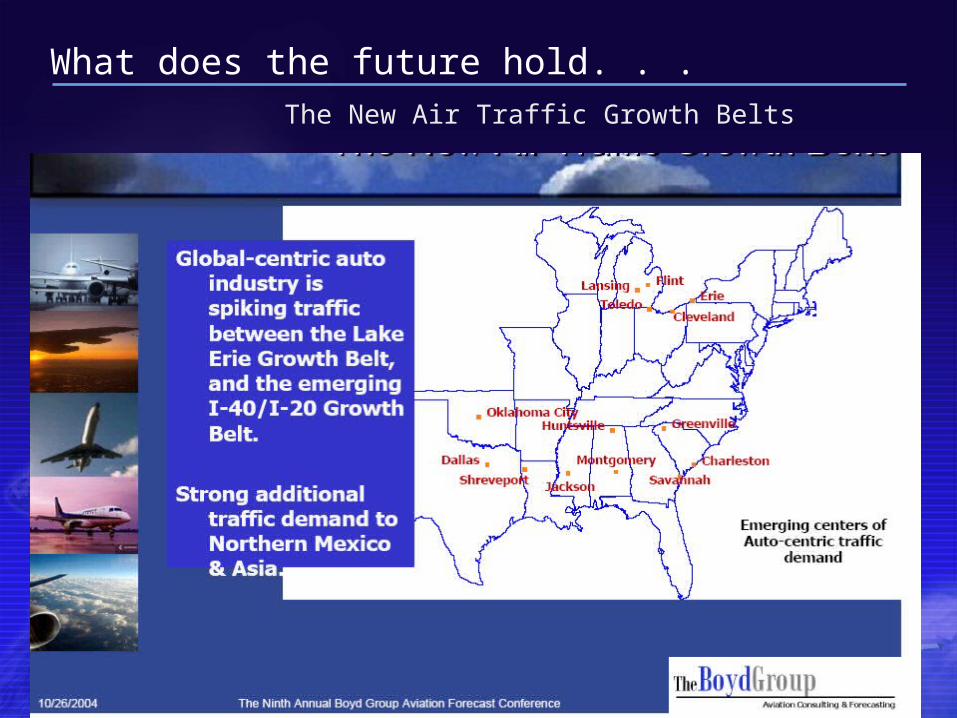
What does the future hold. . . The New Air Traffic Growth Belts
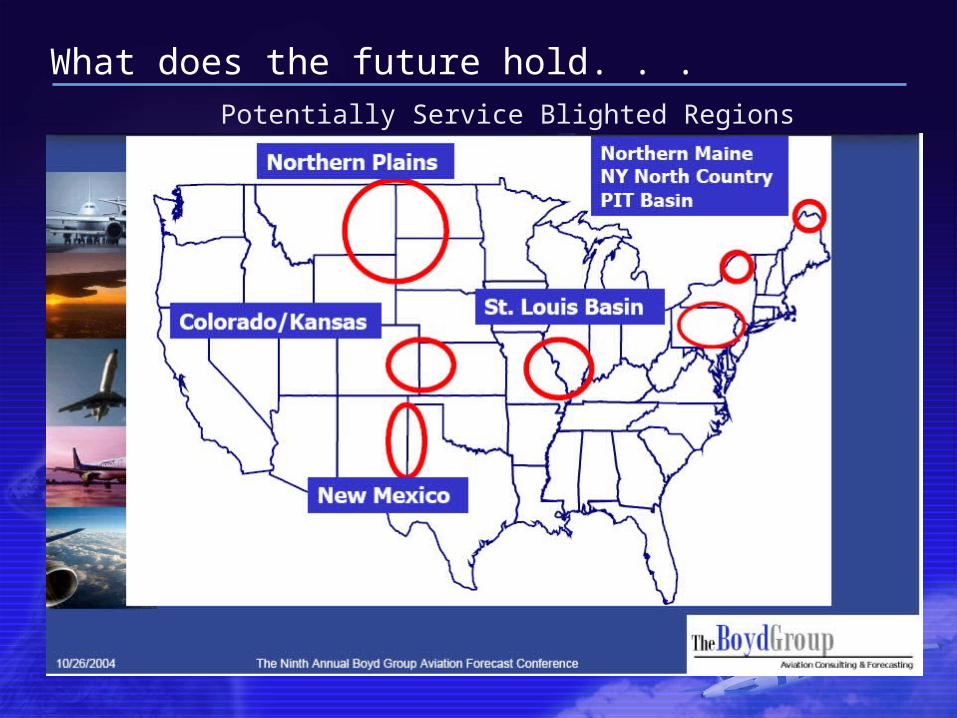
What does the future hold. . . Potentially Service Blighted Regions
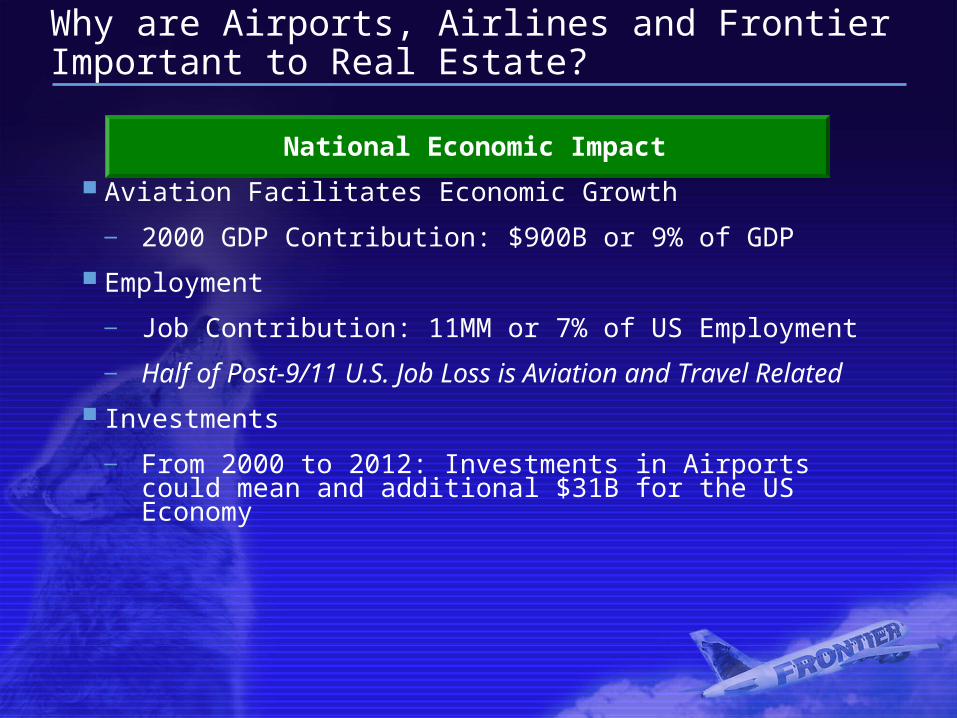
Why are Airports, Airlines and Frontier Important to Real Estate?
National Economic Impact
Aviation Facilitates Economic Growth
— 2000 GDP Contribution: $900B or 9% of GDP
Employment
— Job Contribution: 11MM or 7% of US Employment
— Half of Post-9/11 U.S. Job Loss is Aviation and Travel Related
Investments
— From 2000 to 2012: Investments in Airports could mean and additional $31B for the US Economy
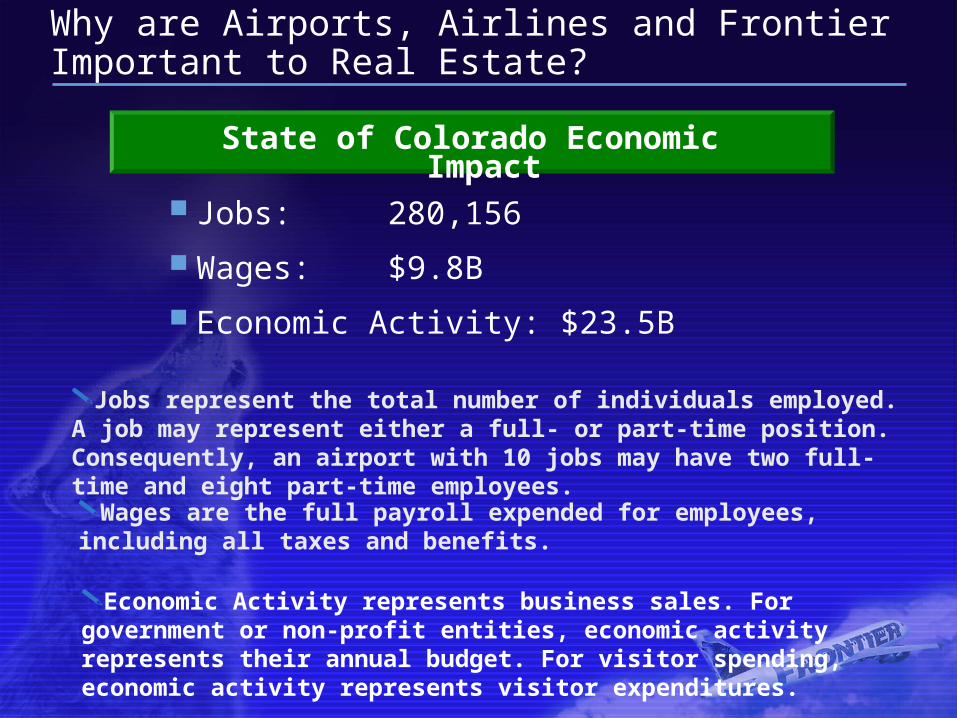
Why are Airports, Airlines and Frontier Important to Real Estate?
Jobs represent the total number of individuals employed. A job may represent either a full- or part-time position. Consequently, an airport with 10 jobs may have two full-time and eight part-time employees.
Wages are the full payroll expended for employees, including all taxes and benefits.
Economic Activity represents business sales. For government or non-profit entities, economic activity represents their annual budget. For visitor spending, economic activity represents visitor expenditures.
Jobs: 280,156
Wages: $9.8B
Economic Activity: $23.5B
State of Colorado Economic Impact
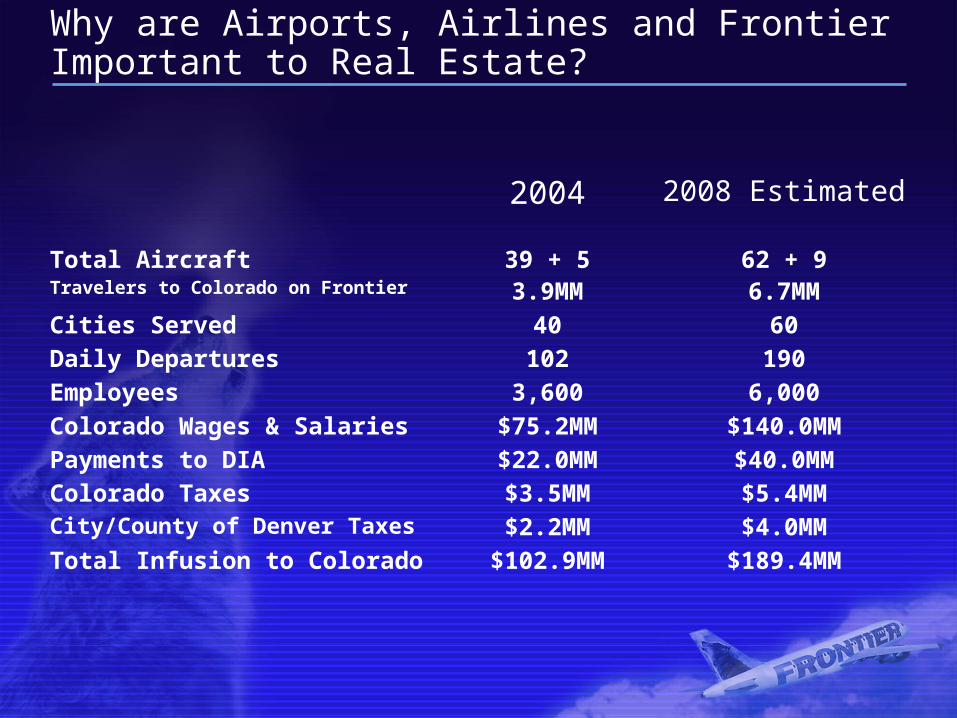
Why are Airports, Airlines and Frontier Important to Real Estate?
190102Daily Departures
2008 Estimated2004
62 + 939 + 5Total Aircraft6.7MM3.9MMTravelers to Colorado on Frontier
6040Cities Served
6,0003,600Employees
$140.0MM$75.2MMColorado Wages & Salaries
$40.0MM$22.0MMPayments to DIA
$5.4MM$3.5MMColorado Taxes
$4.0MM$2.2MMCity/County of Denver Taxes
$189.4MM$102.9MMTotal Infusion to Colorado
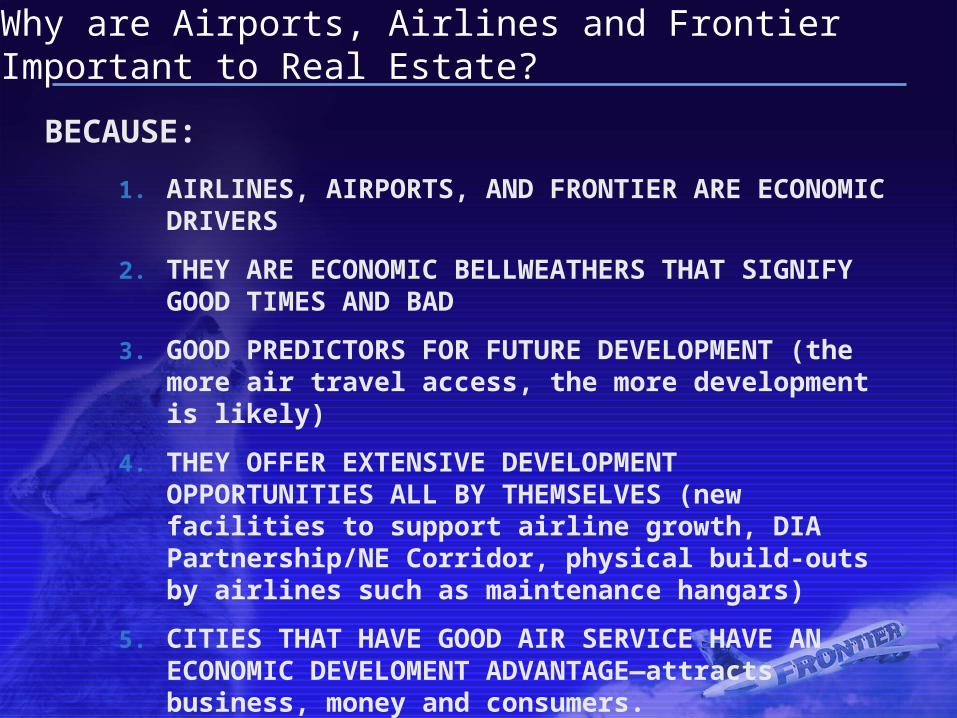
1. AIRLINES, AIRPORTS, AND FRONTIER ARE ECONOMIC DRIVERS
2. THEY ARE ECONOMIC BELLWEATHERS THAT SIGNIFY GOOD TIMES AND BAD
3. GOOD PREDICTORS FOR FUTURE DEVELOPMENT (the more air travel access, the more development is likely)
4. THEY OFFER EXTENSIVE DEVELOPMENT OPPORTUNITIES ALL BY THEMSELVES (new facilities to support airline growth, DIA Partnership/NE Corridor, physical build-outs by airlines such as maintenance hangars)
5. CITIES THAT HAVE GOOD AIR SERVICE HAVE AN ECONOMIC DEVELOMENT ADVANTAGE—attracts business, money and consumers.
Why are Airports, Airlines and Frontier Important to Real Estate?
BECAUSE:
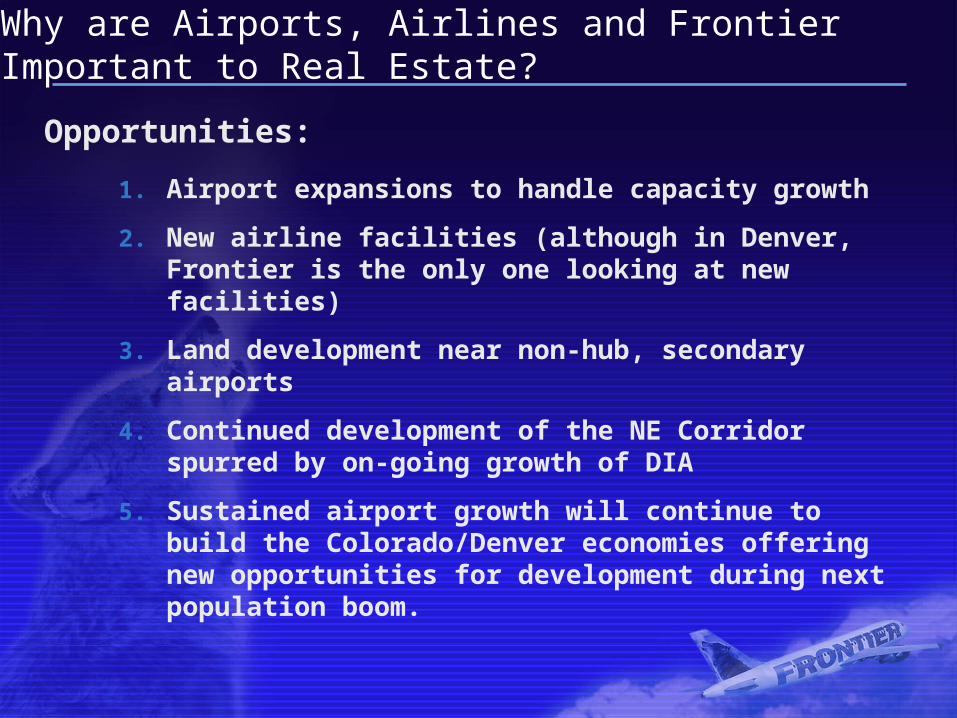
1. Airport expansions to handle capacity growth
2. New airline facilities (although in Denver, Frontier is the only one looking at new facilities)
3. Land development near non-hub, secondary airports
4. Continued development of the NE Corridor spurred by on-going growth of DIA
5. Sustained airport growth will continue to build the Colorado/Denver economies offering new opportunities for development during next population boom.
Why are Airports, Airlines and Frontier Important to Real Estate?
Opportunities:

Just for Fun
American Cuisine
Binoculars

Just for Fun
EarlyReturns
Mexico

Just for Fun
Snow
Underwear