


Languages
Pages
Legal


Today, let’s s-art with
Solomon Asch’s Experiment
?
A B C

⼼心理OS: 天啊!智障嗎? 這是在污辱我智商嗎?! 當然是B啊!我智商157耶!

東尼史塔克:唉廢話! 當然是A啊!你是⽩白痴嗎,我智商157耶!

WTF! 真的是豬⼀一般的隊友,智商157是什麼⻤⿁鬼!連這種問題都回答錯

⿊黑寡婦:這是什麼⻤⿁鬼問題! 答案當然是A啊!這有什麼好疑問的!!!

…… $%@^&!$#!

隊⻑⾧長:不選A是要選什麼啊?

……

⼩小綠綠隊友:A !!!!!

……

獨眼⻯⿓龍:嘿神明隊友!你勒?

……

神明隊友:當然是A啊!
從 眾 行 為
Herding Behaviour

真正能夠⼀一個打⼗十個的⼈人很少!


挑對隊友變成很重要的事情


正 向 回 饋
Positive Feedback
處 份 效 應
Disposition Effect

資 訊 階 流
Information Cascades

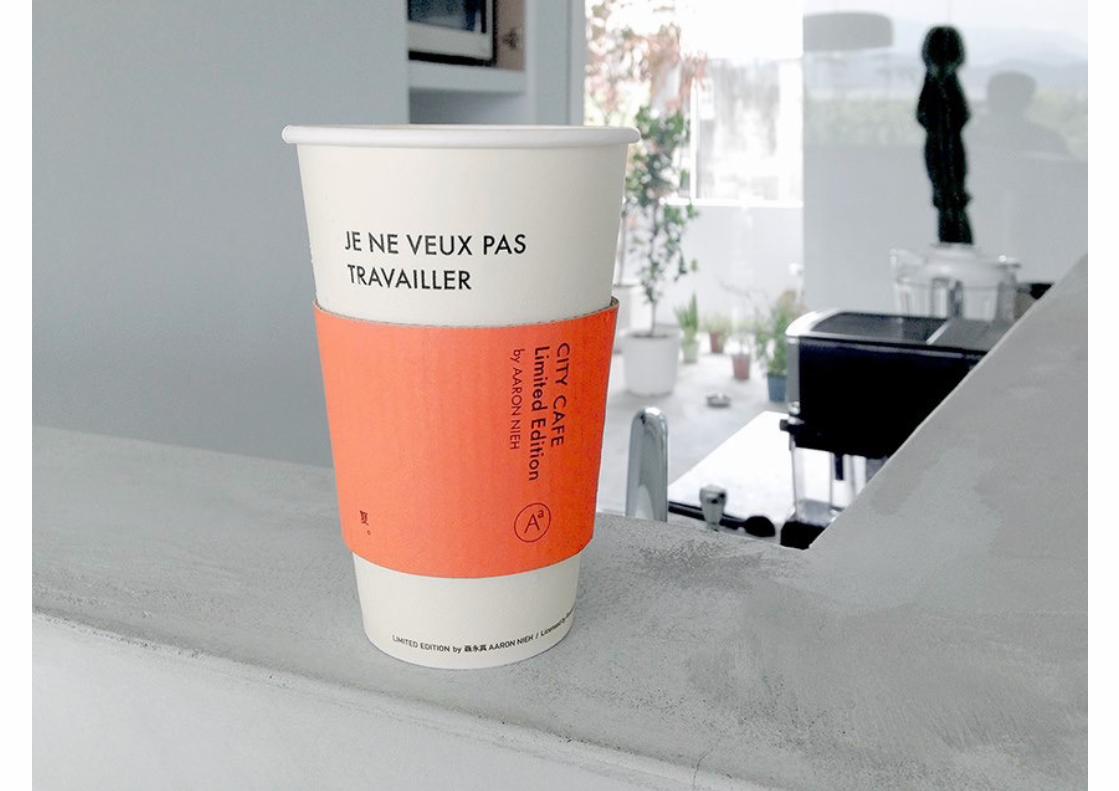
7-11’s City Coffee!

想要Starbuck, … 算了還是City Coffee 好了!

City Coffee 感覺好像⽐比較好

City Coffee 應該沒⽐比較差!

就我觀察啦,City Coffee!
Someday, . . .
The influence of noise traders
Will become apparent
Fisher Black, 1986
Sys-ematic noise
# Speakers: 張博能 | Department of Money and Banking
Brad M. Barber, Terrance Odean, Ning Zhu
Course of Financial Economics @ National Chengchi University
[email protected] | @SCephan_Chang
2015/6/15

有⾜足夠多的⽂文獻、證據證明機構投資⼈人確實有”從眾⾏行為”

可否觀察到散⼾戶的從眾⾏行為?兩者從眾⾏行為的成因是否相同?
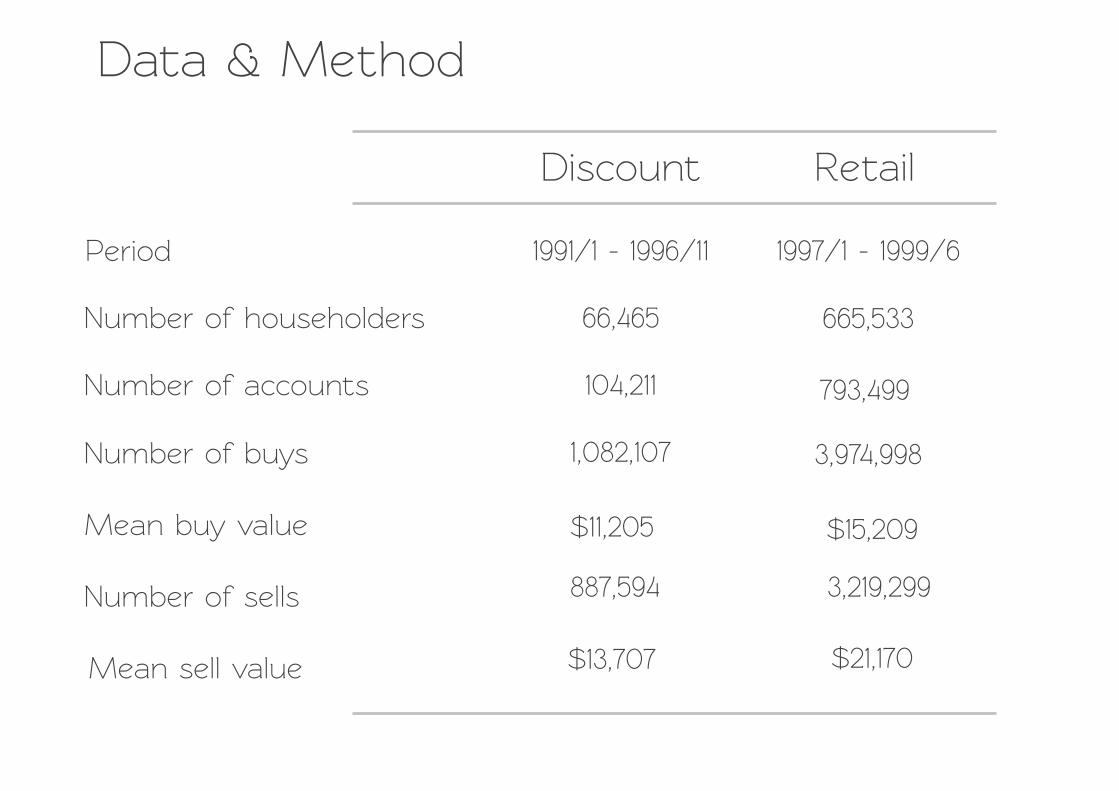
Discount Re+ail
Period
Number of householders
Number of accounts
Number of buys
Mean buy value
Number of sells
Mean sell value
Da+a & Method
1991/1 - 1996/11 1997/1 - 1999/6
66,465 665,533
104,211 793,499
1,082,107 3,974,998
$11,205 $15,209
887,594 3,219,299
$13,707 $21,170
How +o measure the Herding?
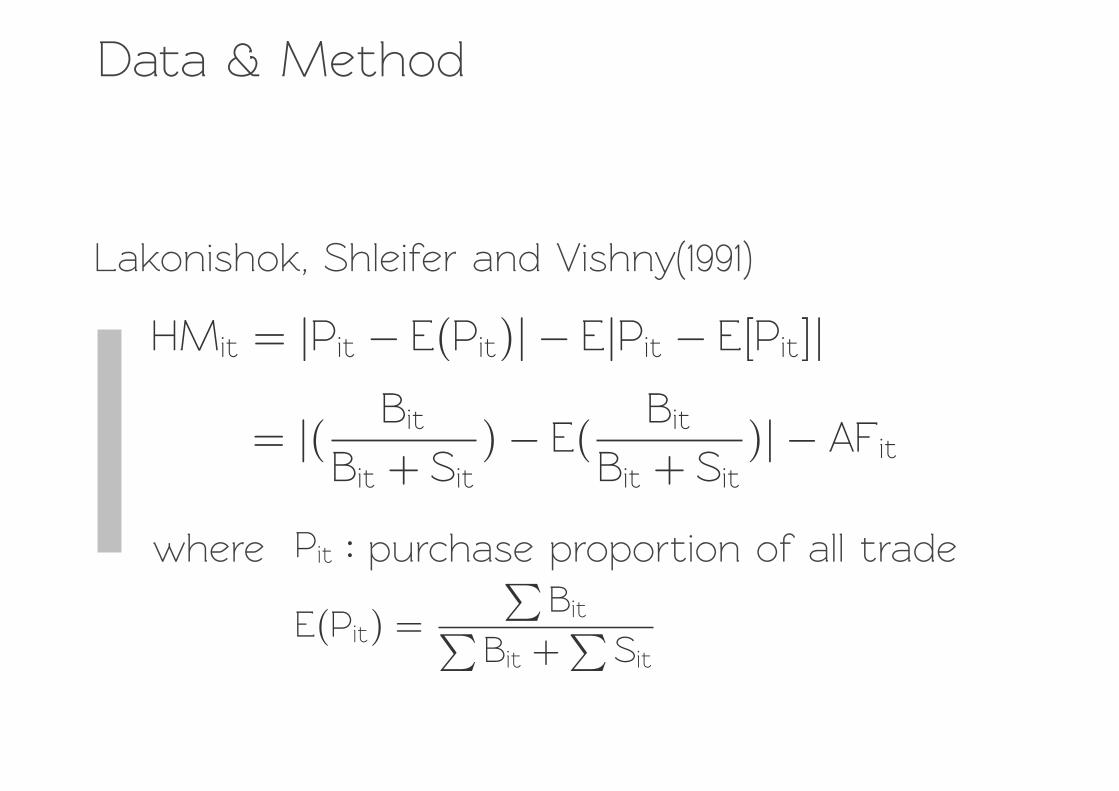
Da+a & Method
Lakonishok, Shleifer and Vishny(1991)
HMit = |Pit � E(Pit)| � E|Pit � E[Pit]|
= |( Bit
Bit + Sit) � E(
Bit
Bit + Sit)| � AFit
where Pit : purchase proportion of all trade
E(Pit) =
�Bit�
Bit +�
Sit
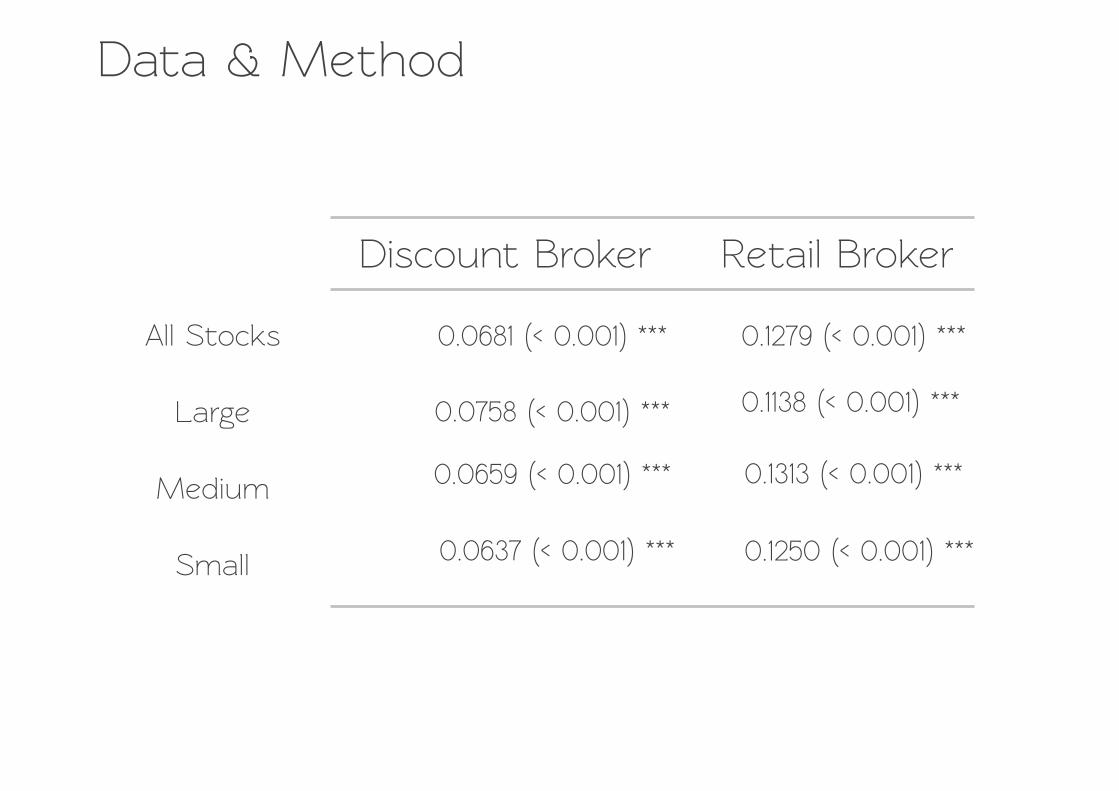
Da+a & Method
Discount Broker Re+ail Broker
All S+ocks
Large
Medium
Small
0.0681 (< 0.001) ***
0.0758 (< 0.001) ***
0.0659 (< 0.001) ***
0.0637 (< 0.001) ***
0.1279 (< 0.001) ***
0.1138 (< 0.001) ***
0.1313 (< 0.001) ***
0.1250 (< 0.001) ***
Common Shift in risk-aversion ?
Con+emporaneously ?
Over Time ?
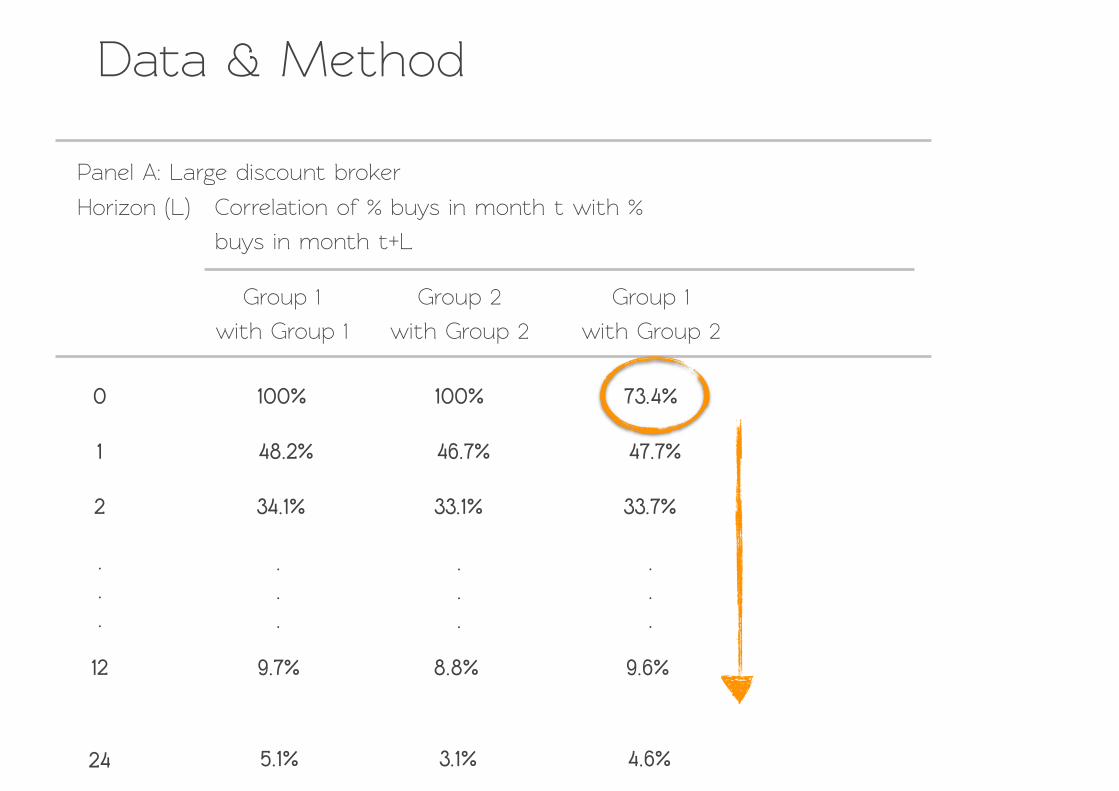
Da+a & Method
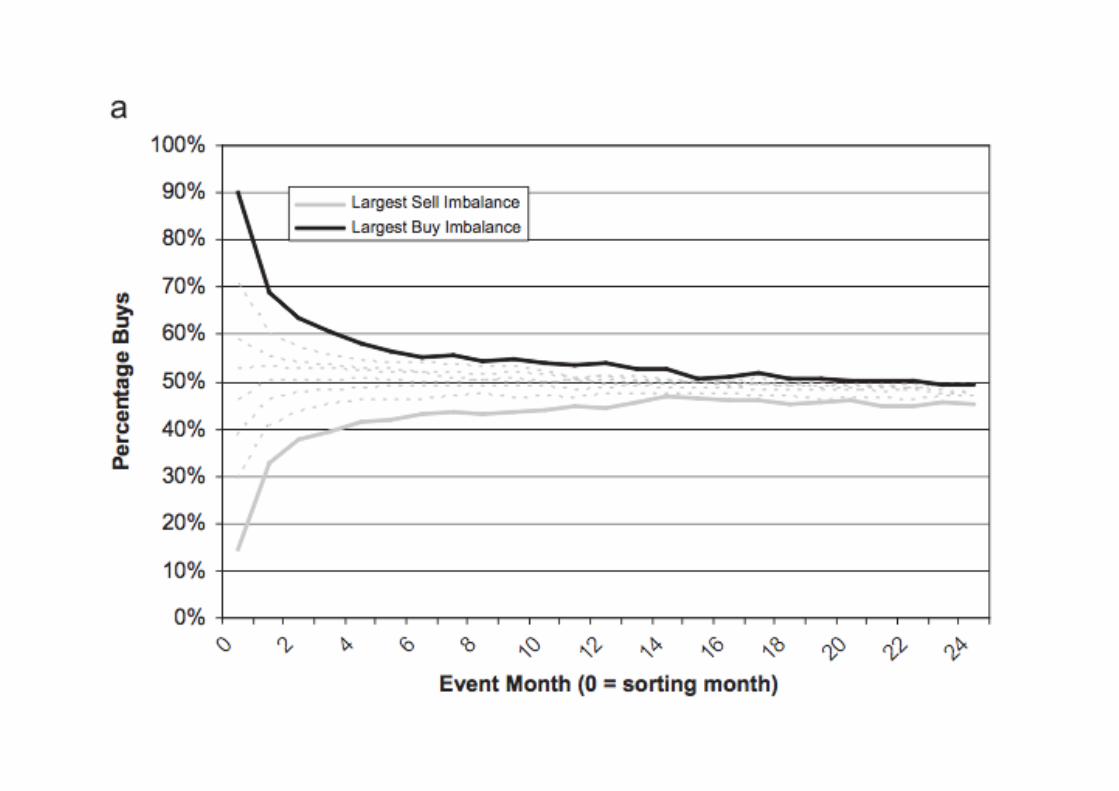
Panel A: Large discount broker
Group 1
with Group 1
Group 2
with Group 2
Horizon (L) Correlation of % buys in month t with %
buys in month t+L
Group 1
with Group 2
0
1
2
.
.
.
12
24
100% 100% 73.4%
48.2% 46.7% 47.7%
34.1% 33.1% 33.7%
9.7% 8.8% 9.6%
5.1% 3.1% 4.6%
.
.
.
.
.
.
.
.
.
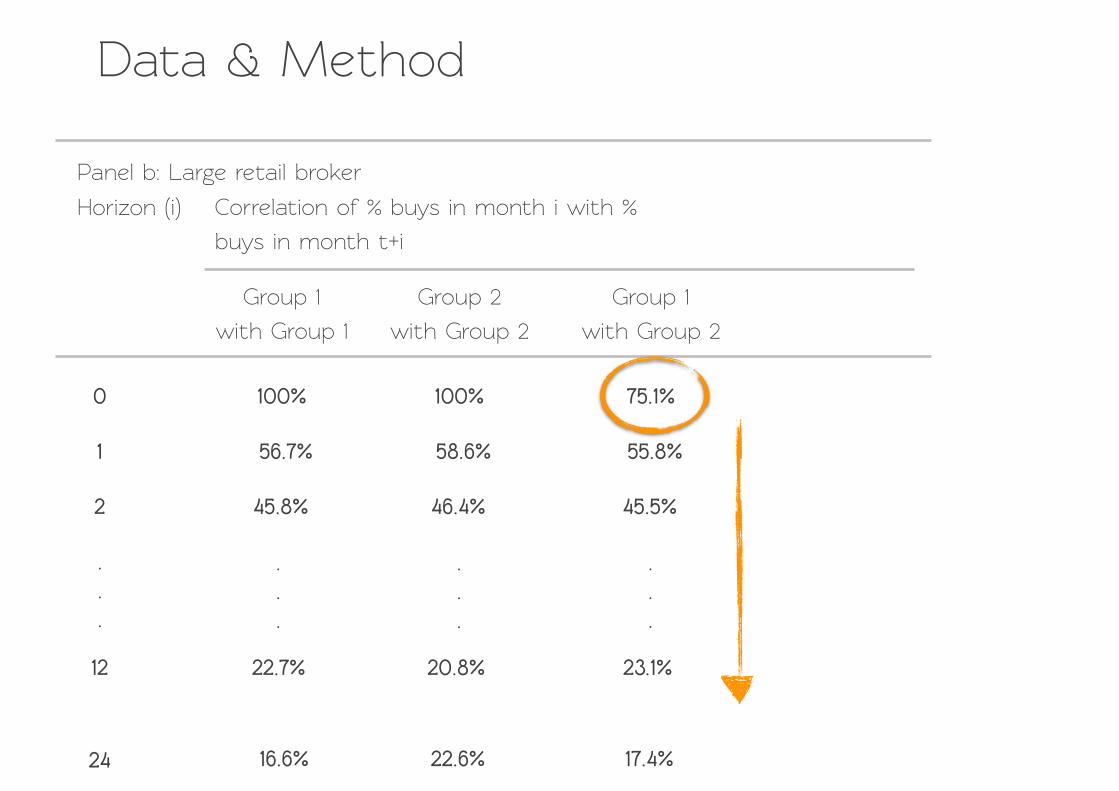
Da+a & Method
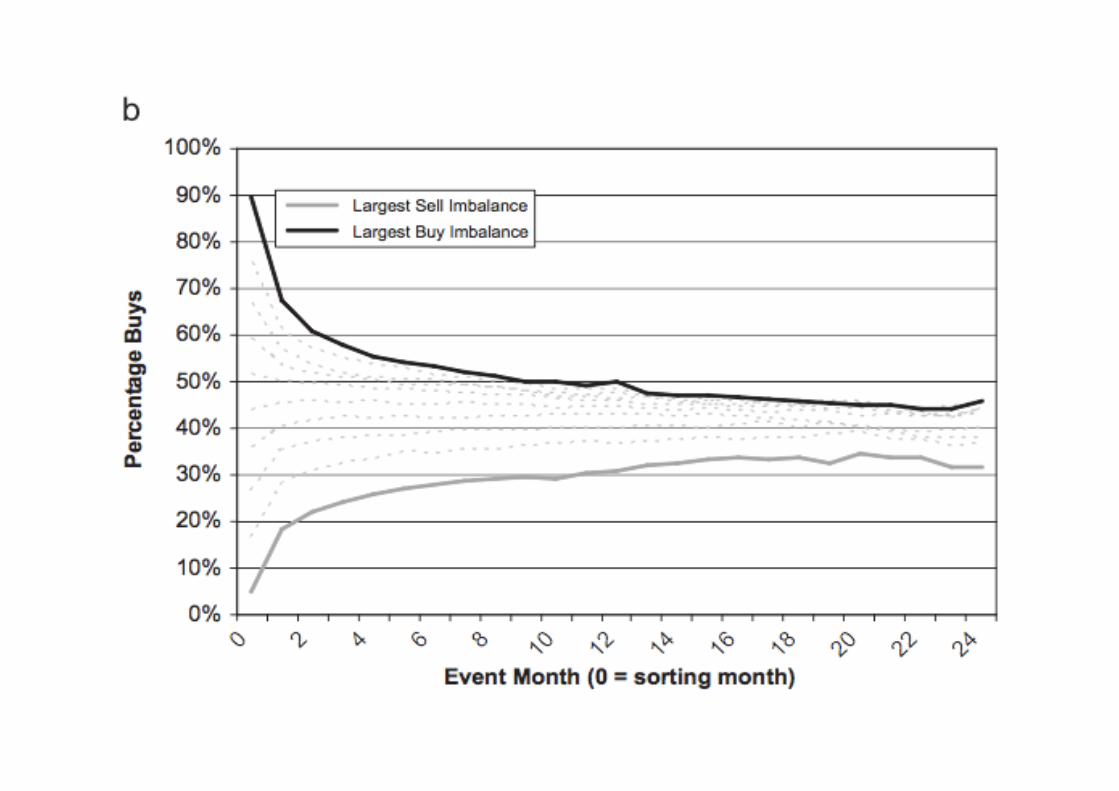
Panel b: Large re+ail broker
Group 1
with Group 1
Group 2
with Group 2
Horizon (i) Correlation of % buys in month i with %
buys in month t+i
Group 1
with Group 2
0
1
2
.
.
.
12
24
100% 100% 75.1%
56.7% 58.6% 55.8%
45.8% 46.4% 45.5%
22.7% 20.8% 23.1%
16.6% 22.6% 17.4%
.
.
.
.
.
.
.
.
.

Institutional Herding ?

1. Principal-agent concerns

2. Information Cascades
3. Rational response +o correla+ed
information

Individuals’ Herding
Unfil+ered da+a = Market orders
+ Limit Orders
1. Limit order driven?
Accounts = +axable accounts
+ +ax-deferred accounts
2. Avoid +ax losing
3. Risk-aversion ?
Use firms’ size as proxy for risk
(Berk, 1995)
Let’s have discussion about
Psychological biases

Represen+ativeness Heuristic
Overweight the impor+ance of past
return when forecasting future’s
Sell winners, hold on+o losing
Disposition Effect
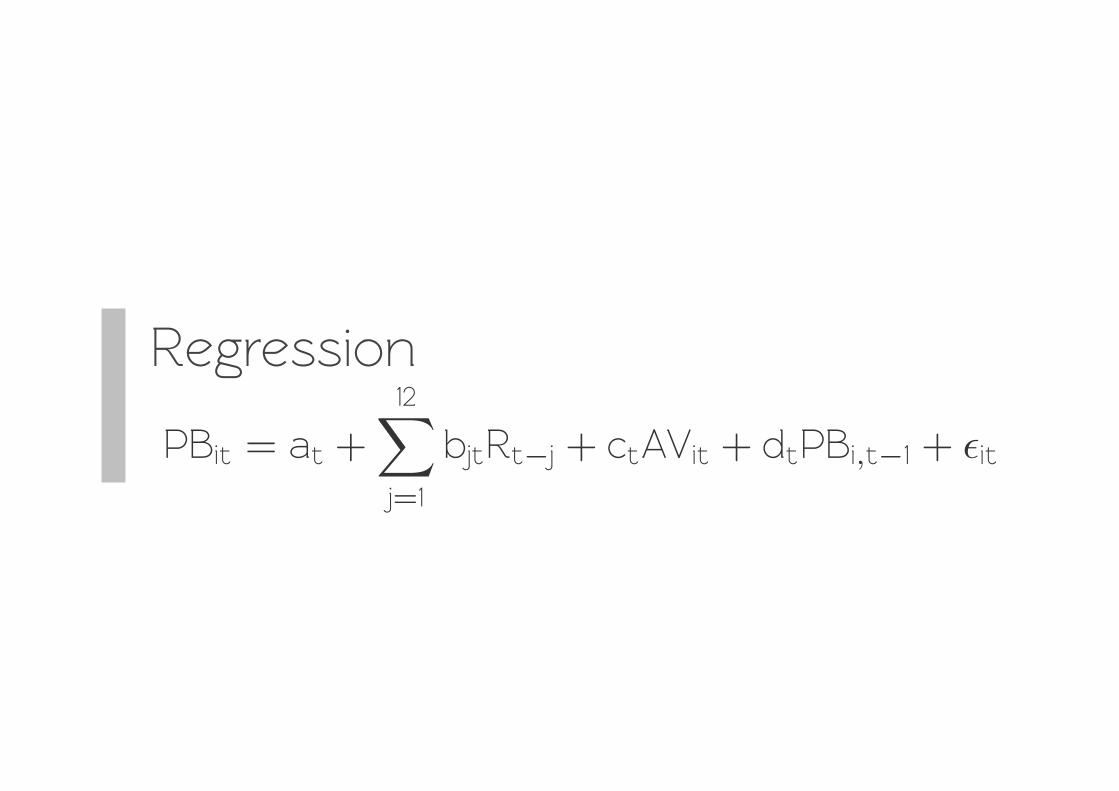
Regression
PBit = at +12�
j=1
bjtRt�j + ctAVit + dtPBi,t�1 + �it

自 我 因 循
Self-herding
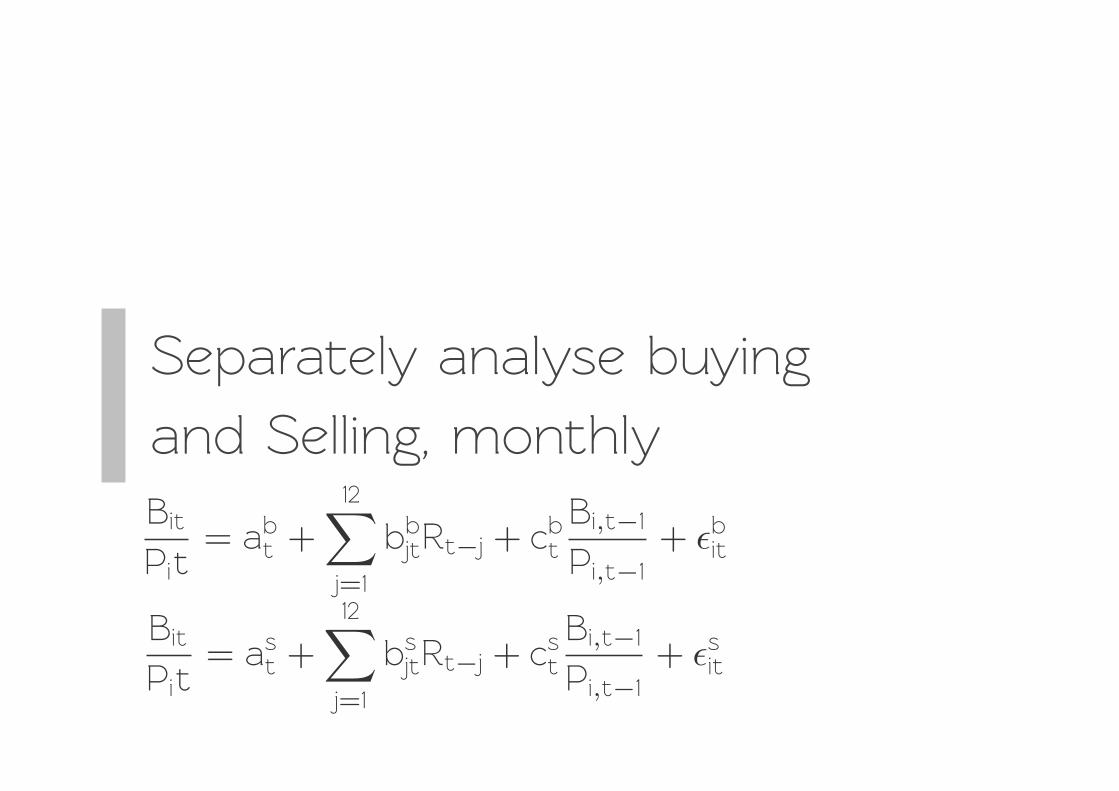
Separa+ely analyse buying
and Selling, monthlyBit
Pit= ab
t +12�
j=1
bbjtRt�j + cbt
Bi,t�1
Pi,t�1+ �bit
Bit
Pit= as
t +12�
j=1
bsjtRt�j + cst
Bi,t�1
Pi,t�1+ �sit
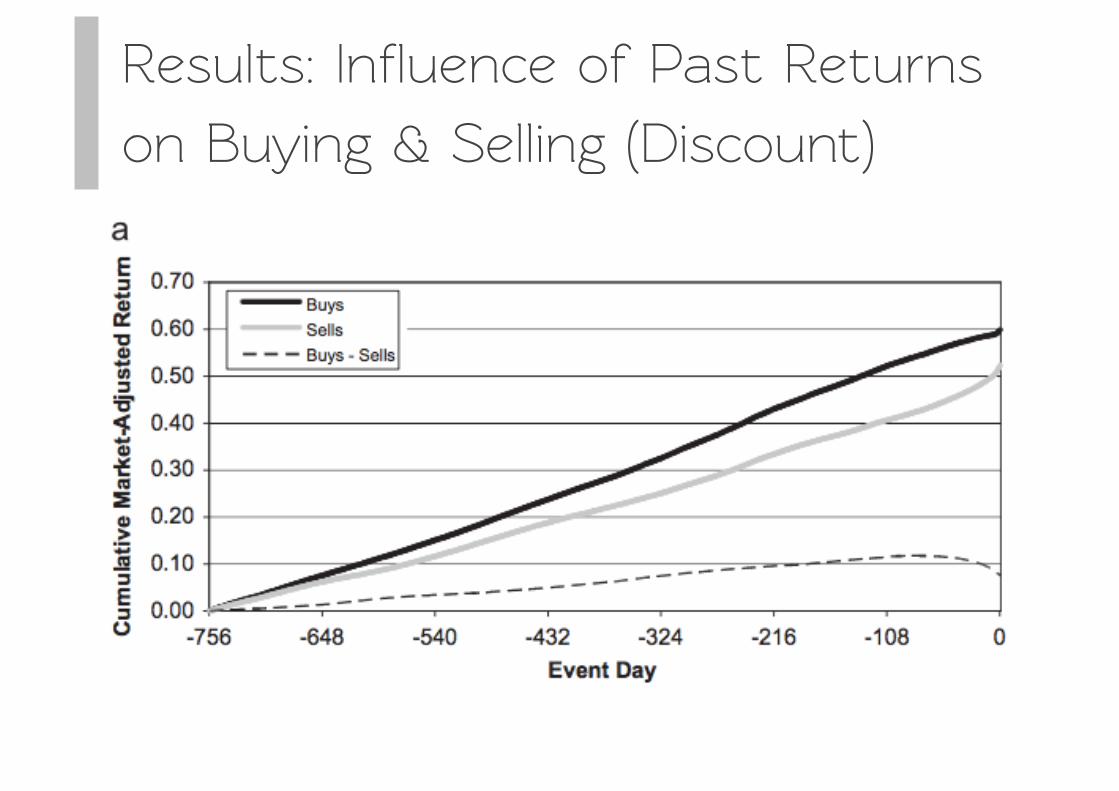
Results: Influence of Past Returns
on Buying & Selling (Discount)
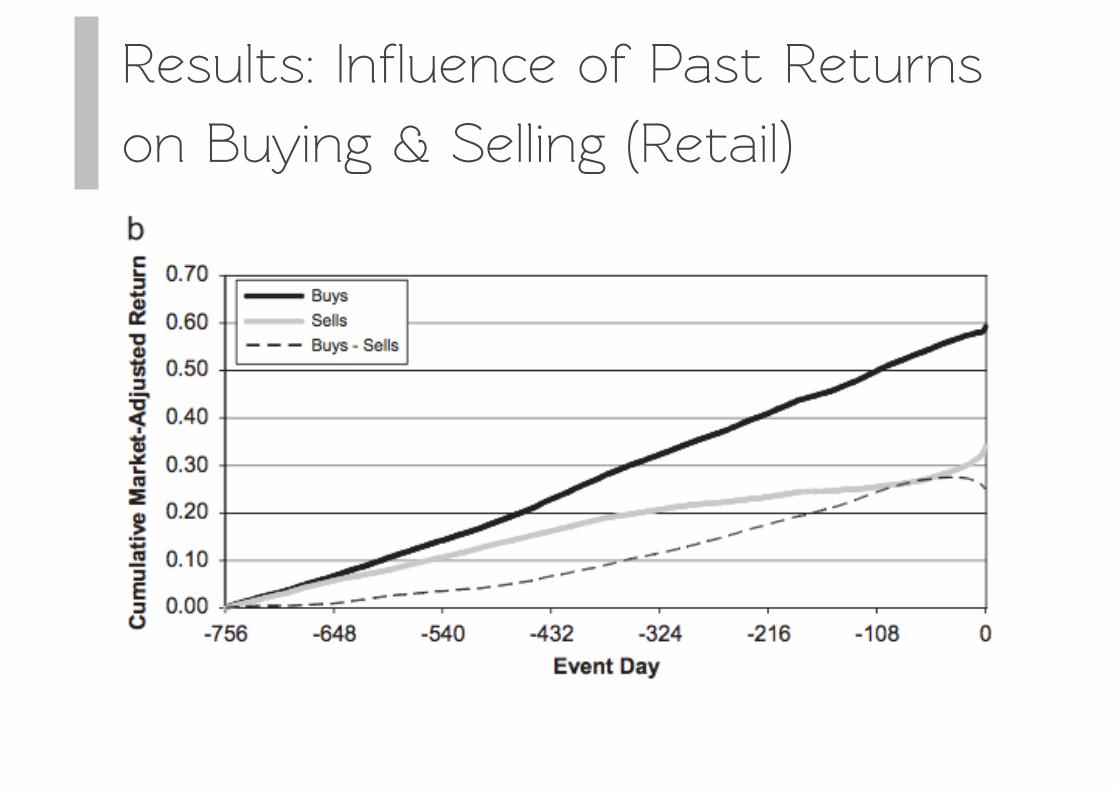
Results: Influence of Past Returns
on Buying & Selling (Re+ail)
The purchase and sale decisions of
individual inves+ors are highly correla+ed.
Summary
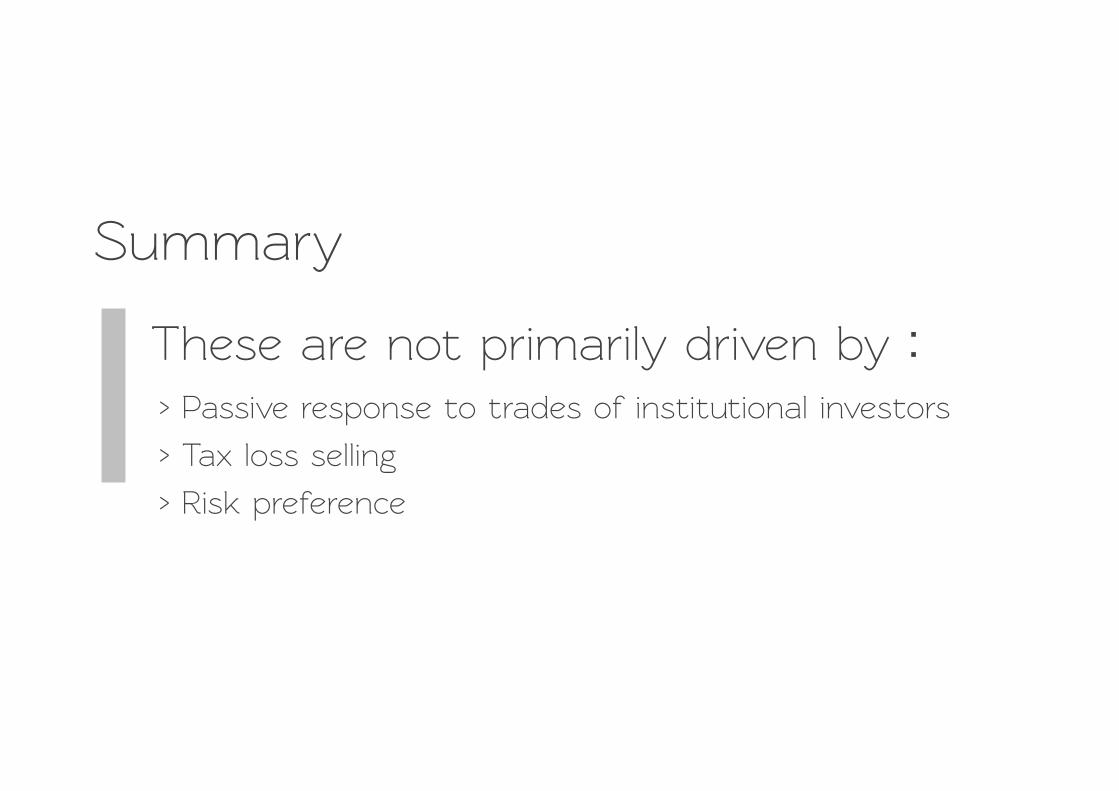
These are not primarily driven by:
Summary
> Passive response +o trades of institutional inves+ors
> Tax loss selling
> Risk preference

Inves+ors buy and sell s+ocks with
strong past returns.
Summary
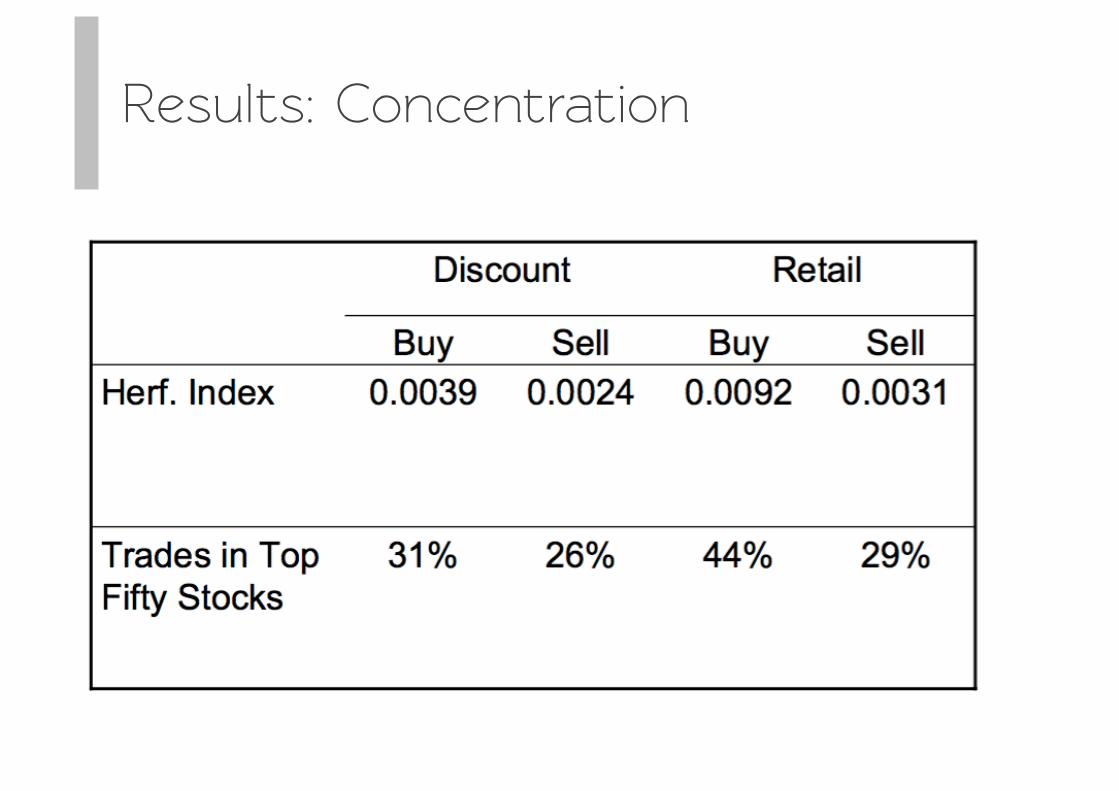
Results: Concentration
Buying is concentra+ed in fewer s+ocks
than selling
Summary
Inves+ors are net buyers of s+ocks with
unusually high trading volume.
Summary
Individual inves+ors, sometimes referred
+o as noise traders, have the po+ential
+o affect asset prices because their
noise is sys+ematic.
Conclusion

Thanks for your at+ention :)