


Languages
Pages
Legal

1
Supporting Information 1
2
Single-step extraction of carotenoids from brown macroalgae using 3
non-ionic surfactants 4
Flávia A. Vieiraa, Ricardo J. R. Guilhermea, Márcia C. Nevesa, Helena Abreub Eva R. 5
O. Rodriguesc, Marcelo Maraschinc, João A. P. Coutinhoa and Sónia P. M. Venturaa* 6
(a) Department of Chemistry, Aveiro Institute of Materials - CICECO, University of Aveiro, Campus 7
Universitário de Santiago, 3810-193 Aveiro, Portugal 8
(b)ALGAplus Ltda, Travessa Alexandre da Conceição 3830-196 Ílhavo, Portugal 9
(c)Plant Morphogenesis and Biochemistry Laboratory, Federal University of Santa Catarina, Plant Science 10
Center, 88040-900, Florianópolis, Santa Catarina, Brazil 11
12
13
14
15
16
17
18
19
20
21
22
23
24
25
26
*Corresponding author 27
Campus Universitário de Santiago, University of Aveiro, Aveiro, Portugal 28
Tel: +351-234-370200; Fax: +351-234-370084; E-mail address: [email protected] 29
30
31

2
Table A1. Identification of each batch of biomass from Sargassum muticum wild 1
harvested in Portugal and used in this work.. 2
Batch reference Harvest date Water content (%)
S1.0315.D 13/01/2015 8.6
S1.4915.D 02/12/2015 6.2
3
4
5
6
7
8
3
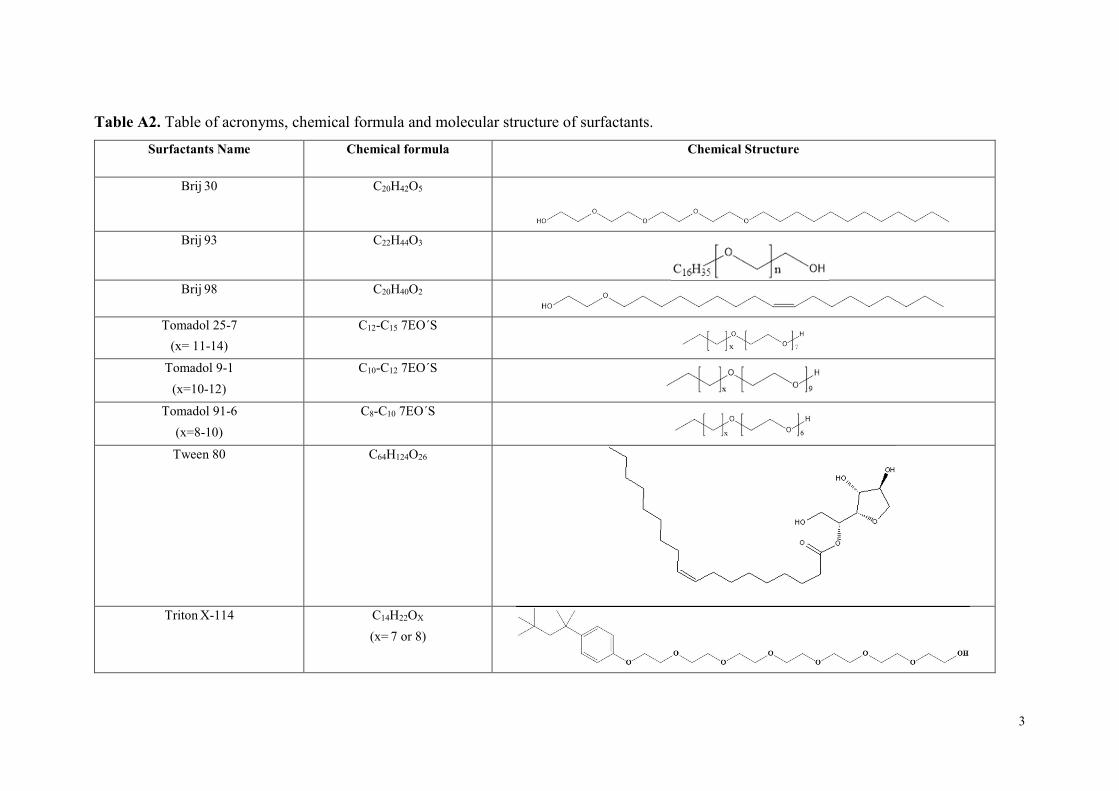
Table A2. Table of acronyms, chemical formula and molecular structure of surfactants.
Surfactants Name Chemical formula Chemical Structure
Brij 30 C20H42O5
Brij 93
C22H44O3
Brij 98 C20H40O2
Tomadol 25-7
(x= 11-14)
C12-C15 7EO´S
Tomadol 9-1
(x=10-12)
C10-C12 7EO´S
Tomadol 91-6
(x=8-10)
C8-C10 7EO´S
Tween 80 C64H124O26
Triton X-114
C14H22OX
(x= 7 or 8)
4
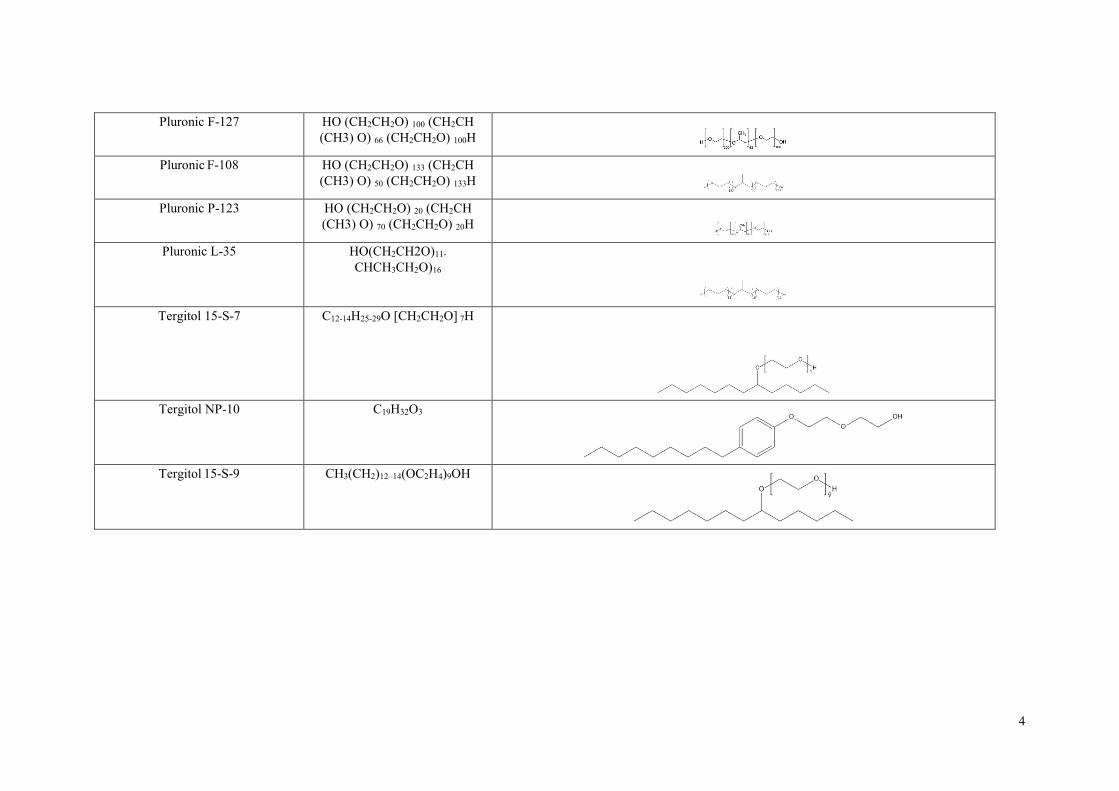
Pluronic F-127
HO (CH2CH2O) 100 (CH2CH (CH3) O) 66 (CH2CH2O) 100H
Pluronic F-108
HO (CH2CH2O) 133 (CH2CH (CH3) O) 50 (CH2CH2O) 133H
Pluronic P-123
HO (CH2CH2O) 20 (CH2CH (CH3) O) 70 (CH2CH2O) 20H
Pluronic L-35
HO(CH2CH2O)11-
CHCH3CH2O)16
Tergitol 15-S-7
C12-14H25-29O [CH2CH2O] 7H
Tergitol NP-10
C19H32O3
Tergitol 15-S-9
CH3(CH2)12–14(OC2H4)9OH
5
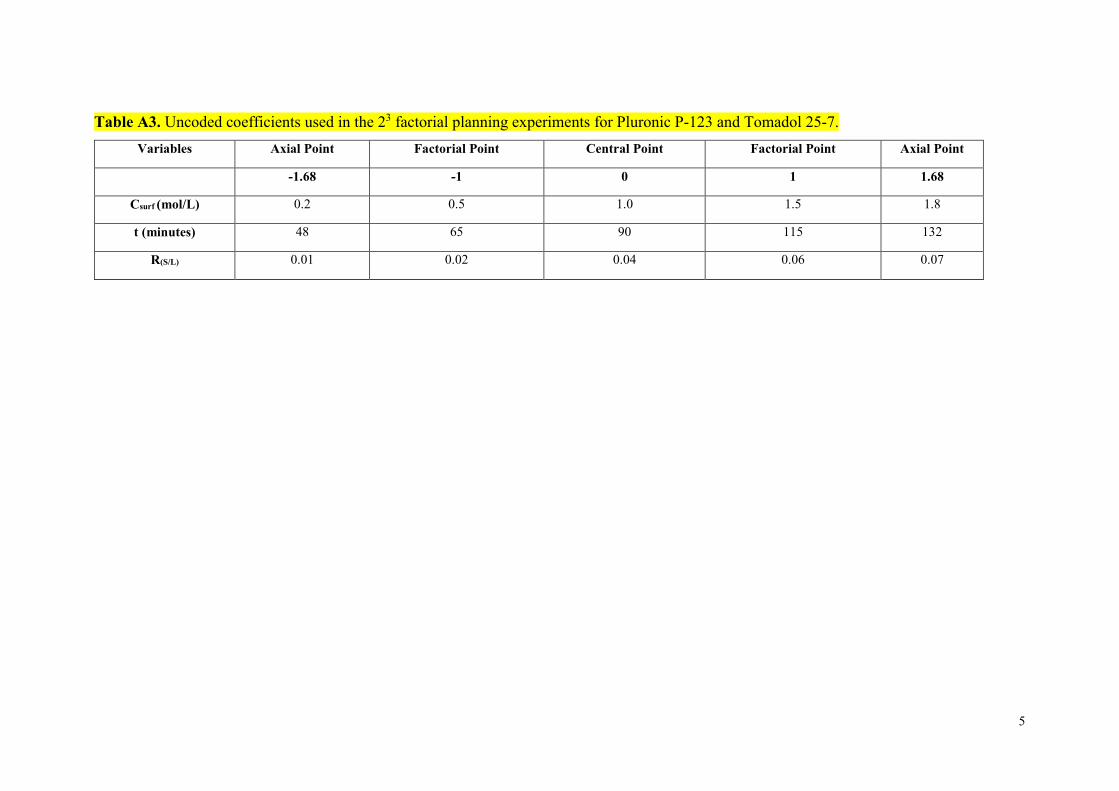
Table A3. Uncoded coefficients used in the 23 factorial planning experiments for Pluronic P-123 and Tomadol 25-7.
Variables Axial Point Factorial Point Central Point Factorial Point Axial Point
-1.68 -1 0 1 1.68
Csurf (mol/L) 0.2 0.5 1.0 1.5 1.8
t (minutes) 48 65 90 115 132
R(S/L) 0.01 0.02 0.04 0.06 0.07
6
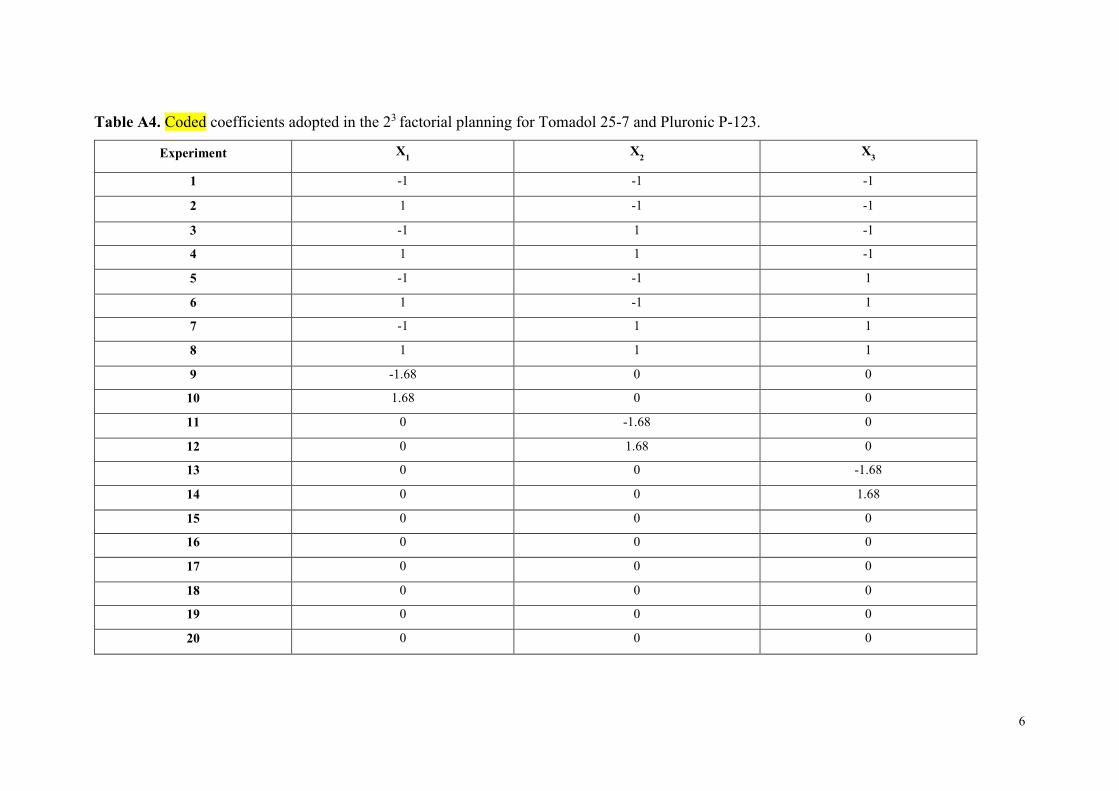
Table A4. Coded coefficients adopted in the 23 factorial planning for Tomadol 25-7 and Pluronic P-123.
Experiment X1 X
2 X
3
1 -1 -1 -1
2 1 -1 -1
3 -1 1 -1
4 1 1 -1
5 -1 -1 1
6 1 -1 1
7 -1 1 1
8 1 1 1
9 -1.68 0 0
10 1.68 0 0
11 0 -1.68 0
12 0 1.68 0
13 0 0 -1.68
14 0 0 1.68
15 0 0 0
16 0 0 0
17 0 0 0
18 0 0 0
19 0 0 0
20 0 0 0
7
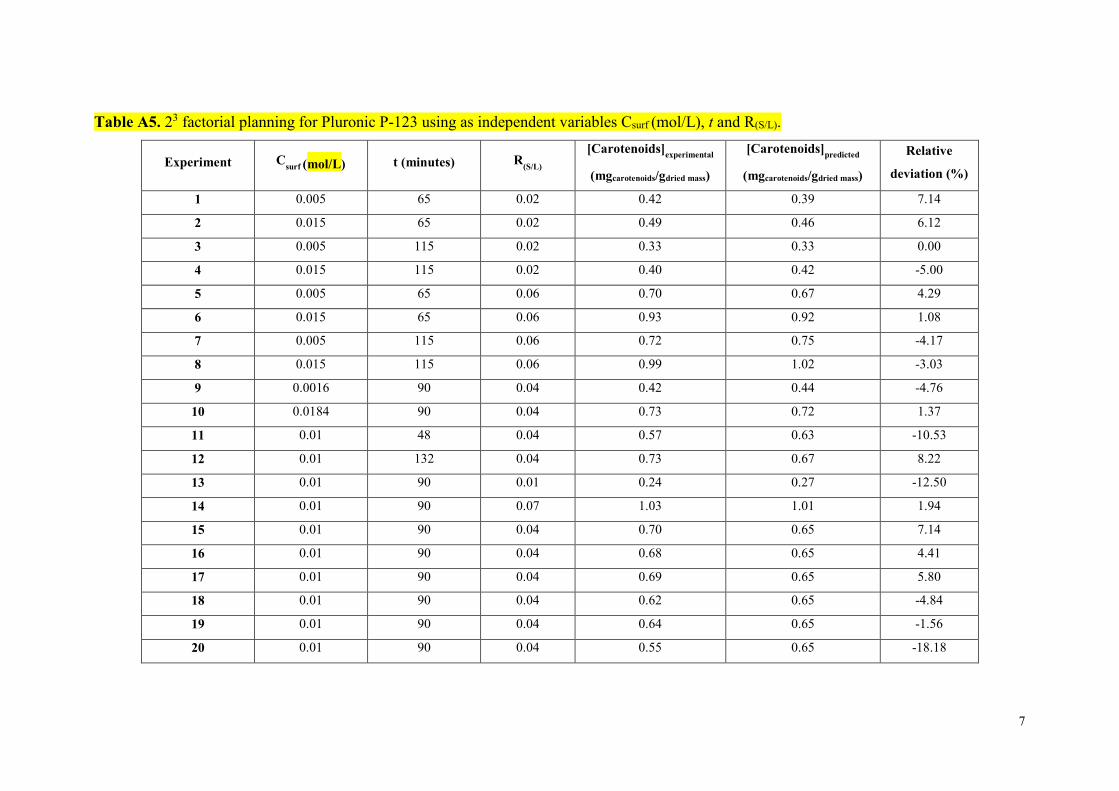
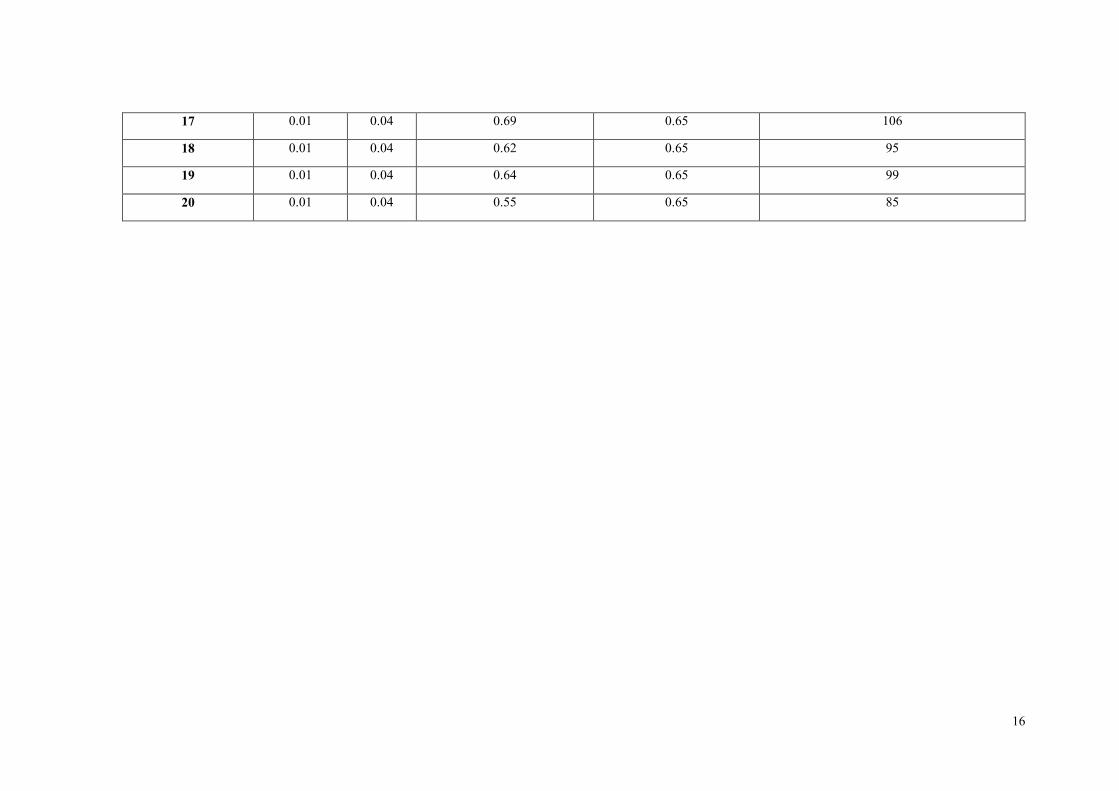
Table A5. 23 factorial planning for Pluronic P-123 using as independent variables Csurf (mol/L), t and R(S/L).
Experiment Csurf (mol/L) t (minutes) R
(S/L)
[Carotenoids]experimental
(mgcarotenoids/gdried mass)
[Carotenoids]predicted
(mgcarotenoids/gdried mass)
Relative
deviation (%)
1 0.005 65 0.02 0.42 0.39 7.14
2 0.015 65 0.02 0.49 0.46 6.12
3 0.005 115 0.02 0.33 0.33 0.00
4 0.015 115 0.02 0.40 0.42 -5.00
5 0.005 65 0.06 0.70 0.67 4.29
6 0.015 65 0.06 0.93 0.92 1.08
7 0.005 115 0.06 0.72 0.75 -4.17
8 0.015 115 0.06 0.99 1.02 -3.03
9 0.0016 90 0.04 0.42 0.44 -4.76
10 0.0184 90 0.04 0.73 0.72 1.37
11 0.01 48 0.04 0.57 0.63 -10.53
12 0.01 132 0.04 0.73 0.67 8.22
13 0.01 90 0.01 0.24 0.27 -12.50
14 0.01 90 0.07 1.03 1.01 1.94
15 0.01 90 0.04 0.70 0.65 7.14
16 0.01 90 0.04 0.68 0.65 4.41
17 0.01 90 0.04 0.69 0.65 5.80
18 0.01 90 0.04 0.62 0.65 -4.84
19 0.01 90 0.04 0.64 0.65 -1.56
20 0.01 90 0.04 0.55 0.65 -18.18
8
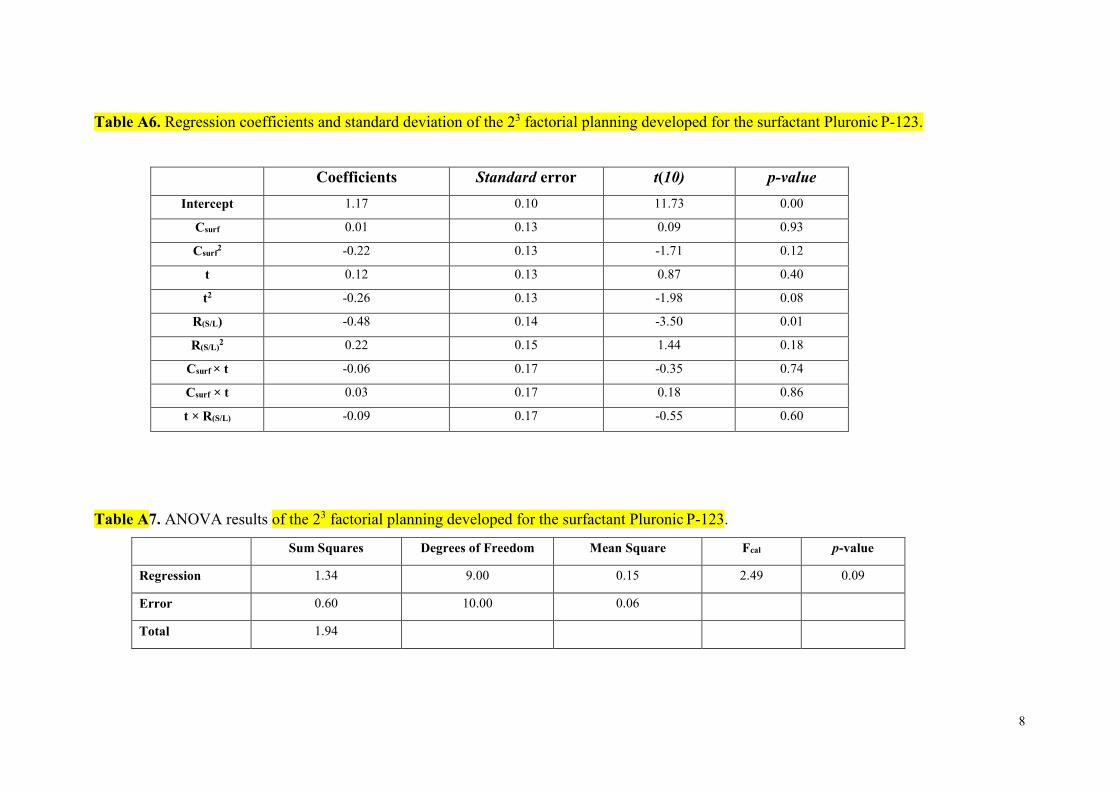
Table A6. Regression coefficients and standard deviation of the 23 factorial planning developed for the surfactant Pluronic P-123.
Coefficients Standard error t(10) p-value
Intercept 1.17 0.10 11.73 0.00
Csurf 0.01 0.13 0.09 0.93
Csurf2 -0.22 0.13 -1.71 0.12
t 0.12 0.13 0.87 0.40
t2 -0.26 0.13 -1.98 0.08
R(S/L) -0.48 0.14 -3.50 0.01
R(S/L)2 0.22 0.15 1.44 0.18
Csurf × t -0.06 0.17 -0.35 0.74
Csurf × t 0.03 0.17 0.18 0.86
t × R(S/L) -0.09 0.17 -0.55 0.60
Table A7. ANOVA results of the 23 factorial planning developed for the surfactant Pluronic P-123.
Sum Squares Degrees of Freedom Mean Square Fcal p-value
Regression 1.34 9.00 0.15 2.49 0.09
Error 0.60 10.00 0.06
Total 1.94
9
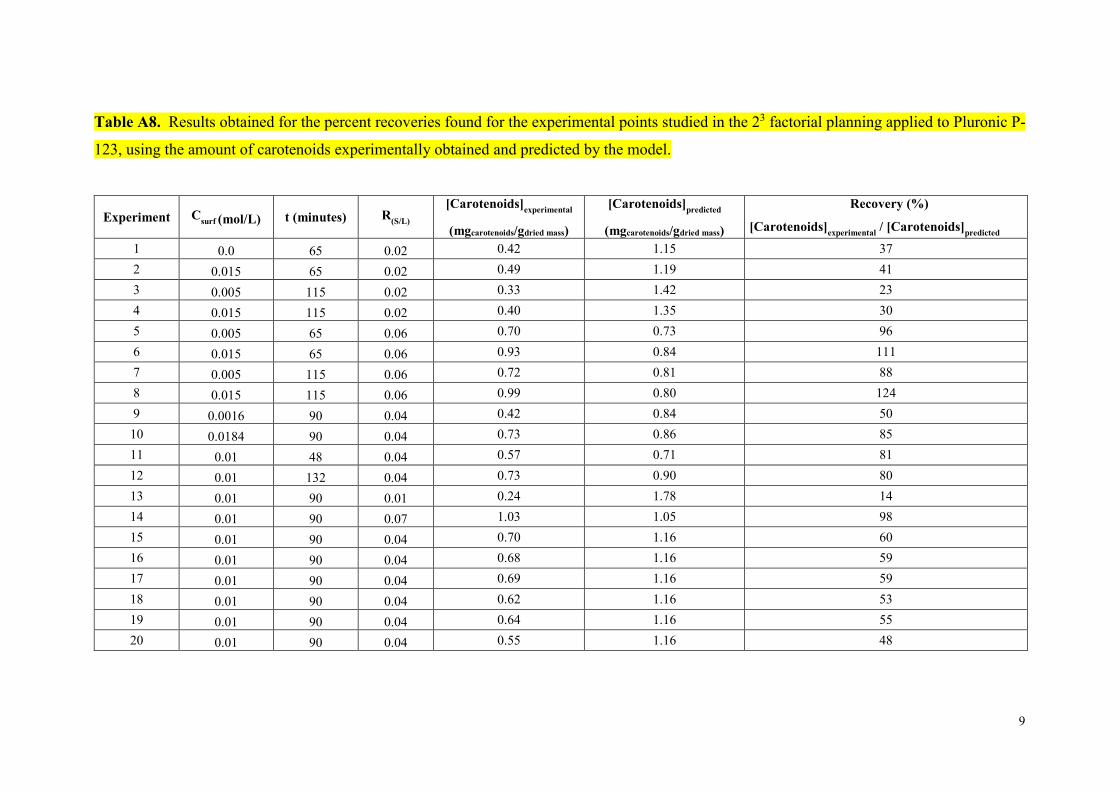
Table A8. Results obtained for the percent recoveries found for the experimental points studied in the 23 factorial planning applied to Pluronic P-
123, using the amount of carotenoids experimentally obtained and predicted by the model.
Experiment Csurf (mol/L) t (minutes) R
(S/L)
[Carotenoids]experimental
(mgcarotenoids/gdried mass)
[Carotenoids]predicted
(mgcarotenoids/gdried mass)
Recovery (%)
[Carotenoids]experimental
/ [Carotenoids]predicted
1 0.0 65 0.02 0.42 1.15 37
2 0.015 65 0.02 0.49 1.19 41
3 0.005 115 0.02 0.33 1.42 23
4 0.015 115 0.02 0.40 1.35 30
5 0.005 65 0.06 0.70 0.73 96
6 0.015 65 0.06 0.93 0.84 111
7 0.005 115 0.06 0.72 0.81 88
8 0.015 115 0.06 0.99 0.80 124
9 0.0016 90 0.04 0.42 0.84 50
10 0.0184 90 0.04 0.73 0.86 85
11 0.01 48 0.04 0.57 0.71 81
12 0.01 132 0.04 0.73 0.90 80
13 0.01 90 0.01 0.24 1.78 14
14 0.01 90 0.07 1.03 1.05 98
15 0.01 90 0.04 0.70 1.16 60
16 0.01 90 0.04 0.68 1.16 59
17 0.01 90 0.04 0.69 1.16 59
18 0.01 90 0.04 0.62 1.16 53
19 0.01 90 0.04 0.64 1.16 55
20 0.01 90 0.04 0.55 1.16 48
10
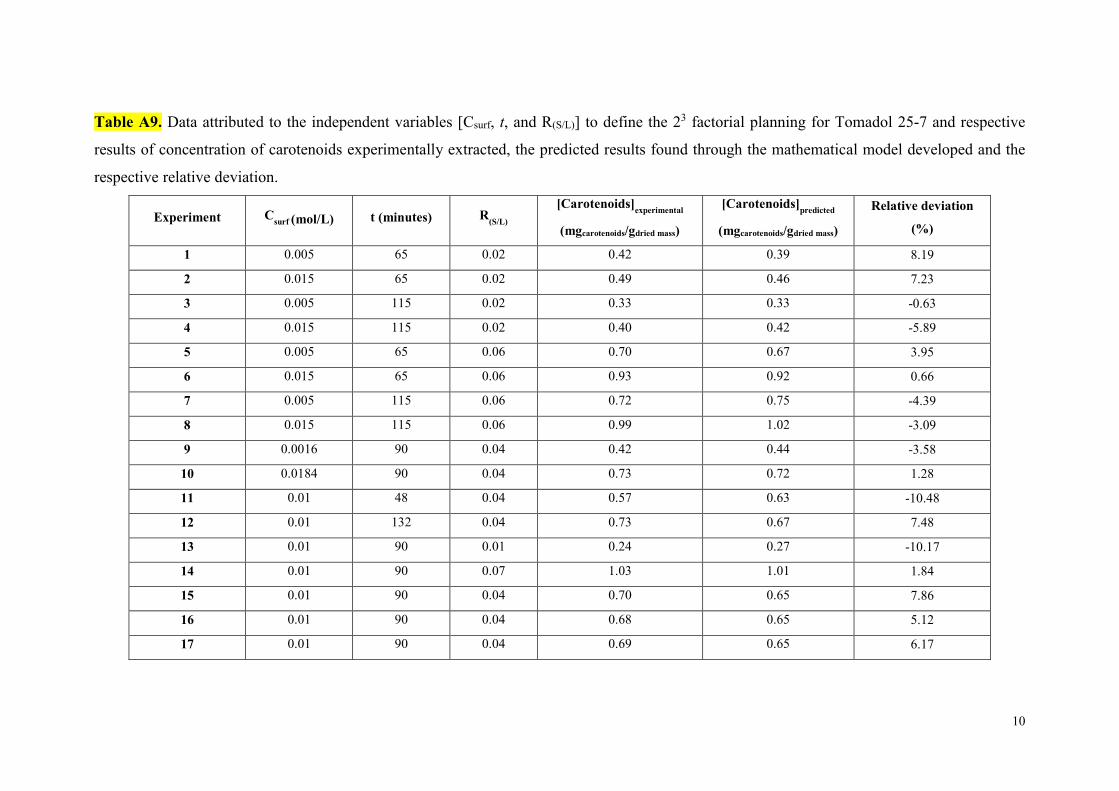
Table A9. Data attributed to the independent variables [Csurf, t, and R(S/L)] to define the 23 factorial planning for Tomadol 25-7 and respective
results of concentration of carotenoids experimentally extracted, the predicted results found through the mathematical model developed and the
respective relative deviation.
Experiment Csurf (mol/L) t (minutes) R
(S/L)
[Carotenoids]experimental
(mgcarotenoids/gdried mass)
[Carotenoids]predicted
(mgcarotenoids/gdried mass)
Relative deviation
(%)
1 0.005 65 0.02 0.42 0.39 8.19
2 0.015 65 0.02 0.49 0.46 7.23
3 0.005 115 0.02 0.33 0.33 -0.63
4 0.015 115 0.02 0.40 0.42 -5.89
5 0.005 65 0.06 0.70 0.67 3.95
6 0.015 65 0.06 0.93 0.92 0.66
7 0.005 115 0.06 0.72 0.75 -4.39
8 0.015 115 0.06 0.99 1.02 -3.09
9 0.0016 90 0.04 0.42 0.44 -3.58
10 0.0184 90 0.04 0.73 0.72 1.28
11 0.01 48 0.04 0.57 0.63 -10.48
12 0.01 132 0.04 0.73 0.67 7.48
13 0.01 90 0.01 0.24 0.27 -10.17
14 0.01 90 0.07 1.03 1.01 1.84
15 0.01 90 0.04 0.70 0.65 7.86
16 0.01 90 0.04 0.68 0.65 5.12
17 0.01 90 0.04 0.69 0.65 6.17

11
18 0.01 90 0.04 0.62 0.65 -4.89
19 0.01 90 0.04 0.64 0.65 -0.98
20 0.01 90 0.04 0.55 0.65 -17.27
Table A10. Regression coefficients of the predicted second-order polynomial model applied for the carotenoids extraction obtained from the RSM
design using Tomadol 25-7 aqueous solutions.
Coefficients Standard error t(10) p-value
intercept 0.65 0.02 29.14 0.00
Csurf 0.17 0.03 5.73 0.00
Csurf 2 -0.05 0.03 -1.72 0.12
t 0.02 0.03 0.78 0.45
t2 0.00 0.03 0.09 0.93
R(S/L) 0.44 0.03 14.89 0.00
R(S/L)2 -0.01 0.03
-0.30 0.77
Csurf × t 0.01 0.04 0.30 0.77
Csurf × R(S/L) 0.09 0.04 2.31 0.04
t × R(S/L) 0.07 0.04 1.74 0.11
12
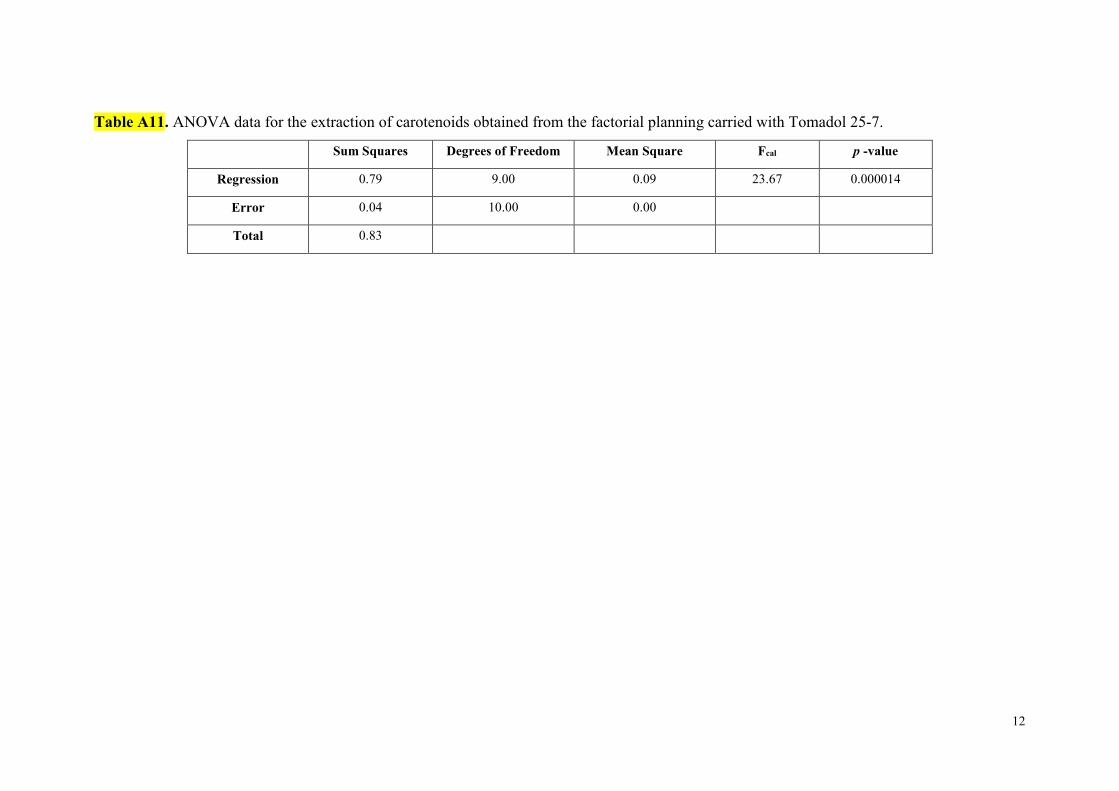
Table A11. ANOVA data for the extraction of carotenoids obtained from the factorial planning carried with Tomadol 25-7.
Sum Squares Degrees of Freedom Mean Square Fcal p -value
Regression 0.79 9.00 0.09 23.67 0.000014
Error 0.04 10.00 0.00
Total 0.83
13
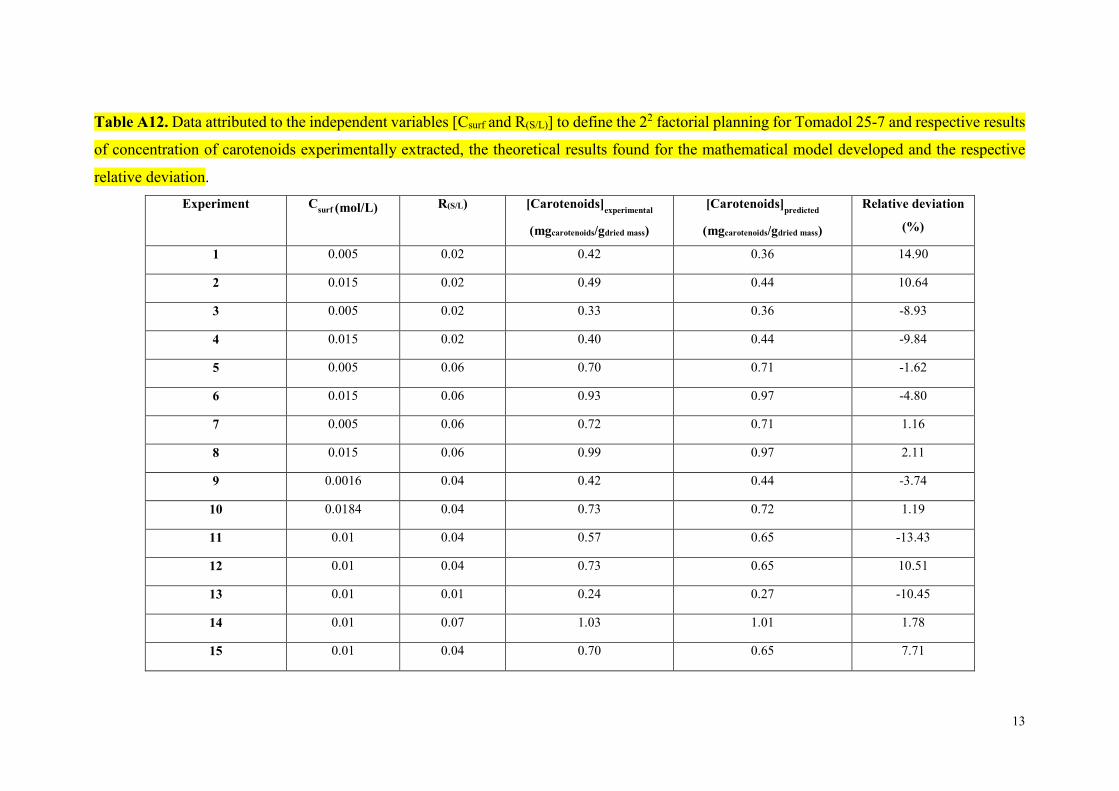
Table A12. Data attributed to the independent variables [Csurf and R(S/L)] to define the 22 factorial planning for Tomadol 25-7 and respective results
of concentration of carotenoids experimentally extracted, the theoretical results found for the mathematical model developed and the respective
relative deviation.
Experiment Csurf (mol/L) R(S/L) [Carotenoids]
experimental
(mgcarotenoids/gdried mass)
[Carotenoids]predicted
(mgcarotenoids/gdried mass)
Relative deviation
(%)
1 0.005 0.02 0.42 0.36 14.90
2 0.015 0.02 0.49 0.44 10.64
3 0.005 0.02 0.33 0.36 -8.93
4 0.015 0.02 0.40 0.44 -9.84
5 0.005 0.06 0.70 0.71 -1.62
6 0.015 0.06 0.93 0.97 -4.80
7 0.005 0.06 0.72 0.71 1.16
8 0.015 0.06 0.99 0.97 2.11
9 0.0016 0.04 0.42 0.44 -3.74
10 0.0184 0.04 0.73 0.72 1.19
11 0.01 0.04 0.57 0.65 -13.43
12 0.01 0.04 0.73 0.65 10.51
13 0.01 0.01 0.24 0.27 -10.45
14 0.01 0.07 1.03 1.01 1.78
15 0.01 0.04 0.70 0.65 7.71
14
16 0.01 0.04 0.68 0.65 4.97
17 0.01 0.04 0.69 0.65 6.02
18 0.01 0.04 0.62 0.65 -5.06
19 0.01 0.04 0.64 0.65 -1.14
20 0.01 0.04 0.55 0.65 -17.46
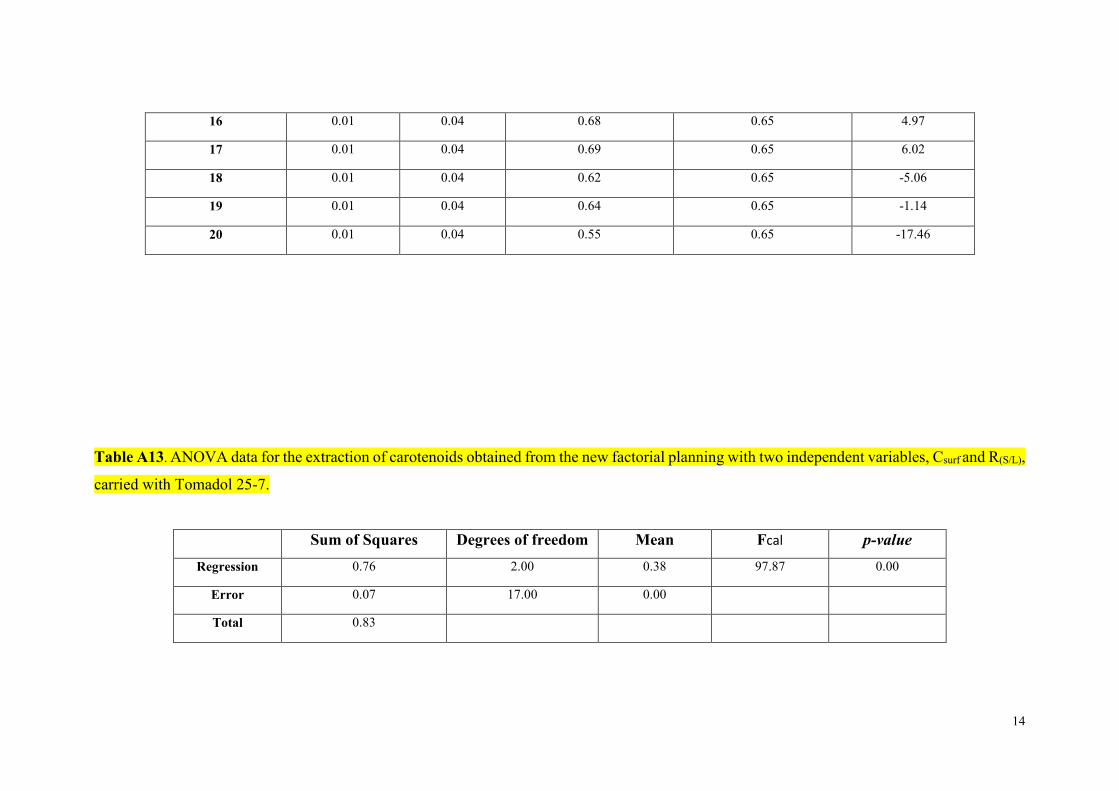
Table A13. ANOVA data for the extraction of carotenoids obtained from the new factorial planning with two independent variables, Csurf and R(S/L),
carried with Tomadol 25-7.
Sum of Squares Degrees of freedom Mean Fcal p-value
Regression 0.76 2.00 0.38 97.87 0.00
Error 0.07 17.00 0.00
Total 0.83
15
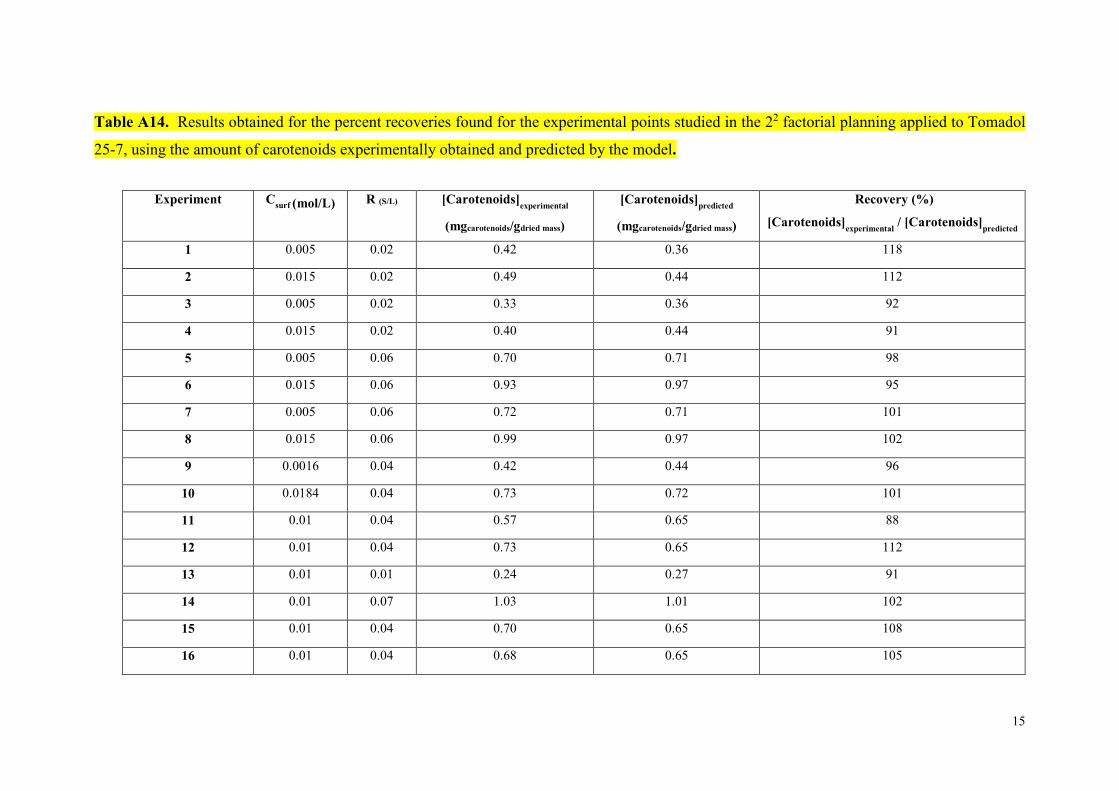
Table A14. Results obtained for the percent recoveries found for the experimental points studied in the 22 factorial planning applied to Tomadol
25-7, using the amount of carotenoids experimentally obtained and predicted by the model.
Experiment Csurf (mol/L) R (S/L) [Carotenoids]
experimental
(mgcarotenoids/gdried mass)
[Carotenoids]predicted
(mgcarotenoids/gdried mass)
Recovery (%)
[Carotenoids]experimental
/ [Carotenoids]predicted
1 0.005 0.02 0.42 0.36 118
2 0.015 0.02 0.49 0.44 112
3 0.005 0.02 0.33 0.36 92
4 0.015 0.02 0.40 0.44 91
5 0.005 0.06 0.70 0.71 98
6 0.015 0.06 0.93 0.97 95
7 0.005 0.06 0.72 0.71 101
8 0.015 0.06 0.99 0.97 102
9 0.0016 0.04 0.42 0.44 96
10 0.0184 0.04 0.73 0.72 101
11 0.01 0.04 0.57 0.65 88
12 0.01 0.04 0.73 0.65 112
13 0.01 0.01 0.24 0.27 91
14 0.01 0.07 1.03 1.01 102
15 0.01 0.04 0.70 0.65 108
16 0.01 0.04 0.68 0.65 105
16
17 0.01 0.04 0.69 0.65 106
18 0.01 0.04 0.62 0.65 95
19 0.01 0.04 0.64 0.65 99
20 0.01 0.04 0.55 0.65 85

17
Equation A1. Polynomial equation obtained for the 23 factorial planning carried for 1
Pluronic P-123, with x, y and z representing Csurf (mol/L), t and R(S/L), respectively. 2
3
4
Equation A2. Polynomial equation obtained for the 23 factorial planning carried for 5
Tomadol 25-7, with x, y and z representing Csurf (mol/L), t and R(S/L), respectively. 6
7
8
Equation A3. Polynomial equation obtained for the 22 factorial planning carried for 9
Tomadol 25-7, with X and Y representing Csurf (mol/L) and R(S/L), respectively. 10
11
12
13
14
⌈�����������⌉ = 1.17 + 0.01����� + 0.22�����2 + 0.12 � − 0.26�2 + 0.48�(� �⁄ ) + 0.22�(� �⁄ )
2
+ 0.6����� × � + 0.03 ����� × �(� �⁄ ) + 0.09� × �(� �⁄ )
⌈�����������⌉ = 0.65 + 0.17����� − 0.05 �����2 + 0.02� + 0.44 �(� �⁄ ) + 0.01�(� �⁄ )
2 + 0.01 ���� � × �
+ 0.09����� × �(� �⁄ ) + 0.07 � × �(� �⁄ )
⌈�����������⌉ = 0.65 + 0.17����� − 0.05�����2 + 0.44�(� �⁄ ) − 0.01�(� �⁄ )
2 + 0.09����� × �(� �⁄ )

18
1
19
1
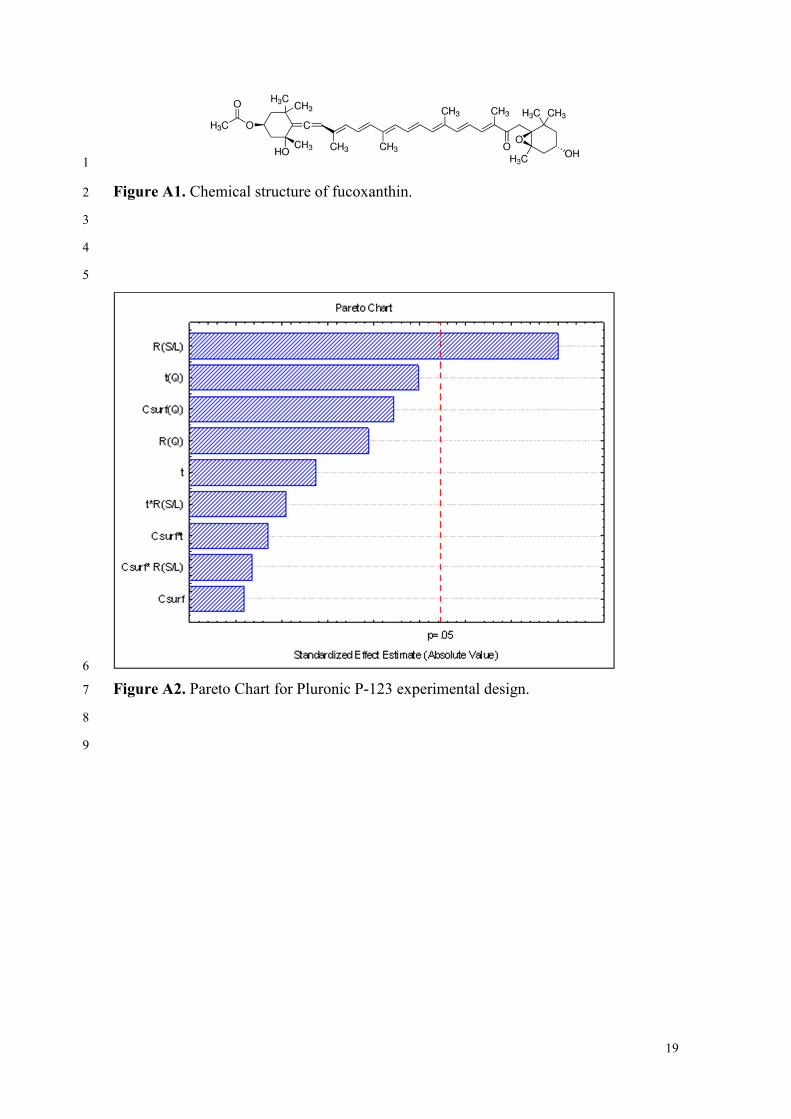
Figure A1. Chemical structure of fucoxanthin. 2
3
4
5
6
Figure A2. Pareto Chart for Pluronic P-123 experimental design. 7
8
9

20
0.4 0.6 0.8 1.0 1.2 1.4 1.6 1.8 2.0 2.2 2.4 2.6
Observed Values
0.6
0.8
1.0
1.2
1.4
1.6
1.8
2.0
Pre
dic
ted
Valu
es
1
2
Figure A3. Graphical representation of the amount of carotenoids experimentally 3
extracted and predicted by the model for Pluronic P-123. 4
21
1
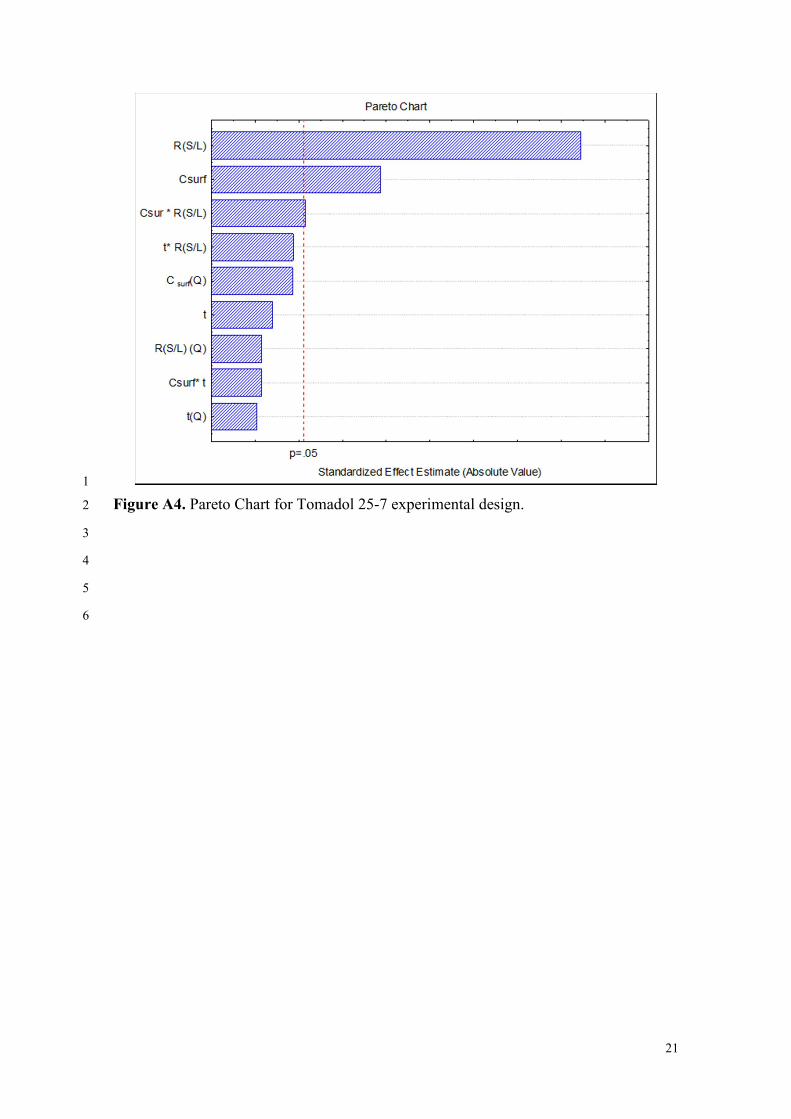
Figure A4. Pareto Chart for Tomadol 25-7 experimental design. 2
3
4
5
6

22
0.1 0.2 0.3 0.4 0.5 0.6 0.7 0.8 0.9 1.0 1.1 1.2
Observed Values
0.1
0.2
0.3
0.4
0.5
0.6
0.7
0.8
0.9
1.0
1.1
Pre
dic
ted
Va
lue
s
1
Figure A5. Graphical representation of the amount of carotenoids experimentally 2
extracted and predicted by the model for Tomadol 25-7. 3
4
5
6
7
8
23
1
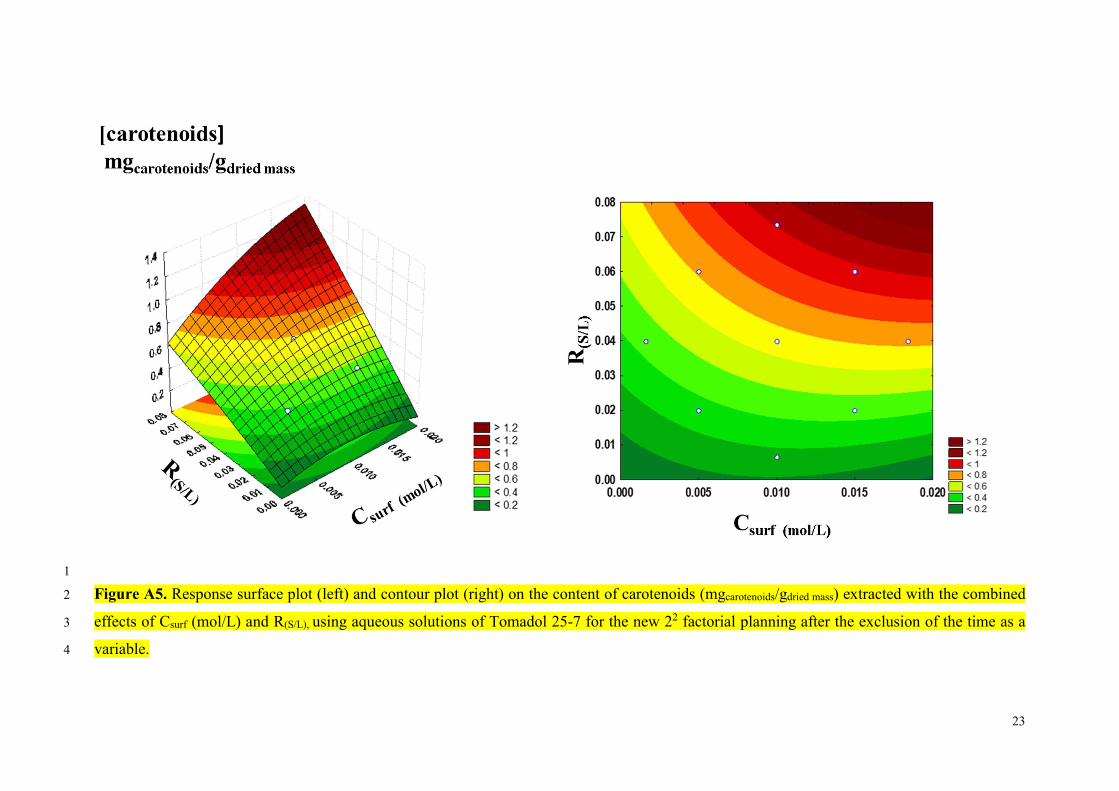
Figure A5. Response surface plot (left) and contour plot (right) on the content of carotenoids (mgcarotenoids/gdried mass) extracted with the combined 2
effects of Csurf (mol/L) and R(S/L), using aqueous solutions of Tomadol 25-7 for the new 22 factorial planning after the exclusion of the time as a 3
variable.4

24
1
Figure A6. Pareto chart for the 22 factorial planning applied to Tomadol 25-7. 2
3
4
5
6
7
8
9
10
11
12

25
1
Figure A7. Photos of the biomass after extraction of carotenoids regarding the dry and 2
fresh algal biomass and the different solvents used in this work, ethanol, Tomadol 25-7 3
and Pluronic P-123. 4
Top Related