


Languages
Pages
Legal

Angelo Miguel da Silva Alves
Spatial Representation ofPublic Displays Networks
Ange
lo M
iguel
da S
ilva
Alve
s
dezembro de 2013UMin
ho |
201
3Sp
atia
l Rep
rese
ntat
ion
ofPu
blic
Dis
play
s N
etw
orks
Universidade do MinhoEscola de Engenharia
dezembro de 2013
Tese de MestradoCiclo de Estudos Integrados Conducentes aoGrau de Mestre em Engenharia de Comunicações
Trabalho efetuado sob a orientação doProfessor Doutor Rui JoséProfessor Doutor Adriano Moreira
Angelo Miguel da Silva Alves
Spatial Representation ofPublic Displays Networks
Universidade do MinhoEscola de Engenharia

“Dictionary is the only place that success comes before work.
Hard work is the price we must pay for success.
I think you can accomplish anything if you’re willing to pay the price.”
Vince Lombard

Acknowledgments Firstly, I would like to express my deepest gratitude to my family. Without their
love and support, all of this would not have been possible. Also a special thank to the
Proença/Rocha family for all the support over these years.
I would like to thank my supervisors, Professor Adriano Moreira and Rui José,
for the help, patience and guidance, which was essential for the accomplishment of this
work.
I would also like to thank all my friends that, in one way or another, contributed
for this work to be accomplished. A special thanks to Nuno Mendes, Sergio Silva and
Rui Ferraz for all the help in the programming, and to Carina Boavida for reviewing my
thesis.
I would like to express my deepest gratitude to my division (DRA/FRD) in
Portugal Telecom for all the understanding, comprehension and support during all these
months.
Finally, I also would like to give a very special thanks to Magda Gomes for all
the support, patience and for being by my side all these days.
Thank you all!

Representação espacial de redes de
ecrãs públicos
Resumo
Este trabalho faz parte do projeto Europeu Pd-Net e tem como objectivo
identificar e abordar os desafios tecnológicos e de investigação relacionados com a
criação de redes, em larga escala, de ecrãs públicos e sensores associados.
O aparecimento das redes de larga escala de ecrãs públicos irá representar uma
mudança significativa no modo como pensamos sobre a disseminação de informação
em espaços públicos e criará uma nova área de investigação, as bases para um novo
meio de comunicação e novas oportunidades de negócio. De igual modo, é esperada
uma mudança nos espaços públicos para espaços inteligentes que podem ser ajustados
para refletir as esperanças, aspirações e interesses dos ocupantes que utilizam o
conteúdo e as aplicações criadas em qualquer parte da rede.
Um dos pontos-chave da rede de ecrãs públicos é a possibilidade de endereçar a
rede como um todo e focar nas relações espaciais entre os ecrãs.

Spatial representation of public
displays networks
Abstract
This work is part of Pd-Net, a European project that aims to explore the
scientific challenges and new technologies required to enable the emergence of large
scale networks of pervasive public displays and associated sensors that are open to
applications and content from many sources. The emergence of such pervasive display
networks would represent a radical transformation in the way we think about
information dissemination in public spaces and will create a new research area, provide
the foundations for a new communication medium and new business opportunities. In
the same way, it is expected a change from public spaces – from today’s environments
in which information is pushed to passers-by in the form of adverts – to spaces that can
utilise ambient intelligence to be tailored to reflect the hopes, aspirations and interests
of its occupants using content and applications created anywhere in a global network.
One of the interesting features of pervasive displays networks is the possibility
to address the network as a whole and to focus on the spatial relations between displays.

Contents
1. Introduction ....................................................................................................... 15
1.1. Contributions ......................................................................................... 16
1.2. Motivating scenarios ............................................................................. 17
1.3. Thesis outline ........................................................................................ 18
2. Location concepts ........................................................................................... 19
2.1. Location Sensing Techniques ................................................................ 20
2.1.1. Triangulation/trilateration .............................................................. 20
2.1.2. Proximity ........................................................................................ 21
2.1.3. Scene analysis ................................................................................. 22
2.2. Geometric and symbolic coordinates .................................................... 22
2.3. Absolute location systems ..................................................................... 23
2.4. Relative location systems ...................................................................... 23
2.5. Accuracy ................................................................................................ 24
2.6. Precision ................................................................................................ 24
2.7. Features of location models ................................................................... 24
2.7.1. Location queries ............................................................................. 24
2.7.2. Nearest neighbour queries .............................................................. 25
2.7.3. Navigation ...................................................................................... 25
2.7.4. Range queries ................................................................................. 25
2.7.5. Key properties ................................................................................ 25
2.8. Chapter Summary .................................................................................. 27
3. Related work ................................................................................................... 29
3.1. Location models .................................................................................... 30
3.1.1. Geometric location models ............................................................. 30
3.1.2. Symbolic location models .............................................................. 31
3.1.3. Hybrid location models .................................................................. 34
3.2. Public displays ....................................................................................... 37
3.3. Chapter summary .................................................................................. 39
4. Requirements .................................................................................................. 41
4.1. Usage patterns ....................................................................................... 42
4.1.1. Location based displays .................................................................. 44
4.1.2. Spatially coordinated displays ........................................................ 45
4.1.3. Navigation ...................................................................................... 45
4.1.4. Spatially aware displays ................................................................. 46
4.2. Spatial requirements .............................................................................. 47
4.2.1. Absolute location ............................................................................ 48
4.2.2. Relative location ............................................................................. 50
4.2.3. Topological information for the display’s environment ................. 51
4.2.4. Display orientation ......................................................................... 52
4.2.5. Display surroundings ...................................................................... 53
4.2.6. Display attributes and status ........................................................... 54
4.3. Chapter summary .................................................................................. 55
5. System architecture ........................................................................................ 57
5.1. Assumptions .......................................................................................... 58
5.1.1. Network .......................................................................................... 58
5.1.2. Back Office ..................................................................................... 59
5.1.3. Database ......................................................................................... 61
5.1.4. Spatial model server ....................................................................... 62
5.2. Solution modules ................................................................................... 65
5.2.1. Authentication ................................................................................ 66
5.2.2. Association ..................................................................................... 66
5.2.3. Orientation ...................................................................................... 67
5.2.4. Location .......................................................................................... 68
5.2.5. Space .............................................................................................. 68
5.2.6. Surroundings .................................................................................. 69
5.3. Chapter summary .................................................................................. 69
6. Application ...................................................................................................... 71
6.1. Dependencies ........................................................................................ 72
6.1.1. Google Play Services ...................................................................... 72
6.1.2. Google Maps .................................................................................. 73
6.1.3. Wi-Fi & mobile network location .................................................. 74
6.1.4. Internet connection ......................................................................... 74
6.2. Server connection .................................................................................. 75
6.3. Permissions ............................................................................................ 76
6.4. Association/Authentication ................................................................... 77
6.5. Orientation ............................................................................................. 80
6.6. Location ................................................................................................. 82
6.7. Space ..................................................................................................... 83
6.8. Relative Location .................................................................................. 84
6.9. Chapter summary .................................................................................. 86
7. Discussion ........................................................................................................ 87
7.1. Display’s registration ............................................................................ 88
7.2. Missing Child ........................................................................................ 99
7.3. Emergency evacuation ........................................................................ 103
7.4. Chapter summary ................................................................................ 107
8. Conclusion and outlook ................................................................................ 109
8.1. Concluding remarks ............................................................................ 110
8.2. Future research and challenges ........................................................... 111
9. Bibliography .................................................................................................. 113

List of Figures
2-1. Lateration .......................................................................................................... 20
2-2. Angulation ........................................................................................................ 21
3-1. Set-based model ............................................................................................... 31
3-2. Hierarchical lattice-based model ...................................................................... 32
3-3. Graph-based model ........................................................................................... 33
3-4. Combined symbolic model ............................................................................... 33
3-5. Levels of details ................................................................................................ 33
3-6. Subspaces model .............................................................................................. 35
3-7. Partial subspaces model .................................................................................... 35
5-1. System architecture .......................................................................................... 58
5-2. QRCode and plain text Ids ............................................................................... 59
5-3. Database ER model .......................................................................................... 61
5-4. Symbolic contextualizer browser ..................................................................... 64
5-5. Symbolic contextualizer space editor ............................................................... 64
5-6. Application modules ......................................................................................... 65
5-7. Horizontally, vertically landscape and vertically portrait orientation .............. 67
5-8. Relations and orientation .................................................................................. 67
6-1. Google maps mobile SDK Key ........................................................................ 72
6-2. Google maps mobile SDK Key added to the project. ...................................... 73
6-3. Method that evaluates the Google Play Service status. .................................... 73
6-4. Method that evaluates the Google Maps status ................................................ 74
6-5. Method that evaluates the Wi-Fi & mobile network location option ............... 74
6-6. Method that evaluates the Internet connection status ....................................... 75
6-7. Dependencies error list ..................................................................................... 75
6-8. Internet dependency information ...................................................................... 75
6-9. getInstance method ........................................................................................... 76
6-10. Required permissions ....................................................................................... 77
6-11. Application requesting an IP address ............................................................... 78
6-12. Network domain information ........................................................................... 78
6-13. User’s authentication ........................................................................................ 79
6-14. Input method’s list ............................................................................................ 79
6-15. New display ...................................................................................................... 80
6-16. Known display .................................................................................................. 80
6-17. Orientation ........................................................................................................ 81
6-18. Accelerometer 3-axis coordinate system .......................................................... 81
6-19. Display’s location ............................................................................................. 82
6-20. Level attribute ................................................................................................... 84
6-21. Vertical oriented ............................................................................................... 85
6-22. Horizontal oriented ........................................................................................... 85
7-1. Engineering school first floor plan ..................................................................... 88
7-2. BO IP address ..................................................................................................... 89
7-3. Domain information ........................................................................................... 89
7-4. User authentication ............................................................................................. 90
7-5. Input methods ..................................................................................................... 90
7-6. Display’s Id ........................................................................................................ 90
7-7. New display ........................................................................................................ 90
7-8. Existing display .................................................................................................. 91
7-9. Main menu .......................................................................................................... 91
7-10. Display’s orientation ........................................................................................ 92
7-11. Display’s orientation result ............................................................................... 92
7-12. Orientation defined ........................................................................................... 93
7-13. Orientation defined ........................................................................................... 93
7-14. Display’s location ............................................................................................. 93
7-15. Useful information ............................................................................................ 93
7-16. Location defined ............................................................................................... 94
7-17. Location defined ............................................................................................... 94
7-18. Search for Engineering ..................................................................................... 95
7-19. Search’s result .................................................................................................. 95
7-20. Space’s floors ................................................................................................... 96
7-21. First floor’s areas .............................................................................................. 96
7-22. Space defined .................................................................................................... 96
7-23. Space defined .................................................................................................... 96
7-24. Surrounding step ............................................................................................... 97
7-25. Emergency Exit key element ............................................................................ 97
7-26. Surroundings defined ........................................................................................ 98
7-27. Surroundings defined ........................................................................................ 98
7-28. Information’s resume ........................................................................................ 98
7-29. Engineering school floor plan .......................................................................... 99
7-30. Missing child first step ................................................................................... 100
7-31. Missing child second step ............................................................................... 101
7-32. Missing child third step .................................................................................. 101
7-33. Missing child fourth step ................................................................................ 101
7-34. Missing child fifth step ................................................................................... 102
7-35. Missing child sixth step .................................................................................. 102
7-36. Space floor plan .............................................................................................. 103
7-37. Evactuation first step ...................................................................................... 104

7-38. Evacuation second step ................................................................................... 105
7-39. Blocked path ................................................................................................... 105
7-40. Evacuation third step ...................................................................................... 106
7-41. Blocked path ................................................................................................... 106
7-42. Evacuation fourth step .................................................................................... 107


List of Tables
4-1. Scenarios and spatial requirements .................................................................. 31
7-1. Emergency exit directions relatively to the display’s location ......................... 85

Introduction
Angelo Alves University of Minho 15
1. Introduction
The debate over large-scale networks of pervasive public displays is earning a
considerable attention, but in fact it is still an area in its infancy. In comparison to static
signage, pervasive displays have more advantages as they can be used with different
purposes.
Typically static signage has only one purpose and in order to change or update
the information that is being given, new signage has to be created and deployed.
However, it takes some time to firstly, identify when a static signage needs to be
updated or created and secondly, to place or replace it. During that time, incorrect,
incomplete, ambiguous, or even no information is given. Furthermore, the way in which
the static signage is placed has a strong impact in the information quality, as it is
desirable that the information is given in a clear and unambiguous way. Another issue is
related to temporary events, given that new and specific signage has to be created and
placed to provide information or directions about the event. But when the event ends, all
the created signage has to be removed. However, since it is time consuming and it
represents significant costs, in most cases the signage is not removed and stays visible
presenting wrong and unusable information. Despite of this, static signage is still widely
used.
At the same time a public display entails dynamic solutions that allow
presenting, varying and updating the available information without involving any
infrastructure costs. When there is the need to modify or update the information being
displayed this can be done almost immediately, and consequently the most up to date
and accurate information is always provided. This capability represents an advantage
over static signage and it can be even more important in emergency scenarios, where
updated and precise instructions/information can be given to help people in a more
effective way. Moreover, when a specific event takes place the displays can be used
during that period to provide information and/or give guidance to the event. When the
event ends the displays can be used to display other information. Public displays, unlike
Introduction
Angelo Alves University of Minho 16
static signage, can be used to serve multiple purposes e.g. personalized navigation,
shopping assistance, advertising, context aware, emergency scenarios etc.
Nevertheless, to enable this dynamic solution a public network of displays has to
be set up to provide a service infrastructure. The information showed on the display
needs to be adjusted to new conditions and to the surrounding environment. The
display’s location and orientation has to be known and so a suitable and generic spatial
location model has to be developed. The emergence of such possibility will definitely
represent a huge change in the way we all think and see the information propagation in
public spaces. The European project (Pd-Net) intends to explore the scientific
challenges and technologies that will be needed to enable pervasive display networks
and associated sensors. This will represent several new opportunities at different levels
of research.
1.1. Contributions
The main purpose of this thesis is to specify a suitable, simple and generic
spatial model to associate the display medium within its spatial location. A spatial
model will enable the displays on a public network to spontaneously support
applications that require knowledge about the location and orientation of the display. It
will be generic without limiting any application or system to get the information needed
about the displays. It should allow the inclusion of any sensor technology already
available or that will be available in the future. Therefore, the main goals of this thesis
are the following:
• Identify the spatial requirements that are imposed not only to the spatial model
but also to the characterization of the displays;
• Develop a spatial model that enables spatial relations between displays and their
physical location (location within an indoor space);
• Develop a mobile application to perform the display’s registration, i.e. generate
and collect the display’s spatial information;
• Develop a solution that enables applications to understand the geometric and
spatial relations between displays in order to achieve their goals;
• Build up a test environment to test the pervasive displays network.
Introduction
Angelo Alves University of Minho 17
1.2. Motivating scenarios
The following scenarios show how spatial representation of public displays
networks can be used in real-world applications. The scenarios share the need for a
spatial model that associates the display medium and its spatial placement, enabling the
displays on a pervasive network to spontaneously support applications that require some
knowledge about the specific placement and orientation of the display. The scenarios
are the following:
• Locally Sourced Emergency Information - Missing Child Alerts
Sue realizes she has lost her daughter Millie in the local shopping centre. She
immediately calls the local police who ask her to send them a recent photo from her
mobile phone. Within seconds all of the displays in the shopping centre are showing a
photograph of Millie together with a number to call. As the minutes pass the
photographs spread over an ever-increasing area – reflecting how far away Millie might
be. Five minutes after the first call Millie and her mum are reunited after being found by
a fellow shopper who recognized her photo from the screen.
• Emergency Evacuation – Responding to a Terrorist Incident
Imagine the Emergency Services are handling a suspected terrorist incident
involving an explosion in a major city. The local command centre selects the epicentre
of the incident and initiates evacuation of the area. Immediately all of the public
displays in the city – not just those owned by the council but all displays - fall under the
control of the command centre. Displays seen as people travel toward the emergency
warn them to turn away whereas displays seen while travelling away provide helpful
navigation instructions to safe areas.
• Interactive Applications – Information in an Unfamiliar City
Brian has not been to Bulgaria before, but the flight was certainly cheap, and
since he knows they joined the European Union he feels sure they must speak English.
It was with some surprise then that Brian found he was almost entirely unable to read
Introduction
Angelo Alves University of Minho 18
the Bulgarian signs. Fortunately, since 2011 Sofia has joined many of its municipal
displays to a global network. Brian walks up to one of these and immediately it
recognises that he’s foreign, switches to English and offers him helpful advice about
nearby hotels and attractions. He can see notes and reviews from other tourists. He sets
the “Casa Ferrari B&B” as his destination and now gets additional guidance as he
passes further displays reassuring him that he’s on the right track. Brian is beginning to
feel more confident in this unusual but beautiful country.
1.3. Thesis outline
This thesis is divided in eight chapters.
Chapter 1 introduces the motivation, the main contributions and the motivating
scenarios of this research project.
Chapter 2 presents the fundamental location concepts related and used
throughout this work.
In the Chapter 3 a selected number of publications from the location modelling
and public displays are described and related to our work.
The Chapter 4 presents the identified display’s usage patterns and the spatial
requirements that are imposed to the display’s categorization.
In the Chapter 5 the system architecture, the assumptions made in this work and
the modules of our proposed solution are presented.
The Chapter 6 presents how the application to collect the required display’s
spatial information was implemented.
Chapter 7 reports the obtained results and evaluates them in light of the initially
proposed objectives.
Finally the Chapter 8 concludes the document by revisiting the thesis statement,
providing a list of published papers and suggesting future developments.
Location concepts
Angelo Alves University of Minho 19
2. Location concepts
Before we review the related work we need to introduce some basic concepts
that will be used throughout this work. The title of this thesis – Spatial representation of
public displays network – highlights two key areas of interest: spatial location concepts
and spatial model. This chapter starts with an overview over the three location-sensing
techniques that are used to determine the location of a given object (section 2.1). Since
the location of the display can be defined in the form of geometric or symbolic
coordinates, the properties of both coordinates are presented (section 2.2). Then an
overview over absolute/relative location systems (section 2.3), accuracy (section 2.4)
and precision (section 2.5) is presented. The last section of this chapter presents the
features of the location models, i.e. the queries that a location model should be able to
reply.
Location concepts
Angelo Alves University of Minho 20
2.1. Location Sensing Techniques
In order to identify the objects’ location, at least one location sensing technique
has to be used. The three main location-sensing techniques are:
triangulation/trilateration, proximity and scene analysis. These techniques can be used
individually (the location of the object is estimated through just one technique) or
combined (location-sensing techniques are combined to estimate the objects’ location).
2.1.1. Triangulation/trilateration
The triangulation sensing technique calculates the object’s location through the
geometry properties of triangles. Depending on how the calculation is performed – if
through distances or angles – the triangulation is divided into two sub-categories,
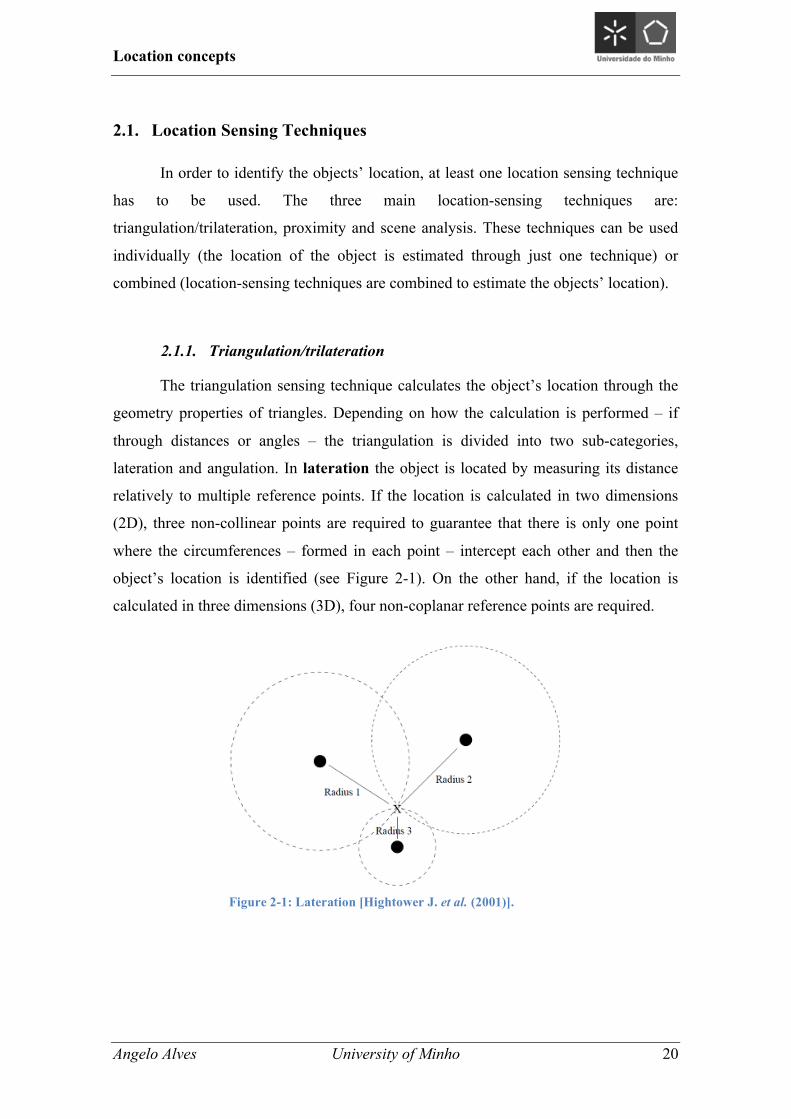
lateration and angulation. In lateration the object is located by measuring its distance
relatively to multiple reference points. If the location is calculated in two dimensions
(2D), three non-collinear points are required to guarantee that there is only one point
where the circumferences – formed in each point – intercept each other and then the
object’s location is identified (see Figure 2-1). On the other hand, if the location is
calculated in three dimensions (3D), four non-coplanar reference points are required.
Figure 2-1: Lateration [Hightower J. et al. (2001)].
Location concepts
Angelo Alves University of Minho 21
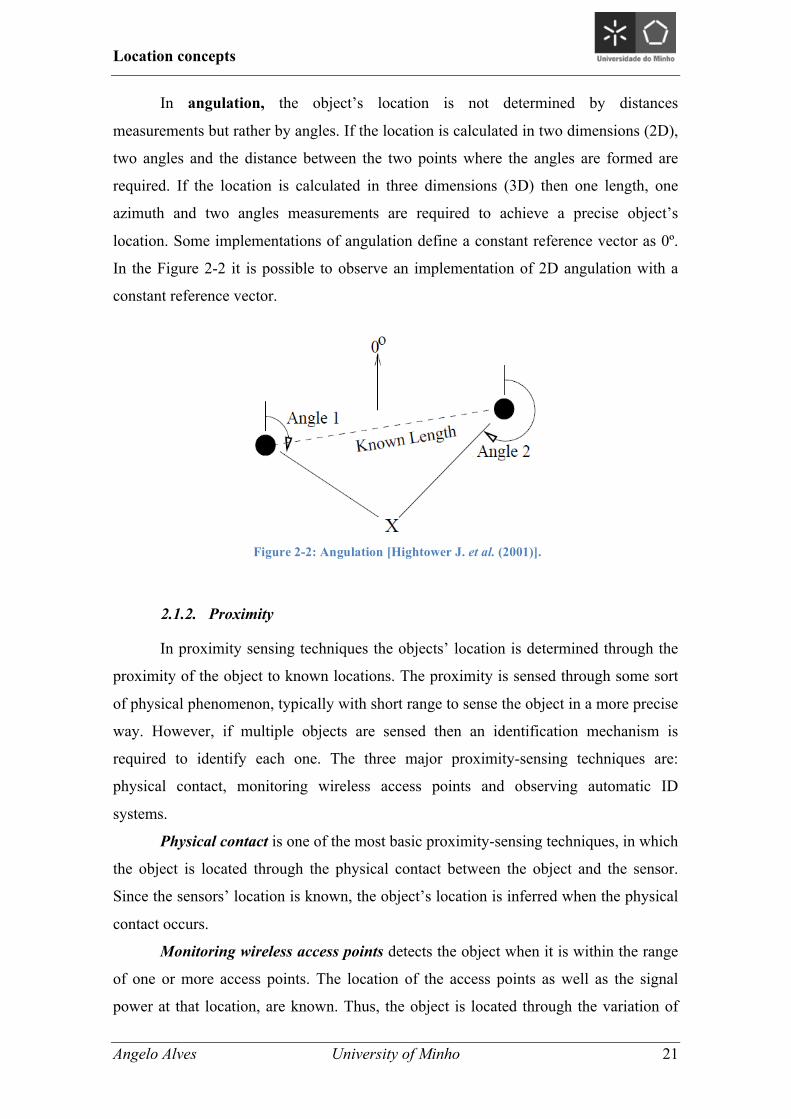
In angulation, the object’s location is not determined by distances
measurements but rather by angles. If the location is calculated in two dimensions (2D),
two angles and the distance between the two points where the angles are formed are
required. If the location is calculated in three dimensions (3D) then one length, one
azimuth and two angles measurements are required to achieve a precise object’s
location. Some implementations of angulation define a constant reference vector as 0º.
In the Figure 2-2 it is possible to observe an implementation of 2D angulation with a
constant reference vector.
2.1.2. Proximity
In proximity sensing techniques the objects’ location is determined through the
proximity of the object to known locations. The proximity is sensed through some sort
of physical phenomenon, typically with short range to sense the object in a more precise
way. However, if multiple objects are sensed then an identification mechanism is
required to identify each one. The three major proximity-sensing techniques are:
physical contact, monitoring wireless access points and observing automatic ID
systems.
Physical contact is one of the most basic proximity-sensing techniques, in which
the object is located through the physical contact between the object and the sensor.
Since the sensors’ location is known, the object’s location is inferred when the physical
contact occurs.
Monitoring wireless access points detects the object when it is within the range
of one or more access points. The location of the access points as well as the signal
power at that location, are known. Thus, the object is located through the variation of
Figure 2-2: Angulation [Hightower J. et al. (2001)].
Location concepts
Angelo Alves University of Minho 22
the signal’s power, as the distance between the object and the access points increases,
the weaker the signal’s power becomes.
Observing automatic ID systems determines the objects’ location through
automatic identification systems - such as credit cards point-of-sale, computer logins
histories, landline telephone records, etc. – that are able to scan the object. Since the
location of these automatic identification systems is known, the objects’ location is
inferred.
2.1.3. Scene analysis
In scene analysis, the characteristics of the scene being observed through a vantage
observation point are used to identify the location of the object. The scene being
observed is usually simplified to obtain features that are easier to represent and
compare. Scene analysis is divided into two sub-categories: static scene analysis and
differential scene analysis.
In static scene analysis, the scene being observed is compared with a predefined
reference observation of that scene. This predefined observation is recorded in a
database and any difference between the predefined and the current observation
indicates the object’s location.
In differential scene analysis, successive scenes are observed and compared to
identify any difference between them. The difference between the scenes indicates the
location of the object and the objects movement.
2.2. Geometric and symbolic coordinates
In the previous section it was presented how the location of an object can be
determined, in this section it will be presented how it can be defined. Two types of
coordinates can be used to define the object’s location: geometric and symbolic.
In geometric coordinates the object’s location is defined as a set of coordinates
relatively to a specific coordinate system. Geometric coordinates can be divided in
global and local physical coordinates. Global coordinates are able to determine the
location of an object worldwide as the Global Positioning System (GPS) uses a global
reference system (WGS84) On the contrary, local coordinates entail a local solution
Location concepts
Angelo Alves University of Minho 23
with limited range, such a room or building where the system is implemented. In this
case the object’s location is only achieved within that space.
Geometric coordinates properties:
− Fine-grained location information;
− Allow distance calculation between two points;
− Allow to determine if different areas overlap, touch or contain each other;
− Allow simple spatial reasoning.
In symbolic coordinates, the object’s location is defined as a set of abstracts
symbols or ideas of where the object is. For instance, the symbolic information of an
object can be defined as “University of Minho, School of Engineering, Laboratory 3”.
Symbolic coordinates properties:
− Coarse-grained location information;
− Distance calculation between two coordinates is not achieved directly;
− To determine if different areas overlap, touch or contain each other, further
information is required.
2.3. Absolute location systems
In absolute location systems, a shared reference for all objects being located is
used. This means that all objects in the same location will report the same or much
approximated location information. The GPS is an example of an absolute location
system, since two different GPS receivers achieve the same or much approximated
location information if they are at the same location.
2.4. Relative location systems
In relative location systems, each object can have its own reference. For
example, in an emergency scenario each hand-held computer of each rescue team
Location concepts
Angelo Alves University of Minho 24
element is able to determine the location of the victims relatively to it. This means that
each computer has its own relative location system.
2.5. Accuracy
Accuracy is the average difference between the object’s real location and the
location achieved by the location system. If this difference is small, then the system is
accurate (fine-grained). As the difference increases the system starts to lose accuracy
(becoming coarse-grained). A system that provides a difference of 1 meter is more
accurate than the one that provides a difference of 5 meters.
2.6. Precision
Precision represents how often a certain level of accuracy is expected. This
means that, it is the percentage of times that a system is able to provide – overtime – the
same or much approximated location information of an object in the same location. A
system that provides 99% of the times the same location information to the same
object’s location is more precise than a system that provides 70%.
2.7. Features of location models
Depending on the application type and requirements, a set of queries and tasks
are imposed, which will lead to the location model that has to be used. Hence, these
queries and tasks have to be defined and considered before assessing the functional
requirements for the location models.
2.7.1. Location queries
Every location-based and context-aware system requires the location of objects,
thus a location query is mandatory. Hence, all models have to be able to answer this
query despite the fact that each model defines the objects’ location differently, by using
different coordinate reference systems – global or local – and different coordinates –
geometric or symbolic.
Location concepts
Angelo Alves University of Minho 25
2.7.2. Nearest neighbour queries
Nearest neighbour queries search and retrieve the objects that are closest to a
given location. In order to identify which is/are the nearest object(s), a distance function
is required to compare the distances and identify the nearest objects. If it is true that
calculating the distance between geometric coordinates is relatively simple – just
perform some calculations – the same is not valid for symbolic coordinates (i.e.
additionally information is required).
2.7.3. Navigation
Navigation systems require a location model to find /identify the paths between
two locations. To calculate the path it is mandatory to know how the different locations
are connected, thus a “connected to” relation has to be modelled. This relation enables
the navigation query to calculate and determine the path between the two given
locations. Different paths can be calculated depending on the requirements that are
specified, it can be the fastest path, shortest path, most suitable path (e.g. handicap
users) among others. Therefore, additional information like the distance between
locations and the type of connection between locations are required.
2.7.4. Range queries
Range query return all objects that are within a certain range of a given location.
If geometric coordinates are used, finding the objects that are within a specified range is
straightforward, because it just needs to verify if the distance to the objects is less or
equal than the specified range to the given location. In contrast, if symbolic coordinates
are used, the topological “contains” relation has to be explicitly defined.
2.7.5. Key properties
Through the previous queries and tasks it is possible to achieve the following
key properties for the locations model. Nonetheless, it is important to notice that not all
of these properties have to be fulfilled at the same time, unless it is truly demanded by
the system/application. Therefore, it is important to identify which are the properties
needed by the system/application, and based on that, select the most suitable model. To
Location concepts
Angelo Alves University of Minho 26
support the location, nearest neighbour and range queries, a location model should
provide:
1. Object’s location defines the location of the objects in the form of
symbolic or geometric coordinates, in accordance with the coordinate reference system
used, which can be global or local.
2. Distance function models the distance between spatial objects. The
distance can correspond to the length of the path that connects two locations (e.g. a
corridor) thus, in these cases it corresponds to the distance a user has to travel.
3. Topological relations define the spatial containment and spatially
connected relations. The spatial containment relation enables range queries, while the
spatially connected relation enables and is used for navigation.
4. Orientation defines the vertical and/or horizontal dimensions, as well as,
landscape and/or portrait orientation.
Even though the previous requirements are important and in some cases crucial
to the systems/applications, they should not be achieved through high modelling effort.
The modelling effort is defined via the accuracy, level of detail and scope elements.
Accuracy defines how accurate the model describes the world, how the model is
created and updated and the dynamics of the objects being modelled. The dynamic of
the objects indicates how frequently their information needs to be updated.
Level of detail describes the precision or granularity of the model, which can be
fine-grained or coarse-grained.
Scope defines the area covered by the model, which can be local or global. The
level of detail and the scope are related, since a model that provides a high level of
detail usually has a local scope, otherwise the modelling effort is high or very high. On
the other hand, when the scope is global the level of detail is usually low.
Location concepts
Angelo Alves University of Minho 27
2.8. Chapter Summary
In this chapter we presented the basic terms and concepts that will be used
throughout this work. We first introduced fundamentals location concepts to determine
the objects’ location through triangulation, proximity or scene analysis. The two
different types of coordinates, symbolic or geometric, were presented as well as the
relative and absolute location systems. In this context we also presented the main
difference between accuracy and precision of the location information.
Furthermore, we presented the features of location models that had to be taken
into account when selecting the location model. The features presented were the
location queries, nearest neighbour queries, navigation, range queries and key
properties.

Location concepts
Angelo Alves University of Minho 28
Related work
Angelo Alves University of Minho 29
3. Related work
In this chapter we perform a review over the work related with this thesis’ topic.
The two main topics of this work are: the public displays and their spatial
representation. Therefore, this chapter is divided in two sections: Locations models
(section 3.1) and Public displays (sections 3.2). In the first section we intend to identify
the different types of location models along with their advantages and disadvantages in
order to select the approach that is going to be followed in this work. Afterwards, a
review over the literature that uses public displays was performed to perceive how the
displays are used, the goals of such uses, which services use the displays and if such
uses impose any spatial requirement.
Related work
Angelo Alves University of Minho 30
3.1. Location models
Location models (also known as world models or space models) became a
crucial topic in ubiquitous computing. They represent the state of the world, i.e. contain
the information regarding places, people, objects and the relations between them. Based
on the features defined in the previous section a location model should provide: the
object’s location (regardless if it is defined in geometric/symbolic coordinates and in a
local/global coordinate system), the distance between objects and the topological
relations of containment, interception and connection. In the ubiquitous computing
scope, the location models play an important role in tracking people/objects and
identifying the most suitable devices to perform the interactions with the different
context-aware applications.
Based on Becker and Dürr et al., (2005) and Domnitcheva et al., 2001, the
locations models can be classified in: geometric, symbolic and hybrid location models.
However, some authors make the distinction between topological (Brumitt and Shafer et
al., 2001) or semantic (Pradhan et al., 2000) world models and metric models.
3.1.1. Geometric location models
Geometric location models define the locations as geometric figures and contain
points, lines and polygons that are characterized by metric and non-metric attributes. If
multiple coordinate systems are used (e.g. a global coordinate system is combined with
multiple local coordinate systems), the location and orientation information has to be
defined in a way that enables the translation between the multiple systems. The
<<containment in>> relation and the distance between locations are inferred through
mathematical calculations. However, the <<connected to>> relation cannot be
achieved through mathematical calculations, hence it has to be defined explicitly.
The EasyLiving project presented by Brumitt et al., (2000) implements a
geometric location model for indoor spaces to provide a location-based context and it is
focused in developing an architecture and technologies for intelligent environments.
The project’s main goal is to identify and track the devices within a given space in order
to make the interaction between the user and the devices easier. To perform the
interaction, it is not required that the user knows the exact name of the device(s), instead
Related work
Angelo Alves University of Minho 31
the user just needs to know the device’s type and location. To attain the necessary
information a set of sensors is spread around the space.
3.1.2. Symbolic location models
Symbolic location models represent the location of the objects and things as
abstract ideas or symbols. According to Becker and Dürr et al., (2005) the symbolic
location models can be divided in: set-based, hierarchical, graph-based and a
combination of graph and set-based.
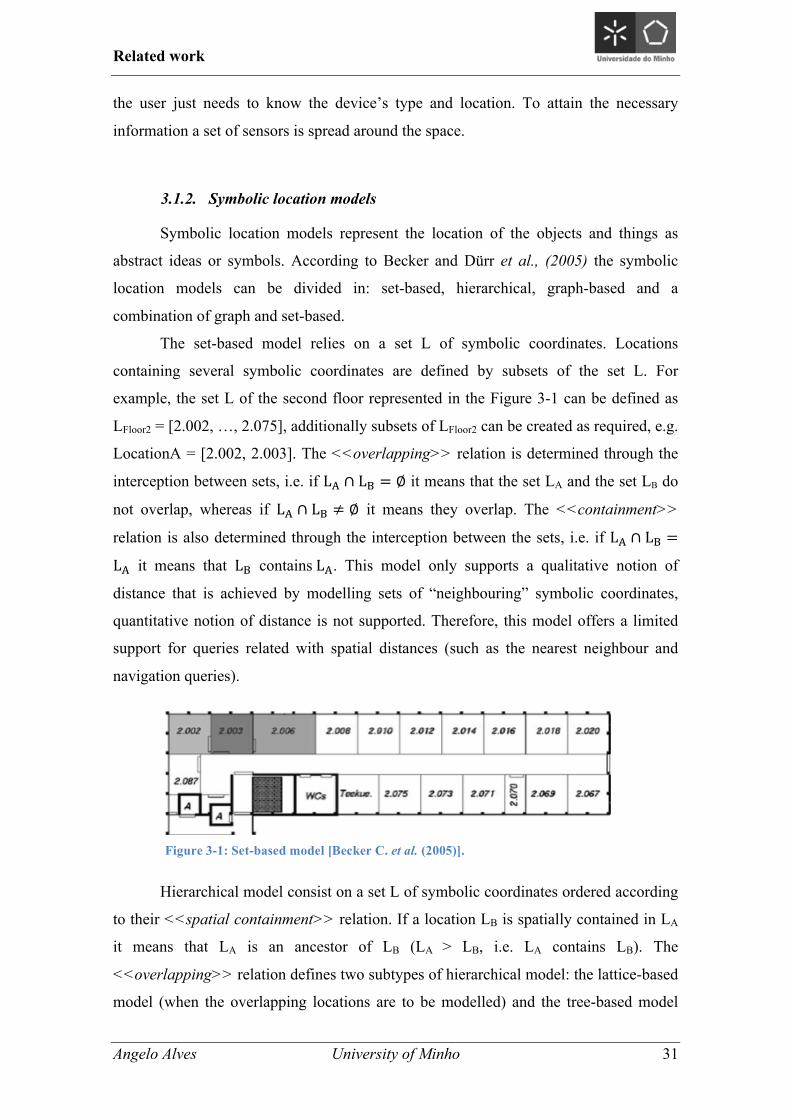
The set-based model relies on a set L of symbolic coordinates. Locations
containing several symbolic coordinates are defined by subsets of the set L. For
example, the set L of the second floor represented in the Figure 3-1 can be defined as
LFloor2 = [2.002, …, 2.075], additionally subsets of LFloor2 can be created as required, e.g.
LocationA = [2.002, 2.003]. The <<overlapping>> relation is determined through the
interception between sets, i.e. if L! ∩ L! = ∅ it means that the set LA and the set LB do
not overlap, whereas if L! ∩ L! ≠ ∅ it means they overlap. The <<containment>>
relation is also determined through the interception between the sets, i.e. if L! ∩ L! =
L! it means that L! contains L!. This model only supports a qualitative notion of
distance that is achieved by modelling sets of “neighbouring” symbolic coordinates,
quantitative notion of distance is not supported. Therefore, this model offers a limited
support for queries related with spatial distances (such as the nearest neighbour and
navigation queries).
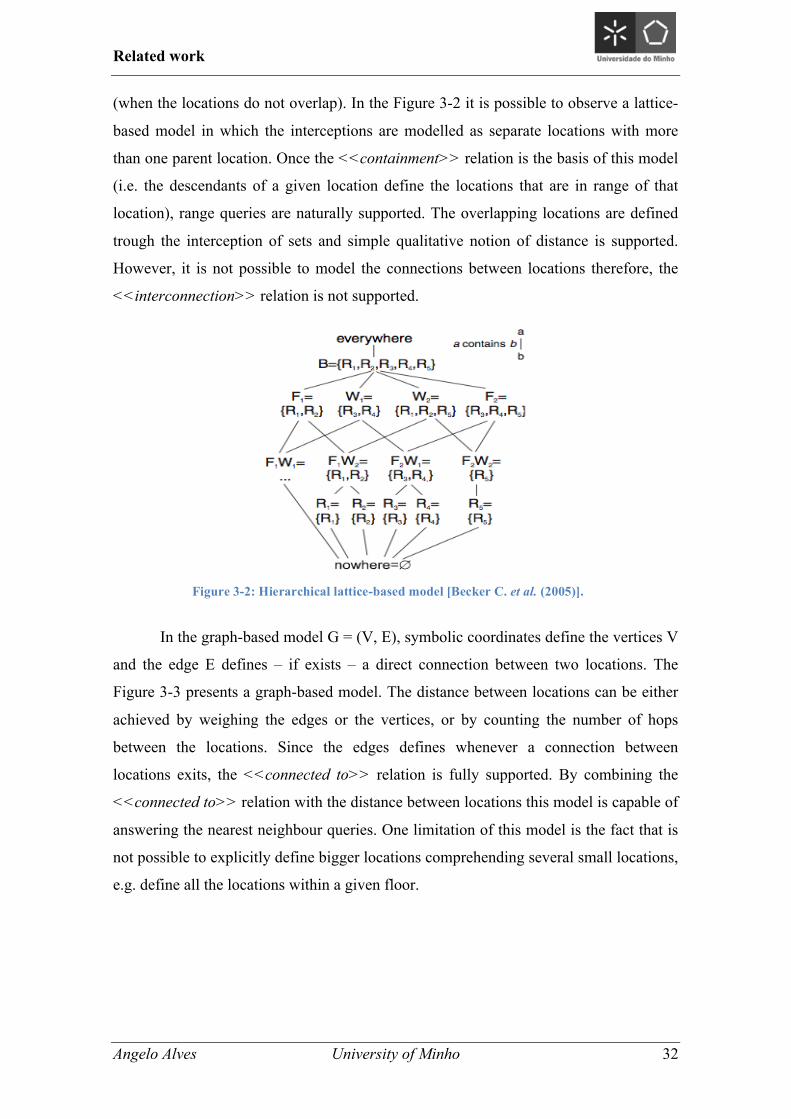
Hierarchical model consist on a set L of symbolic coordinates ordered according
to their <<spatial containment>> relation. If a location LB is spatially contained in LA
it means that LA is an ancestor of LB (LA > LB, i.e. LA contains LB). The
<<overlapping>> relation defines two subtypes of hierarchical model: the lattice-based
model (when the overlapping locations are to be modelled) and the tree-based model
Figure 3-1: Set-based model [Becker C. et al. (2005)].
Related work
Angelo Alves University of Minho 32
(when the locations do not overlap). In the Figure 3-2 it is possible to observe a lattice-
based model in which the interceptions are modelled as separate locations with more
than one parent location. Once the <<containment>> relation is the basis of this model
(i.e. the descendants of a given location define the locations that are in range of that
location), range queries are naturally supported. The overlapping locations are defined
trough the interception of sets and simple qualitative notion of distance is supported.
However, it is not possible to model the connections between locations therefore, the
<<interconnection>> relation is not supported.
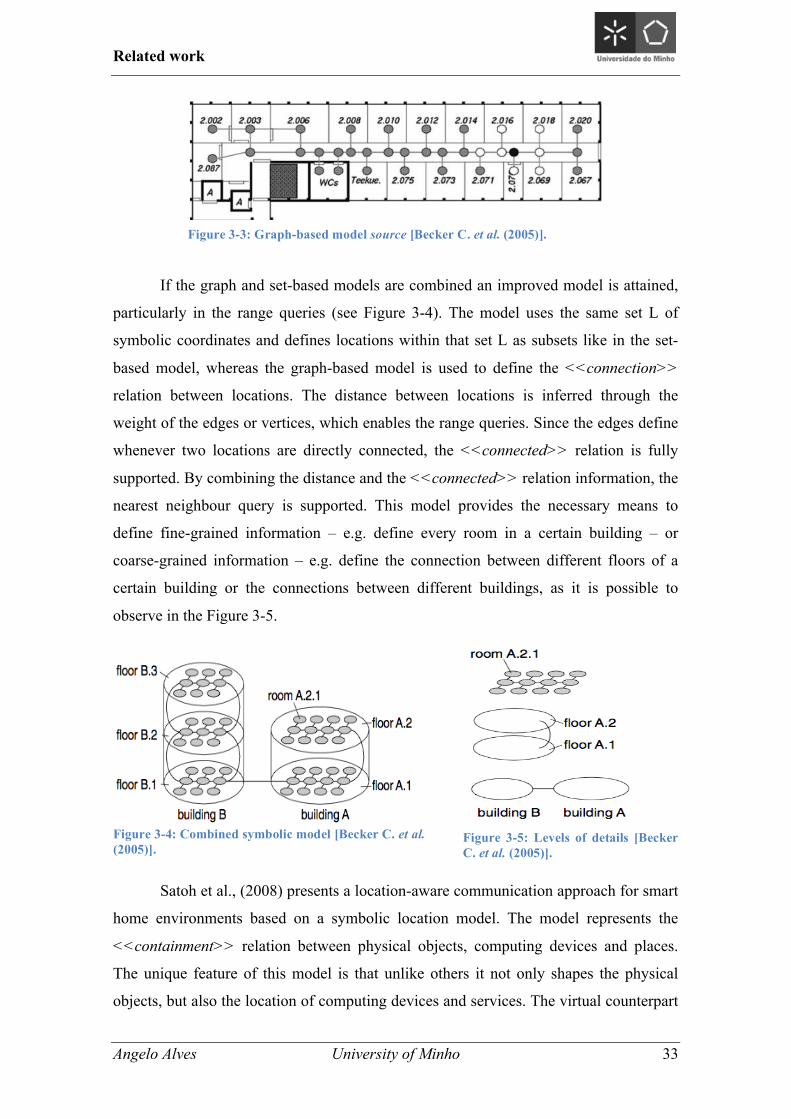
In the graph-based model G = (V, E), symbolic coordinates define the vertices V
and the edge E defines – if exists – a direct connection between two locations. The
Figure 3-3 presents a graph-based model. The distance between locations can be either
achieved by weighing the edges or the vertices, or by counting the number of hops
between the locations. Since the edges defines whenever a connection between
locations exits, the <<connected to>> relation is fully supported. By combining the
<<connected to>> relation with the distance between locations this model is capable of
answering the nearest neighbour queries. One limitation of this model is the fact that is
not possible to explicitly define bigger locations comprehending several small locations,
e.g. define all the locations within a given floor.
Figure 3-2: Hierarchical lattice-based model [Becker C. et al. (2005)].
Related work
Angelo Alves University of Minho 33
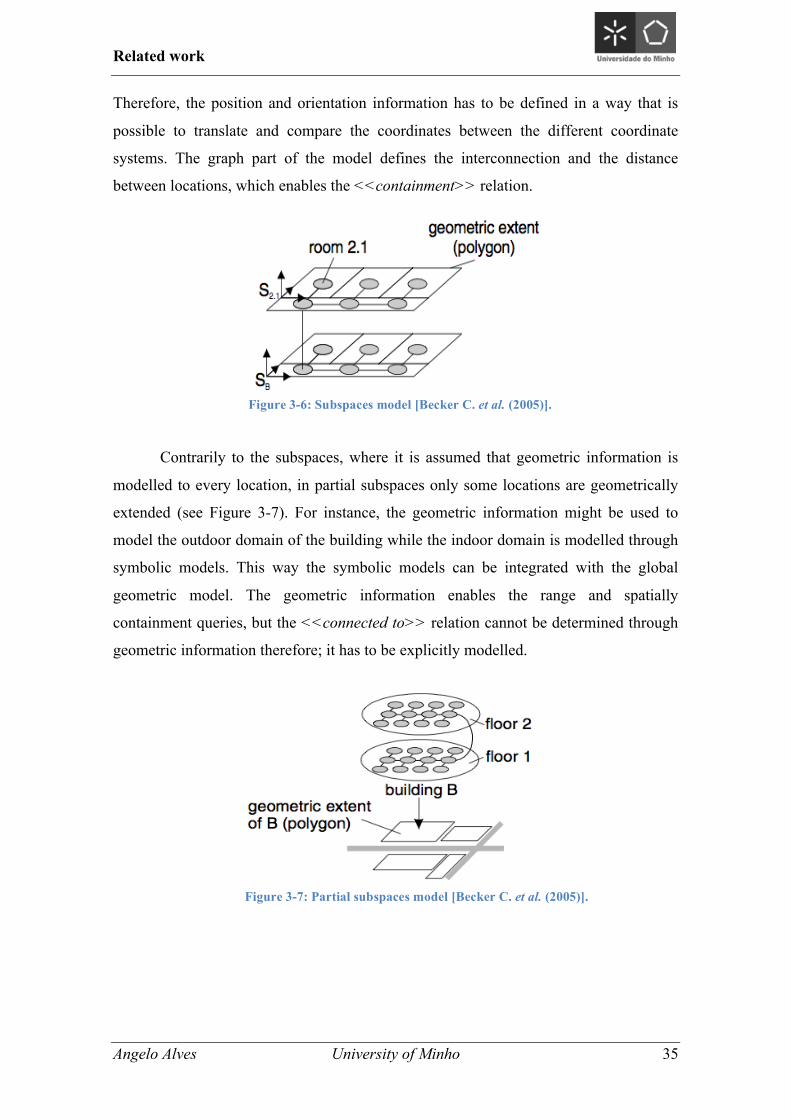
If the graph and set-based models are combined an improved model is attained,
particularly in the range queries (see Figure 3-4). The model uses the same set L of
symbolic coordinates and defines locations within that set L as subsets like in the set-
based model, whereas the graph-based model is used to define the <<connection>>
relation between locations. The distance between locations is inferred through the
weight of the edges or vertices, which enables the range queries. Since the edges define
whenever two locations are directly connected, the <<connected>> relation is fully
supported. By combining the distance and the <<connected>> relation information, the
nearest neighbour query is supported. This model provides the necessary means to
define fine-grained information – e.g. define every room in a certain building – or
coarse-grained information – e.g. define the connection between different floors of a
certain building or the connections between different buildings, as it is possible to
observe in the Figure 3-5.
Satoh et al., (2008) presents a location-aware communication approach for smart
home environments based on a symbolic location model. The model represents the
<<containment>> relation between physical objects, computing devices and places.
The unique feature of this model is that unlike others it not only shapes the physical
objects, but also the location of computing devices and services. The virtual counterpart
Figure 3-4: Combined symbolic model [Becker C. et al. (2005)].
Figure 3-5: Levels of details [Becker C. et al. (2005)].
Figure 3-3: Graph-based model source [Becker C. et al. (2005)].

Related work
Angelo Alves University of Minho 34
component (VC) defines the physical objects, e.g. a car carrying one person is mapped
in two VCs: one VC is the car and the other is the person. The proxy component (PC)
executes the services located in a VC, maintains the model’s sub tree and bridges the
model and computing devices. The service component (SC) defines the specific services
that are available on certain physical entities or places. The framework presented is able
to determine available services and execute them in accordance to the space in which
the user is located. Objects that do not possess any computational resources or network
interfaces are also supported and listed in the framework.
Kolodziej and Danado et al., (2004) proposed a hierarchical model that can be
decomposed to the required level of detail. This model enables relative positions inside
an existing hierarchy and discovery of adjacency spaces. However, due to the lack of
absolute location and distance information to other spaces, the precision of the model is
reduced.
Baras et al., (2001) presented a symbolic model in which the edges of the
vertices (graph-based) are used to represent generic relations between objects. The
relations can be complemented with a set of attributes to enrich the description and
facilitates inference processes. Some of the relations implemented are: “Is_In” (defines
containment and is attained through the model’s hierarchy), “Is_Accessible_From”
(defines connectedness) and “Is_Next_To” (defines adjacency and enables the support
for pedestrian/navigation applications).
3.1.3. Hybrid location models
Hybrid location models combine geometric and symbolic models, which
provides two major advantages. The first one is the gain of accuracy and precision of
every distance-related query. The second advantage is the use of arbitrary figures to
define ranges for the nearest neighbour queries. This way, one of the biggest
disadvantages of the symbolic models is overcome, i.e. the lack of support for distance-
related queries. According to Becker and Dürr et al., (2005) two types of hybrid
location models can be defined: the subspaces and the partial subspaces.
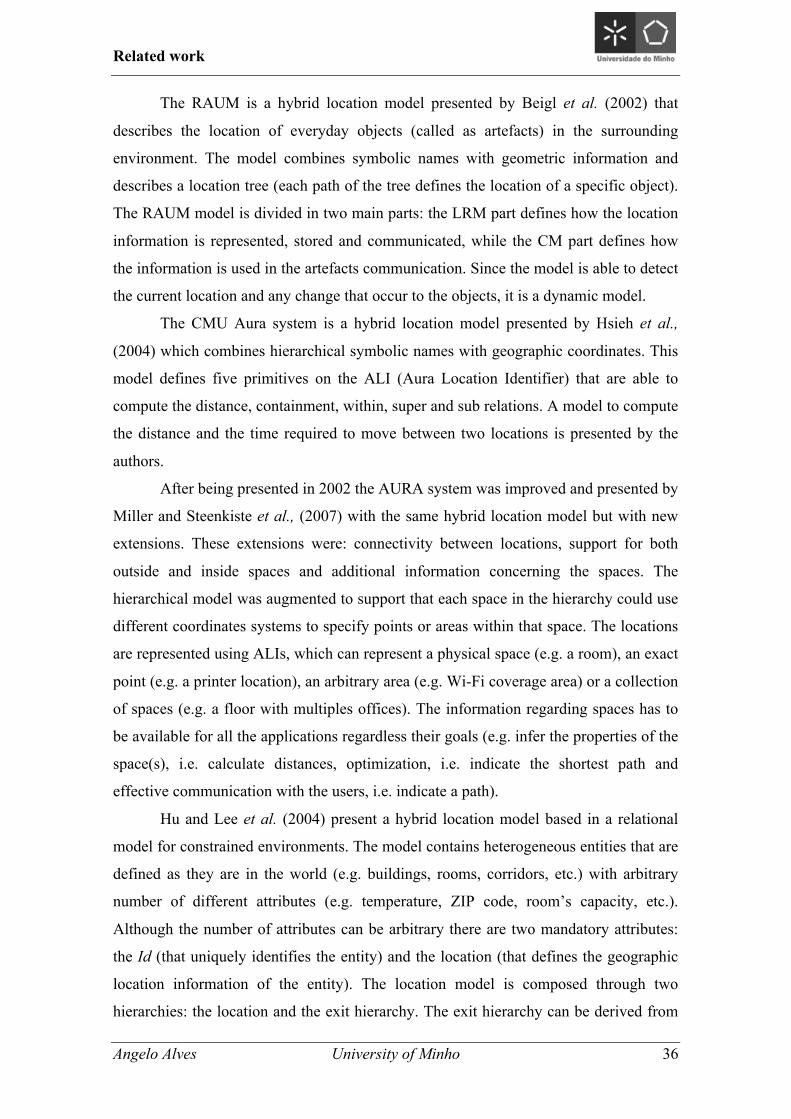
The basis of this subspaces model is a symbolic model in which additional
geometric information of every location is modelled and stored (see Figure 3-6). This
information can be either achieved through a global or local reference system.
Embedding a coordinate system into another coordinate system forms the subspace.
Related work
Angelo Alves University of Minho 35
Therefore, the position and orientation information has to be defined in a way that is
possible to translate and compare the coordinates between the different coordinate
systems. The graph part of the model defines the interconnection and the distance
between locations, which enables the <<containment>> relation.
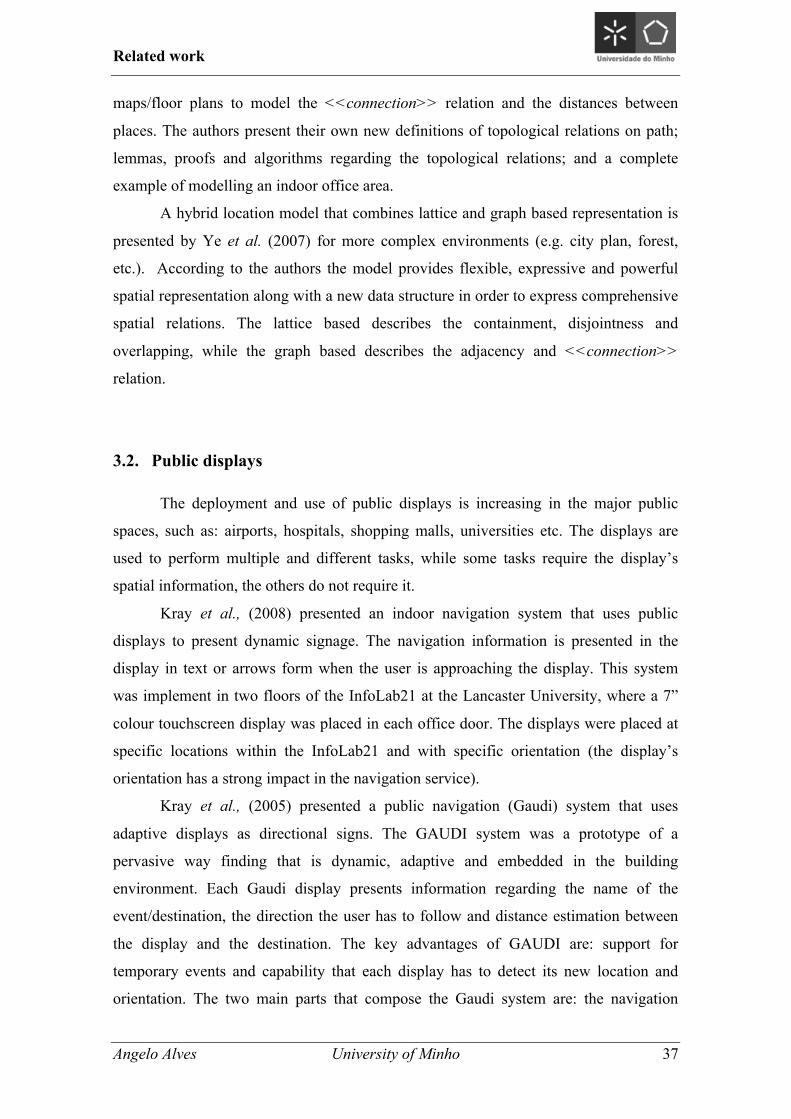
Contrarily to the subspaces, where it is assumed that geometric information is
modelled to every location, in partial subspaces only some locations are geometrically
extended (see Figure 3-7). For instance, the geometric information might be used to
model the outdoor domain of the building while the indoor domain is modelled through
symbolic models. This way the symbolic models can be integrated with the global
geometric model. The geometric information enables the range and spatially
containment queries, but the <<connected to>> relation cannot be determined through
geometric information therefore; it has to be explicitly modelled.
Figure 3-6: Subspaces model [Becker C. et al. (2005)].
Figure 3-7: Partial subspaces model [Becker C. et al. (2005)].
Related work
Angelo Alves University of Minho 36
The RAUM is a hybrid location model presented by Beigl et al. (2002) that
describes the location of everyday objects (called as artefacts) in the surrounding
environment. The model combines symbolic names with geometric information and
describes a location tree (each path of the tree defines the location of a specific object).
The RAUM model is divided in two main parts: the LRM part defines how the location
information is represented, stored and communicated, while the CM part defines how
the information is used in the artefacts communication. Since the model is able to detect
the current location and any change that occur to the objects, it is a dynamic model.
The CMU Aura system is a hybrid location model presented by Hsieh et al.,
(2004) which combines hierarchical symbolic names with geographic coordinates. This
model defines five primitives on the ALI (Aura Location Identifier) that are able to
compute the distance, containment, within, super and sub relations. A model to compute
the distance and the time required to move between two locations is presented by the
authors.
After being presented in 2002 the AURA system was improved and presented by
Miller and Steenkiste et al., (2007) with the same hybrid location model but with new
extensions. These extensions were: connectivity between locations, support for both
outside and inside spaces and additional information concerning the spaces. The
hierarchical model was augmented to support that each space in the hierarchy could use
different coordinates systems to specify points or areas within that space. The locations
are represented using ALIs, which can represent a physical space (e.g. a room), an exact
point (e.g. a printer location), an arbitrary area (e.g. Wi-Fi coverage area) or a collection
of spaces (e.g. a floor with multiples offices). The information regarding spaces has to
be available for all the applications regardless their goals (e.g. infer the properties of the
space(s), i.e. calculate distances, optimization, i.e. indicate the shortest path and
effective communication with the users, i.e. indicate a path).
Hu and Lee et al. (2004) present a hybrid location model based in a relational
model for constrained environments. The model contains heterogeneous entities that are
defined as they are in the world (e.g. buildings, rooms, corridors, etc.) with arbitrary
number of different attributes (e.g. temperature, ZIP code, room’s capacity, etc.).
Although the number of attributes can be arbitrary there are two mandatory attributes:
the Id (that uniquely identifies the entity) and the location (that defines the geographic
location information of the entity). The location model is composed through two
hierarchies: the location and the exit hierarchy. The exit hierarchy can be derived from
Related work
Angelo Alves University of Minho 37
maps/floor plans to model the <<connection>> relation and the distances between
places. The authors present their own new definitions of topological relations on path;
lemmas, proofs and algorithms regarding the topological relations; and a complete
example of modelling an indoor office area.
A hybrid location model that combines lattice and graph based representation is
presented by Ye et al. (2007) for more complex environments (e.g. city plan, forest,
etc.). According to the authors the model provides flexible, expressive and powerful
spatial representation along with a new data structure in order to express comprehensive
spatial relations. The lattice based describes the containment, disjointness and
overlapping, while the graph based describes the adjacency and <<connection>>
relation.
3.2. Public displays
The deployment and use of public displays is increasing in the major public
spaces, such as: airports, hospitals, shopping malls, universities etc. The displays are
used to perform multiple and different tasks, while some tasks require the display’s
spatial information, the others do not require it.
Kray et al., (2008) presented an indoor navigation system that uses public
displays to present dynamic signage. The navigation information is presented in the
display in text or arrows form when the user is approaching the display. This system
was implement in two floors of the InfoLab21 at the Lancaster University, where a 7”
colour touchscreen display was placed in each office door. The displays were placed at
specific locations within the InfoLab21 and with specific orientation (the display’s
orientation has a strong impact in the navigation service).
Kray et al., (2005) presented a public navigation (Gaudi) system that uses
adaptive displays as directional signs. The GAUDI system was a prototype of a
pervasive way finding that is dynamic, adaptive and embedded in the building
environment. Each Gaudi display presents information regarding the name of the
event/destination, the direction the user has to follow and distance estimation between
the display and the destination. The key advantages of GAUDI are: support for
temporary events and capability that each display has to detect its new location and
orientation. The two main parts that compose the Gaudi system are: the navigation
Related work
Angelo Alves University of Minho 38
server (manages navigation information and publishes it in the displays) and the
arbitrary number of autonomous displays.
Hamhoum et al., (2012) introduced a prototype dynamical system in a realist
setting to support pilgrims in navigating one particular area. The goal was to investigate
how public displays can be used to reduce the crowdedness during the Tawaf ritual, by
helping the pilgrims remember how many times they have circled around the Ka’bah.
Due to the religious nature of the scenario the author presented three key requirements:
be usable by a large number of pilgrims, easy to learn and not interferer with the
spiritual task. After an initial proposal, an enhance solution was presented where the
display presents a single large circle that is subdivided into coloured wedges and a
central smaller circle. The wedges correspond to a group of people in specific areas and
have different colours facilitate recognition and differentiation.
Stahl et al., (2005) presented the REAL project that is focused in two particular
tasks: navigation and shopping in an airport scenario through public displays. In the
shopping task, the goal was to help the user achieve the best buying decision within a
limited time. The navigation assists the user to reach the desirable destination (macro
navigation) or focus the user attention to a given spot within the user perimeter (micro
navigation).
Hamhoum et al., (2008) investigated augmented signage as a mean to provide
personal navigation support for large crowds. The approach proposed in this work was
based on a spatial partitioning and a mapping of destinations to visual codes. The two
visual codes presented by the authors were: add coloured circles to items shown on
signs, and a combine symbols and colours (e.g. red heart). A study with 18 participants
was conducted to perceive which of the two solutions versus the traditional arrow
symbol was the most suitable. The parameters to perform the test were: timing,
usability, satisfaction, errors/disorientation, ease to use, learnability and workload. In
the end the participants were asked to rank which of the three designs they prefer and
the choice was: the colour one. Despite the good results attained, the authors pointed
two limitations: the lack of realism and crowdedness of the test environment.
Ojala et al., (2012) deployed 12 multi-propose interactive displays in 2009 at six
outdoor and six indoor spaces around Oulu, Finland. The work’s goal was to understand
how the users interact and derive value from the interactive displays that provide real
services based on real content during an extended period of time. The authors believe
that a long-term test enhances the value of any system comparatively to a short-term test
Related work
Angelo Alves University of Minho 39
with predefined task and users. The displays deployed can be used in passive broadcast
or interactive mode. In passive mode the display’s screen is totally used by the UBI
channel to present videos, animations and photos. The interactive mode is triggered
when a user touches the screen and the display slips its content between the UBI
channel and a customizable UBI portal. The portal contained 25 different services
divided in 7 categories: news, services, city, third party, fun & games, multimedia and
new cool stuff.
3.3. Chapter summary
In this chapter we presented the different types of location models available in
the literature. Based on this research we conclude that the type of coordinate used will
influence the choice of the location model, i.e. geometric coordinates impose a
geometric model, symbolic impose a symbolic model and the combination of both
coordinates impose a hybrid location model. Regarding the displays, we identified the
different uses of the displays in the literature along with the spatial requirements that
such uses impose. For example, we identified that some uses need the location,
orientation and the surrounding information of the display. Therefore, we identified the
need of a spatial model to characterize the spatial information of the displays. In the
following chapter we present in detail the spatial requirements and the display’s usage
patterns.

Related work
Angelo Alves University of Minho 40

Requirements
Angelo Alves University of Minho 41
4. Requirements
In this chapter we gather and identify the different types of public displays’
usage patterns. Each usage pattern clearly identifies how the displays are used to
perform a certain task, and how they relate with the others displays as well their
surroundings. Firstly, we start to describe the process that was followed to identify the
usage patterns and then each usage pattern is presented (section 4.1). Afterwards, based
on these patterns we identify the spatial requirements that were imposed not only to the
spatial model but also to the characterization of the displays (section 4.2). Each spatial
requirement is then described and possible solutions to attain the required information
are presented. Finally, based on the pros and cons of each of the proposed solution, the
solution that is going to be used in this work is presented.
Requirements
Angelo Alves University of Minho 42
4.1. Usage patterns
During the literature review one aim was to identify and gather the scenarios in
which the displays were used with some knowledge regarding their location, the
location of the others displays and the status of their surroundings, i.e. spatial
knowledge. Nevertheless, even though there were more scenarios, they were not
considered in this work as the displays were used without any spatial knowledge. After
gathering all the scenarios, we started to categorize the services that were using the
displays in terms of: how each type of service exploited the displays; which spatial
requirements were imposed; and how the displays related with the others
displays/surroundings. Based on this knowledge the different scenarios were arranged in
different groups. However, for this task to be completed, two intermediate steps were
performed. In the first step, we grouped the scenarios in a more embracing way, i.e. the
groups were merely formed based on how the displays were used by the services
without establishing any relation between the groups/services. The result was a vast
number of different groups. Still, after a careful look into the groups, it was perceived
that among the different groups the displays were in fact used in the same or similar
manner while imposing the same or very similar spatial requirements. These groups
were merged into one group. Regarding the groups in which the displays usage was
identified as a particular case of another group, they were added as a subtype of that
group. The groups resulting from the first arrangement were the following:
1. Content oriented 5. Position aware
1.1 Content’s scheduling 6. Spatial interaction
2. Spatially coordinated displays 7. Navigation assistance
2.1 Coordinated behaviour 7.1 Shopping assistance
3. Location based display discovery 7.2 Support crowds
4. Context aware 7.3 Dynamic solution
Nonetheless, after this first arrangement it was perceived that a second arrangement
would be needed because, despite the displays were used by different services we
identified that they were used in the same way to attain the same goals while imposing
the same spatial requirements. So, in the second step we decided that these groups
Requirements
Angelo Alves University of Minho 43
would be merged into one group. One good example of this arrangement is the shopping
assistance group, because apart from the shopping assistance that helps the users in
their buying decisions (which does not imposes any spatial requirement) the displays
were used to provide navigation assistance to reach the product’s location. Hence, the
shopping assistance group is just a particular case of the navigation and so it was
merged into the navigation group. The same standard was followed in the others groups
that were merged. The final groups are (! are the final groups, and " are the groups
that were merged):
! Location based displays
" Content oriented
" Content’s scheduling
" Context aware
! Spatial coordinated displays
" Spatially coordinated displays
" Coordinated behaviour
! Navigation
" Shopping assistance
" Support crowds
" Dynamic solution
! Spatial aware displays
" Position aware
" Spatial interaction
These were the final four groups that clearly identify the different types of
displays’ usage patterns. Moreover, each usage pattern clearly identifies how the
displays are used to perform a certain task (e.g. the navigation usage pattern clearly
identifies the displays that are used to provide navigation assistance). In the following
sections each usage patterns is presented and described in detail.
Requirements
Angelo Alves University of Minho 44
4.1.1. Location based displays
Location based displays, is the usage pattern that clearly identify the displays
that are used to disseminate content based on the displays’ location. This content can be
disseminated separately in time or space (José R. et al. (2006)) and it can be generated
in arbitrary or specific way (Storz O. et al. (2008)). When the content is separated in
time, it means that each display presents the content for a certain period of time that can
be synchronized among the displays involved. On the other hand, when the content is
separated in space, it means that the content is presented in the displays that are at
certain locations. The content’s generation can be performed in an arbitrary way (i.e. the
content is generated regardless who is passing near the display) or in a specific way (i.e.
the content is specifically generated to match its target personal interests). In the latter
case, based on the identity and/or location of the user (Madeira R. et al. (2010)) the
system generates specific content that matches the user' interests. The process that
controls how the content is presented – separated in time or space – and how it is
generated – in a specific or an arbitrary way – can be performed through a central entity
(typical broadcast model, one-to-many) or locally by the display (José R. et al. (2006)).
The displays are able to personalize themselves based on their current location, how
they are being used and based on the user’s location and identity (Ward A. et al.
(2002)). If the system is able to identify the user, the displays can be used to present
coded messages when the user is at certain locations or performing certain actions
(Strohbach M. et al. (2009)). Sign oriented displays (José R. et al. (2006)) besides
presenting traditional sign information are also used to present occasional location-
based announcements. The content can be schedule to be presented based on the
location of the displays and when the scheduling requirements are fulfilled. An example
of this is a store that, at the end of the day, wants to sell its surplus at lower prices. To
increase the number of people that knows about this price reduction, a scheduling
application can be used to schedule the time at which this information is presented and
to select the displays (based on their location) that will present this information.
Additionally, the displays can provide navigational assistance to reach the store.
Requirements
Angelo Alves University of Minho 45
4.1.2. Spatially coordinated displays
Spatially coordinated displays is the usage pattern that clearly identifies all the
displays that are used to present the content in coordinated ways (Storz O. et al. (2008)).
Contrarily to the previous usage pattern that only required the location of the displays,
in this case the location of the displays relatively to the location of the other displays is
required. The displays involved in the coordinated interaction can be used in a
sequential or simultaneous way. If the displays are simultaneously used, it means that
they are used at the same time to present the content, e.g. in an emergency scenario the
displays are simultaneously used to present the emergency information at the same time.
Contrarily, if the displays are sequentially used, it means that different displays are used
at different times to present the content, e.g. during a navigation service, the displays
are used in sequence as the navigation information is only presented in the display that
is near the user. Based on the display’s location the system is able to interact and
integrate the displays in a coordinate manner. Even though some displays are able to
control their integration level to operate in isolation, if required (José R. et al. (2006)), it
is assumed that the system is able to suppress their integration control level to integrate
them in the coordinated interaction if required. Besides being used to present content in
coordinated ways, the displays can also be used to collectively process the surrounding
information and to act as a more user-friendly front-end service (Strohbach M. et al.
(2009)).
4.1.3. Navigation
Navigation is the usage pattern that defines all the displays that are used to assist
the users in their search for a suitable path to reach their destination (Kray C. et al.
(2008)). The challenge is to provide an effective navigation at indoor spaces, such as
airports (Stahl C. et al. (2005)), universities, hospitals and office buildings (Kray C. et
al. (2005)). When the user types the destination, the service immediately starts to
calculate the most suitable path. The path calculation is performed through way-
findings algorithms that are supported by the location model (Kray C. et al. (2008)).
During the path’s calculation any special requirement is taken into account, e.g. if a user
cannot use stairs (e.g. handicap user), a path with elevator or ramp is provided. When
the path is calculated, the information is presented in the display near the user or in the
user’s Smartphone (Strohbach M. et al. (2009)). If the Smartphone is used, firstly it
Requirements
Angelo Alves University of Minho 46
needs to synchronize with the system (Strohbach M. et al. (2009)). Furthermore, if
during the path the system or the user identifies any change or issue in the surroundings
(e.g. locked door) an alternative path is automatically and dynamically calculated and
provided. Besides requiring the display’s location and the location of the other displays
as the previous usages patterns, this usage pattern requires the displays’ surroundings
status. This status enables the display to perceive its surroundings and adapt the
navigational information if required (e.g. if a path is blocked, an alternative one is
provided).
Gaudi (Kray C. et al. (2005)) is an example of a navigation system, which
purpose is to assist the visitors, students and staff in their navigation around the
Lancaster University campus. Each Gaudi display, besides presenting directional
information, provides information regarding the destination or event. Sign oriented
displays (José R. et al. (2006)) present short pieces of information, such as directions to
a given destination.
Shopping assistance is a particular case of navigation, because apart from
assisting the users to achieve the best buying decision (Stahl C. et al. (2005)), the
displays are used to provide navigation. If the user pretends to see a product, he can
activate the navigation service to reach that product‘s location. The navigation stops
when the user reaches it (Strohbach M. et al. (2009)), or when he reaches a checkout
point or manually by the user.
Support crowds’ is another particular case of navigation, which the goal is to
provide assistance and useful information to everyone in crowed situations. In these
situations it is crucial to keep everyone calm, safe and ensure that everyone follows the
same orders, with the aim of avoiding disorder. At Ka’ba (Hamhoum F. et al. (2012))
the displays are used to help the pilgrims to keep on track the number of rounds they
have performed around Ka’ba. Each pilgrim has to perform seven complete rounds and
with the help of the displays, the pilgrims know exactly how many rounds they have
performed. Therefore, no unnecessary rounds are performed.
4.1.4. Spatially aware displays
Spatial aware displays is the usage pattern that defines the displays that are
aware of what is happening in their surroundings, are able to identify when their
location and orientation changes (Kray C. et al. (2005)), tune their content base on how
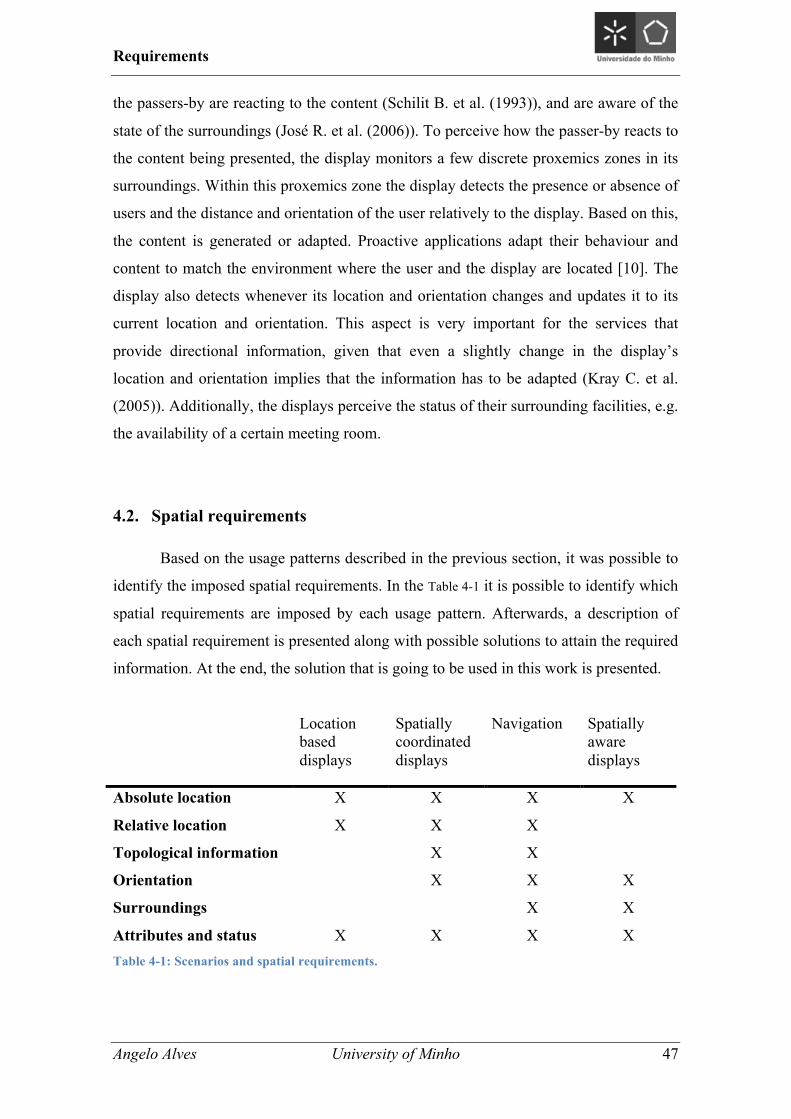
Requirements
Angelo Alves University of Minho 47
the passers-by are reacting to the content (Schilit B. et al. (1993)), and are aware of the
state of the surroundings (José R. et al. (2006)). To perceive how the passer-by reacts to
the content being presented, the display monitors a few discrete proxemics zones in its
surroundings. Within this proxemics zone the display detects the presence or absence of
users and the distance and orientation of the user relatively to the display. Based on this,
the content is generated or adapted. Proactive applications adapt their behaviour and
content to match the environment where the user and the display are located [10]. The
display also detects whenever its location and orientation changes and updates it to its
current location and orientation. This aspect is very important for the services that
provide directional information, given that even a slightly change in the display’s
location and orientation implies that the information has to be adapted (Kray C. et al.
(2005)). Additionally, the displays perceive the status of their surrounding facilities, e.g.
the availability of a certain meeting room.
4.2. Spatial requirements
Based on the usage patterns described in the previous section, it was possible to
identify the imposed spatial requirements. In the Table 4-1 it is possible to identify which
spatial requirements are imposed by each usage pattern. Afterwards, a description of
each spatial requirement is presented along with possible solutions to attain the required
information. At the end, the solution that is going to be used in this work is presented.
Location based displays
Spatially coordinated displays
Navigation Spatially aware displays
Absolute location X X X X
Relative location X X X
Topological information X X
Orientation X X X
Surroundings X X
Attributes and status X X X X Table 4-1: Scenarios and spatial requirements.
Requirements
Angelo Alves University of Minho 48
4.2.1. Absolute location
The absolute location defines the displays’ location through absolute values (e.g.
WGS841 latitude, longitude and elevation) and references (e.g. street name, building
name, address, etc.). Due to the variety of different services’ types and needs, different
levels of accuracy, precision and resolution are imposed and required. To certain
services it might be enough to know that a display is located in a certain street (low
resolution), while other services require the exact location in that street (high
resolution). For example, the navigation service requires a high level of accuracy and
precision, because an error of a few meters in the display’s location might be enough to
provide incorrect navigational information. On the contrary, to other services, the same
few meters error is not critical and the information being provided is still correct.
Therefore, the absolute location has to be generated and provided in a way that matches
the different requests of the different services.
To define the absolute location, three types of coordinates can be used:
geometric, symbolic or hybrid coordinates. Through the geometric coordinates it is
possible to attain fine-grained location information, directly calculate the distance
between locations and establish relations – interception, overlapping and containment –
between areas. The location is defined as a set of coordinate values that are defined in
the coordinate referential system (can be either global or local) being used. Contrarily,
symbolic coordinates provide coarse-grained location information and the distance
between locations along with the relation between areas cannot be determined without
further information. The location is defined as an address (e.g. a street or building
name) or as a set of abstract ideas; in this case no coordinate referential system is
required. Hybrid coordinates combine both geographic and symbolic coordinates. The
location can be either defined by using both coordinates (e.g. the display is in the street
w at latitude x and longitude y) or just by using one of the coordinates (e.g. the most
suitable). When both coordinates are used, a mechanism to translate between
geographic and symbolic coordinates is required. An example of such translation
mechanism is the one used by the navigational systems - such as NDrive, Tomtom and
Google Maps – in which the address typed is translated to its corresponding set of
geographic coordinates in order to perform the path calculation. Since the display’s
1 World Geodetic System – dating from 1984 and last revised in 2004 2 Quick Response Code 3 Near Field Communication

Requirements
Angelo Alves University of Minho 49
location can change, the system and/or the display have to identify that change and
update it to the new location of the display.
Given the capability to provide high levels of location accuracy and precision,
along with its worldwide availability, the GPS is one of the proposed solutions to define
the display’s absolute location through geographic coordinates. The GPS uses the
WGS84 global coordinate referential system where the latitude, longitude and elevation
values define the display’s location. Nonetheless, the GPS has a huge drawback as it
can only be used at outdoor spaces where the GPS receiver is able to connect with the
satellites. Since the displays can be placed at indoor spaces, the GPS alone is not a
feasible solution. Therefore, to achieve the display’s location at indoor spaces through
geographic coordinates, an alternative solution is a digital representation of the
floor/building plan in a local coordinate referential system (e.g. 2D or 3D model of the
floor/building). However, this approach is very complex and time consuming, because it
is necessary to create and maintain the digital representation of the floors/building
plans. Another possible solution is through the Wi-Fi and/or mobile networks. The
Google’s location service uses the Wi-Fi and/or mobile network cells Ids and signal
power to perform calculations and determine the location. Therefore, by using the
Google Maps API it is possible to retrieve the WGS84 geographic coordinates, visualize
the computed location in the map and manually adjust the location if required. The
disadvantage of this approach is that requires connection to the Internet (either through
the mobile or Wi-Fi network), and the computed location is, sometimes, far from the
actual location. However, nowadays, it is possible to connect to the Internet almost
anywhere and if the computed location is not correct the user can manually adjust it to
the correct location. The advantages of this approach are: it can be used in both outdoor
and indoor spaces because it just requires a connection to the Internet rather than a
connection to the satellites; the calculations are promptly performed and it is possible to
translate between geographic and symbolic coordinates.
The symbolic coordinates defines the location as an address (e.g. the display is
at the street s, building x, 4th floor) and it can be either used at indoor and outdoor
spaces. The symbolic approach has the advantage of being easier for the user to
memorize and specify an address rather than a set of geographic coordinates. But the
accuracy, precision and resolution are inferior comparatively to the previous proposed
solutions. The symbolic information may be attained through the Google Places,
Foursquare, Facebook, etc. APIs. These systems have in their databases millions of
Requirements
Angelo Alves University of Minho 50
places that are linked with their corresponding geometric location’s information.
Therefore, by using their APIs a geometric coordinate is translated to its corresponding
space name (if there is a space in that coordinate). Another approach is to
use/define/implement a symbolic world model that stores the spaces where the display
can be located. Contrarily to the previous system, the symbolic model detailed
information of the space is also defined (i.e. the number of floor, rooms, areas, etc.).
In summary, it is possible to conclude that if the display is at an outdoor space,
its location can be effectively defined either by geographic coordinates (GPS and Wi-Fi
and/or Cellular network) or by symbolic coordinates (an address). At indoor spaces the
display’s location can be effectively defined through symbolic coordinates, by
combining the street name, the name and/or door number of the indoor space and the
location within that indoor space (e.g. building’s floor, wings). Since the focus of this
work is to define a unique solution that is suitable for both indoor and outdoor spaces,
the solution that is going to be used defines the display absolute location through hybrid
coordinates, i.e. combines the geographic and symbolic coordinates. The display’s
geographic coordinates are acquired through the Wi-Fi and mobile data network
(Google’s location service) and the Google Maps API is used to retrieve the latitude and
longitude values, presents them in the map and enables the user to adjust the location.
The symbolic coordinates regarding the indoor space are attained through the Baras K.
et al. (2001) symbolic world model (as presented in the Chapter 3).
4.2.2. Relative location
The relative location defines the display’s location by establishing relations
between the display and the surrounding key elements. For example, the relative
location of a display can be defined as being at the left of room x, right of room y, front
of room z, back of the exit. While the left, right, front and back are the relations, the
rooms and the exit are the surrounding key elements. At outdoor spaces it is possible to
automatically determine some of the surrounding key elements through the POI (points
of interests available in the digital maps). However, it might be required to manually
define some key elements that are not considered as POI or are not available in the POI
list. On the other hand, at indoor spaces the system might be able to identify and
provide all the key elements that are mandatory and/or near to the display, otherwise
they have to be manually defined. Depending on the type/importance of the key
Requirements
Angelo Alves University of Minho 51
elements, some are defined as mandatory while others are defined as optional. The ones
defined as mandatory, have to be obligatorily defined during the display’s registration
(e.g. at indoor spaces, an exit and emergency exit are examples of mandatory elements).
The near key elements are complementary, in the sense that they are not obligatory but
they should be defined to enrich the spatial model (e.g. the rooms that are close to the
display). To define the relations between the key elements and the displays, there are
two possible approaches that can be followed. One is performed automatically, i.e. the
system is able to identify the display’s location relatively to the location of the key
elements thus the relations are automatically established. For example, at outdoor
spaces through the digital map and geographic coordinates the system is able to perform
calculations and determine the relations. At indoor spaces, if the system has a 2D or 3D
digital representation of the space, the relations between the display and the key
elements can be established automatically. If a display is placed in the same or much
approximated location of a known display, the relations of this new display can be
inferred. The other approach is to manually establish the relations between the elements
and the display.
Despite being better, the automatically approach has a huge drawback because it
requires a digital representation of the space to establish the relations. If it is true that at
outdoor spaces there is such representation (digital map), the same is not valid for all
the indoor spaces. Therefore, since the goal is to define a solution that is suitable for
both indoor and outdoor spaces, the solution that is going to be used is the manual one.
4.2.3. Topological information for the display’s environment
The topological information retrieves not only the displays that are at a given
direction relatively to the location of a given display but also the displays that are
located around of a given display. For example, a display might want to know which
displays are around him (i.e. at its front, back, left, right, top, bottom, etc.). Through this
information the display can interact in novel ways with the other displays. An example
of such interaction is a set of displays that are being used to advertise a new Tennis ball
and the goal is to pass the ball between the displays in a coordinated manner. In other
words, if the ball moves to the right of the display, then the ball is passed to the display
that is at the right of that display. Therefore, all the involved displays need to know the
Requirements
Angelo Alves University of Minho 52
direction of the others displays relatively to its location, in order to know to which
display the ball has to be passed.
To attain this information two possible approaches can be followed: one is
automatically through calculations, and the other is manually. By performing
calculations over the geometric coordinates, the direction in which a given display is
relatively to another display is determined. The result of the calculations determines not
only the direction between the displays, but also the distance between them. Contrarily,
in the manual approach the directions are manually defined. A display is selected and
then the directions of the other displays are defined. Additionally a notion of distance
between the displays can also be defined. For example, a display that has three displays
in its surroundings generates the following information “display x, right, 5meters”,
“display y, left, 7meters” and “display z, front, 9 meters”. However, as more and more
displays are added and these relations are established, the system will be able to
establish some relations automatically. For instance, if the relations between two
displays are defined and if a new display is placed between them, the system is able to
automatically establish the relations between the three displays. Since the location of the
displays can change, when that occurs the relations need to be redefined or recalculated.
4.2.4. Display orientation
The display’s orientation provides the orientation and the direction in which the
display is faced. By knowing this information, it is possible to determine if the content
being presented is or is not visible by its target. For example, let’s consider a display
that is located in a corridor that instead of being faced to the inside it is faced to the
outside (a corridor with glass walls). Despite being located in the corridor, this display
cannot be used to present content to the people passing in the corridor, because only the
people in the outside will be able to see the content. For this reason, this information has
a strong impact in how the content is generated and in the display(s)’s selection to
present the content. Therefore, this information is crucial to identify in which direction
the display is faced, and based on that, decide if that display can be used to present the
content, i.e. if it is visible to its target. The display’s orientation defines if the display is
horizontally, vertically, landscape, portrait, etc. orientated. This information is required
because depending on how the display is oriented the content might need to be adjusted
before being presented. For example, some applications adapt their content depending
Requirements
Angelo Alves University of Minho 53
on how the display is oriented, i.e. if it is in portrait or landscape orientation. The
display’s orientation can be attained through a manual approach where a set of different
orientation stages is presented and the user selects the correct one. For instance, it is
presented a set of buttons, each one defining an orientation stage and the user just needs
to press the one that corresponds to the display’s orientation. An automatic approach
that relies on the sensors of any mobile device can also be used. Nowadays, almost
every mobile device is equipped with sensors that are able to determine the orientation
of the device, examples of such sensor are the: accelerometer, gyroscope and
magnetometer. The accelerometer measures the acceleration force in m/s2 that is applied
to a device on all three physical axes (x, y, and z), including the force of gravity. The
magnetometer measures the ambient geomagnetic field for all three physical axes (x, y,
z) in µT. The gyroscope measures a device's rate of rotation in rad/s around each of the
three physical axes (x, y, and z). Therefore, if the user places the mobile devices in the
display orientated in the same way as the display is, the display’s orientation is inferred
through the mobile device.
The manual approach has the advantage of being easy to use and easy to
implement. However, it also presents some limitations: restricts the number of
orientation stages, requires a management of the orientation stages (i.e. add or remove
orientation stages), and the interpretation of the stages might differ from user to user.
On the other hand, the automatic approach has the advantage of attaining the orientation
automatically, no user interaction is required, and so the orientation is always correctly
determined. But this approach is more difficult to implement because it requires
programming the sensors and processing the returned values. After analysing the
advantages and disadvantages of each approach, we are going to follow the automatic
approach in this work. Further, the sensor that we are going to use to infer the display’s
orientation is the accelerometer sensor, because it is the most commonly sensor
available in almost every mobile device.
4.2.5. Display surroundings
The surrounding information translates the state of the world to the display(s)
and system. Within this proxemics zone the display and the system detect the state of
the display’s surroundings, i.e. is aware of what is occurring in the proximities of the
display. For example, when a display identifies that the state of its surroundings
Requirements
Angelo Alves University of Minho 54
changed to an emergency condition, it proactively generates and presents specific
emergency content. Another example, in a navigation service if the display perceives a
change in the path (e.g. a door that now is locked) it adapts the navigational content, i.e.
provides an alternative path. Therefore, based on this information the display and the
system are able to generate specific content, adapt de content being presented and
choose how the information is provided. For example, at noisy places the display can
choose to provide the information in text form rather than in audio form, since it is most
likely that the user will not hear it. Furthermore, the surrounding information can also
be used for others purposes, for instance, the display can choose to turn off the screen or
reduce its brightness if there is no activity occurring or there is no one in the
surroundings.
To sense the surroundings, it is required an infrastructure of sensors that are
continuously sensing. The type and number of sensors that are required to effectively
perform this task is out of the scope of this work. However, a low delay should be
guaranteed between what is happening in the surroundings and when the sensor senses
it and the display/system perceives it.
4.2.6. Display attributes and status
It is most likely that the network possesses different displays with diverse
attributes. Therefore, it is important to identify the specific attributes of each display in
order to better adapt and generate the content to match the display’s attributes, as well
as to provide a better user experience. Such attributes consist on the: screen size,
connectivity interfaces, sound capability, input methods, etc. These attributes are
defined when the display is added to the network. However, if the attributes are
associated with the display brand and model when an equal display (same brand and
model) is added to the network, the attributes can be automatically loaded. On the
contrary, the status translates the display’s real state i.e. if the display is turned on/off, if
the display encounters any error/bug situation, the display’s load level along with other
relevant status information. If it is true that the attributes of the display are static - they
do not change overtime - the same is not valid for the status information. For instance,
when the display encounters an error situation its status changes to ErrorStatus(e.g.)
and when the error is solved its status changes to OkStatus(e.g.).
Requirements
Angelo Alves University of Minho 55
4.3. Chapter summary
In this chapter we identified four types of display usage patterns: Location based
displays, Spatially coordinated displays, Navigation and Spatially aware displays.
Besides identifying how the displays are used to perform their task, it was also provided
the information to identify the required spatial information. The Table 4-1 presented the
spatial information that each usage pattern imposed. The identified spatial requirements
were: absolute location, relative location, topological information for the displays
environment, display’s orientation, display’s surroundings, and display’s attributes and
status. The absolute location defines the display’s location by combining the geometric
and symbolic coordinates while the relative location defines the location of the
surrounding key elements relatively to the display location. The topological information
retrieves the displays that are at a given direction relatively to the location of a given
display. The orientation information defines if the display is horizontally, vertically
landscape or vertically portrait oriented, whereas the attribute and status information
provide the display’s status, i.e. if they are working correctly. Though these spatial
requirements we are able to identify the modules needed by our solution to collect that
information.

Requirements
Angelo Alves University of Minho 56
System architecture
Angelo Alves University of Minho 57
5. System architecture
Before presenting the solution developed to generate and gather the spatial
information required to perform the display’s registration, the assumptions and the
modules of that solution are presented. The assumptions were made due to the
complexity of this work and to the lack of time to implement everything required by our
solution. For each assumed part, a description of its role and required functionalities is
performed (section 5.1). However, despite being assumed, some of these parts were in
fact implemented in order to evaluate our solution. Afterwards, based on the spatial
requirements gathered in the chapter 4 we identified the needed modules for our
solution (section 5.2.). Each module is responsible to generate specific spatial
information, but together these modules gather all the required spatial information to
perform a successful registration. At the end, a summary of this chapter is presented
(section 5.3).
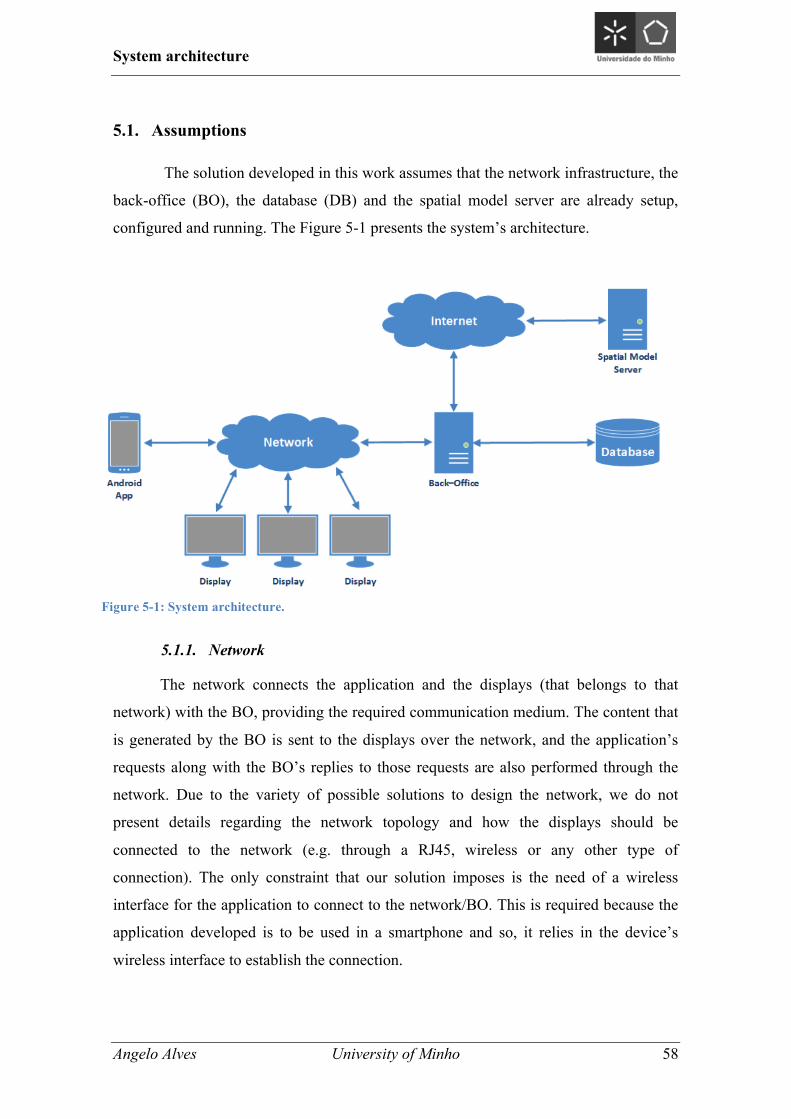
System architecture
Angelo Alves University of Minho 58
5.1. Assumptions
The solution developed in this work assumes that the network infrastructure, the
back-office (BO), the database (DB) and the spatial model server are already setup,
configured and running. The Figure 5-1 presents the system’s architecture.
5.1.1. Network
The network connects the application and the displays (that belongs to that
network) with the BO, providing the required communication medium. The content that
is generated by the BO is sent to the displays over the network, and the application’s
requests along with the BO’s replies to those requests are also performed through the
network. Due to the variety of possible solutions to design the network, we do not
present details regarding the network topology and how the displays should be
connected to the network (e.g. through a RJ45, wireless or any other type of
connection). The only constraint that our solution imposes is the need of a wireless
interface for the application to connect to the network/BO. This is required because the
application developed is to be used in a smartphone and so, it relies in the device’s
wireless interface to establish the connection.
Figure 5-1: System architecture.
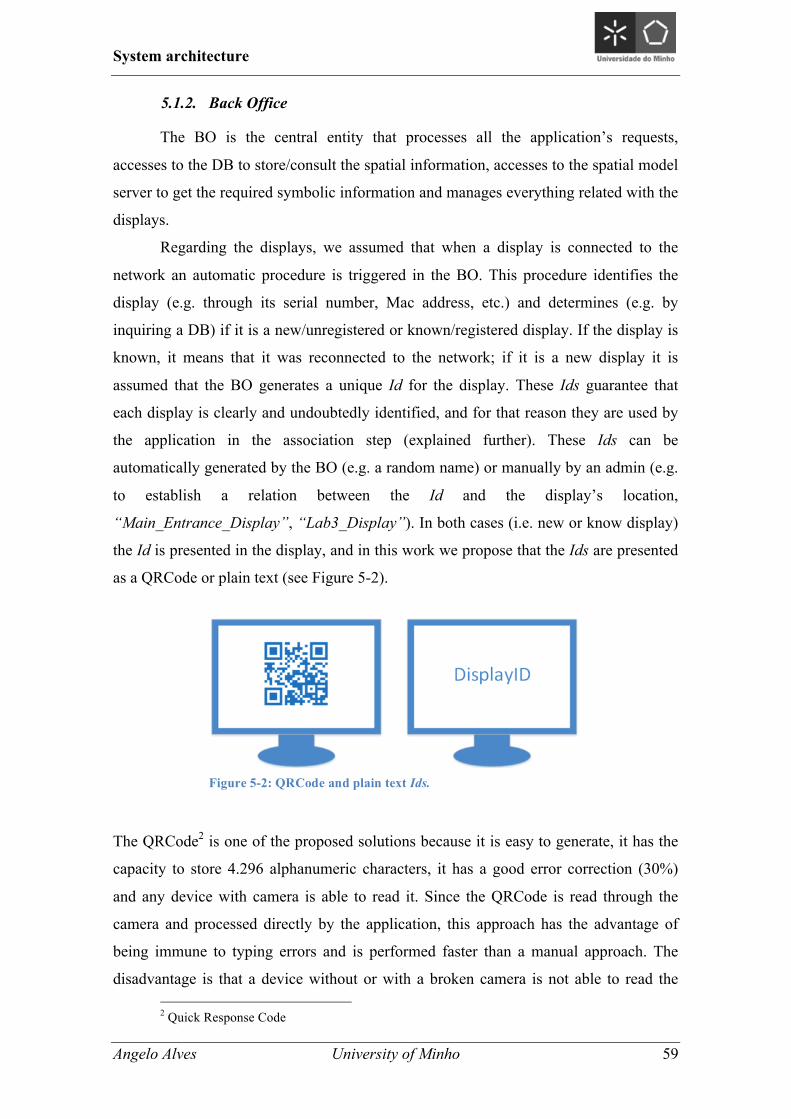
System architecture
Angelo Alves University of Minho 59
5.1.2. Back Office
The BO is the central entity that processes all the application’s requests,
accesses to the DB to store/consult the spatial information, accesses to the spatial model
server to get the required symbolic information and manages everything related with the
displays.
Regarding the displays, we assumed that when a display is connected to the
network an automatic procedure is triggered in the BO. This procedure identifies the
display (e.g. through its serial number, Mac address, etc.) and determines (e.g. by
inquiring a DB) if it is a new/unregistered or known/registered display. If the display is
known, it means that it was reconnected to the network; if it is a new display it is
assumed that the BO generates a unique Id for the display. These Ids guarantee that
each display is clearly and undoubtedly identified, and for that reason they are used by
the application in the association step (explained further). These Ids can be
automatically generated by the BO (e.g. a random name) or manually by an admin (e.g.
to establish a relation between the Id and the display’s location,
“Main_Entrance_Display”, “Lab3_Display”). In both cases (i.e. new or know display)
the Id is presented in the display, and in this work we propose that the Ids are presented
as a QRCode or plain text (see Figure 5-2).
The QRCode2 is one of the proposed solutions because it is easy to generate, it has the
capacity to store 4.296 alphanumeric characters, it has a good error correction (30%)
and any device with camera is able to read it. Since the QRCode is read through the
camera and processed directly by the application, this approach has the advantage of
being immune to typing errors and is performed faster than a manual approach. The
disadvantage is that a device without or with a broken camera is not able to read the 2 Quick Response Code
Figure 5-2: QRCode and plain text Ids.
System architecture
Angelo Alves University of Minho 60
code. The plain text is the most traditional approach where the Id is presented as regular
text. Contrarily to the QRCode, this approach is not immune to typing errors and it
requires more time to be performed (depending on how fast the user types the Id), but it
has the advantage that it can be performed in any device with or without a camera.
However, other approaches can be used to identify the display (e.g. NFC3). The BO
manages the displays’ status. The status indicates whenever a display is working
properly or encountered an error, and this information is crucial to identify the displays
that are working properly and in conditions to present the content, or need to be
fixed/replaced.
The BO also manages the displays’ spatial information that is stored in the DB
(i.e. inserts the generated spatial information into the DB) and consults/retrieves the
spatial information when required. Likewise, it is the BO that attains the symbolic
information from the spatial model server. Once this server is hosted at the University
of Minho, it is accessed over the Internet through a HTTP connection. When the
application requires any information from symbolic world model, the requests are
performed through the BO, i.e. the application sends a request to the BO then the BO
inquires the spatial model server and returns the result to the application. Therefore, the
BO has to follow the API4 defined by the application developed in this work (explained
further). The API defines how the application and the BO interact with each other, i.e.
defines the type of requests that the application can perform and how the BO has to
reply to those requests. Hence, regardless how the BO is implemented in each solution,
the only thing that has to be ensured is that fallows the application’s API.
Despite being one of the assumed parts, we developed a BO in order to evaluate
the application. The BO was implemented in Java but only with the functionalities
required to interact with the application (i.e. follows it’s API), DB and spatial model
server. The procedures to identify and generate the Ids for the displays, control their
status and generate/send the content to the displays were not implemented (it is assumed
that they are already implemented).
3 Near Field Communication 4 Application Programming Interface
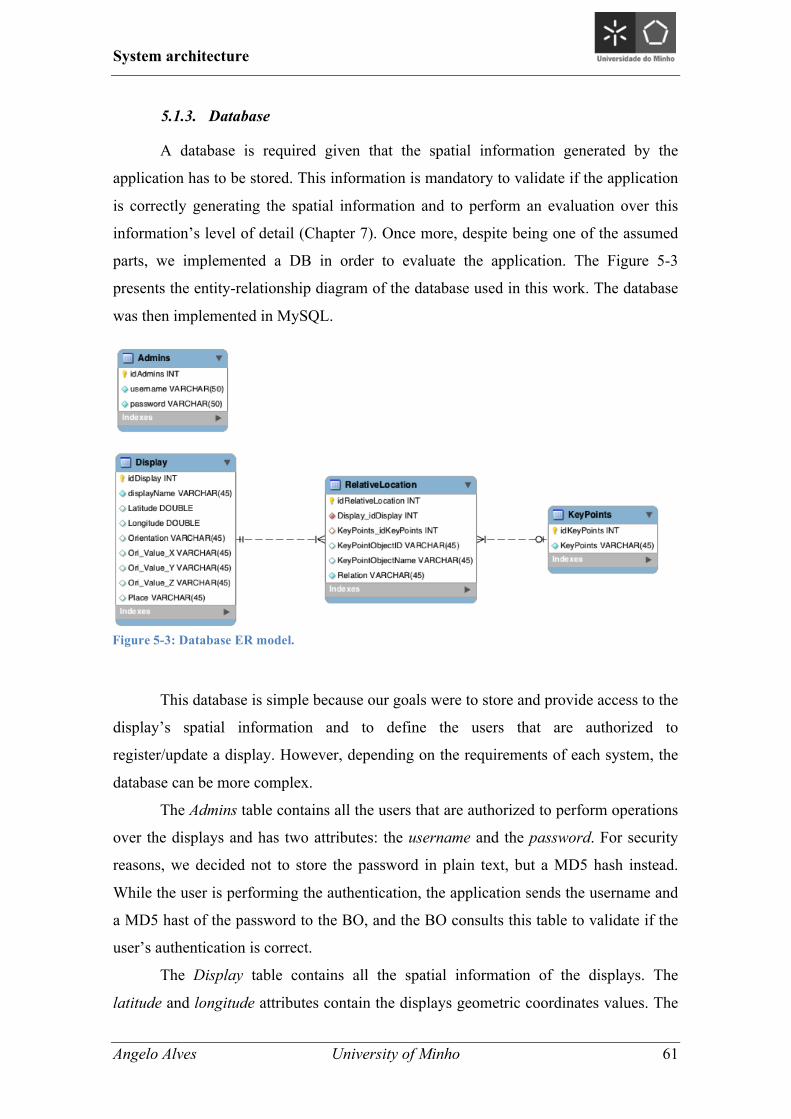
System architecture
Angelo Alves University of Minho 61
5.1.3. Database
A database is required given that the spatial information generated by the
application has to be stored. This information is mandatory to validate if the application
is correctly generating the spatial information and to perform an evaluation over this
information’s level of detail (Chapter 7). Once more, despite being one of the assumed
parts, we implemented a DB in order to evaluate the application. The Figure 5-3
presents the entity-relationship diagram of the database used in this work. The database
was then implemented in MySQL.
This database is simple because our goals were to store and provide access to the
display’s spatial information and to define the users that are authorized to
register/update a display. However, depending on the requirements of each system, the
database can be more complex.
The Admins table contains all the users that are authorized to perform operations
over the displays and has two attributes: the username and the password. For security
reasons, we decided not to store the password in plain text, but a MD5 hash instead.
While the user is performing the authentication, the application sends the username and
a MD5 hast of the password to the BO, and the BO consults this table to validate if the
user’s authentication is correct.
The Display table contains all the spatial information of the displays. The
latitude and longitude attributes contain the displays geometric coordinates values. The
Figure 5-3: Database ER model.
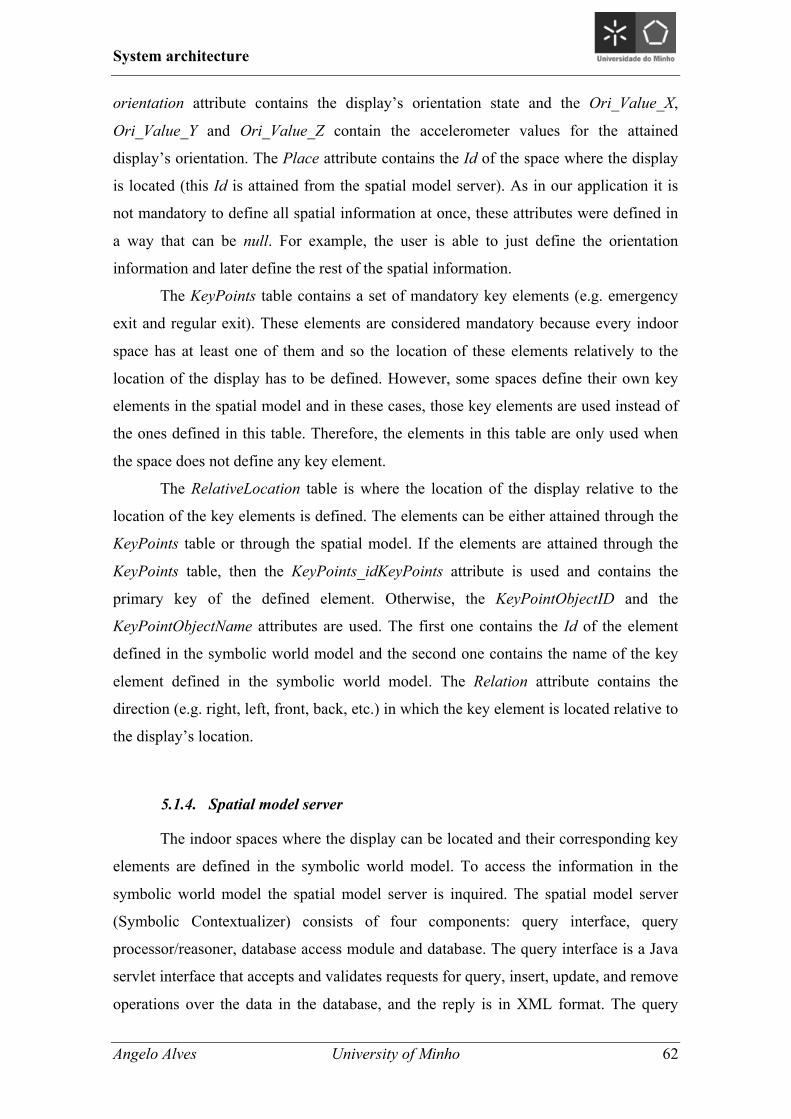
System architecture
Angelo Alves University of Minho 62
orientation attribute contains the display’s orientation state and the Ori_Value_X,
Ori_Value_Y and Ori_Value_Z contain the accelerometer values for the attained
display’s orientation. The Place attribute contains the Id of the space where the display
is located (this Id is attained from the spatial model server). As in our application it is
not mandatory to define all spatial information at once, these attributes were defined in
a way that can be null. For example, the user is able to just define the orientation
information and later define the rest of the spatial information.
The KeyPoints table contains a set of mandatory key elements (e.g. emergency
exit and regular exit). These elements are considered mandatory because every indoor
space has at least one of them and so the location of these elements relatively to the
location of the display has to be defined. However, some spaces define their own key
elements in the spatial model and in these cases, those key elements are used instead of
the ones defined in this table. Therefore, the elements in this table are only used when
the space does not define any key element.
The RelativeLocation table is where the location of the display relative to the
location of the key elements is defined. The elements can be either attained through the
KeyPoints table or through the spatial model. If the elements are attained through the
KeyPoints table, then the KeyPoints_idKeyPoints attribute is used and contains the
primary key of the defined element. Otherwise, the KeyPointObjectID and the
KeyPointObjectName attributes are used. The first one contains the Id of the element
defined in the symbolic world model and the second one contains the name of the key
element defined in the symbolic world model. The Relation attribute contains the
direction (e.g. right, left, front, back, etc.) in which the key element is located relative to
the display’s location.
5.1.4. Spatial model server
The indoor spaces where the display can be located and their corresponding key
elements are defined in the symbolic world model. To access the information in the
symbolic world model the spatial model server is inquired. The spatial model server
(Symbolic Contextualizer) consists of four components: query interface, query
processor/reasoner, database access module and database. The query interface is a Java
servlet interface that accepts and validates requests for query, insert, update, and remove
operations over the data in the database, and the reply is in XML format. The query
System architecture
Angelo Alves University of Minho 63
processor/reasoner is a Java class that processes the query interface, requests and
generates the corresponding XML responses. In this module, all the algorithms and the
methods for retrieving the information from the URLs stored in the object attribute
values are implemented. The database access module is where the SQL statements that
allow the querying and the editing of the model are implemented (it abstracts the access
to the database). Lastly, the database contains the symbolic world model and in the
version used in this work a MySQL database managements system was used. The
spatial model server is accessible through the following link:
http://local.dsi.uminho.pt:8080/sc2/SCTX and the three types of queries and their
respective operations are the following:
• Get
o an object by its name;
o an object by its Id;
o an object by the value of one of its attributes;
o an object by its type;
o all the existing types of objects and their frequencies;
o all objects having a given relation;
o all objects having the same author.
• Insert
o an object;
o an attribute;
o a relation;
o a relation attribute.
• Delete
o one relation;
o all relation attributes of a relation.
There is an additional parameter, infer, that takes values 0 to 3 that indicates the query’s
level of inference.
• infer=0: no inference;
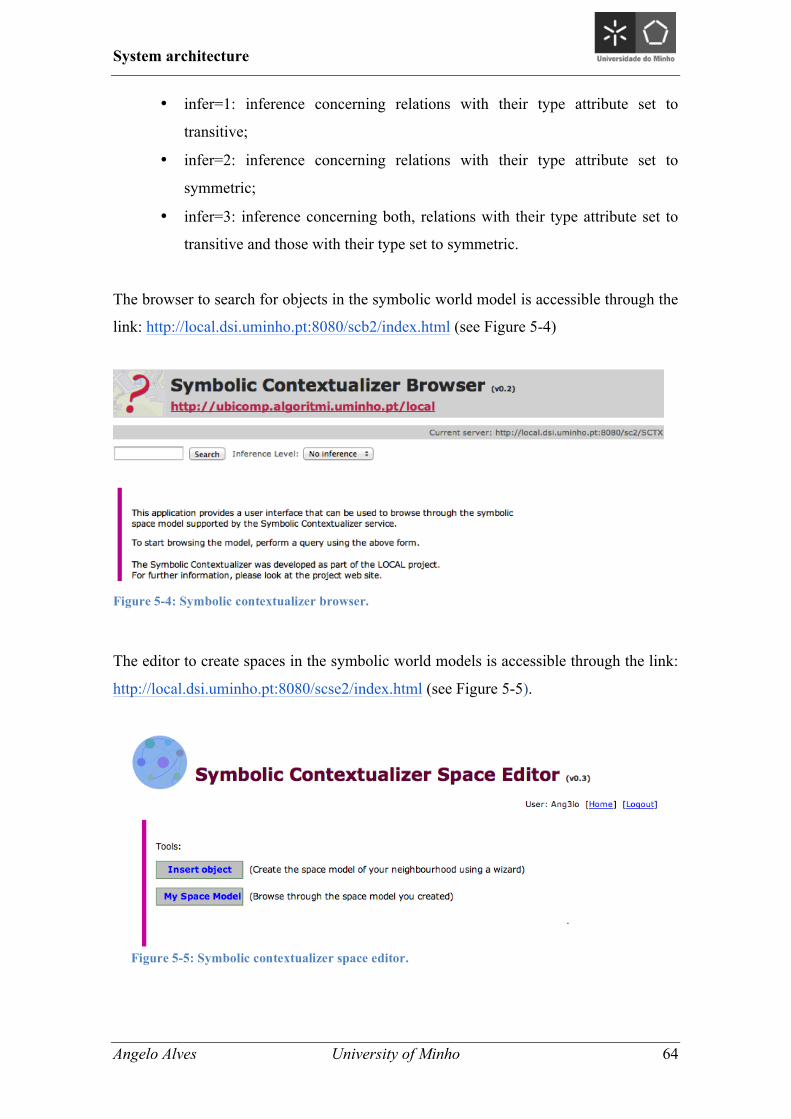
System architecture
Angelo Alves University of Minho 64
• infer=1: inference concerning relations with their type attribute set to
transitive;
• infer=2: inference concerning relations with their type attribute set to
symmetric;
• infer=3: inference concerning both, relations with their type attribute set to
transitive and those with their type set to symmetric.
The browser to search for objects in the symbolic world model is accessible through the
link: http://local.dsi.uminho.pt:8080/scb2/index.html (see Figure 5-4)
The editor to create spaces in the symbolic world models is accessible through the link:
http://local.dsi.uminho.pt:8080/scse2/index.html (see Figure 5-5).
Figure 5-4: Symbolic contextualizer browser.
Figure 5-5: Symbolic contextualizer space editor.
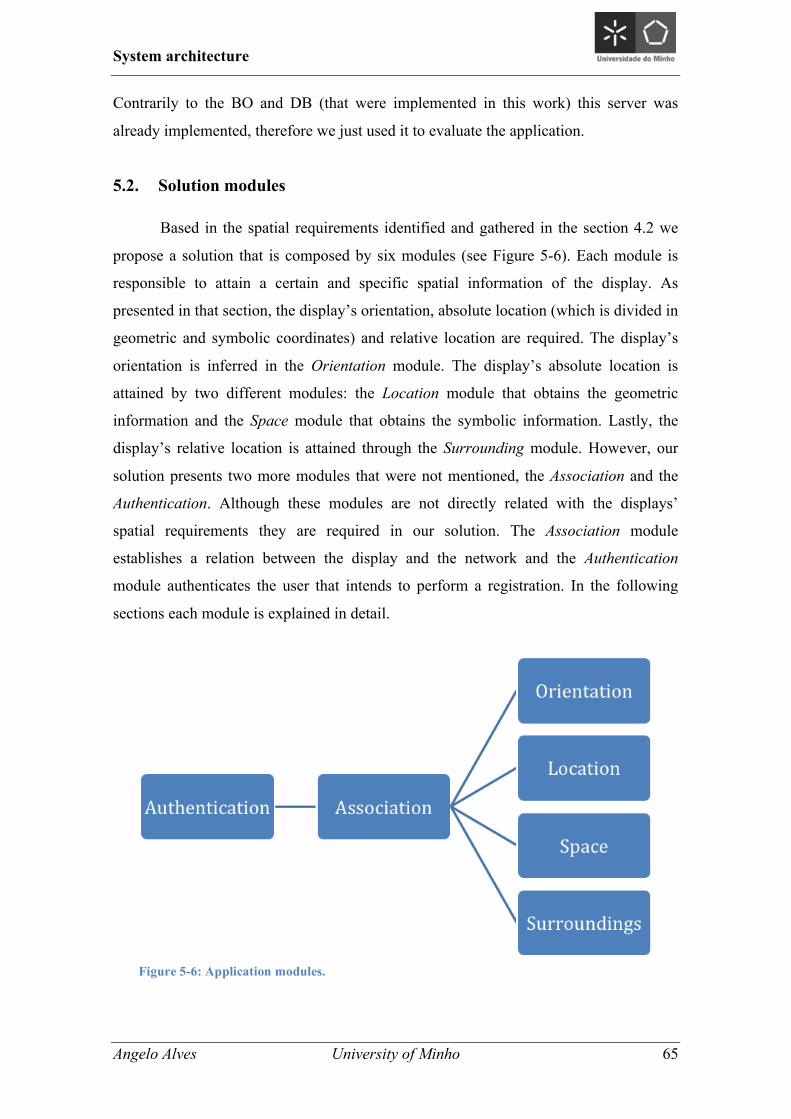
System architecture
Angelo Alves University of Minho 65
Contrarily to the BO and DB (that were implemented in this work) this server was
already implemented, therefore we just used it to evaluate the application.
5.2. Solution modules
Based in the spatial requirements identified and gathered in the section 4.2 we
propose a solution that is composed by six modules (see Figure 5-6). Each module is
responsible to attain a certain and specific spatial information of the display. As
presented in that section, the display’s orientation, absolute location (which is divided in
geometric and symbolic coordinates) and relative location are required. The display’s
orientation is inferred in the Orientation module. The display’s absolute location is
attained by two different modules: the Location module that obtains the geometric
information and the Space module that obtains the symbolic information. Lastly, the
display’s relative location is attained through the Surrounding module. However, our
solution presents two more modules that were not mentioned, the Association and the
Authentication. Although these modules are not directly related with the displays’
spatial requirements they are required in our solution. The Association module
establishes a relation between the display and the network and the Authentication
module authenticates the user that intends to perform a registration. In the following
sections each module is explained in detail.
Figure 5-6: Application modules.
System architecture
Angelo Alves University of Minho 66
5.2.1. Authentication
As the displays are intended to be placed at some critical spaces (such as
airports, hospitals, schools, universities, offices, etc.) it is crucial to guarantee that only
authorized and capable users can perform the displays’ registration. Otherwise,
unauthorized displays or displays with incorrect/inaccurate spatial information might be
registered in those spaces. To avoid or at least to mitigate these issues we propose this
authentication module in which the user has to provide his credentials (i.e. his username
and password) before starting the display’s registration. If the credentials are correct the
user can register and collect the display’s spatial information, if they are not the user is
not able to perform the registration and new credentials are requested. In summary, only
after this module is successfully performed the user can start to collect the spatial
information of the display.
5.2.2. Association
In the Association module the display (that is going to be registered) and the
network (in which the display is connected) are associated. This association ensures that
the correct display is registered in the correct network and for this reason it is
mandatory, i.e. the other modules are not executed until the association is successfully
performed. The display is identified through the Id generated by the back-office when it
is connected to the network and the network is identified through the back-office IP
address. Since each back-office manages a specific network, its IP address can be used
to identify the network. Both of these Ids guarantee that each display and each network
are clearly and undoubtedly identified. However, these two Ids are requested in two
different phases. In the first phase the network’s Id is requested to validate the BO, i.e.
to confirm if it is the correct network and BO to where the information has to be sent.
To validate the network our solution relies on the network domain information. When
the connection with the BO is established the BO returns the network domain
information and so, the network is validated. If it is the correct network, the second
phase starts and the display’s Id is requested. As presented in the section 5.1.2, we
propose two approaches to present the display’s Id, which were the QRCode and the
plain text. Therefore, our solution provides the required methods to identify the display
in both approaches. When the network and the display are correctly identified and
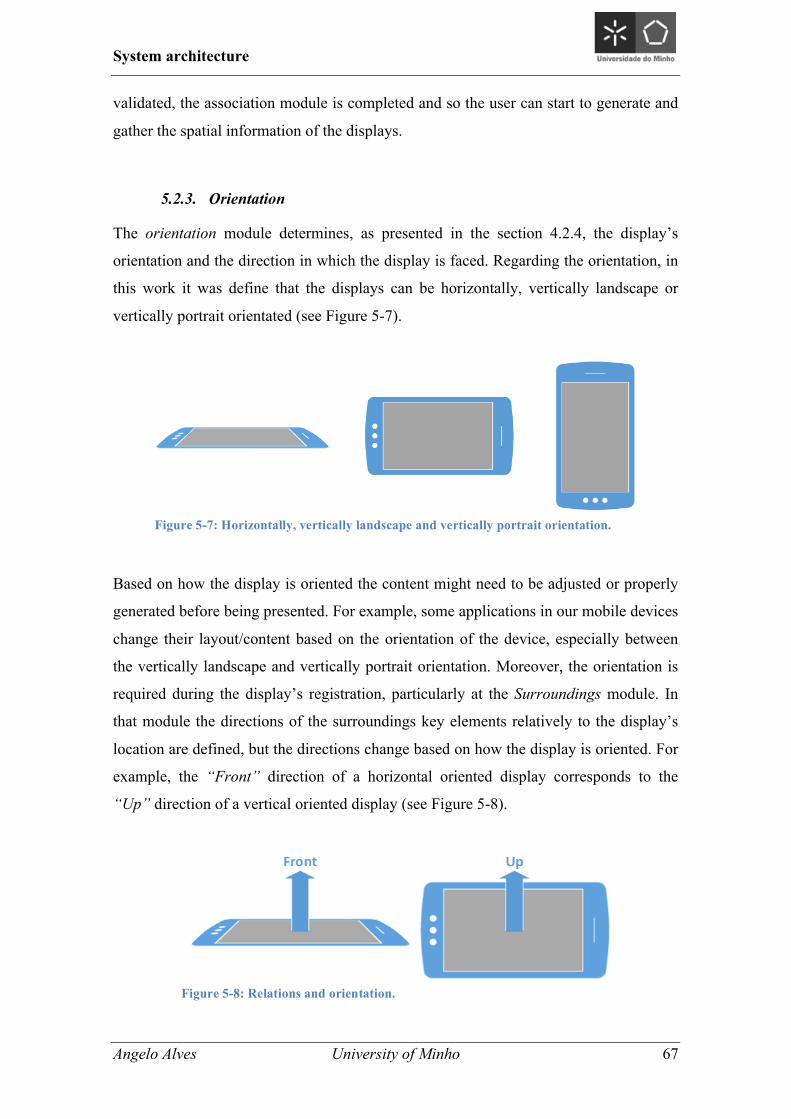
System architecture
Angelo Alves University of Minho 67
validated, the association module is completed and so the user can start to generate and
gather the spatial information of the displays.
5.2.3. Orientation
The orientation module determines, as presented in the section 4.2.4, the display’s
orientation and the direction in which the display is faced. Regarding the orientation, in
this work it was define that the displays can be horizontally, vertically landscape or
vertically portrait orientated (see Figure 5-7).
Based on how the display is oriented the content might need to be adjusted or properly
generated before being presented. For example, some applications in our mobile devices
change their layout/content based on the orientation of the device, especially between
the vertically landscape and vertically portrait orientation. Moreover, the orientation is
required during the display’s registration, particularly at the Surroundings module. In
that module the directions of the surroundings key elements relatively to the display’s
location are defined, but the directions change based on how the display is oriented. For
example, the “Front” direction of a horizontal oriented display corresponds to the
“Up” direction of a vertical oriented display (see Figure 5-8).
Figure 5-7: Horizontally, vertically landscape and vertically portrait orientation.
Figure 5-8: Relations and orientation.
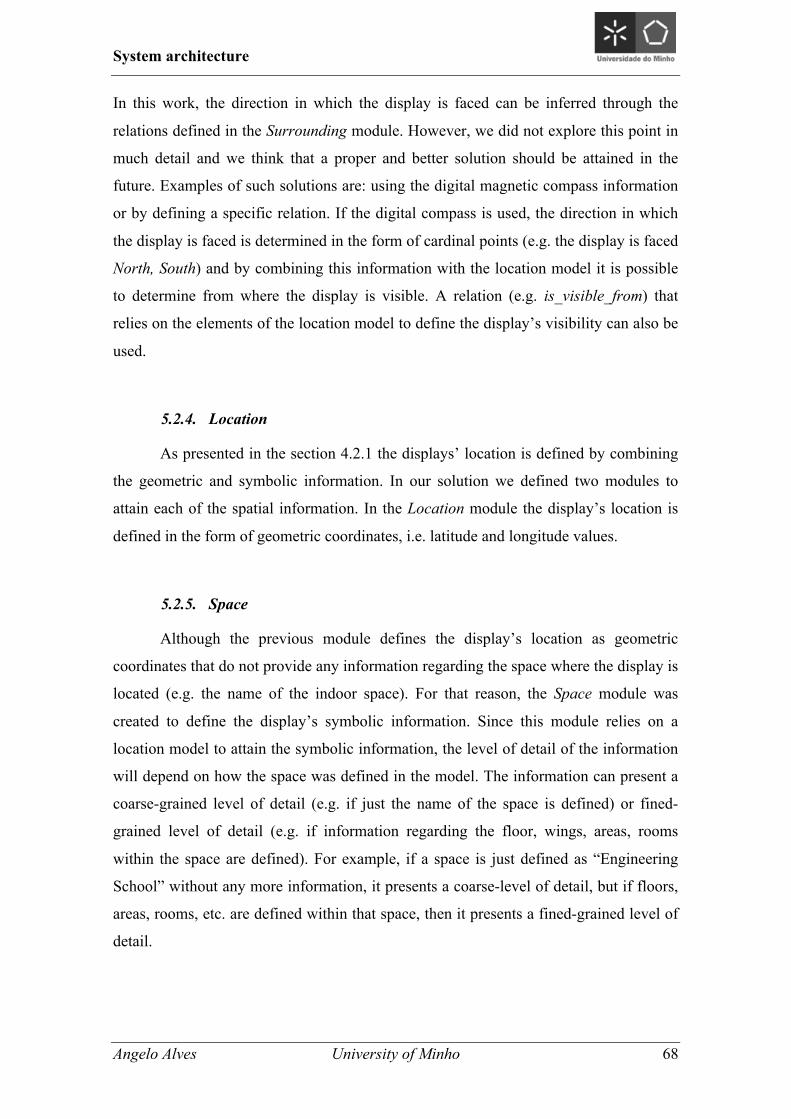
System architecture
Angelo Alves University of Minho 68
In this work, the direction in which the display is faced can be inferred through the
relations defined in the Surrounding module. However, we did not explore this point in
much detail and we think that a proper and better solution should be attained in the
future. Examples of such solutions are: using the digital magnetic compass information
or by defining a specific relation. If the digital compass is used, the direction in which
the display is faced is determined in the form of cardinal points (e.g. the display is faced
North, South) and by combining this information with the location model it is possible
to determine from where the display is visible. A relation (e.g. is_visible_from) that
relies on the elements of the location model to define the display’s visibility can also be
used.
5.2.4. Location
As presented in the section 4.2.1 the displays’ location is defined by combining
the geometric and symbolic information. In our solution we defined two modules to
attain each of the spatial information. In the Location module the display’s location is
defined in the form of geometric coordinates, i.e. latitude and longitude values.
5.2.5. Space
Although the previous module defines the display’s location as geometric
coordinates that do not provide any information regarding the space where the display is
located (e.g. the name of the indoor space). For that reason, the Space module was
created to define the display’s symbolic information. Since this module relies on a
location model to attain the symbolic information, the level of detail of the information
will depend on how the space was defined in the model. The information can present a
coarse-grained level of detail (e.g. if just the name of the space is defined) or fined-
grained level of detail (e.g. if information regarding the floor, wings, areas, rooms
within the space are defined). For example, if a space is just defined as “Engineering
School” without any more information, it presents a coarse-level of detail, but if floors,
areas, rooms, etc. are defined within that space, then it presents a fined-grained level of
detail.
System architecture
Angelo Alves University of Minho 69
5.2.6. Surroundings
In the Surroundings module the directions of the surrounding key elements
relatively to the display’s location are defined. The key elements are achieved either
through the location model or the database. If the space where the display is located
defines its key elements in the location model, then this module uses those key
elements. Otherwise, the elements defined in the database (KeyPoints table) are used.
5.3. Chapter summary
In this chapter we presented the assumptions in which our solution relies, that
were the network, back-office, database and spatial model server. The spatial model
server was the only assumption that was already implemented. The indoor spaces
needed throughout this work were added to the symbolic world model therefore, when
the application requires information regarding those indoor spaces this server has to be
consulted. To obtain the information from the symbolic world model our solution had to
follow the API defined by the spatial model server. On the other hand, all the other
assumptions were implemented in this work. The database was implemented in
MySQL, the BO in Java and an ad-hoc network was created to connect the application
and the BO. Others systems might use a different architecture with different
assumptions, but we believe that these are the minimum and recommended parts.
Based in the spatial requirements identified in the section 4.2 we also presented
the modules of our solution. Each of these modules attains and gathers specific spatial
information and in our opinion, together these modules gathered all the information
need to perform a successfully display’s registration.

System architecture
Angelo Alves University of Minho 70
Application
Angelo Alves University of Minho 71
6. Application
So far we presented the spatial requirements that are needed to register a display
(Chapter 4), and the assumptions and the modules of our proposed solution (Chapter 5).
In this chapter we explain how our solution was implemented in order to generate and
gather those spatial requirements. From the beginning of this work we intended to
develop a mobile application, i.e. an application to be used in a smartphone. This
decision was made due to the highly smartphones’ proliferation, their increasing
processing power capability, their sensors, their interfaces (e.g. Wi-Fi and GPS), their
mobility, etc. In summary, nowadays smartphones are like portable mini computers.
Currently, there are two major operating systems in the smartphone’s world, Android
OS (Google) and IOS (Apple). We selected the Android OS to implement our solution
because some of the previous work developed in our working-group was already
developed in Android. The Android programming language is Java based and so, it uses
objects and follows the same Java good programming practices. This chapter starts with
the dependencies implied by our application in order to work as expected (section 6.1),
how the connection with the server is performed (section 6.2) and the permissions that
are required (section 6.3). The following section presents how each module (presented
in the section 5.2) was implemented. In the end of the chapter a summary is presented
(section 6.9).
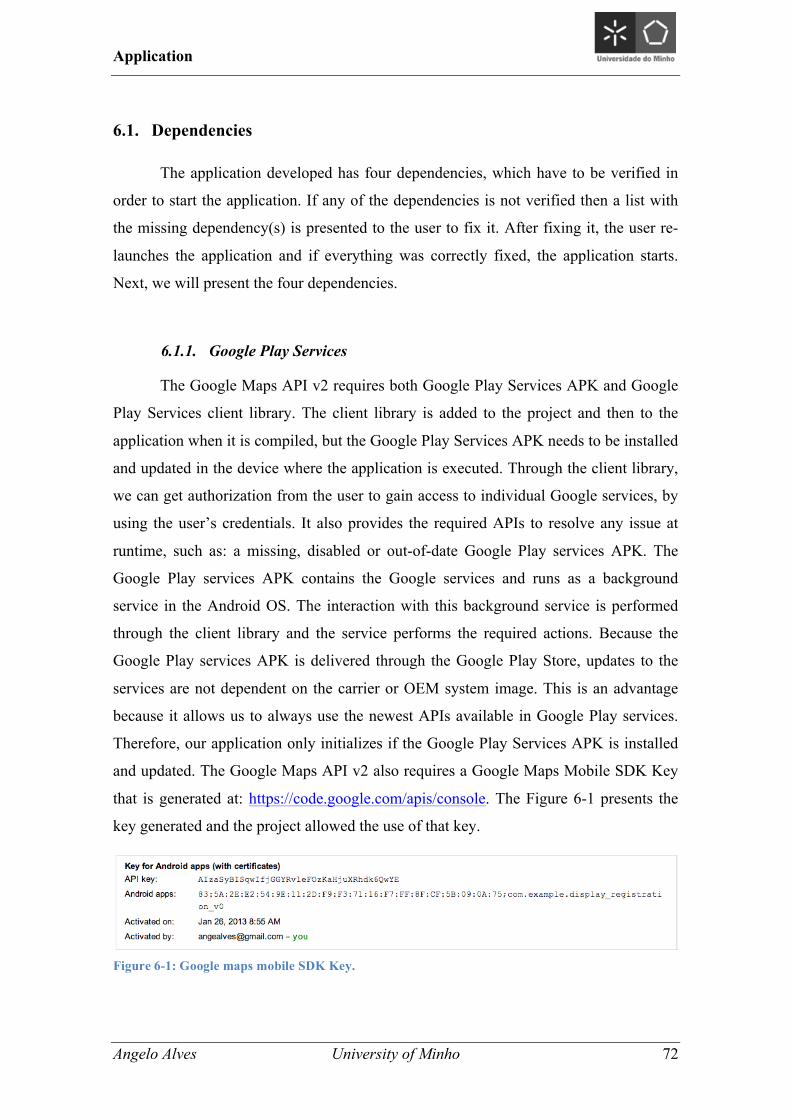
Application
Angelo Alves University of Minho 72
6.1. Dependencies
The application developed has four dependencies, which have to be verified in
order to start the application. If any of the dependencies is not verified then a list with
the missing dependency(s) is presented to the user to fix it. After fixing it, the user re-
launches the application and if everything was correctly fixed, the application starts.
Next, we will present the four dependencies.
6.1.1. Google Play Services
The Google Maps API v2 requires both Google Play Services APK and Google
Play Services client library. The client library is added to the project and then to the
application when it is compiled, but the Google Play Services APK needs to be installed
and updated in the device where the application is executed. Through the client library,
we can get authorization from the user to gain access to individual Google services, by
using the user’s credentials. It also provides the required APIs to resolve any issue at
runtime, such as: a missing, disabled or out-of-date Google Play services APK. The
Google Play services APK contains the Google services and runs as a background
service in the Android OS. The interaction with this background service is performed
through the client library and the service performs the required actions. Because the
Google Play services APK is delivered through the Google Play Store, updates to the
services are not dependent on the carrier or OEM system image. This is an advantage
because it allows us to always use the newest APIs available in Google Play services.
Therefore, our application only initializes if the Google Play Services APK is installed
and updated. The Google Maps API v2 also requires a Google Maps Mobile SDK Key
that is generated at: https://code.google.com/apis/console. The Figure 6-1 presents the
key generated and the project allowed the use of that key.
Figure 6-1: Google maps mobile SDK Key.
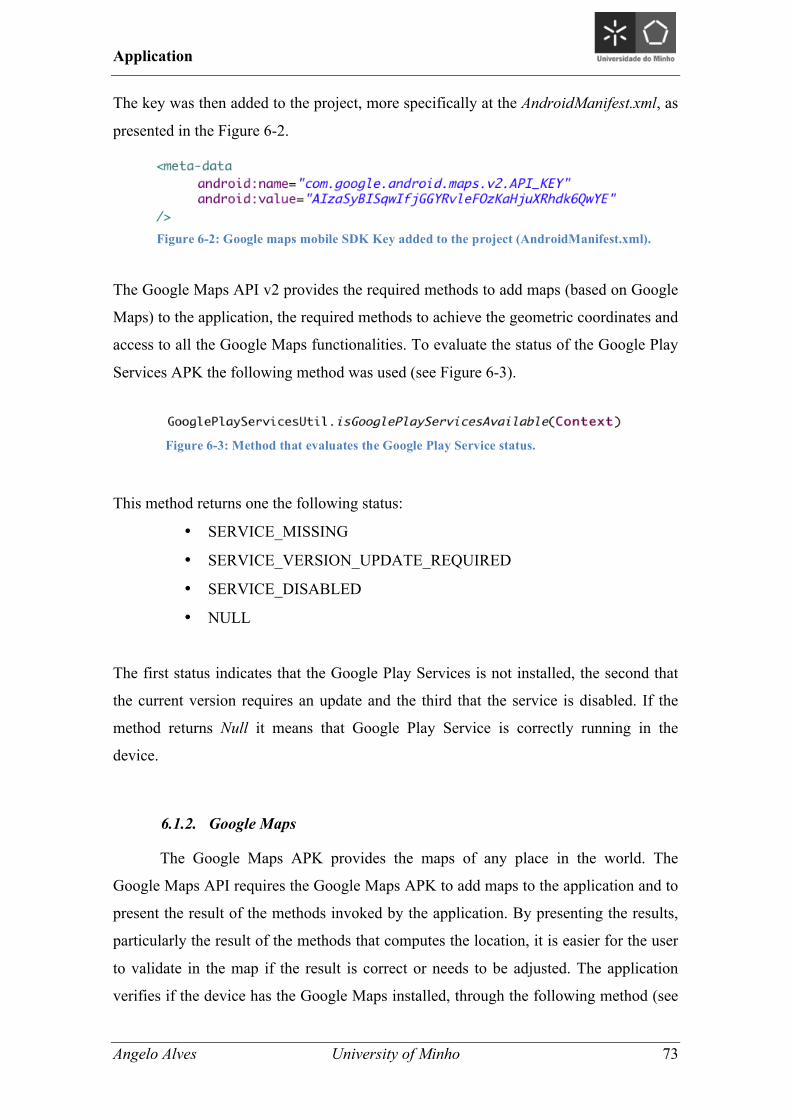
Application
Angelo Alves University of Minho 73
The key was then added to the project, more specifically at the AndroidManifest.xml, as
presented in the Figure 6-2.
The Google Maps API v2 provides the required methods to add maps (based on Google
Maps) to the application, the required methods to achieve the geometric coordinates and
access to all the Google Maps functionalities. To evaluate the status of the Google Play
Services APK the following method was used (see Figure 6-3).
This method returns one the following status:
• SERVICE_MISSING
• SERVICE_VERSION_UPDATE_REQUIRED
• SERVICE_DISABLED
• NULL
The first status indicates that the Google Play Services is not installed, the second that
the current version requires an update and the third that the service is disabled. If the
method returns Null it means that Google Play Service is correctly running in the
device.
6.1.2. Google Maps
The Google Maps APK provides the maps of any place in the world. The
Google Maps API requires the Google Maps APK to add maps to the application and to
present the result of the methods invoked by the application. By presenting the results,
particularly the result of the methods that computes the location, it is easier for the user
to validate in the map if the result is correct or needs to be adjusted. The application
verifies if the device has the Google Maps installed, through the following method (see
Figure 6-2: Google maps mobile SDK Key added to the project (AndroidManifest.xml).
Figure 6-3: Method that evaluates the Google Play Service status.
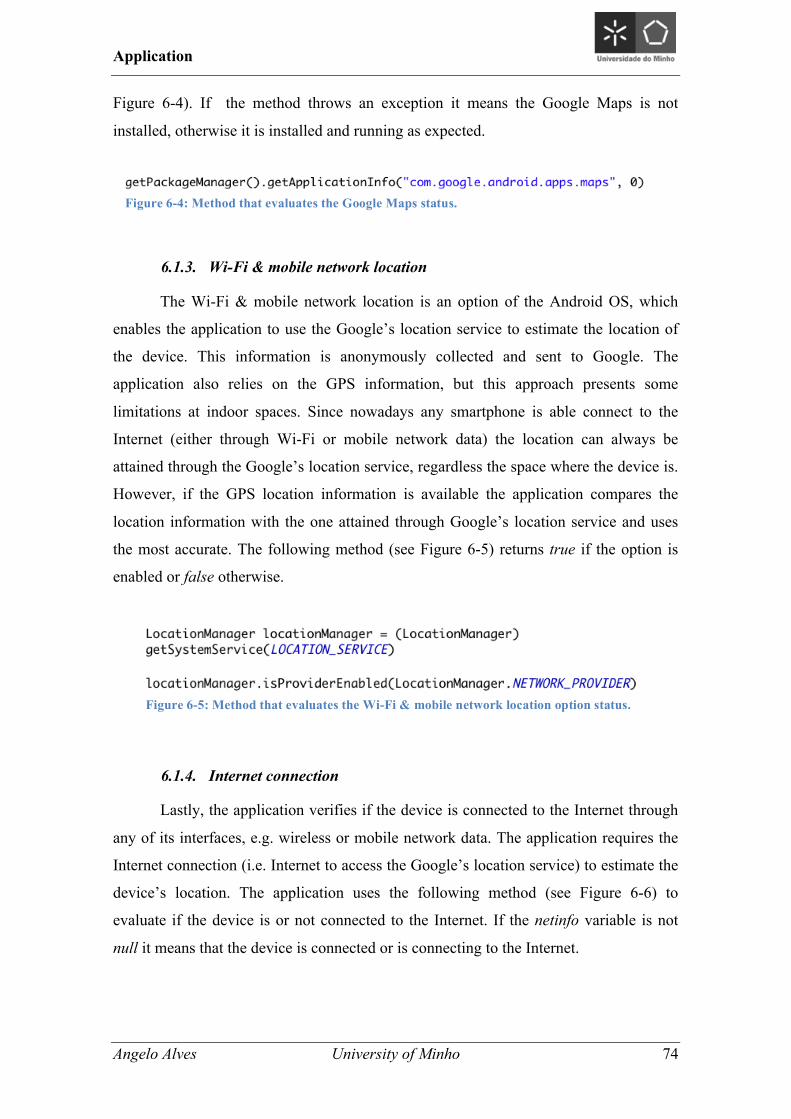
Application
Angelo Alves University of Minho 74
Figure 6-4). If the method throws an exception it means the Google Maps is not
installed, otherwise it is installed and running as expected.
6.1.3. Wi-Fi & mobile network location
The Wi-Fi & mobile network location is an option of the Android OS, which
enables the application to use the Google’s location service to estimate the location of
the device. This information is anonymously collected and sent to Google. The
application also relies on the GPS information, but this approach presents some
limitations at indoor spaces. Since nowadays any smartphone is able connect to the
Internet (either through Wi-Fi or mobile network data) the location can always be
attained through the Google’s location service, regardless the space where the device is.
However, if the GPS location information is available the application compares the
location information with the one attained through Google’s location service and uses
the most accurate. The following method (see Figure 6-5) returns true if the option is
enabled or false otherwise.
6.1.4. Internet connection
Lastly, the application verifies if the device is connected to the Internet through
any of its interfaces, e.g. wireless or mobile network data. The application requires the
Internet connection (i.e. Internet to access the Google’s location service) to estimate the
device’s location. The application uses the following method (see Figure 6-6) to
evaluate if the device is or not connected to the Internet. If the netinfo variable is not
null it means that the device is connected or is connecting to the Internet.
Figure 6-4: Method that evaluates the Google Maps status.
Figure 6-5: Method that evaluates the Wi-Fi & mobile network location option status.
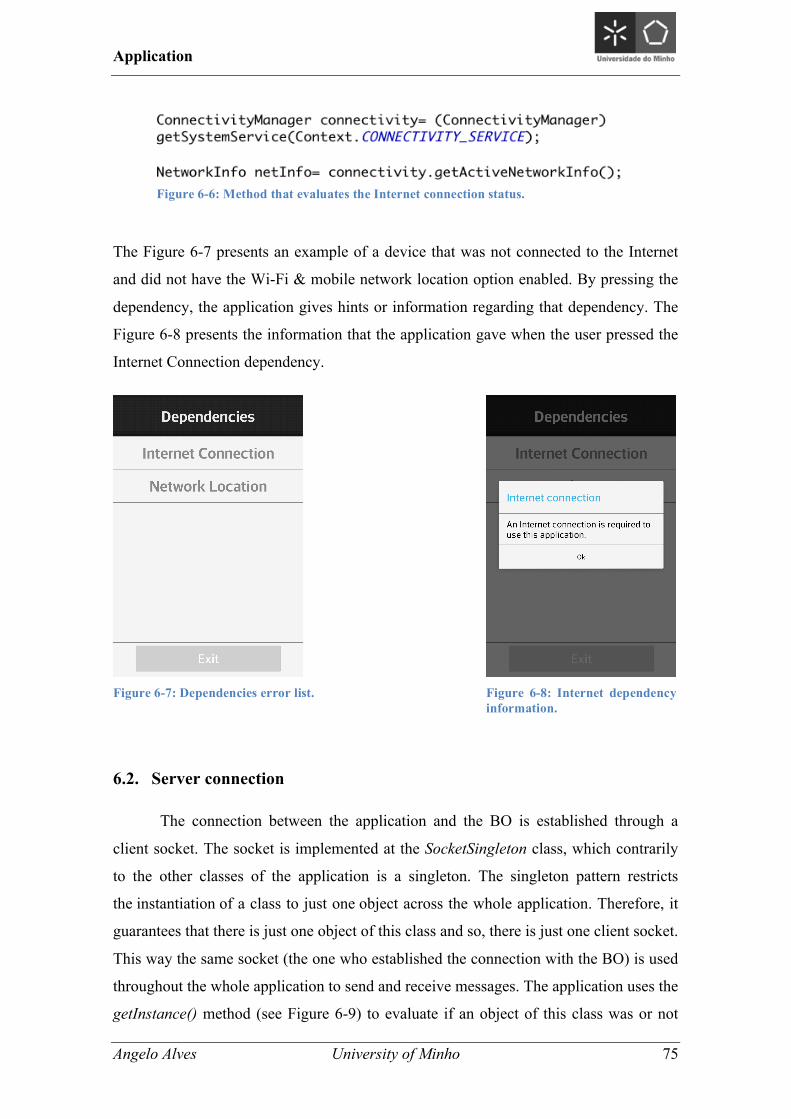
Application
Angelo Alves University of Minho 75
The Figure 6-7 presents an example of a device that was not connected to the Internet
and did not have the Wi-Fi & mobile network location option enabled. By pressing the
dependency, the application gives hints or information regarding that dependency. The
Figure 6-8 presents the information that the application gave when the user pressed the
Internet Connection dependency.
6.2. Server connection
The connection between the application and the BO is established through a
client socket. The socket is implemented at the SocketSingleton class, which contrarily
to the other classes of the application is a singleton. The singleton pattern restricts
the instantiation of a class to just one object across the whole application. Therefore, it
guarantees that there is just one object of this class and so, there is just one client socket.
This way the same socket (the one who established the connection with the BO) is used
throughout the whole application to send and receive messages. The application uses the
getInstance() method (see Figure 6-9) to evaluate if an object of this class was or not
Figure 6-6: Method that evaluates the Internet connection status.
Figure 6-7: Dependencies error list. Figure 6-8: Internet dependency information.
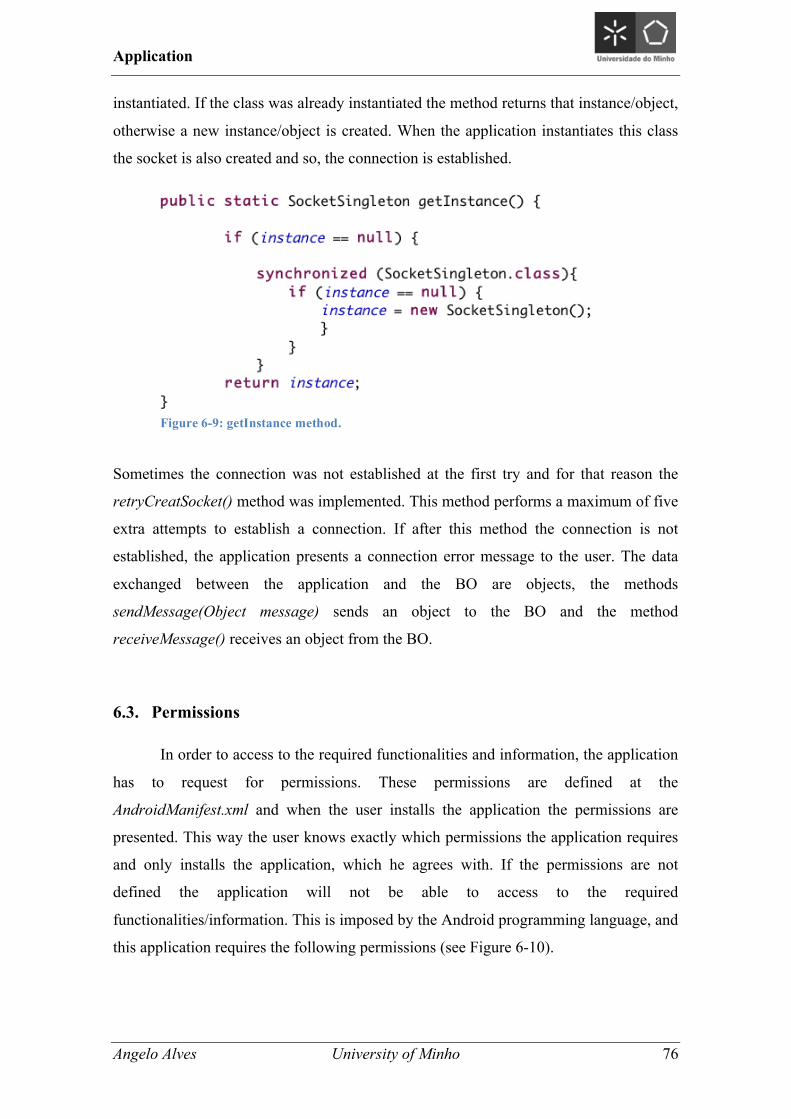
Application
Angelo Alves University of Minho 76
instantiated. If the class was already instantiated the method returns that instance/object,
otherwise a new instance/object is created. When the application instantiates this class
the socket is also created and so, the connection is established.
Sometimes the connection was not established at the first try and for that reason the
retryCreatSocket() method was implemented. This method performs a maximum of five
extra attempts to establish a connection. If after this method the connection is not
established, the application presents a connection error message to the user. The data
exchanged between the application and the BO are objects, the methods
sendMessage(Object message) sends an object to the BO and the method
receiveMessage() receives an object from the BO.
6.3. Permissions
In order to access to the required functionalities and information, the application
has to request for permissions. These permissions are defined at the
AndroidManifest.xml and when the user installs the application the permissions are
presented. This way the user knows exactly which permissions the application requires
and only installs the application, which he agrees with. If the permissions are not
defined the application will not be able to access to the required
functionalities/information. This is imposed by the Android programming language, and
this application requires the following permissions (see Figure 6-10).
Figure 6-9: getInstance method.
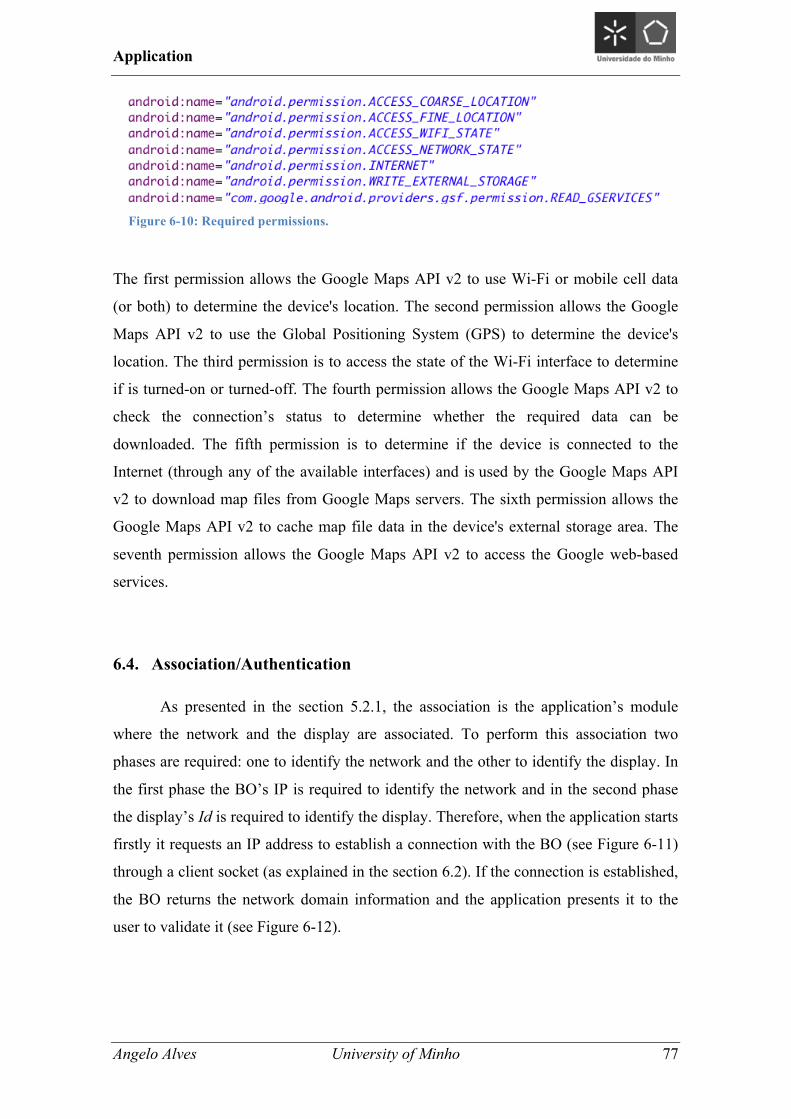
Application
Angelo Alves University of Minho 77
The first permission allows the Google Maps API v2 to use Wi-Fi or mobile cell data
(or both) to determine the device's location. The second permission allows the Google
Maps API v2 to use the Global Positioning System (GPS) to determine the device's
location. The third permission is to access the state of the Wi-Fi interface to determine
if is turned-on or turned-off. The fourth permission allows the Google Maps API v2 to
check the connection’s status to determine whether the required data can be
downloaded. The fifth permission is to determine if the device is connected to the
Internet (through any of the available interfaces) and is used by the Google Maps API
v2 to download map files from Google Maps servers. The sixth permission allows the
Google Maps API v2 to cache map file data in the device's external storage area. The
seventh permission allows the Google Maps API v2 to access the Google web-based
services.
6.4. Association/Authentication
As presented in the section 5.2.1, the association is the application’s module
where the network and the display are associated. To perform this association two
phases are required: one to identify the network and the other to identify the display. In
the first phase the BO’s IP is required to identify the network and in the second phase
the display’s Id is required to identify the display. Therefore, when the application starts
firstly it requests an IP address to establish a connection with the BO (see Figure 6-11)
through a client socket (as explained in the section 6.2). If the connection is established,
the BO returns the network domain information and the application presents it to the
user to validate it (see Figure 6-12).
Figure 6-10: Required permissions.
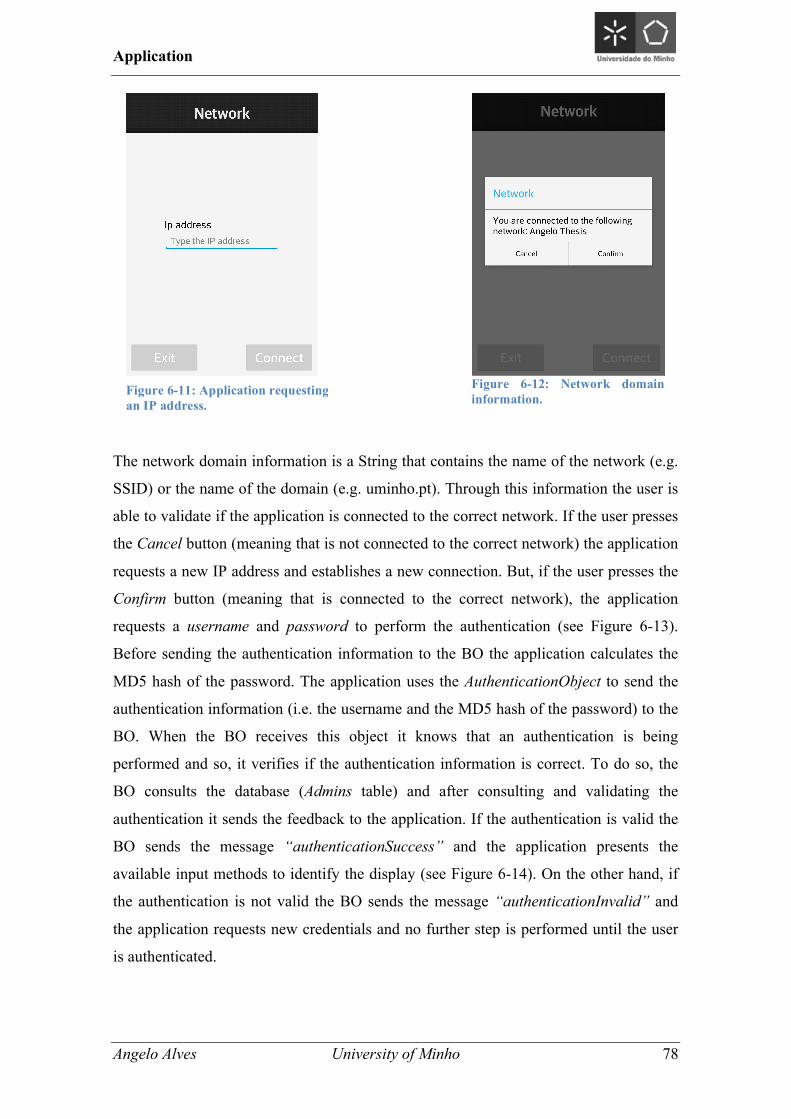
Application
Angelo Alves University of Minho 78
The network domain information is a String that contains the name of the network (e.g.
SSID) or the name of the domain (e.g. uminho.pt). Through this information the user is
able to validate if the application is connected to the correct network. If the user presses
the Cancel button (meaning that is not connected to the correct network) the application
requests a new IP address and establishes a new connection. But, if the user presses the
Confirm button (meaning that is connected to the correct network), the application
requests a username and password to perform the authentication (see Figure 6-13).
Before sending the authentication information to the BO the application calculates the
MD5 hash of the password. The application uses the AuthenticationObject to send the
authentication information (i.e. the username and the MD5 hash of the password) to the
BO. When the BO receives this object it knows that an authentication is being
performed and so, it verifies if the authentication information is correct. To do so, the
BO consults the database (Admins table) and after consulting and validating the
authentication it sends the feedback to the application. If the authentication is valid the
BO sends the message “authenticationSuccess” and the application presents the
available input methods to identify the display (see Figure 6-14). On the other hand, if
the authentication is not valid the BO sends the message “authenticationInvalid” and
the application requests new credentials and no further step is performed until the user
is authenticated.
Figure 6-12: Network domain information.
Figure 6-11: Application requesting an IP address.
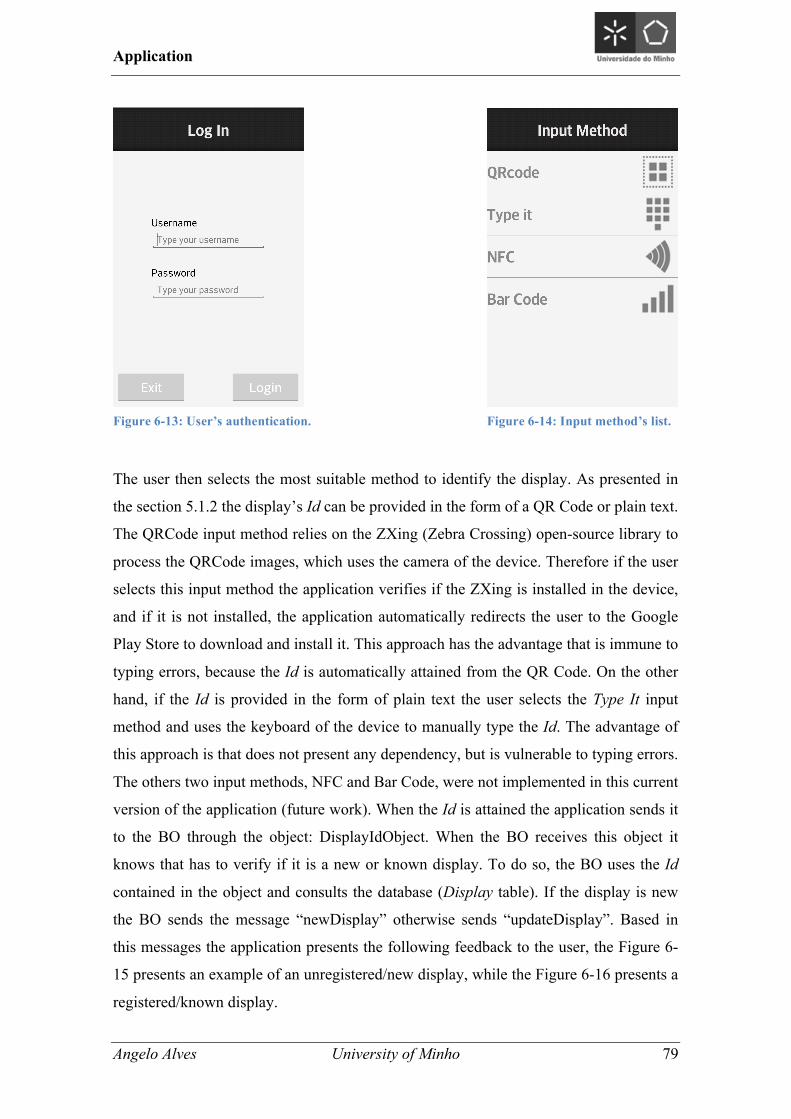
Application
Angelo Alves University of Minho 79
The user then selects the most suitable method to identify the display. As presented in
the section 5.1.2 the display’s Id can be provided in the form of a QR Code or plain text.
The QRCode input method relies on the ZXing (Zebra Crossing) open-source library to
process the QRCode images, which uses the camera of the device. Therefore if the user
selects this input method the application verifies if the ZXing is installed in the device,
and if it is not installed, the application automatically redirects the user to the Google
Play Store to download and install it. This approach has the advantage that is immune to
typing errors, because the Id is automatically attained from the QR Code. On the other
hand, if the Id is provided in the form of plain text the user selects the Type It input
method and uses the keyboard of the device to manually type the Id. The advantage of
this approach is that does not present any dependency, but is vulnerable to typing errors.
The others two input methods, NFC and Bar Code, were not implemented in this current
version of the application (future work). When the Id is attained the application sends it
to the BO through the object: DisplayIdObject. When the BO receives this object it
knows that has to verify if it is a new or known display. To do so, the BO uses the Id
contained in the object and consults the database (Display table). If the display is new
the BO sends the message “newDisplay” otherwise sends “updateDisplay”. Based in
this messages the application presents the following feedback to the user, the Figure 6-
15 presents an example of an unregistered/new display, while the Figure 6-16 presents a
registered/known display.
Figure 6-13: User’s authentication. Figure 6-14: Input method’s list.
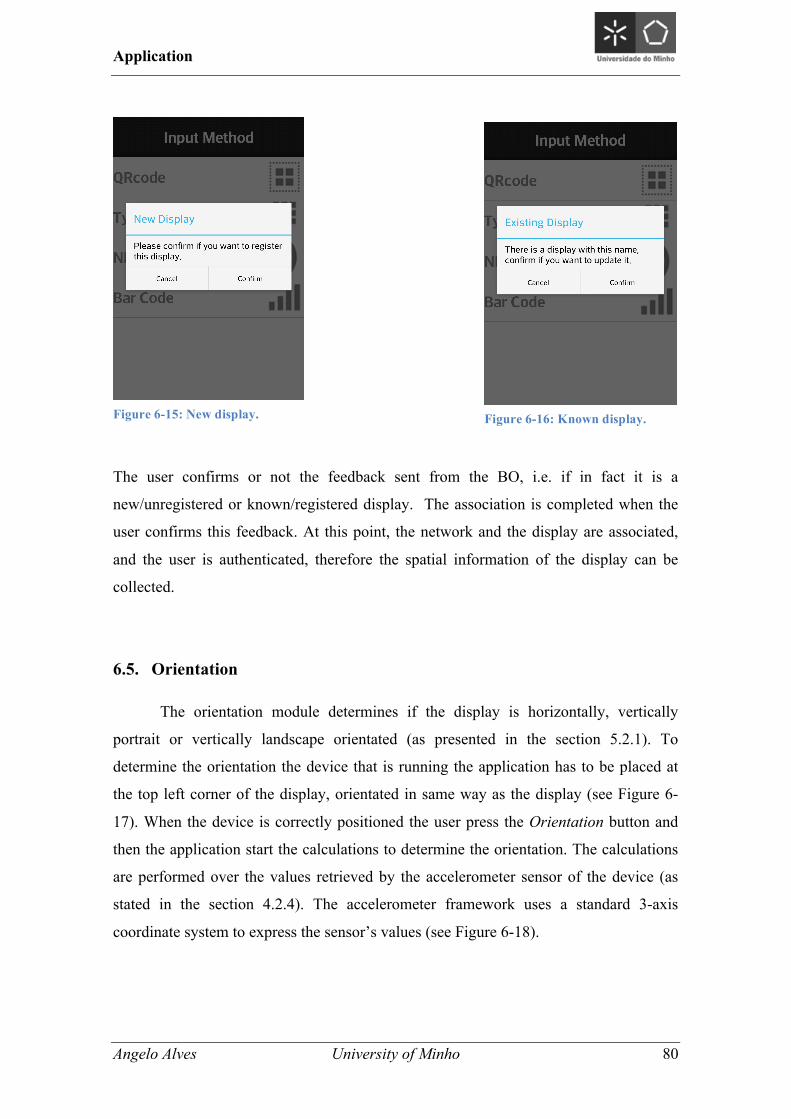
Application
Angelo Alves University of Minho 80
The user confirms or not the feedback sent from the BO, i.e. if in fact it is a
new/unregistered or known/registered display. The association is completed when the
user confirms this feedback. At this point, the network and the display are associated,
and the user is authenticated, therefore the spatial information of the display can be
collected.
6.5. Orientation
The orientation module determines if the display is horizontally, vertically
portrait or vertically landscape orientated (as presented in the section 5.2.1). To
determine the orientation the device that is running the application has to be placed at
the top left corner of the display, orientated in same way as the display (see Figure 6-
17). When the device is correctly positioned the user press the Orientation button and
then the application start the calculations to determine the orientation. The calculations
are performed over the values retrieved by the accelerometer sensor of the device (as
stated in the section 4.2.4). The accelerometer framework uses a standard 3-axis
coordinate system to express the sensor’s values (see Figure 6-18).
Figure 6-15: New display. Figure 6-16: Known display.
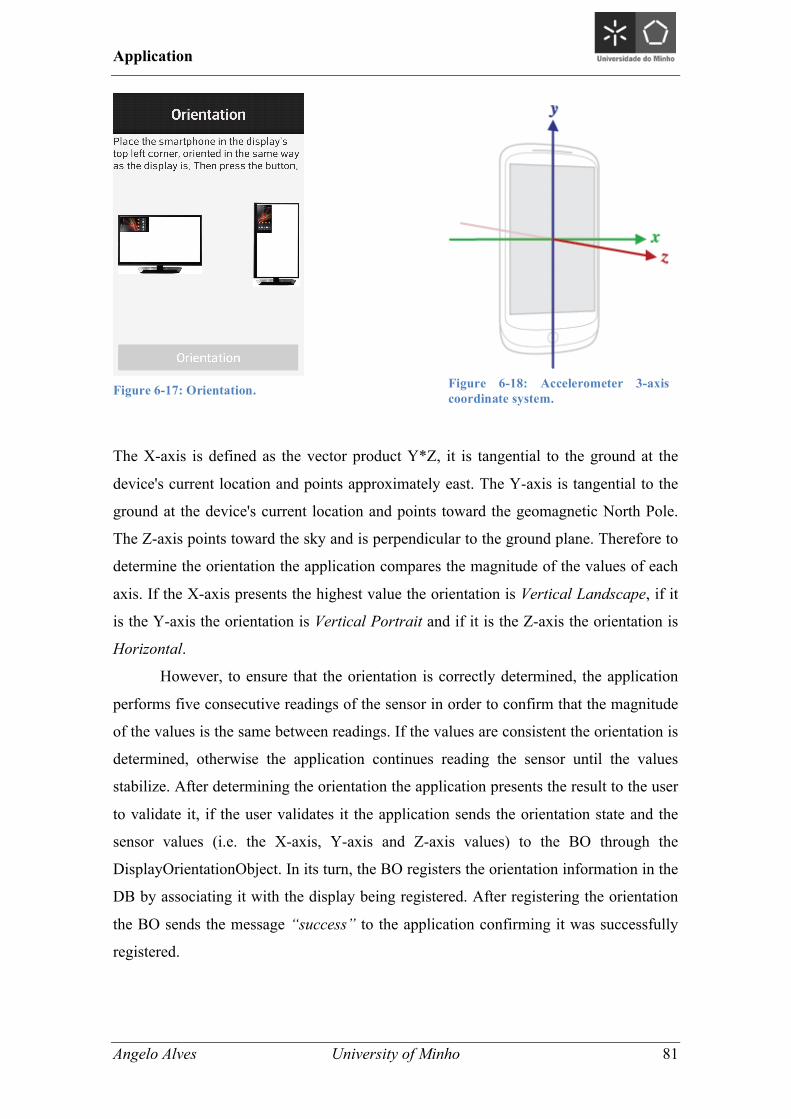
Application
Angelo Alves University of Minho 81
The X-axis is defined as the vector product Y*Z, it is tangential to the ground at the
device's current location and points approximately east. The Y-axis is tangential to the
ground at the device's current location and points toward the geomagnetic North Pole.
The Z-axis points toward the sky and is perpendicular to the ground plane. Therefore to
determine the orientation the application compares the magnitude of the values of each
axis. If the X-axis presents the highest value the orientation is Vertical Landscape, if it
is the Y-axis the orientation is Vertical Portrait and if it is the Z-axis the orientation is
Horizontal.
However, to ensure that the orientation is correctly determined, the application
performs five consecutive readings of the sensor in order to confirm that the magnitude
of the values is the same between readings. If the values are consistent the orientation is
determined, otherwise the application continues reading the sensor until the values
stabilize. After determining the orientation the application presents the result to the user
to validate it, if the user validates it the application sends the orientation state and the
sensor values (i.e. the X-axis, Y-axis and Z-axis values) to the BO through the
DisplayOrientationObject. In its turn, the BO registers the orientation information in the
DB by associating it with the display being registered. After registering the orientation
the BO sends the message “success” to the application confirming it was successfully
registered.
Figure 6-17: Orientation. Figure 6-18: Accelerometer 3-axis coordinate system.
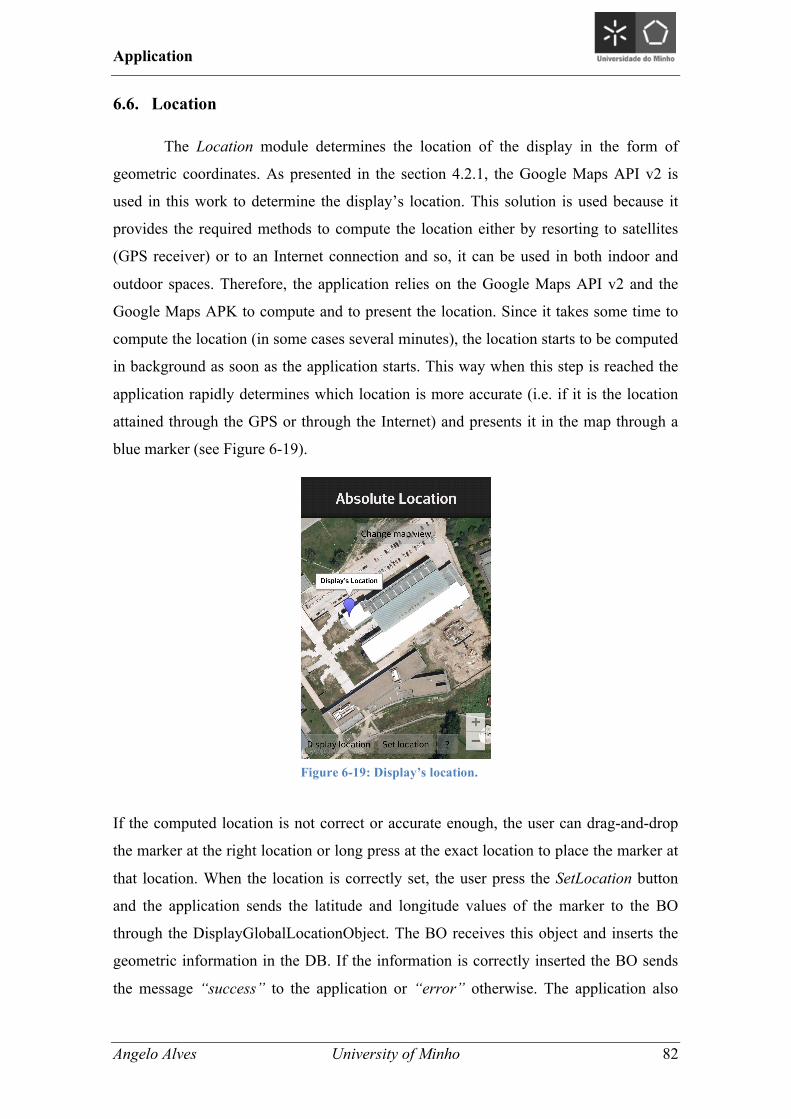
Application
Angelo Alves University of Minho 82
6.6. Location
The Location module determines the location of the display in the form of
geometric coordinates. As presented in the section 4.2.1, the Google Maps API v2 is
used in this work to determine the display’s location. This solution is used because it
provides the required methods to compute the location either by resorting to satellites
(GPS receiver) or to an Internet connection and so, it can be used in both indoor and
outdoor spaces. Therefore, the application relies on the Google Maps API v2 and the
Google Maps APK to compute and to present the location. Since it takes some time to
compute the location (in some cases several minutes), the location starts to be computed
in background as soon as the application starts. This way when this step is reached the
application rapidly determines which location is more accurate (i.e. if it is the location
attained through the GPS or through the Internet) and presents it in the map through a
blue marker (see Figure 6-19).
If the computed location is not correct or accurate enough, the user can drag-and-drop
the marker at the right location or long press at the exact location to place the marker at
that location. When the location is correctly set, the user press the SetLocation button
and the application sends the latitude and longitude values of the marker to the BO
through the DisplayGlobalLocationObject. The BO receives this object and inserts the
geometric information in the DB. If the information is correctly inserted the BO sends
the message “success” to the application or “error” otherwise. The application also
Figure 6-19: Display’s location.
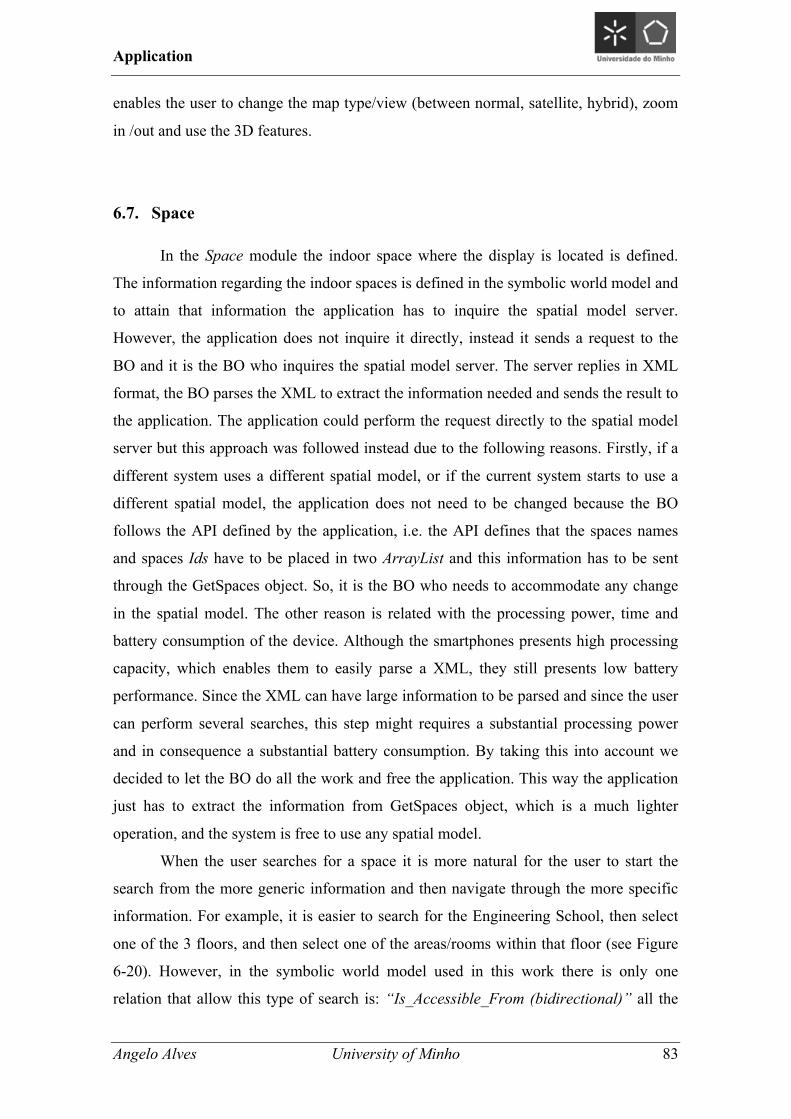
Application
Angelo Alves University of Minho 83
enables the user to change the map type/view (between normal, satellite, hybrid), zoom
in /out and use the 3D features.
6.7. Space
In the Space module the indoor space where the display is located is defined.
The information regarding the indoor spaces is defined in the symbolic world model and
to attain that information the application has to inquire the spatial model server.
However, the application does not inquire it directly, instead it sends a request to the
BO and it is the BO who inquires the spatial model server. The server replies in XML
format, the BO parses the XML to extract the information needed and sends the result to
the application. The application could perform the request directly to the spatial model
server but this approach was followed instead due to the following reasons. Firstly, if a
different system uses a different spatial model, or if the current system starts to use a
different spatial model, the application does not need to be changed because the BO
follows the API defined by the application, i.e. the API defines that the spaces names
and spaces Ids have to be placed in two ArrayList and this information has to be sent
through the GetSpaces object. So, it is the BO who needs to accommodate any change
in the spatial model. The other reason is related with the processing power, time and
battery consumption of the device. Although the smartphones presents high processing
capacity, which enables them to easily parse a XML, they still presents low battery
performance. Since the XML can have large information to be parsed and since the user
can perform several searches, this step might requires a substantial processing power
and in consequence a substantial battery consumption. By taking this into account we
decided to let the BO do all the work and free the application. This way the application
just has to extract the information from GetSpaces object, which is a much lighter
operation, and the system is free to use any spatial model.
When the user searches for a space it is more natural for the user to start the
search from the more generic information and then navigate through the more specific
information. For example, it is easier to search for the Engineering School, then select
one of the 3 floors, and then select one of the areas/rooms within that floor (see Figure
6-20). However, in the symbolic world model used in this work there is only one
relation that allow this type of search is: “Is_Accessible_From (bidirectional)” all the
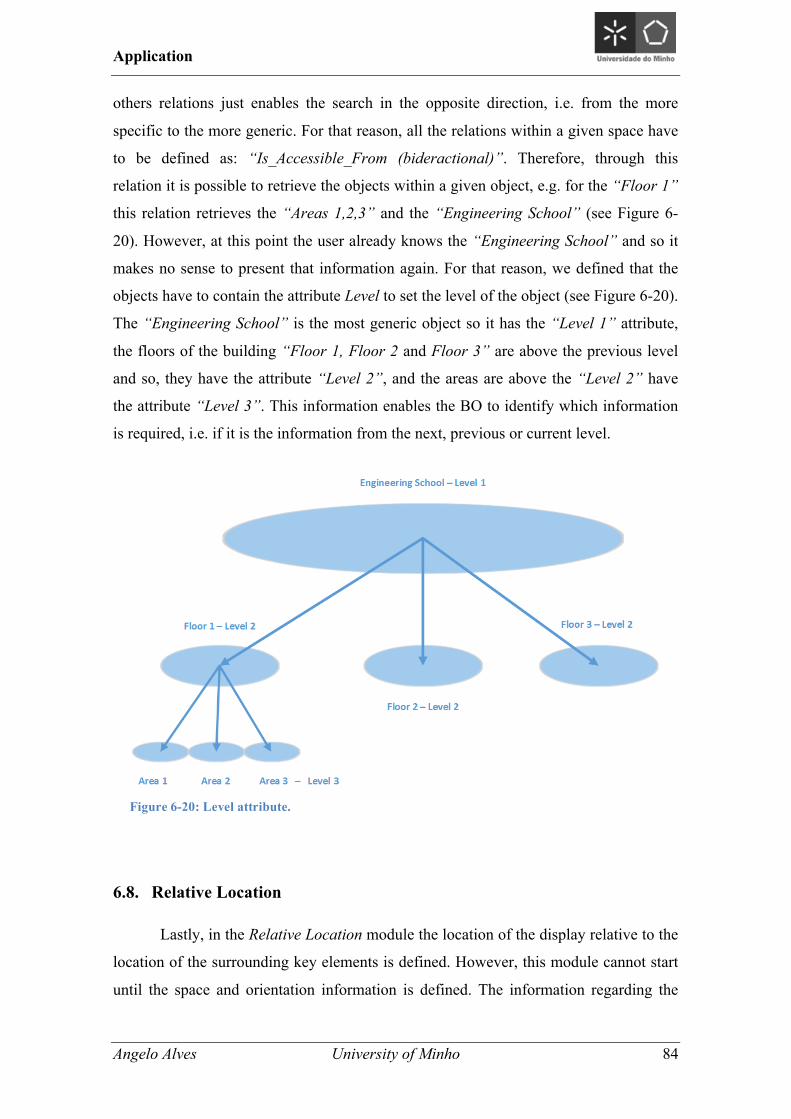
Application
Angelo Alves University of Minho 84
others relations just enables the search in the opposite direction, i.e. from the more
specific to the more generic. For that reason, all the relations within a given space have
to be defined as: “Is_Accessible_From (bideractional)”. Therefore, through this
relation it is possible to retrieve the objects within a given object, e.g. for the “Floor 1”
this relation retrieves the “Areas 1,2,3” and the “Engineering School” (see Figure 6-
20). However, at this point the user already knows the “Engineering School” and so it
makes no sense to present that information again. For that reason, we defined that the
objects have to contain the attribute Level to set the level of the object (see Figure 6-20).
The “Engineering School” is the most generic object so it has the “Level 1” attribute,
the floors of the building “Floor 1, Floor 2 and Floor 3” are above the previous level
and so, they have the attribute “Level 2”, and the areas are above the “Level 2” have
the attribute “Level 3”. This information enables the BO to identify which information
is required, i.e. if it is the information from the next, previous or current level.
6.8. Relative Location
Lastly, in the Relative Location module the location of the display relative to the
location of the surrounding key elements is defined. However, this module cannot start
until the space and orientation information is defined. The information regarding the
Figure 6-20: Level attribute.
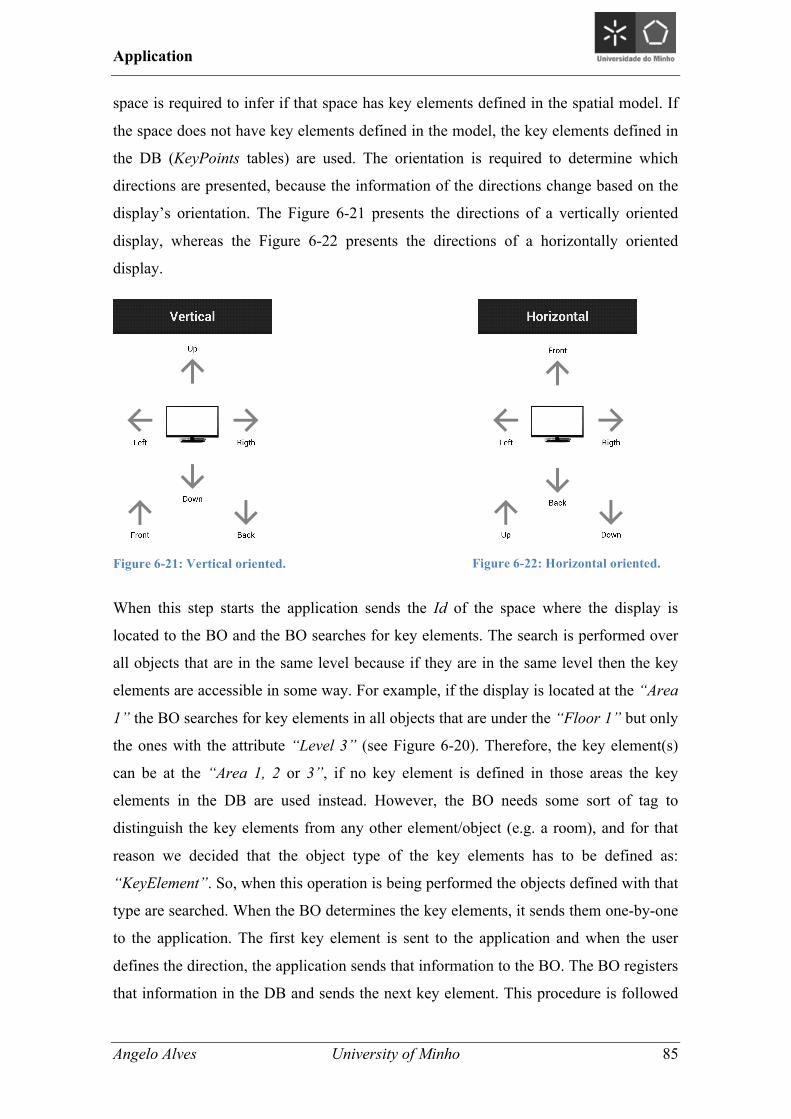
Application
Angelo Alves University of Minho 85
space is required to infer if that space has key elements defined in the spatial model. If
the space does not have key elements defined in the model, the key elements defined in
the DB (KeyPoints tables) are used. The orientation is required to determine which
directions are presented, because the information of the directions change based on the
display’s orientation. The Figure 6-21 presents the directions of a vertically oriented
display, whereas the Figure 6-22 presents the directions of a horizontally oriented
display.
When this step starts the application sends the Id of the space where the display is
located to the BO and the BO searches for key elements. The search is performed over
all objects that are in the same level because if they are in the same level then the key
elements are accessible in some way. For example, if the display is located at the “Area
1” the BO searches for key elements in all objects that are under the “Floor 1” but only
the ones with the attribute “Level 3” (see Figure 6-20). Therefore, the key element(s)
can be at the “Area 1, 2 or 3”, if no key element is defined in those areas the key
elements in the DB are used instead. However, the BO needs some sort of tag to
distinguish the key elements from any other element/object (e.g. a room), and for that
reason we decided that the object type of the key elements has to be defined as:
“KeyElement”. So, when this operation is being performed the objects defined with that
type are searched. When the BO determines the key elements, it sends them one-by-one
to the application. The first key element is sent to the application and when the user
defines the direction, the application sends that information to the BO. The BO registers
that information in the DB and sends the next key element. This procedure is followed
Figure 6-21: Vertical oriented. Figure 6-22: Horizontal oriented.
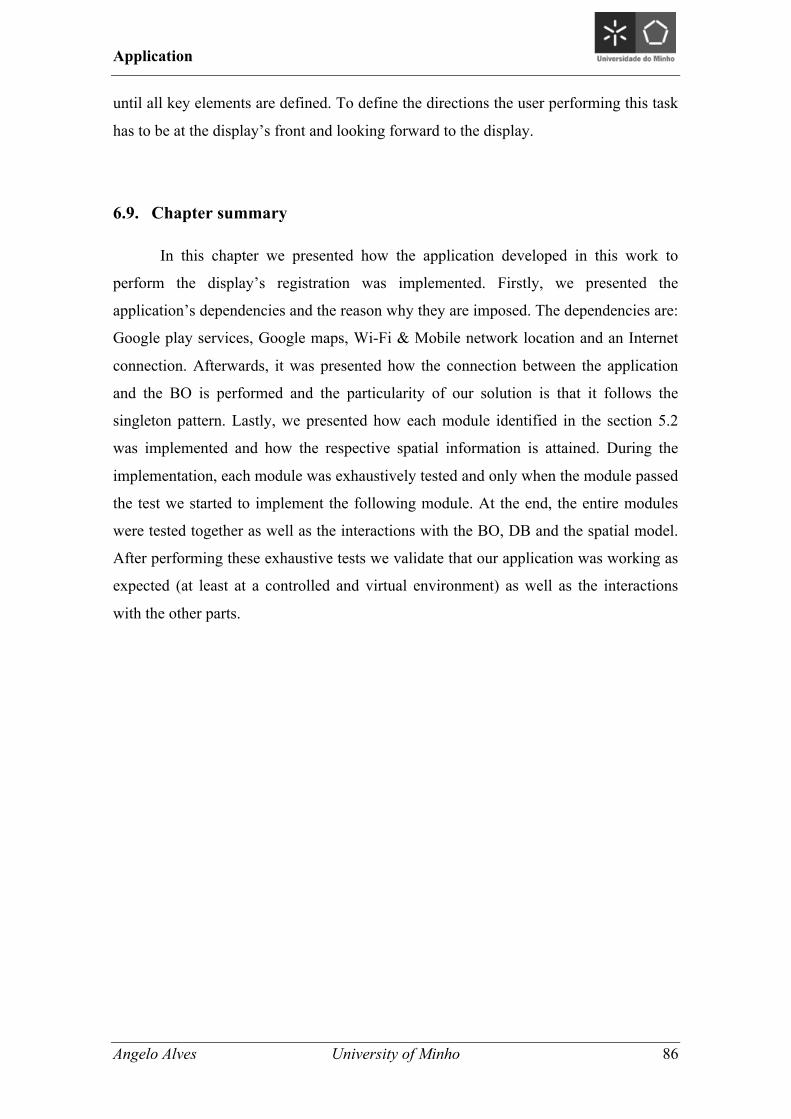
Application
Angelo Alves University of Minho 86
until all key elements are defined. To define the directions the user performing this task
has to be at the display’s front and looking forward to the display.
6.9. Chapter summary
In this chapter we presented how the application developed in this work to
perform the display’s registration was implemented. Firstly, we presented the
application’s dependencies and the reason why they are imposed. The dependencies are:
Google play services, Google maps, Wi-Fi & Mobile network location and an Internet
connection. Afterwards, it was presented how the connection between the application
and the BO is performed and the particularity of our solution is that it follows the
singleton pattern. Lastly, we presented how each module identified in the section 5.2
was implemented and how the respective spatial information is attained. During the
implementation, each module was exhaustively tested and only when the module passed
the test we started to implement the following module. At the end, the entire modules
were tested together as well as the interactions with the BO, DB and the spatial model.
After performing these exhaustive tests we validate that our application was working as
expected (at least at a controlled and virtual environment) as well as the interactions
with the other parts.
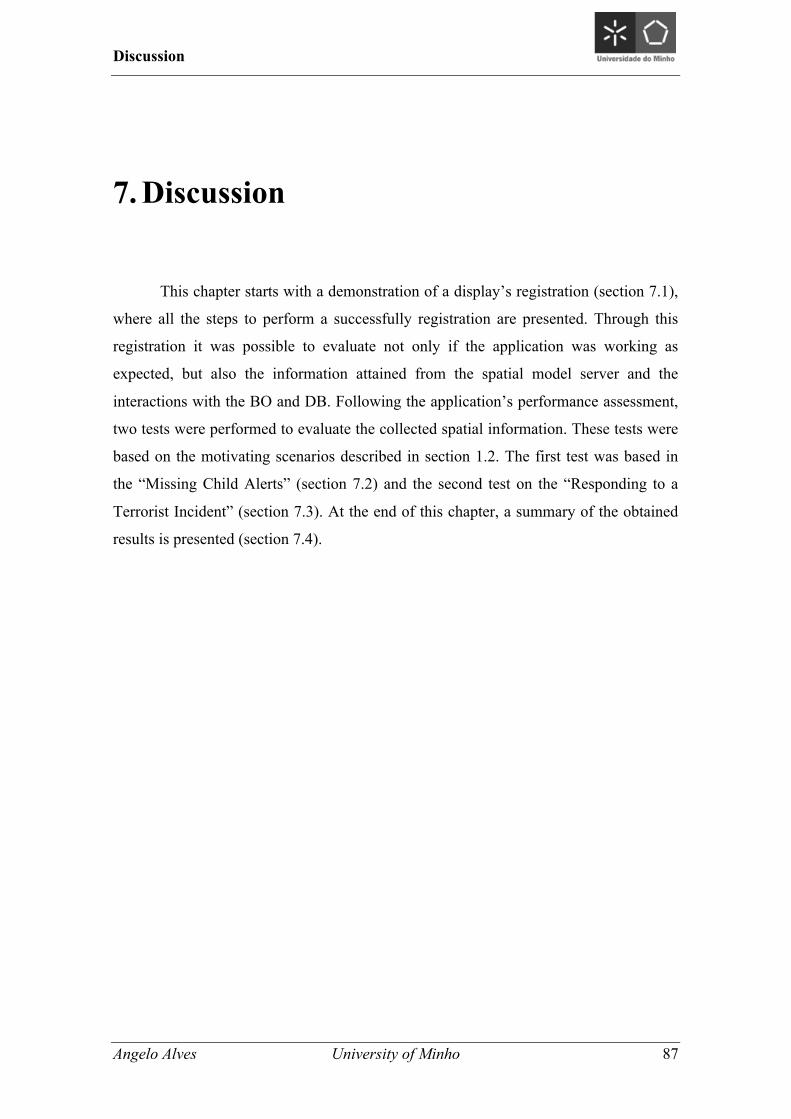
Discussion
Angelo Alves University of Minho 87
7. Discussion
This chapter starts with a demonstration of a display’s registration (section 7.1),
where all the steps to perform a successfully registration are presented. Through this
registration it was possible to evaluate not only if the application was working as
expected, but also the information attained from the spatial model server and the
interactions with the BO and DB. Following the application’s performance assessment,
two tests were performed to evaluate the collected spatial information. These tests were
based on the motivating scenarios described in section 1.2. The first test was based in
the “Missing Child Alerts” (section 7.2) and the second test on the “Responding to a
Terrorist Incident” (section 7.3). At the end of this chapter, a summary of the obtained
results is presented (section 7.4).
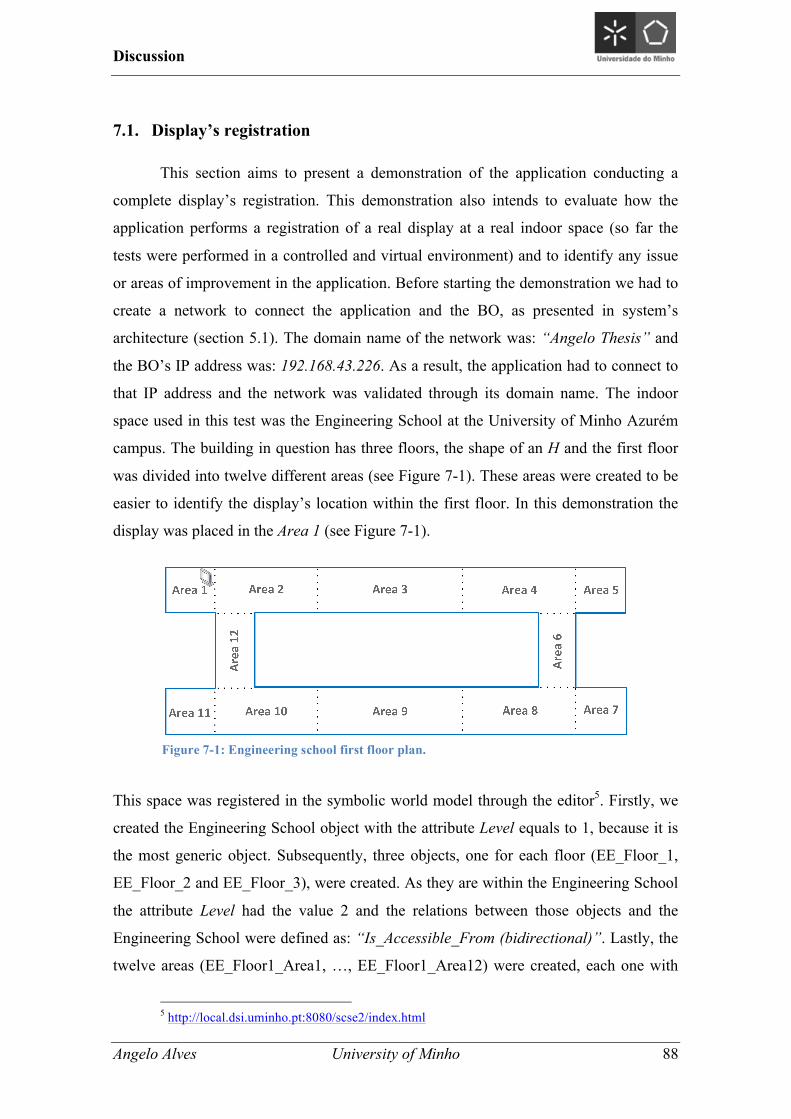
Discussion
Angelo Alves University of Minho 88
7.1. Display’s registration
This section aims to present a demonstration of the application conducting a
complete display’s registration. This demonstration also intends to evaluate how the
application performs a registration of a real display at a real indoor space (so far the
tests were performed in a controlled and virtual environment) and to identify any issue
or areas of improvement in the application. Before starting the demonstration we had to
create a network to connect the application and the BO, as presented in system’s
architecture (section 5.1). The domain name of the network was: “Angelo Thesis” and
the BO’s IP address was: 192.168.43.226. As a result, the application had to connect to
that IP address and the network was validated through its domain name. The indoor
space used in this test was the Engineering School at the University of Minho Azurém
campus. The building in question has three floors, the shape of an H and the first floor
was divided into twelve different areas (see Figure 7-1). These areas were created to be
easier to identify the display’s location within the first floor. In this demonstration the
display was placed in the Area 1 (see Figure 7-1).
This space was registered in the symbolic world model through the editor5. Firstly, we
created the Engineering School object with the attribute Level equals to 1, because it is
the most generic object. Subsequently, three objects, one for each floor (EE_Floor_1,
EE_Floor_2 and EE_Floor_3), were created. As they are within the Engineering School
the attribute Level had the value 2 and the relations between those objects and the
Engineering School were defined as: “Is_Accessible_From (bidirectional)”. Lastly, the
twelve areas (EE_Floor1_Area1, …, EE_Floor1_Area12) were created, each one with
5 http://local.dsi.uminho.pt:8080/scse2/index.html
Figure 7-1: Engineering school first floor plan.
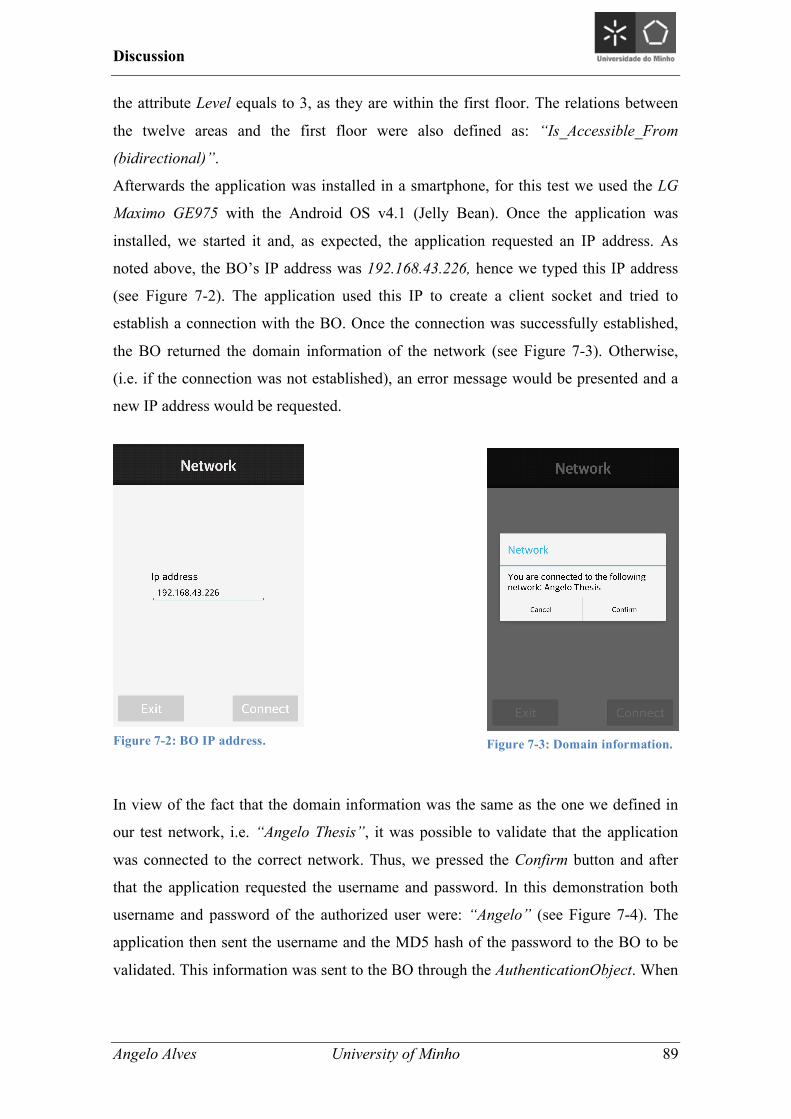
Discussion
Angelo Alves University of Minho 89
the attribute Level equals to 3, as they are within the first floor. The relations between
the twelve areas and the first floor were also defined as: “Is_Accessible_From
(bidirectional)”.
Afterwards the application was installed in a smartphone, for this test we used the LG
Maximo GE975 with the Android OS v4.1 (Jelly Bean). Once the application was
installed, we started it and, as expected, the application requested an IP address. As
noted above, the BO’s IP address was 192.168.43.226, hence we typed this IP address
(see Figure 7-2). The application used this IP to create a client socket and tried to
establish a connection with the BO. Once the connection was successfully established,
the BO returned the domain information of the network (see Figure 7-3). Otherwise,
(i.e. if the connection was not established), an error message would be presented and a
new IP address would be requested.
In view of the fact that the domain information was the same as the one we defined in
our test network, i.e. “Angelo Thesis”, it was possible to validate that the application
was connected to the correct network. Thus, we pressed the Confirm button and after
that the application requested the username and password. In this demonstration both
username and password of the authorized user were: “Angelo” (see Figure 7-4). The
application then sent the username and the MD5 hash of the password to the BO to be
validated. This information was sent to the BO through the AuthenticationObject. When
Figure 7-2: BO IP address. Figure 7-3: Domain information.
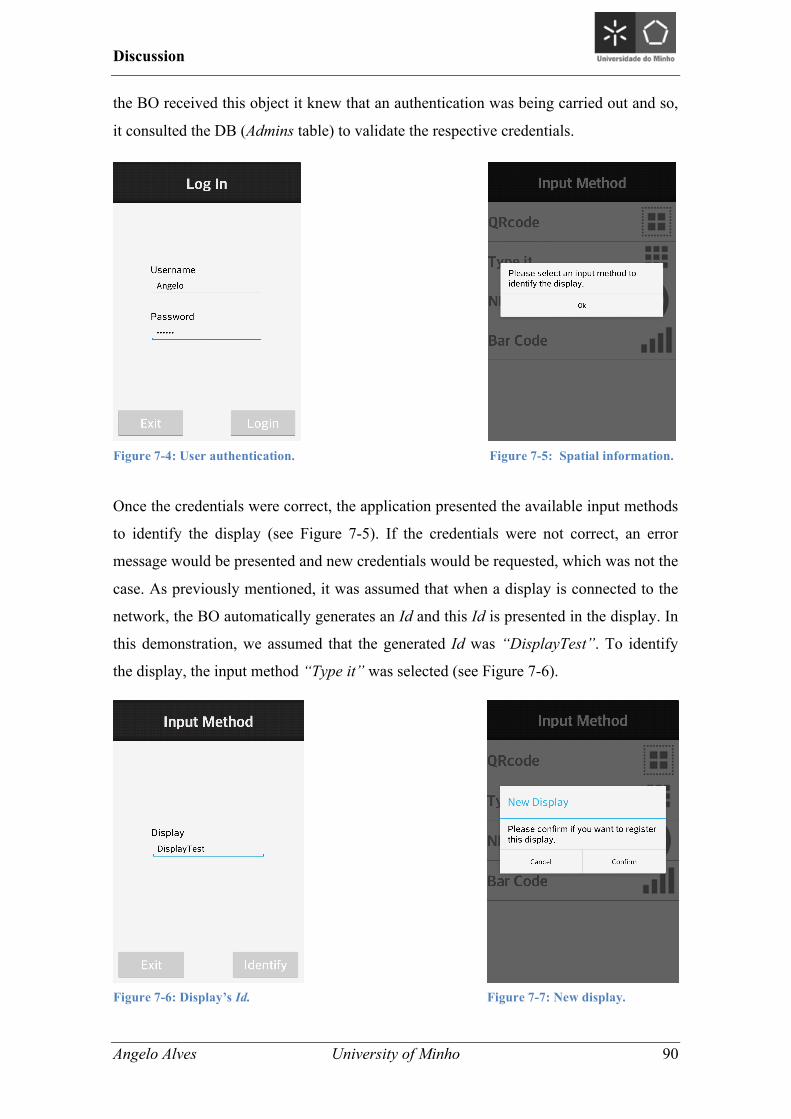
Discussion
Angelo Alves University of Minho 90
the BO received this object it knew that an authentication was being carried out and so,
it consulted the DB (Admins table) to validate the respective credentials.
Once the credentials were correct, the application presented the available input methods
to identify the display (see Figure 7-5). If the credentials were not correct, an error
message would be presented and new credentials would be requested, which was not the
case. As previously mentioned, it was assumed that when a display is connected to the
network, the BO automatically generates an Id and this Id is presented in the display. In
this demonstration, we assumed that the generated Id was “DisplayTest”. To identify
the display, the input method “Type it” was selected (see Figure 7-6).
Figure 7-6: Display’s Id. Figure 7-7: New display.
Figure 7-4: User authentication. Figure 7-5: Spatial information.
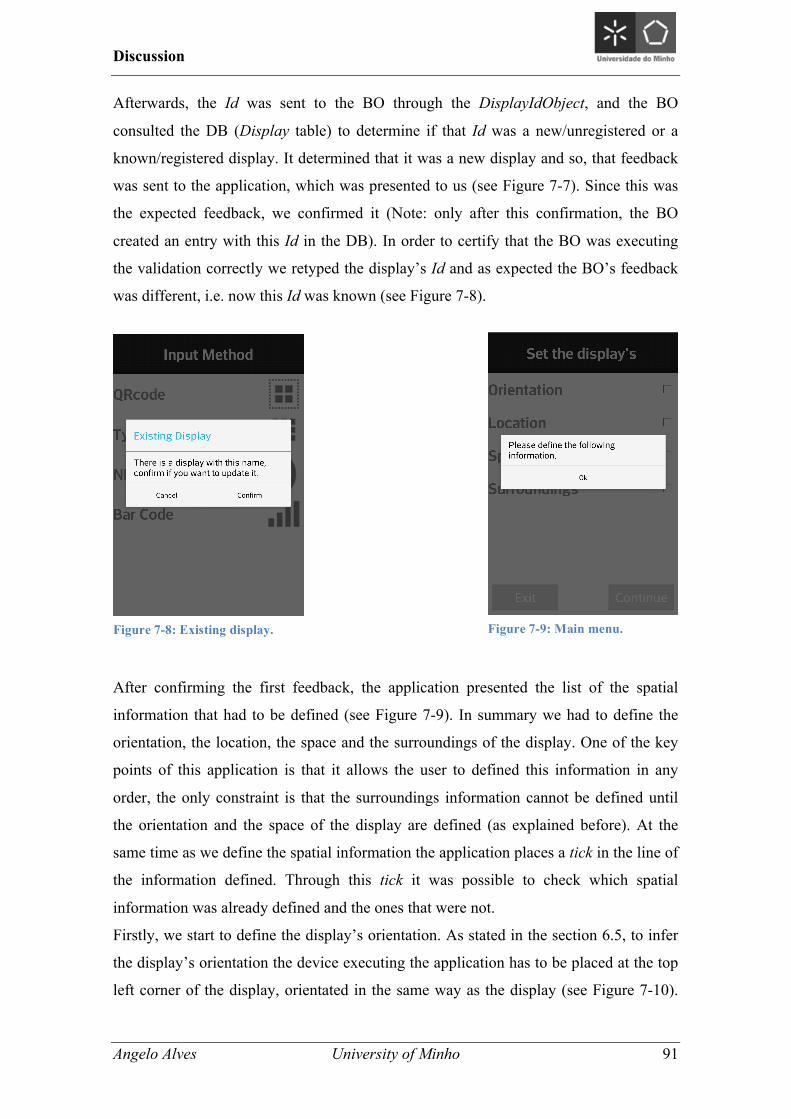
Discussion
Angelo Alves University of Minho 91
Afterwards, the Id was sent to the BO through the DisplayIdObject, and the BO
consulted the DB (Display table) to determine if that Id was a new/unregistered or a
known/registered display. It determined that it was a new display and so, that feedback
was sent to the application, which was presented to us (see Figure 7-7). Since this was
the expected feedback, we confirmed it (Note: only after this confirmation, the BO
created an entry with this Id in the DB). In order to certify that the BO was executing
the validation correctly we retyped the display’s Id and as expected the BO’s feedback
was different, i.e. now this Id was known (see Figure 7-8).
After confirming the first feedback, the application presented the list of the spatial
information that had to be defined (see Figure 7-9). In summary we had to define the
orientation, the location, the space and the surroundings of the display. One of the key
points of this application is that it allows the user to defined this information in any
order, the only constraint is that the surroundings information cannot be defined until
the orientation and the space of the display are defined (as explained before). At the
same time as we define the spatial information the application places a tick in the line of
the information defined. Through this tick it was possible to check which spatial
information was already defined and the ones that were not.
Firstly, we start to define the display’s orientation. As stated in the section 6.5, to infer
the display’s orientation the device executing the application has to be placed at the top
left corner of the display, orientated in the same way as the display (see Figure 7-10).
Figure 7-8: Existing display. Figure 7-9: Main menu.
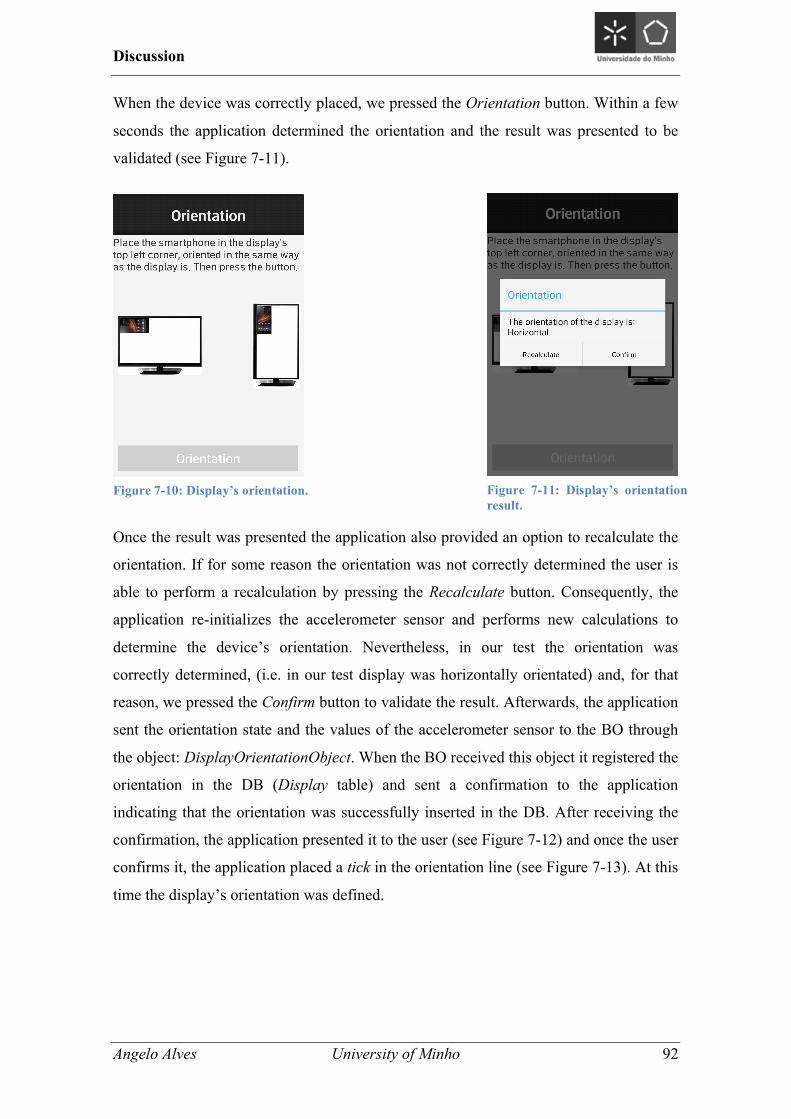
Discussion
Angelo Alves University of Minho 92
When the device was correctly placed, we pressed the Orientation button. Within a few
seconds the application determined the orientation and the result was presented to be
validated (see Figure 7-11).
Once the result was presented the application also provided an option to recalculate the
orientation. If for some reason the orientation was not correctly determined the user is
able to perform a recalculation by pressing the Recalculate button. Consequently, the
application re-initializes the accelerometer sensor and performs new calculations to
determine the device’s orientation. Nevertheless, in our test the orientation was
correctly determined, (i.e. in our test display was horizontally orientated) and, for that
reason, we pressed the Confirm button to validate the result. Afterwards, the application
sent the orientation state and the values of the accelerometer sensor to the BO through
the object: DisplayOrientationObject. When the BO received this object it registered the
orientation in the DB (Display table) and sent a confirmation to the application
indicating that the orientation was successfully inserted in the DB. After receiving the
confirmation, the application presented it to the user (see Figure 7-12) and once the user
confirms it, the application placed a tick in the orientation line (see Figure 7-13). At this
time the display’s orientation was defined.
Figure 7-10: Display’s orientation. Figure 7-11: Display’s orientation result.
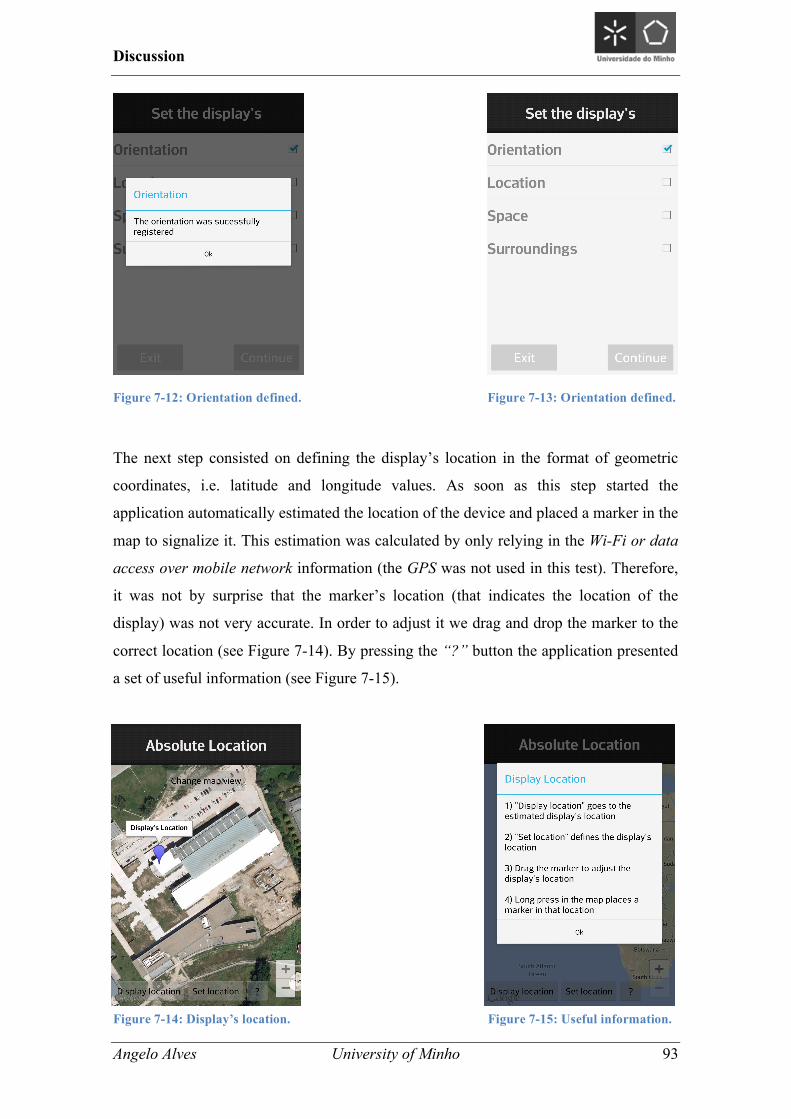
Discussion
Angelo Alves University of Minho 93
The next step consisted on defining the display’s location in the format of geometric
coordinates, i.e. latitude and longitude values. As soon as this step started the
application automatically estimated the location of the device and placed a marker in the
map to signalize it. This estimation was calculated by only relying in the Wi-Fi or data
access over mobile network information (the GPS was not used in this test). Therefore,
it was not by surprise that the marker’s location (that indicates the location of the
display) was not very accurate. In order to adjust it we drag and drop the marker to the
correct location (see Figure 7-14). By pressing the “?” button the application presented
a set of useful information (see Figure 7-15).
Figure 7-12: Orientation defined. Figure 7-13: Orientation defined.
Figure 7-14: Display’s location. Figure 7-15: Useful information.
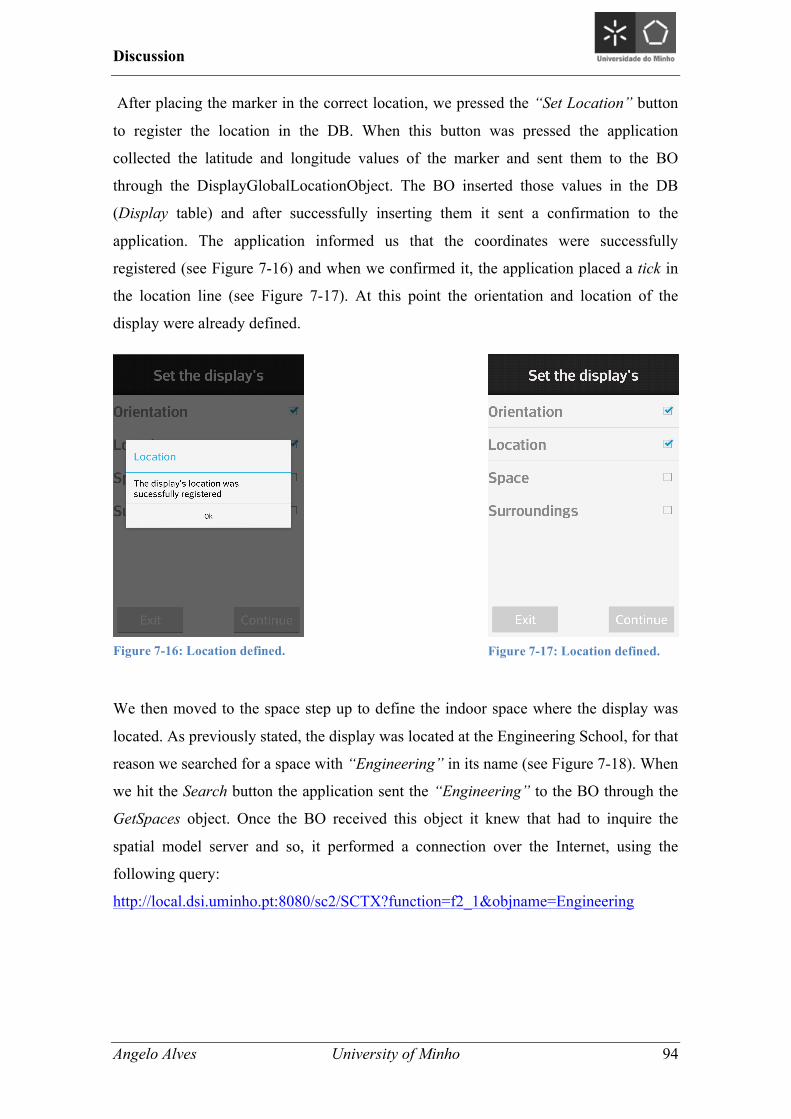
Discussion
Angelo Alves University of Minho 94
After placing the marker in the correct location, we pressed the “Set Location” button
to register the location in the DB. When this button was pressed the application
collected the latitude and longitude values of the marker and sent them to the BO
through the DisplayGlobalLocationObject. The BO inserted those values in the DB
(Display table) and after successfully inserting them it sent a confirmation to the
application. The application informed us that the coordinates were successfully
registered (see Figure 7-16) and when we confirmed it, the application placed a tick in
the location line (see Figure 7-17). At this point the orientation and location of the
display were already defined.
We then moved to the space step up to define the indoor space where the display was
located. As previously stated, the display was located at the Engineering School, for that
reason we searched for a space with “Engineering” in its name (see Figure 7-18). When
we hit the Search button the application sent the “Engineering” to the BO through the
GetSpaces object. Once the BO received this object it knew that had to inquire the
spatial model server and so, it performed a connection over the Internet, using the
following query:
http://local.dsi.uminho.pt:8080/sc2/SCTX?function=f2_1&objname=Engineering
Figure 7-16: Location defined. Figure 7-17: Location defined.
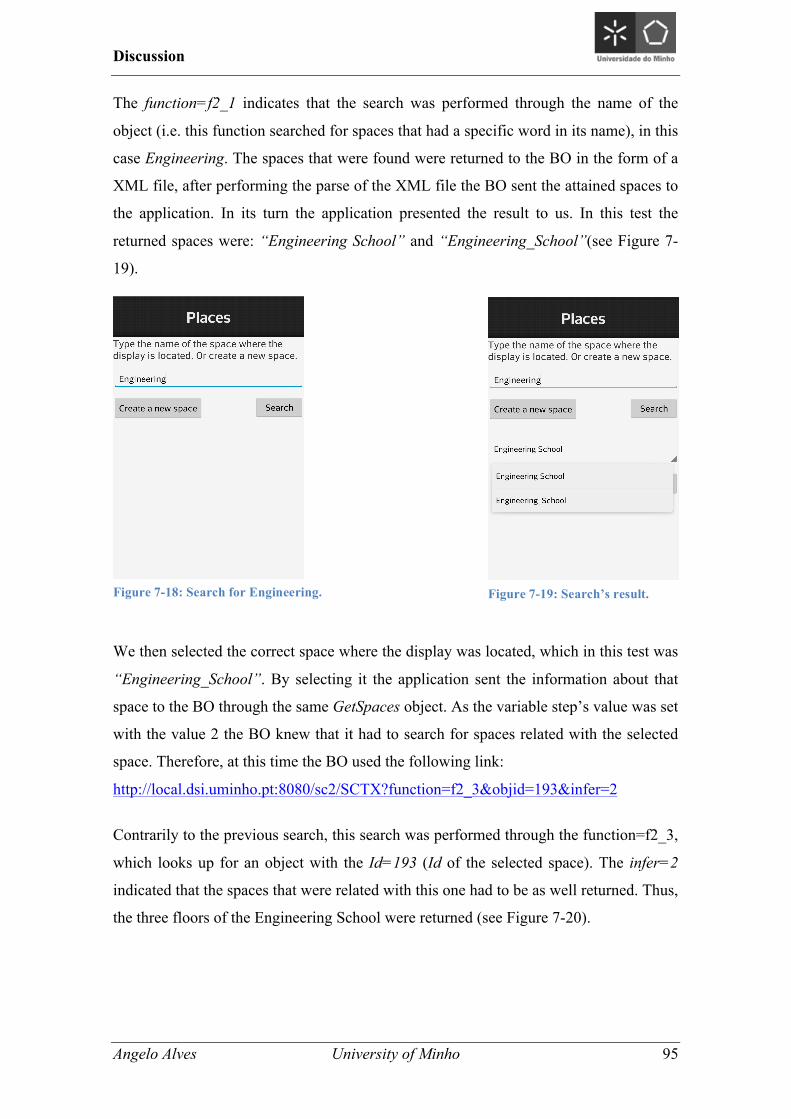
Discussion
Angelo Alves University of Minho 95
The function=f2_1 indicates that the search was performed through the name of the
object (i.e. this function searched for spaces that had a specific word in its name), in this
case Engineering. The spaces that were found were returned to the BO in the form of a
XML file, after performing the parse of the XML file the BO sent the attained spaces to
the application. In its turn the application presented the result to us. In this test the
returned spaces were: “Engineering School” and “Engineering_School”(see Figure 7-
19).
We then selected the correct space where the display was located, which in this test was
“Engineering_School”. By selecting it the application sent the information about that
space to the BO through the same GetSpaces object. As the variable step’s value was set
with the value 2 the BO knew that it had to search for spaces related with the selected
space. Therefore, at this time the BO used the following link:
http://local.dsi.uminho.pt:8080/sc2/SCTX?function=f2_3&objid=193&infer=2
Contrarily to the previous search, this search was performed through the function=f2_3,
which looks up for an object with the Id=193 (Id of the selected space). The infer=2
indicated that the spaces that were related with this one had to be as well returned. Thus,
the three floors of the Engineering School were returned (see Figure 7-20).
Figure 7-18: Search for Engineering. Figure 7-19: Search’s result.
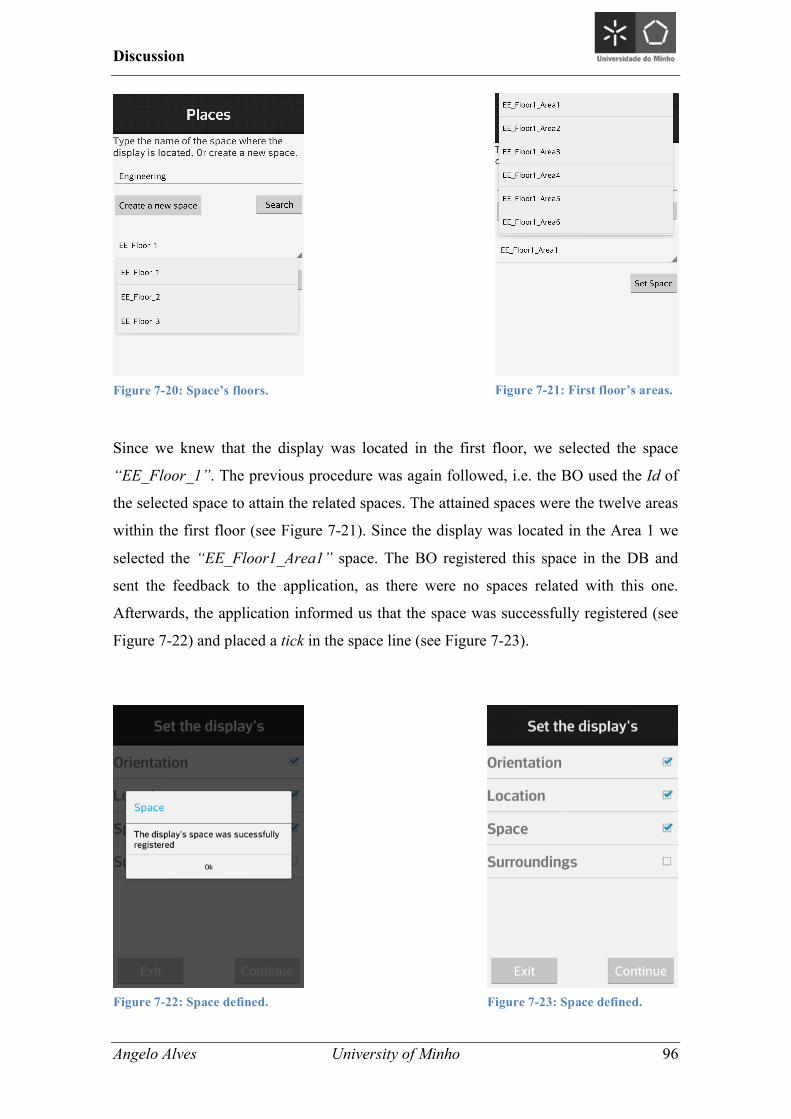
Discussion
Angelo Alves University of Minho 96
Since we knew that the display was located in the first floor, we selected the space
“EE_Floor_1”. The previous procedure was again followed, i.e. the BO used the Id of
the selected space to attain the related spaces. The attained spaces were the twelve areas
within the first floor (see Figure 7-21). Since the display was located in the Area 1 we
selected the “EE_Floor1_Area1” space. The BO registered this space in the DB and
sent the feedback to the application, as there were no spaces related with this one.
Afterwards, the application informed us that the space was successfully registered (see
Figure 7-22) and placed a tick in the space line (see Figure 7-23).
Figure 7-20: Space’s floors. Figure 7-21: First floor’s areas.
Figure 7-22: Space defined. Figure 7-23: Space defined.
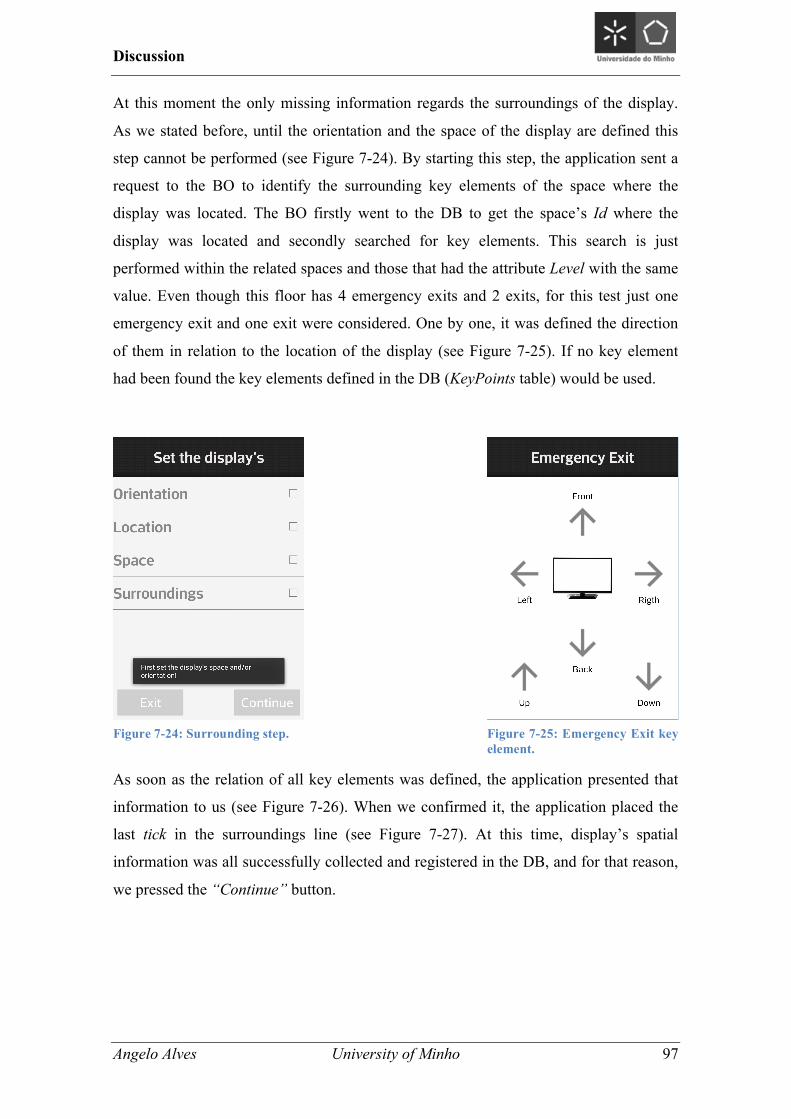
Discussion
Angelo Alves University of Minho 97
At this moment the only missing information regards the surroundings of the display.
As we stated before, until the orientation and the space of the display are defined this
step cannot be performed (see Figure 7-24). By starting this step, the application sent a
request to the BO to identify the surrounding key elements of the space where the
display was located. The BO firstly went to the DB to get the space’s Id where the
display was located and secondly searched for key elements. This search is just
performed within the related spaces and those that had the attribute Level with the same
value. Even though this floor has 4 emergency exits and 2 exits, for this test just one
emergency exit and one exit were considered. One by one, it was defined the direction
of them in relation to the location of the display (see Figure 7-25). If no key element
had been found the key elements defined in the DB (KeyPoints table) would be used.
As soon as the relation of all key elements was defined, the application presented that
information to us (see Figure 7-26). When we confirmed it, the application placed the
last tick in the surroundings line (see Figure 7-27). At this time, display’s spatial
information was all successfully collected and registered in the DB, and for that reason,
we pressed the “Continue” button.
Figure 7-24: Surrounding step. Figure 7-25: Emergency Exit key element.
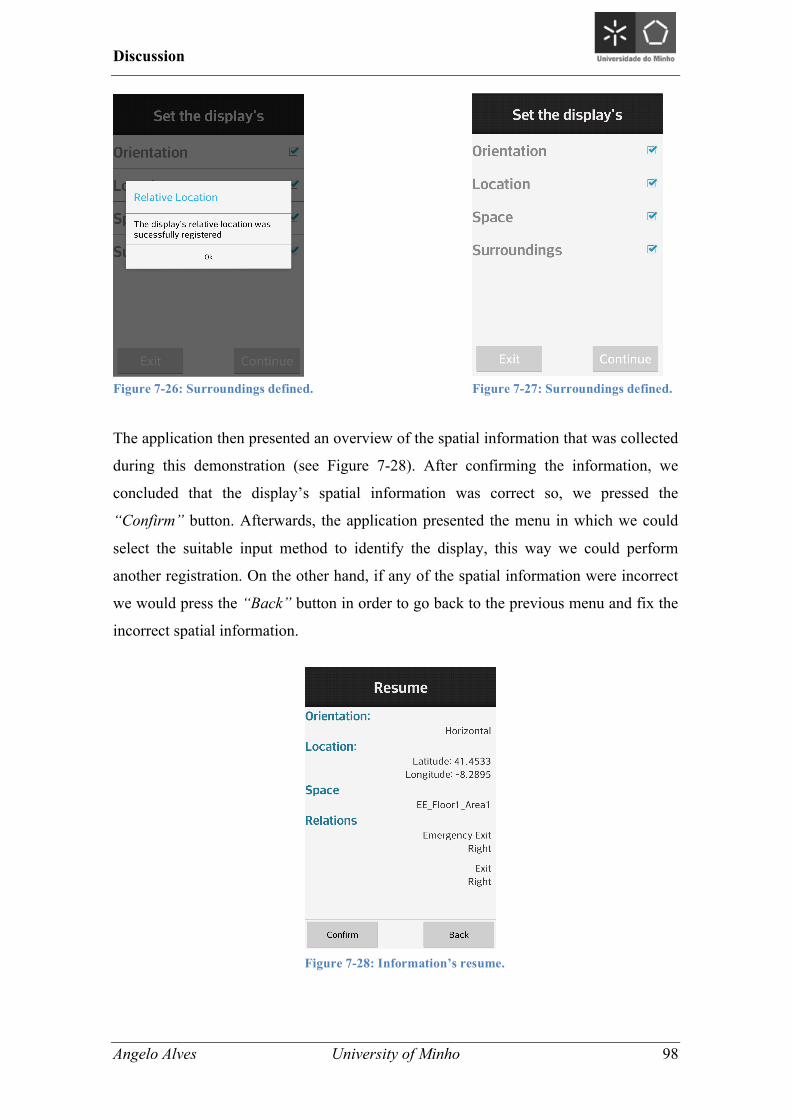
Discussion
Angelo Alves University of Minho 98
The application then presented an overview of the spatial information that was collected
during this demonstration (see Figure 7-28). After confirming the information, we
concluded that the display’s spatial information was correct so, we pressed the
“Confirm” button. Afterwards, the application presented the menu in which we could
select the suitable input method to identify the display, this way we could perform
another registration. On the other hand, if any of the spatial information were incorrect
we would press the “Back” button in order to go back to the previous menu and fix the
incorrect spatial information.
Figure 7-26: Surroundings defined. Figure 7-27: Surroundings defined.
Figure 7-28: Information’s resume.
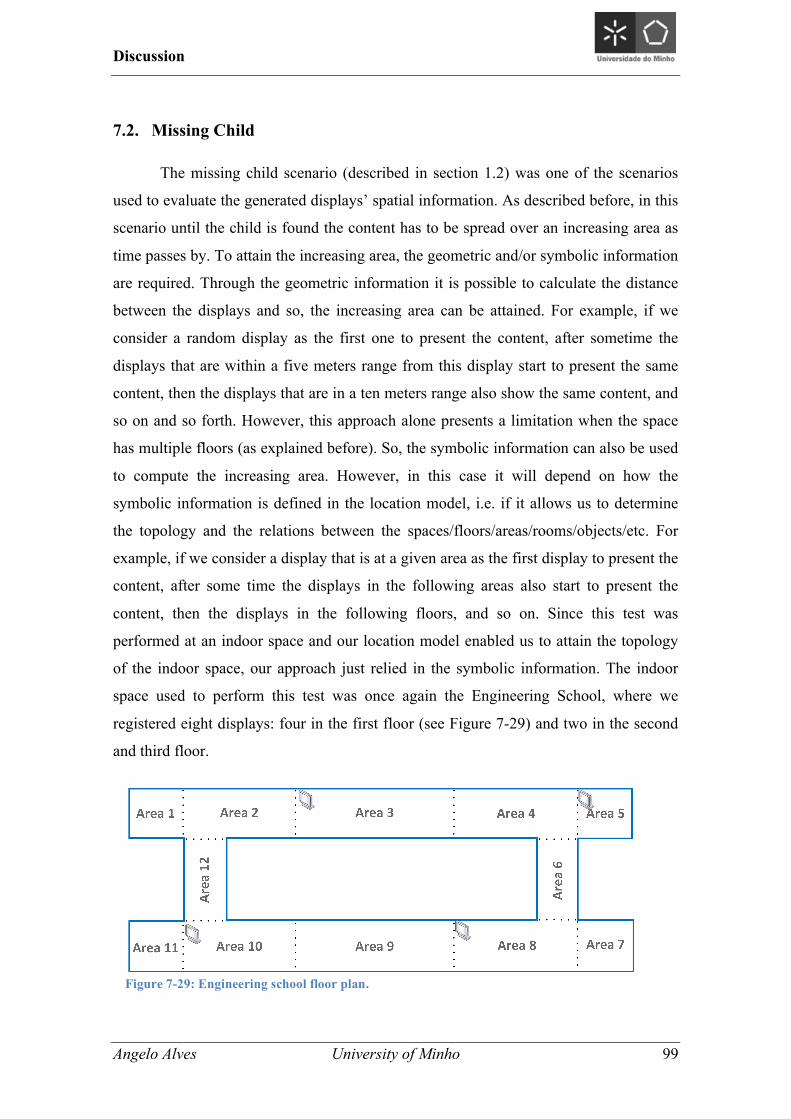
Discussion
Angelo Alves University of Minho 99
7.2. Missing Child
The missing child scenario (described in section 1.2) was one of the scenarios
used to evaluate the generated displays’ spatial information. As described before, in this
scenario until the child is found the content has to be spread over an increasing area as
time passes by. To attain the increasing area, the geometric and/or symbolic information
are required. Through the geometric information it is possible to calculate the distance
between the displays and so, the increasing area can be attained. For example, if we
consider a random display as the first one to present the content, after sometime the
displays that are within a five meters range from this display start to present the same
content, then the displays that are in a ten meters range also show the same content, and
so on and so forth. However, this approach alone presents a limitation when the space
has multiple floors (as explained before). So, the symbolic information can also be used
to compute the increasing area. However, in this case it will depend on how the
symbolic information is defined in the location model, i.e. if it allows us to determine
the topology and the relations between the spaces/floors/areas/rooms/objects/etc. For
example, if we consider a display that is at a given area as the first display to present the
content, after some time the displays in the following areas also start to present the
content, then the displays in the following floors, and so on. Since this test was
performed at an indoor space and our location model enabled us to attain the topology
of the indoor space, our approach just relied in the symbolic information. The indoor
space used to perform this test was once again the Engineering School, where we
registered eight displays: four in the first floor (see Figure 7-29) and two in the second
and third floor.
Figure 7-29: Engineering school floor plan.
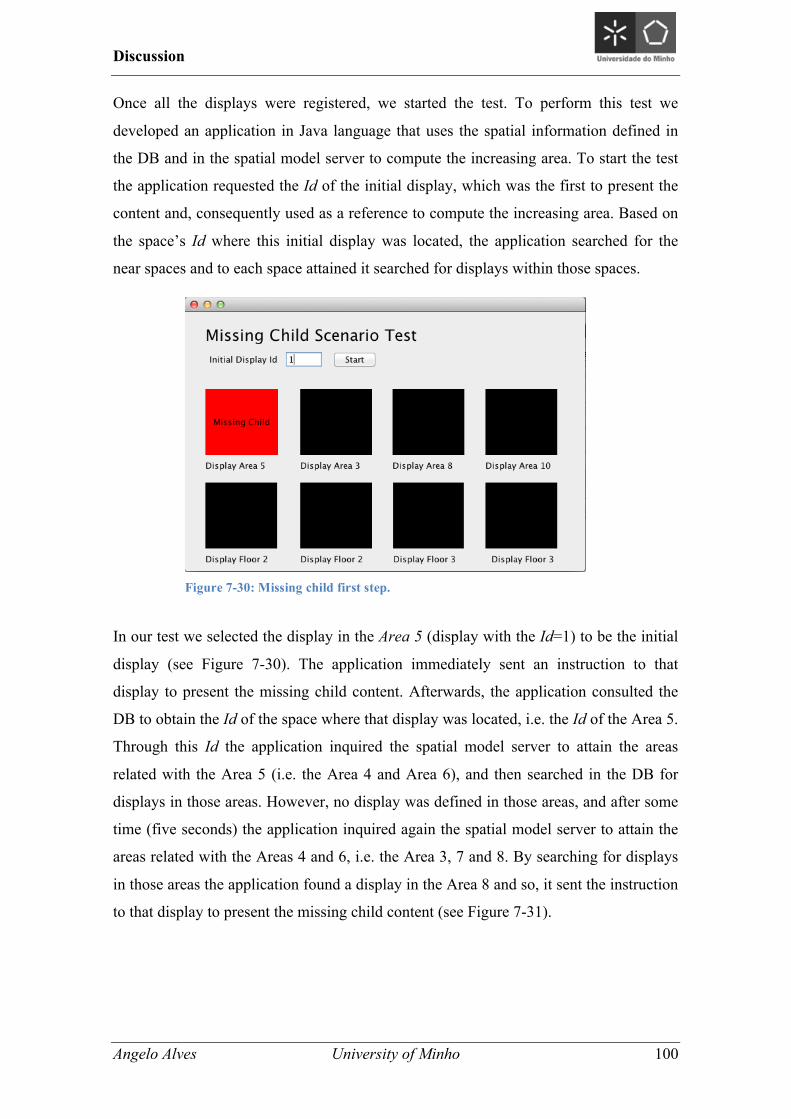
Discussion
Angelo Alves University of Minho 100
Once all the displays were registered, we started the test. To perform this test we
developed an application in Java language that uses the spatial information defined in
the DB and in the spatial model server to compute the increasing area. To start the test
the application requested the Id of the initial display, which was the first to present the
content and, consequently used as a reference to compute the increasing area. Based on
the space’s Id where this initial display was located, the application searched for the
near spaces and to each space attained it searched for displays within those spaces.
In our test we selected the display in the Area 5 (display with the Id=1) to be the initial
display (see Figure 7-30). The application immediately sent an instruction to that
display to present the missing child content. Afterwards, the application consulted the
DB to obtain the Id of the space where that display was located, i.e. the Id of the Area 5.
Through this Id the application inquired the spatial model server to attain the areas
related with the Area 5 (i.e. the Area 4 and Area 6), and then searched in the DB for
displays in those areas. However, no display was defined in those areas, and after some
time (five seconds) the application inquired again the spatial model server to attain the
areas related with the Areas 4 and 6, i.e. the Area 3, 7 and 8. By searching for displays
in those areas the application found a display in the Area 8 and so, it sent the instruction
to that display to present the missing child content (see Figure 7-31).
Figure 7-30: Missing child first step.
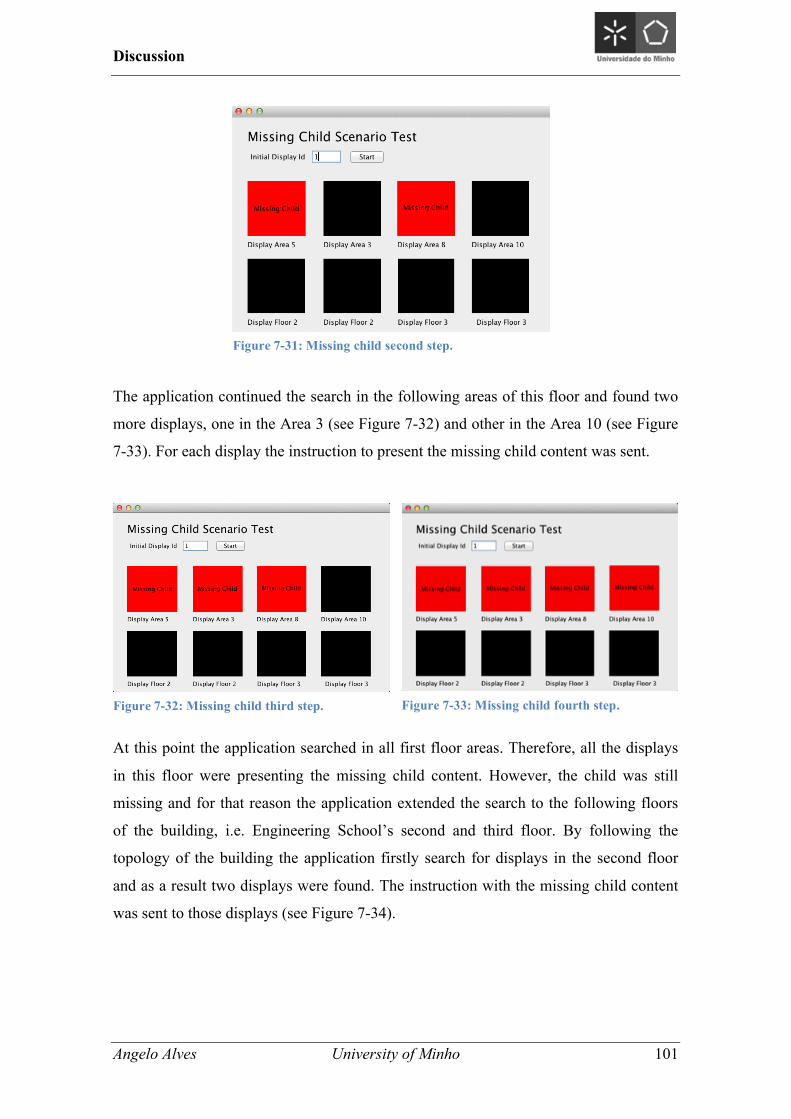
Discussion
Angelo Alves University of Minho 101
The application continued the search in the following areas of this floor and found two
more displays, one in the Area 3 (see Figure 7-32) and other in the Area 10 (see Figure
7-33). For each display the instruction to present the missing child content was sent.
At this point the application searched in all first floor areas. Therefore, all the displays
in this floor were presenting the missing child content. However, the child was still
missing and for that reason the application extended the search to the following floors
of the building, i.e. Engineering School’s second and third floor. By following the
topology of the building the application firstly search for displays in the second floor
and as a result two displays were found. The instruction with the missing child content
was sent to those displays (see Figure 7-34).
Figure 7-31: Missing child second step.
Figure 7-32: Missing child third step. Figure 7-33: Missing child fourth step.
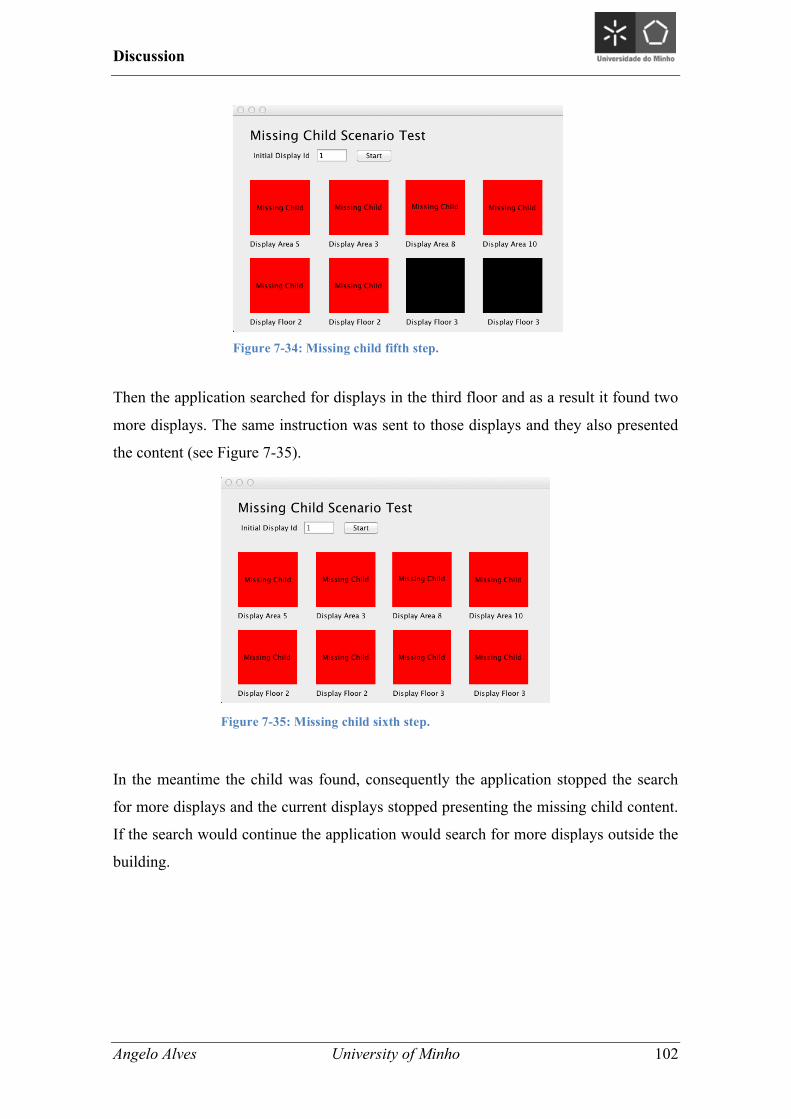
Discussion
Angelo Alves University of Minho 102
Then the application searched for displays in the third floor and as a result it found two
more displays. The same instruction was sent to those displays and they also presented
the content (see Figure 7-35).
In the meantime the child was found, consequently the application stopped the search
for more displays and the current displays stopped presenting the missing child content.
If the search would continue the application would search for more displays outside the
building.
Figure 7-34: Missing child fifth step.
Figure 7-35: Missing child sixth step.
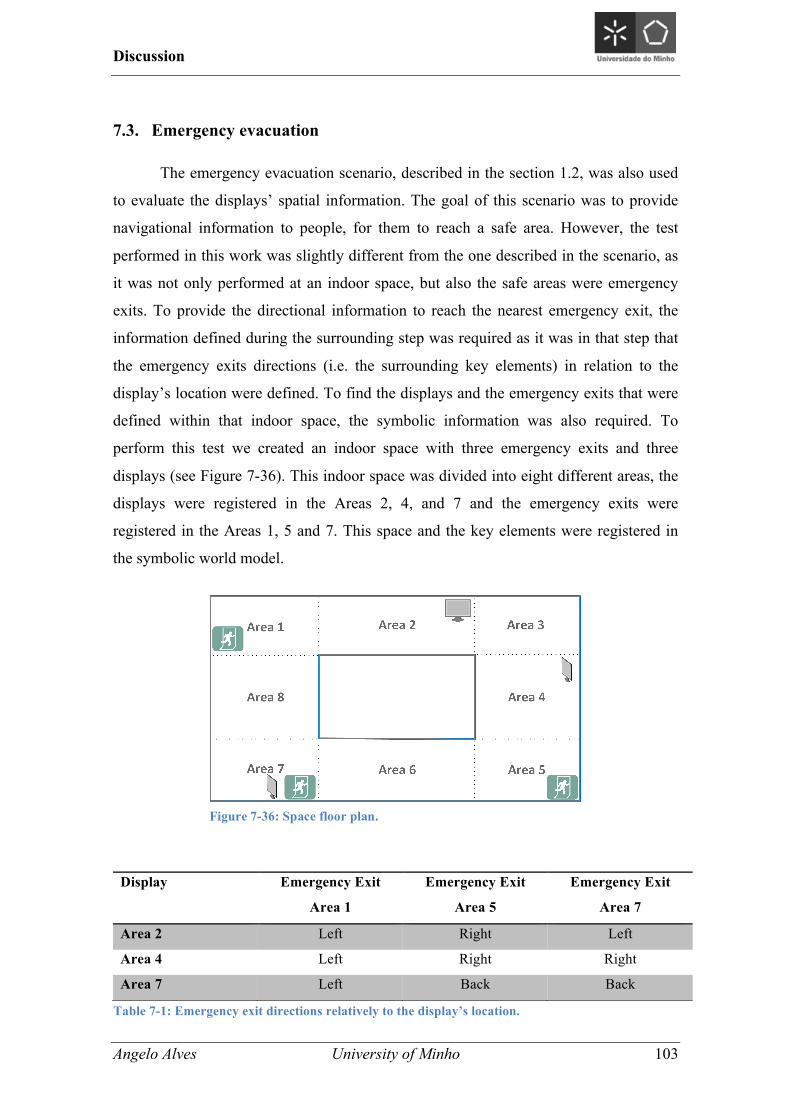
Discussion
Angelo Alves University of Minho 103
7.3. Emergency evacuation
The emergency evacuation scenario, described in the section 1.2, was also used
to evaluate the displays’ spatial information. The goal of this scenario was to provide
navigational information to people, for them to reach a safe area. However, the test
performed in this work was slightly different from the one described in the scenario, as
it was not only performed at an indoor space, but also the safe areas were emergency
exits. To provide the directional information to reach the nearest emergency exit, the
information defined during the surrounding step was required as it was in that step that
the emergency exits directions (i.e. the surrounding key elements) in relation to the
display’s location were defined. To find the displays and the emergency exits that were
defined within that indoor space, the symbolic information was also required. To
perform this test we created an indoor space with three emergency exits and three
displays (see Figure 7-36). This indoor space was divided into eight different areas, the
displays were registered in the Areas 2, 4, and 7 and the emergency exits were
registered in the Areas 1, 5 and 7. This space and the key elements were registered in
the symbolic world model.
Display Emergency Exit
Area 1
Emergency Exit
Area 5
Emergency Exit
Area 7
Area 2 Left Right Left
Area 4 Left Right Right
Area 7 Left Back Back
Table 7-1: Emergency exit directions relatively to the display’s location.
Figure 7-36: Space floor plan.
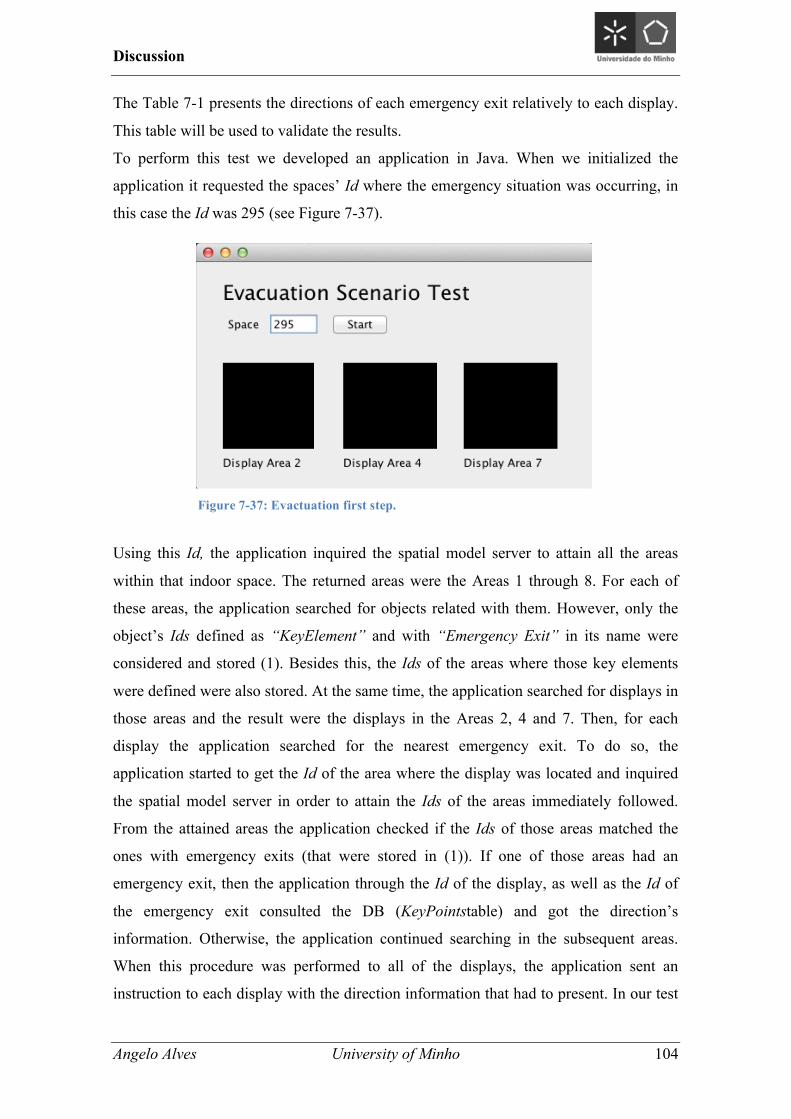
Discussion
Angelo Alves University of Minho 104
The Table 7-1 presents the directions of each emergency exit relatively to each display.
This table will be used to validate the results.
To perform this test we developed an application in Java. When we initialized the
application it requested the spaces’ Id where the emergency situation was occurring, in
this case the Id was 295 (see Figure 7-37).
Using this Id, the application inquired the spatial model server to attain all the areas
within that indoor space. The returned areas were the Areas 1 through 8. For each of
these areas, the application searched for objects related with them. However, only the
object’s Ids defined as “KeyElement” and with “Emergency Exit” in its name were
considered and stored (1). Besides this, the Ids of the areas where those key elements
were defined were also stored. At the same time, the application searched for displays in
those areas and the result were the displays in the Areas 2, 4 and 7. Then, for each
display the application searched for the nearest emergency exit. To do so, the
application started to get the Id of the area where the display was located and inquired
the spatial model server in order to attain the Ids of the areas immediately followed.
From the attained areas the application checked if the Ids of those areas matched the
ones with emergency exits (that were stored in (1)). If one of those areas had an
emergency exit, then the application through the Id of the display, as well as the Id of
the emergency exit consulted the DB (KeyPointstable) and got the direction’s
information. Otherwise, the application continued searching in the subsequent areas.
When this procedure was performed to all of the displays, the application sent an
instruction to each display with the direction information that had to present. In our test
Figure 7-37: Evactuation first step.
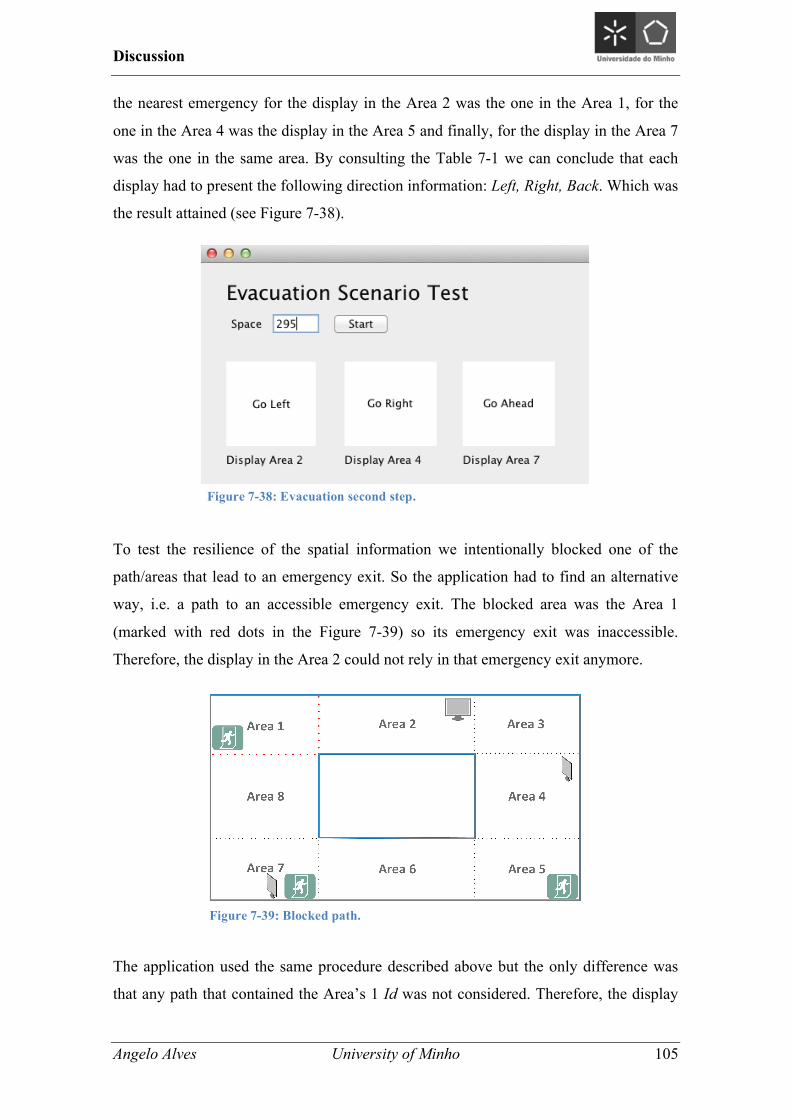
Discussion
Angelo Alves University of Minho 105
the nearest emergency for the display in the Area 2 was the one in the Area 1, for the
one in the Area 4 was the display in the Area 5 and finally, for the display in the Area 7
was the one in the same area. By consulting the Table 7-1 we can conclude that each
display had to present the following direction information: Left, Right, Back. Which was
the result attained (see Figure 7-38).
To test the resilience of the spatial information we intentionally blocked one of the
path/areas that lead to an emergency exit. So the application had to find an alternative
way, i.e. a path to an accessible emergency exit. The blocked area was the Area 1
(marked with red dots in the Figure 7-39) so its emergency exit was inaccessible.
Therefore, the display in the Area 2 could not rely in that emergency exit anymore.
The application used the same procedure described above but the only difference was
that any path that contained the Area’s 1 Id was not considered. Therefore, the display
Figure 7-38: Evacuation second step.
Figure 7-39: Blocked path.
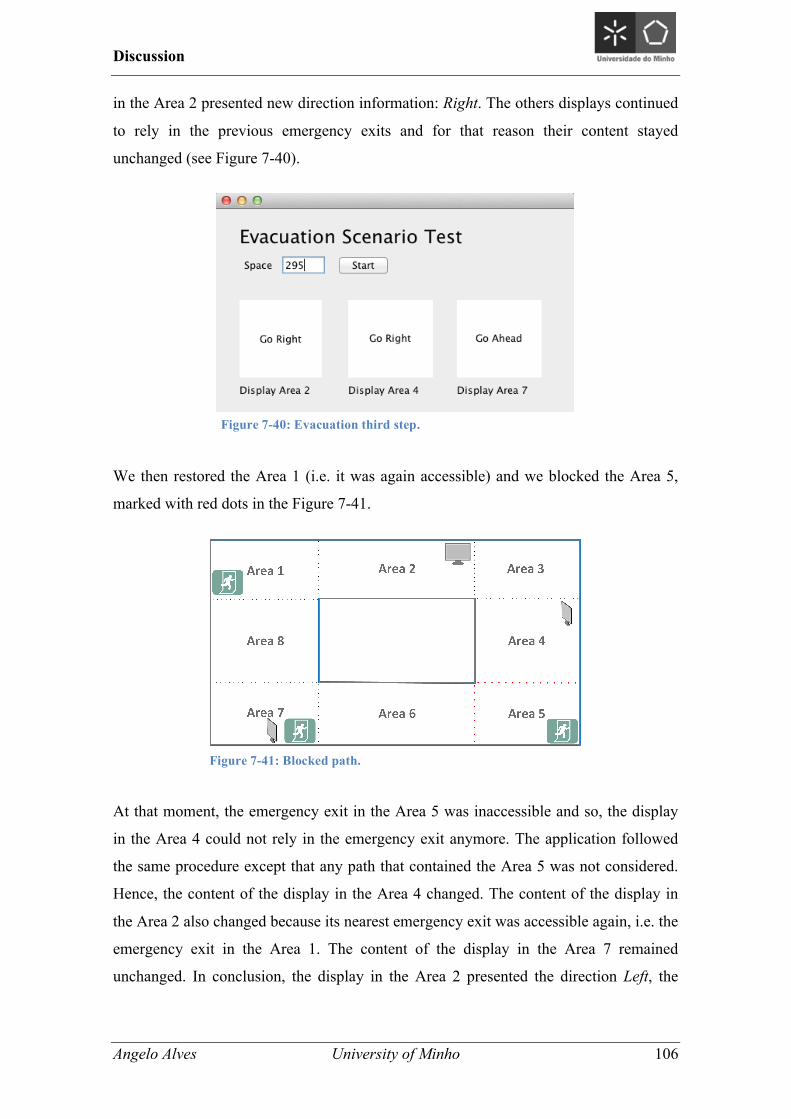
Discussion
Angelo Alves University of Minho 106
in the Area 2 presented new direction information: Right. The others displays continued
to rely in the previous emergency exits and for that reason their content stayed
unchanged (see Figure 7-40).
We then restored the Area 1 (i.e. it was again accessible) and we blocked the Area 5,
marked with red dots in the Figure 7-41.
At that moment, the emergency exit in the Area 5 was inaccessible and so, the display
in the Area 4 could not rely in the emergency exit anymore. The application followed
the same procedure except that any path that contained the Area 5 was not considered.
Hence, the content of the display in the Area 4 changed. The content of the display in
the Area 2 also changed because its nearest emergency exit was accessible again, i.e. the
emergency exit in the Area 1. The content of the display in the Area 7 remained
unchanged. In conclusion, the display in the Area 2 presented the direction Left, the
Figure 7-40: Evacuation third step.
Figure 7-41: Blocked path.
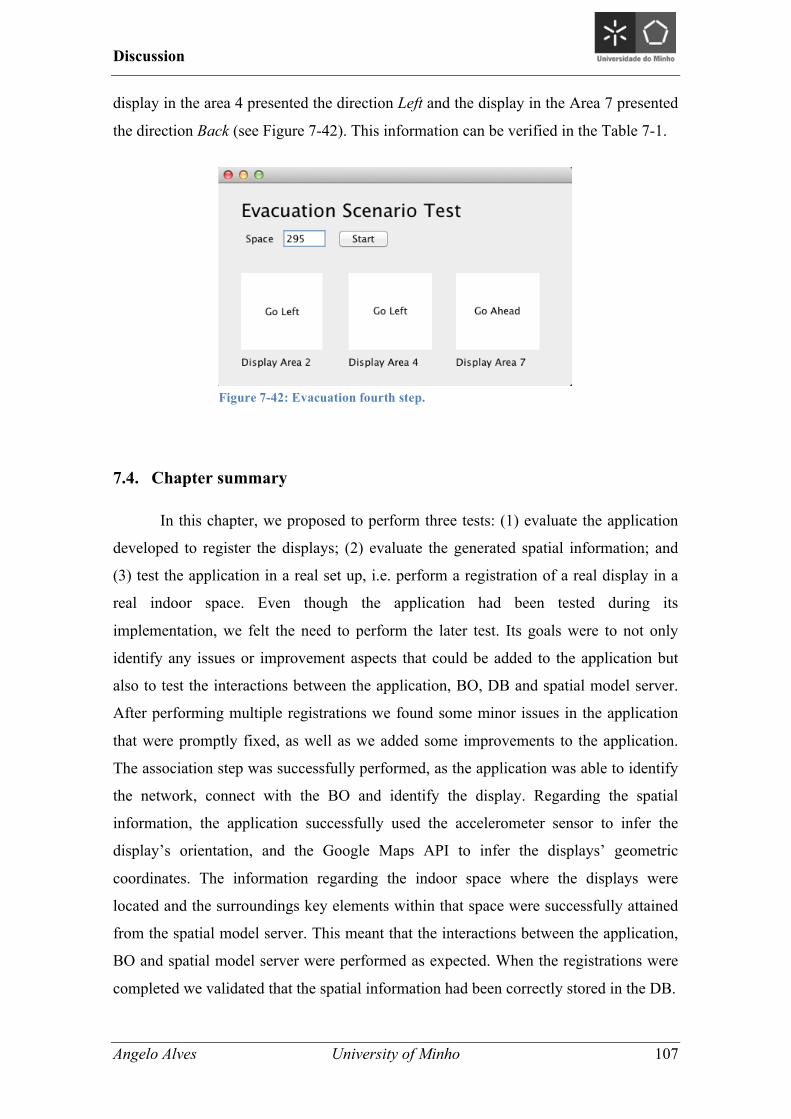
Discussion
Angelo Alves University of Minho 107
display in the area 4 presented the direction Left and the display in the Area 7 presented
the direction Back (see Figure 7-42). This information can be verified in the Table 7-1.
7.4. Chapter summary
In this chapter, we proposed to perform three tests: (1) evaluate the application
developed to register the displays; (2) evaluate the generated spatial information; and
(3) test the application in a real set up, i.e. perform a registration of a real display in a
real indoor space. Even though the application had been tested during its
implementation, we felt the need to perform the later test. Its goals were to not only
identify any issues or improvement aspects that could be added to the application but
also to test the interactions between the application, BO, DB and spatial model server.
After performing multiple registrations we found some minor issues in the application
that were promptly fixed, as well as we added some improvements to the application.
The association step was successfully performed, as the application was able to identify
the network, connect with the BO and identify the display. Regarding the spatial
information, the application successfully used the accelerometer sensor to infer the
display’s orientation, and the Google Maps API to infer the displays’ geometric
coordinates. The information regarding the indoor space where the displays were
located and the surroundings key elements within that space were successfully attained
from the spatial model server. This meant that the interactions between the application,
BO and spatial model server were performed as expected. When the registrations were
completed we validated that the spatial information had been correctly stored in the DB.
Figure 7-42: Evacuation fourth step.
Discussion
Angelo Alves University of Minho 108
The second and third tests allowed us to evaluate if the displays’ spatial
information was generated with the required level of detail to fulfil the spatial needs of
those scenarios. More precisely, the goal of the second test was to disseminate the
content over an increasing area. Using the symbolic information it was possible to
determine the displays that were near to a given display and so, the increasing area was
achieved. As previously explained, once this test was performed at an indoor space with
multiple floors we could have not relied in the geometric information. The missing child
content was successfully spread over the displays in the first floor of the Engineering
School and then over the displays in the second and third floors. Regarding the third
test, its goal was to provide assistance in an emergency situation by indicating the
direction of the near emergency exit. To attain the required information, we relied in the
information of the space where the displays were located, as well as in the surrounding
key elements of that space. The space’s information was required to identify the
displays and the emergency exits within that space, while the surrounding information
was required to attain the direction that the displays had to present to its nearest
emergency exit. Through the results attained, we validated that all the displays
presented the correct direction information to their nearest emergency exit. We then
blocked some paths/areas to evaluate if the application would be able to compute an
alternative path, i.e. a path that lead to an accessible emergency exit. The application
was able to compute an alternative way just by relying in the available spatial
information of the displays.
In summary, based on these results we can conclude that the application is
working as expected and the spatial information is being generated with the required
level of detail.
Conclusion and outlook
Angelo Alves University of Minho 109
8. Conclusion and outlook
This final chapter presents the main conclusions of this work. At this point, all
the work developed in this thesis and the basis in which this work accents were
presented. Moreover, multiple tests over the application and the generated spatial
information were performed. We start to present the remarks of this work (section 8.1)
and then we introduce some possible developments and challenges (section 8.2).
Conclusion and outlook
Angelo Alves University of Minho 110
8.1. Concluding remarks
The main outcome of this thesis is a fully functional Android application to
register public displays at any indoor space. This application generates and collects the
required spatial information (i.e. the orientation, location, space and surrounding
information) to perform the display’s registration. These spatial requirements were
identified based on the ones imposed by the display’s usage patterns (section 4).
This application is to be used at any smartphone running the Android OS. We
decided to rely on the smartphone’s accelerometer sensor to attain the orientation
information and the Google services to attain the location information. These automatic
approaches were followed because the collected information is more accurate and
immune to errors during the registration. Contrarily, the information regarding the
indoor space and the surroundings key elements are manually defined. This information
is stored at the location model. We used the symbolic world model developed by Baras
K. et al. (2001) as it provides all the spatial needs of our solution.
The system’s architecture required by our application is composed by: a back-
office, database, location model and a network (section 5). In order to work as expected,
we assume that these elements are already implemented and running. However, we did
not impose how they should be developed. The only constraint is the back-office since it
has to strictly follow the application’s API, in order to perform the interactions with the
application. Even though we used the spatial model server developed by Baras K. et al.
(2001), we developed and implemented the back-office (Java), database (MySQL) and
the network (Wireless Ad-Hoc network).
Once the application and all the elements of the system’s architecture were fully
implemented, we performed exhaustive tests to the whole system. The main goals of
these tests were to evaluate the application’s behaviour and to identify any area of
improvement in the application. This first phase of tests was conducted at a virtual and
controlled environment but afterwards, we tested it in a real set-up, i.e. performing a
registration of a real display at a real indoor space. To perform this second test, we
created a Wi-Fi Ad Hoc network to connect the application and the back-office and we
registered the Engineering School and their key elements (such as: exits and emergency
exits) in the symbolic world model. After performing the registration, we concluded that
Conclusion and outlook
Angelo Alves University of Minho 111
the application was working as expected and the spatial information was successfully
generated, collected and stored.
To evaluate if the spatial information was generated with the required level of
detail to match the spatial needs of the display’s usage patterns, we built two tests
environments. To do so, we developed two applications in Java, one to simulate the
missing child scenario and the other to simulate an emergency evacuation scenario.
Both of these applications just used the spatial information generated by the application
and stored it in the database to present the appropriate content in the displays. We
concluded that the spatial information was generated with the required level of detail as
the spatial requirements of these two tests were successfully attained.
8.2. Future research and challenges
Further extensions and/or improvements can be considered, some are described
below.
Regarding the location model, it would be interesting to improve the used model
or develop a new one with more relations. The current model only allows using one of
the available relations, which was the “Is_Accessible_From (bidirectional)”.
In the domain of the space, we would like to expand the registration to outdoor
spaces and perform tests at such spaces.
In the application scope, we intent to use the Foursquare/Facebook API to attain
the name of the places through the geometric coordinates, and also to perform
registration of displays at outdoor spaces.
Lastly, a study to evaluate how random users use our application to perform the
registration could be exploited. Through this study we could identify how random users
use the application, which complications they encounter and what they think about the
application. Through this feedback, further improvements could be performed.

Conclusion and outlook
Angelo Alves University of Minho 112
Bibliography
Angelo Alves University of Minho 113
9. Bibliography
Alt, F., Schmidt, A., and Schmidt, A. (2012). Advertising on Public Display Networks. In IEEE Computer (Volume: 45, Issue: 5) p. 50-56. Arjan J. H. Peddemors, Eiko Yoneki (2009). Decentralized Probabilistic World Modeling with Cooperative Sensing. In Electronic Communication of the European Association of Software Science and Technology, vol. 17, 2009. Baras K. (2001). Dynamic world model for context-aware environments. Becker C. and Dürr F. (2005). On location models for ubiquitous computing. In Personal and Ubiquitous Computing archive Volume 9 Issue 1, January 2005 p. 20 – 31. Beigl, M., Zimmer, T. and Decker, C. (2002). A location model for communicating and processing of context. Personal Ubiquitous Comput., 6, 341–357. Brumitt, B., Meyers, B., Krumm, J., Kern, A. and Shafer, S.A. (2000). Easyliving: Technologies for intelligent environments. In P.J. Thomas & H.W. Gellersen, eds., Handheld and Ubiquitous Computing, vol. 1927 of Lecture Notes in Computer Science, 97–119, Springer-Verlag., London, UK, handheld and Ubiquitous Computing, Second International Symposium, HUC 2000, Bristol, UK, September 25-27, 2000, Proceedings. Brumitt, B. and Shafer, S. (2001). Topological world modeling using semantic spaces. In UbiComp 2001 Workshop on Location Modeling for Ubiquitous Computing. Davies, N., Langheinrich, M., Jose, R., and Schmidt, A. (2012). Open Display Networks: A Communications Medium for the 21st Century. In IEEE Computer (Volume: 45, Issue: 5) p. 58-64. Domnitcheva, S. (2001). Location modeling: State of the art and challenges. In Proceedings of the Workshop on Location Modeling for Ubiquitous Computing, 13–19, Atlanta, Georgia, United States. Domnitheva, S. (2001). Location Modeling: State of the Art and Challenges Hamhoum F., Kray C. (2012). Supporting pilgrims in navigating densely crowded religious sites. In Personal and Ubiquitous Computing archive Volume 16 Issue 8, December 2012 p. 1013-1023.
Bibliography
Angelo Alves University of Minho 114
F. Hohl, U. Kubach, A. Leonhardi, K. Rothermel, M. Schwehm (1999). Next Century Challenges: Nexus - An Open Global Infrastructure for Spatial-Aware Applications. In Proceedings of the Fifth Annual International Conference on Mobile Computing and Networking (MobiCom '99), p. 249-255. Friday, A., Davies, N., and Efstratiou, C. (2012). Reflections on Long-Term Experiments with Public Displays. In IEEE Computer (Volume: 45, Issue: 5) p. 34-41. Gerd Kortuem, Christian Kray , Hans Gellersen (2005). Sensing and Visualizing Spatial Relations of Mobile Devices. The 18th annual ACM symposium on User interface software and technology (UIST ' 05). ACM, p. 93-102. Glenn Judd and Peter Steenkiste (2003). Providing Contextual Information to Pervasive Computing Applications. In PERCOM '03 Proceedings of the First IEEE International Conference on Pervasive Computing and Communications p.133. Hans Gellersen, Carl Fischer, Dominique Guinard, Roswitha Gostner, Gerd Kortuem, Christian Kray, Enrico Rukzio and Sara Streng (2009). Supporting device discovery and spontaneous interaction with spatial references. In Personal and Ubiquitous Computing archive Volume 13 Issue 4, May 2009 p. 255-264. Hightower, Jeffrey and Gaetano Borriello (2001). Location Sensing Techniques. Hightower J., and Borriello, G. (2001). Location systems for ubiquitous computing. In IEEE Computer (Volume:34 , Issue: 8) p. 57-66. Hsieh, W.T., Miller, N., Yang, Y.F., Chou, S.C. and Steenkiste, P. (2004). Calculating walking distance in a hybrid space model. In First International Workshop on Advanced Context Modelling, Reasoning And Management. Hu, H. and Lee, D.L. (2004). Semantic location modeling for location navigation in mobile environment. In Proceedings of the 2004 IEEE International Conference on Mobile Data Management (MDM’04), 52–61. Ichiro Satoh (2007). A location model for smart environments. In Pervasive and Mobile Computing archive Volume 3 Issue 2, March, 2007 p. 158-179. Jeffrey Hightower, Barry Brumitt and Gaetano Borriello (2002). The Location Stack: A Layered Model for Location in Ubiquitous Computing. In WMCSA '02 Proceedings of the Fourth IEEE Workshop on Mobile Computing Systems and Applications pp. 22. Kray, Christian and Anselm Blocher (1999). Modeling the Basic Meanings of Path Relations. In Proceedings of the 16th IJCAI. Kray C., Gerd K., Antonio K. (2005). Adaptive Navigation Support with Public Displays. In Proceedings of IUI 2005. Kray C., Cheverst K., Harrison M., Hamhoum F. and Wagner J. (2008). Towards a location model for indoor navigation support through public displays and mobile devices.
Bibliography
Angelo Alves University of Minho 115
Kolodziej, K. and Danado, J. (2004). In-building positioning: modeling location for indoor world. In Database and Expert Systems Applications, 2004. Proceedings. 15th International Workshop on, 830 – 834. 17, 19 Keith Cheverst, Nigel Davies, Keith Mitchell and Adrian Friday (2000). Experiences of Developing and Deploying a Context Aware Tourist Guide: The GUIDE Project. In MobiCom '00, Proceedings of the 6th annual international conference on Mobile computing and networking, p 20-31. Martin Bauer, Christian Becker, Kurt Rothermel (2001). Location Models from the Perspective of Context-Aware Applications and Mobile Ad Hoc Networks, December 2002, Volume 6, Issue 5-6, p 322-328. Strohbach M., Kovacs E., Martin M. (2009). Pervasive Display Networks – Real-world Internet Services for Public Displays. Mike Hazas, Christian Kray, Hans Gellersen, Henoc Agbota, Gerd Kortuem and Albert Krohn (2005). A relative positioning system for co-located mobile devices. In MobiSys '05 Proceedings of the 3rd international conference on Mobile systems, applications, and services p. 177-190. Miller, N. and Steenkiste, P. (2007). Design and evaluation of a hybrid physical space service for pervasive computing applications. In Mobile and Ubiquitous Systems: Networking and Services, 2007. MobiQuitous 2007. Fourth Annual International Conference on, 1–8. 20. Nicklas, Daniela, Matthias Großmann, Thomas Schwarz, Steffen Volz and Bernhard Mitschang (2001). A Model-Based, Open Architecture for Mobile, Spatially Aware Applications. In SSTD '01 Proceedings of the 7th International Symposium on Advances in Spatial and Temporal Databases p. 117-135. Miaosen Wang, Sebastian Boring, and Saul Greenberg (2012). Proxemic peddler: a public advertising display that captures and preserves the attention of a passerby. In PerDis '12 Proceedings of the 2012 International Symposium on Pervasive Displays Article No. 3. Ojala, T., Kostakos, V., Kukka, H., Heikkinen, T., Linden, T., Jurmu, M., Hosio, S., Kruger, F., and Zanni, D. (2012). Multipurpose Interactive Public Displays in the Wild: Three Years Later. In IEEE Computer (Volume: 45, Issue: 5) p. 42-49. Schilit B., Adams N., Gold R., Tso M., Want R. (1993). The ParcTab Mobile Computing System. Storz O., Friday A., Davies N. (2008). Supporting content scheduling on situated public displays. In Computers & Graphics 01/2006; 30:681-691. DOI:10.1016/j.cag.2006.07.002. Othmar Lehmann, Martin Bauer, Christian Becker and Daniela Nicklas (2004). From Home to World - Supporting Context-aware Applications through World Models. In
Bibliography
Angelo Alves University of Minho 116
PERCOM '04 Proceedings of the Second IEEE International Conference on Pervasive Computing and Communications (PerCom'04) p. 297. Pei-Hung Hsieh, Soe-Tsyr Yaun (2003). Dynamic Semantic Location in Mobile Enterprise Applications. In ICEC '03 Proceedings of the 5th international conference on Electronic commerce, p. 102-110. Pradhan, S. (2000). Semantic location. Personal Ubiquitous Computing, 4, p. 213–216. Roy Want, Andy Hopper, Veronica Falcão and Jonathan Gibbons (1992). The active badge location system. In ACM Transactions on Information Systems (TOIS) TOIS Homepage archive Volume 10 Issue 1, Jan. 1992 p. 91-102. José R. (2006). Beyond application-led research in pervasive display systems. In International conference on pervasive computing, Dublin, Ireland, 2006 – "Proceedings of the Pervasive 2006". [S.l. : s.n., 2006]. Madeira R. (2010). Public displays and mobile devices in an augmented objects framework for Ubiquitous Learning. Shahram Izadi, Harry Brignull, Tom Rodden, Yvonne Rogers, and Mia Underwood (2003). Dynamo: a public interactive surface supporting the cooperative sharing and exchange of media. Proceedings of the 16th annual ACM symposium on User interface software and technology (UIST '03). Satoh, I. (2008). A spatial communication model for ubiquitous computing services. Journal of Networks, 3, p. 10–20. Stahl, C., Baus, J., Brandherm, B., Schmitz, M., and Schwartz, T. (2005). Navigational - and shopping assistance on the basis of user interactions in intelligent environments. In Intelligent Environments, 2005 the IEE International Workshop on (Ref. No. 2005/11059), p. 182-191. Taylor, N., Cheverst, K. (2012). Supporting Community Awareness with Interactive Displays. In IEEE Computer (Volume: 45, Issue: 5) p. 26-32. Till Ballendat, Nicolai Marquardt, and Saul Greenberg (2010). Proxemic interaction: designing for a proximity and orientation-aware environment. In ITS '10 ACM International Conference on Interactive Tabletops and Surfaces p. 121-130. Want, R. ; Schilit, B.N. (2012). Interactive Digital Signage. In IEEE Computer (Volume: 45, Issue: 5) p. 21-24. Ward A., Jones A., Hopper A. (2002). A new location technique for the active office. In Personal Communications, IEEE (Volume:4 , Issue: 5 ). Ye, J., Coyle, L., Dobson, S. and Nixon, P. (2007). A unified semantics space model. In Location- and Context-Awareness, vol. 4718 of Lecture Notes in Computer Science, 103–120, Springer Berlin Heidelberg.

Bibliography
Angelo Alves University of Minho 117
Top Related