


Languages
Pages
Legal

Review of Epidemics with Pathogen Mutation on
Small World Networks
and testing of control strategies ______________________________________________________________
Nadia Flores
Daniel Jackson
Robert Phillips
Manuel Rivera
Zach Rogers
Math 485
May 9, 2010
We model the outbreak of a mutating pathogen on a small-world social-spacial network, and
study the time-dependent dynamics. We examine the influence of the immunity duration, τi, cross-
immunity threshold, hthr, and system size, N, on epidemic dynamics. With the inclusion of a population
at risk, one which is more susceptible to infection and experiences more severe symptoms, we explore
various vaccination schemes and analyze their effectiveness. We find that the size of the population at
risk is directly related to the severity of an outbreak, and that targeted vaccination of the population at
risk was the most effective immunization strategy. The outbreak of a contagious novel virus is a major
concern to both public health and safety, causing economic havoc and the deaths of large numbers of
people. Recent outbreaks of diseases such as SARS and the recent H1N1 flu outbreak indicate how
rapidly a potentially deadly virus can spread around the world and infect many millions of people.
2
Introduction
Epidemiology is the study of infection dynamics on a network of people. In a given population,
an epidemic occurs when new cases of a certain disease substantially exceed what is expected, based
on recent experience, leading to widespread infection. It is important to study both the history and
potential future of epidemics of diseases such as AIDS and Pandemic Flu, which have killed millions
worldwide. In 2009, Influenza A(H1N1/09) emerged, and while not as catastrophic as initially feared,
Influenza A(H1N1/09) was genetically close to the Spanish Flu strain of the early 20th
Century that
killed millions worldwide. It demonstrated how a highly contagious novel virus could rapidly spread to
all nations on Earth in less than one year. Rapidly mutating diseases present some of the most
dangerous cases for natural pandemic or bio-terrorist attack [1]. Studying disease spread across socio-
spatial networks is an important aspect in understanding disease-contraction dynamics and determining
methods to limit outbreak [1].
Accurate models of pathogen-spread and containment are an important asset in predicting the
threat and long-term outcome of an emerging epidemic, and in determining the most effective and cost-
efficient method of vaccination. Programs such as childhood-immunization [2] have benefited greatly
from such models.
While many models have been created to map the spread of a disease for these purposes, few
incorporate both pathogen mutation and a realistic socio-spatial network [1]. Societal realities, such as
stronger links between family members than strangers, are important aspects for the spread of a
pathogen. The interaction between immunity and pathogen mutation also affects the dynamics. Models
based on uniform mixing of a network are not realistic. Individuals spend more time with their families,
coworkers, and friends than with strangers. Small-world networks capture two key features of true
social networks. Firstly, they are highly clustered; two nodes which share a neighbor are likely to
3
themselves be neighbors. Secondly, the diameter of the graph, the minimum number of vertices
between any two nodes, increases logarithmically with network size [3].
The paper Epidemics with pathogen mutation on small-world networks written by Zhi-Gang
Shao, Zhi-Jie Tan, Xian-Wu Zhou, Zhun-Zhi Jin, all faculty at the physics department of Wuhan
University, was the original source for this model. The authors created their model as a more realistic
study of disease outbreak on society [1]. We first replicated their model and results. Then we proceeded
to incorporate an additional feature, the population at risk, and study the effectiveness of various
vaccination schemes.
Review of Author’s Model
SIRS Model
The model being proposed is an S(susceptible)I(infected)R(immune)S(susceptible) model. Any
node in the network progresses from susceptible to infection, to infected, to immune, and back to
susceptible as time progresses. The model also includes pathogen mutation meaning that immunity to
all the strains moving through the system at a time step is less likely. Simpler models are SIS, and SIR
models. In SIS models there is no immunity stage and an individual can become infected immediately
after it has recovered. In SIR models once infected an individual retains immunity indefinitely. An
SIRS model is a better model for studying the pathogens with higher epidemic risk.
Small World Networks
A small world network is a collection of N nodes, which serve to represent individuals. The
nodes each have a history which records the strains they have been infected with or are currently
infected with. The nodes are connected together creating the network. The model is stochastic, and thus
requires that we create several distinct networks to run it on to account for the variability introduced by
randomness. To create the networks each node starts out in a linear sequence connected to its 2k nearest

4
neighbors, the first and last nodes being next to each other. The authors took k to be 2. To turn this from
a fully symmetric network into a small world network we proceed from node to node and rewire each
of the k clockwise connections to a random node, with a probability p, and maintain the connection
with probability 1-p. The model prevents both self-connections and multiple-connections between two
nodes. Small-world behavior occurs when the probability of rewiring a connection is larger than 1/N
[3]. The authors used network sizes of 104 , 10
5 , and 10
6 and took p = 0.01, well within the small world
range [1].
Figure 1 illustrates the distinction between a regular network, a small world network, and a random
network.
D.J. Watts and S.H. Strogatz, Nature 393 (1998), p. 440.
Figure 1: Small-World Network, as an intermediary between a purely regular network and a completely random
network.
Mutating pathogen
Each node can be in one of three states: S-susceptible to infection, I-infected, and R-immune.
Once an individual in state S is infected it passes into the immune-state after the infection time τi. The
individual stays immune until the end of the immunity duration τR. This is referred to a SIRS model.
Introducing mutation into the model causes new strains to appear in the system. These new strains can
5
infect individuals immune to previous strains. Immunity is conferred if the new strain is similar enough
to old strains in the immune response memory.
Pathogens are represented using a binary model, in which each pathogen strain is represented by
a unique bit-string of length l, i.e. 1010000011. These bit-strings serve as abstract representations of the
genetic code of the pathogen [1]. Mutation is carried out by flipping a single digit in the bit string
representation. Mutations can occur only during an infection event, and do so with probability µ = 0.01.
Since each bit-string is length l, the total number of possible strains is 2l and with 10
5 nodes it is likely
that mutations will cause a large number of strains to be present at any one time.
An individual will be immune to any pathogens similar to ones in its immunity repertoire [1].
This similarity between strains is measured by the hamming-distance. The hamming-distance between
A and B is simply the l1 norm of A and B.
To clarify, let ivvvvV il 1,0,...,, 21 be the set of all possible virus strains of length l .
Then the hamming-distance between two strains VBA , , is defined as
l
i
iidist baBAH1
),( .
The epidemic is started by randomly choosing one node to be infected with the initial strain
000...000. At each time-step, infected nodes send challenge-strains to their nearest neighbors,
simulating contact with infectious individuals. The challenge-strain is then compared to the immunity
repertoire of the neighboring node. If the minimum hamming-distance between the challenge-strain and
all the strains in the repertoire of the neighboring node is greater than hthr, the cross-immunity
threshold, then the neighboring node becomes infected.
To simplify the model each strain has the same immunity duration, infection time, mutation
probability and cross-immunity threshold. The length of the bit string is set to l = 10 and the infection
time is set to τi = 1 for all variations of the parameters studied [1].
6
The numerical model was implemented in C++. Since this is a stochastic model, data gathered
for each variation of network parameters was run over ten different networks with at least fifty runs per
network. This was to account for the randomness inherent in the construction of the networks and in
mutation events (parameters p and μ, respectively). The resulting data was then averaged to a single
data set. The original authors averaged data for ten networks with one hundred runs each. Time-
constraints and the limitations of our computing power prevented exact replication of the previous
effort.
Results
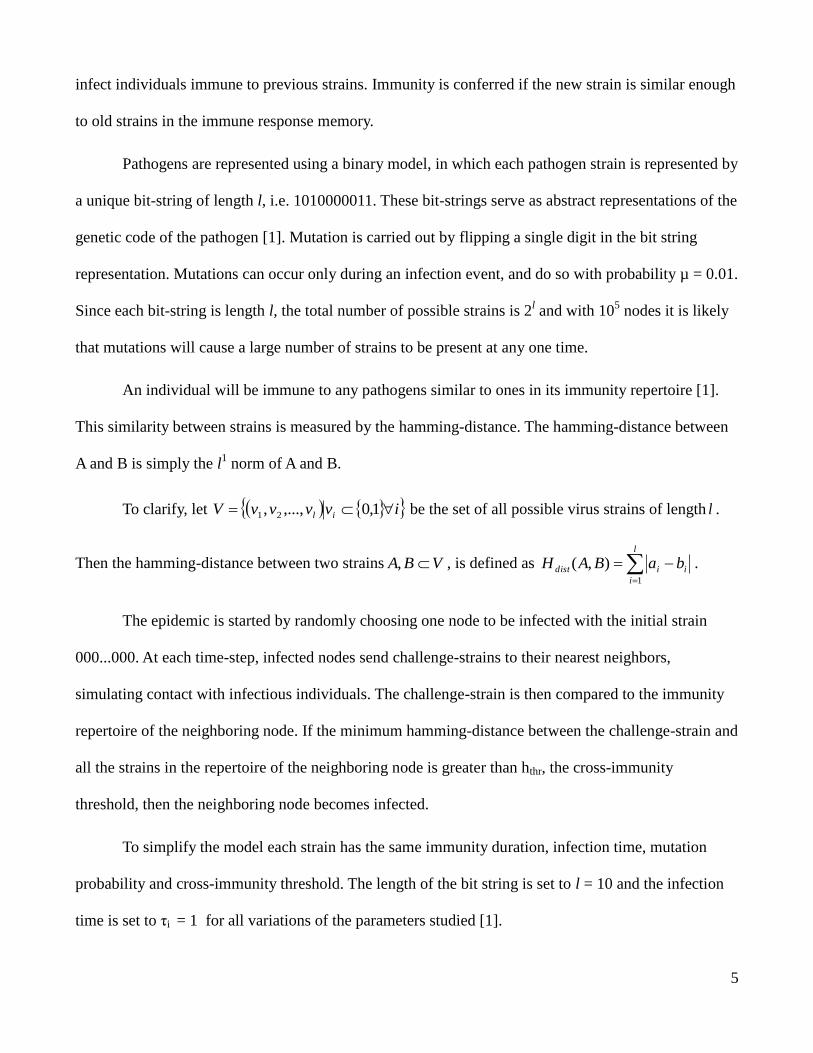
Case 1: Effect of immunity duration
The simulation was run for immunity duration, τR = 50, 150, 450. The cross-immunity threshold hthr =
2. The network size was set to N = 105. The figure shows the fraction of infectious individuals as a
function of the time step.
Replicated model results Physica A 363 (2006) 561-566 by Zhi-Gang Shao, Zhi-Jie Tan,
Xian-Wu Zhou, Zhun-Zhi Jin
Figure 2: Plots of fraction infected against time, for immunity duration τR, Cross-immunity threshold hthr = 2, and
population N = 105.
7
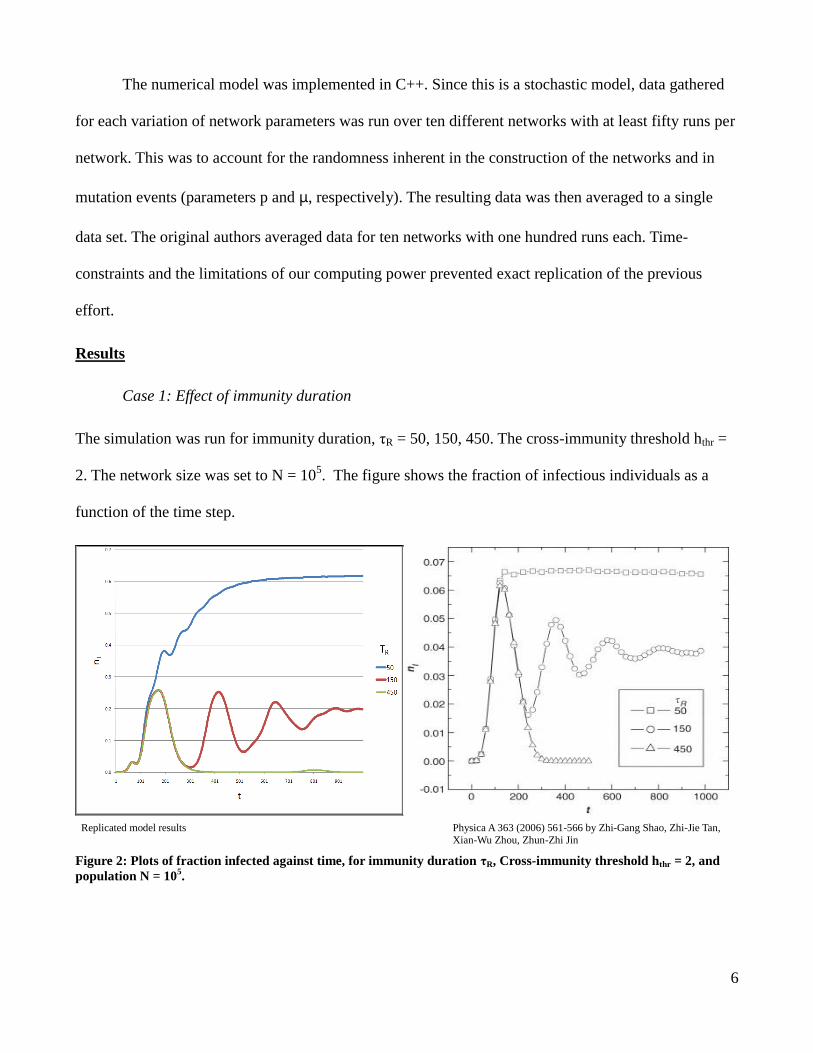
Case 2: Effect of cross-immunity threshold
The simulation was run for hthr = 0,2,4, and 10. The immunity duration, τr = 150, and the population
size was again N = 105. Figure 2 shows the fraction of infected individuals as a function of
dimensionless time.
Replicated model results Physica A 363 (2006) 561-566 by Zhi-Gang Shao, Zhi-Jie Tan,
Xian-Wu Zhou, Zhun-Zhi Jin
Figure 3: Fraction of infected individuals as a function of time step t for cross immunity threshold hthr, immunity
duration τR = 150.
8
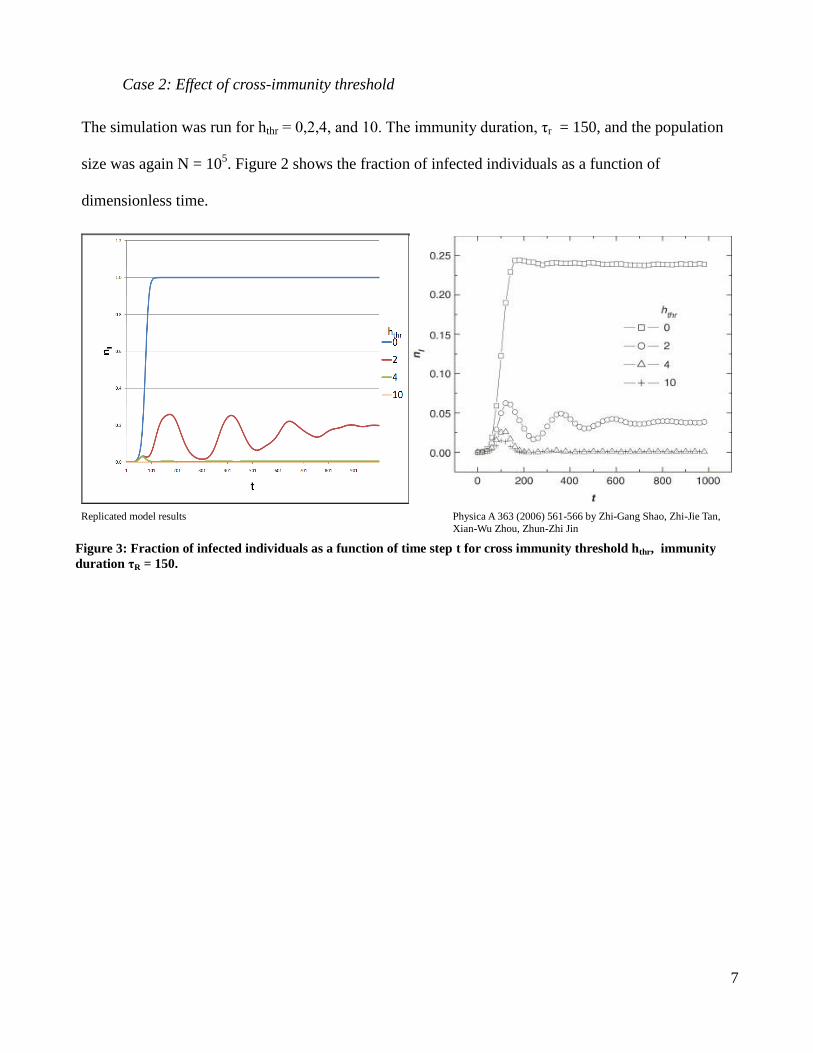
Case 3: Effect of population size
The simulation was run for network sizes, N = 104,10
5,10
6. The immunity duration τr = 150, and the
Cross-Immunity Threshold hthr = 2. Figure 4 shows the number of infected nodes as a function of time.
Replicated model results Physica A 363 (2006) 561-566 by Zhi-Gang Shao, Zhi-Jie Tan,
Xian-Wu Zhou, Zhun-Zhi Jin
Figure 4: Number of infected individuals as a function of time step t for population N = 105, immunity duration τr =
150, and population N = 105.
Discussion
Case 1(Effect of immunity duration)
(Figure 2) In both the original results and the replicated models up to the 100th
time step the
three simulations have the same fraction of individuals infected. Furthermore, immunity durations of
150 and 450 have the same time dependent dynamics up to the 200th
time step.
For large τR values, e.g. τR = 450, the infection spreads quickly initially but then dies out.
Moderate values of τR, e.g. τR = 150, a decaying oscillation occurs. Small values of τR, e.g. τR = 50 the
infection rapidly spreads then becomes persistent, this case will be hard to contain and control, and
represents the greatest threat for pandemic [1].
9
Case 2(Effect of cross-immunity threshold)
(Figure 3) In the original and replicated models the dependence on the cross-immunity
threshold is dramatic. For hthr = 0 any challenge strain will infect the node the system rapidly tends
towards a constant infection rate of 100%. This is a reduction to the SIS model. For a hthr = 10, the bit
string length the model reduces to an SIR model. Lower cross immunity between strains leads to more
rapid outbreak and greater public health threat. This can be seen with seasonal influenza, the new strain
arriving each flu season is outside the cross-immunity threshold of the previous year’s influenza virus,
and therefore annual inoculation is required.
Case 3(Effect of population size)
(Figure 4) In both models the size of the network does not affect the initial dynamics of the
system. The number of infected in all three cases grows towards a maximum before the effect of the
immunity duration comes into play. These simulations run with τR = 150, display the damped
oscillations for moderate immunity duration lengths. The dynamics for population size only vary at
later time. The smaller networks reach equilibrium quicker than the large networks. Not repeated in the
replicated results but in the authors model for the smallest population size, the number of infected
reduces with time, ultimately resulting in the elimination of the pathogen from the system.
SIRS Model on a small-world network
The SIRS model with pathogen mutation on small-world networks presents special results not
present in other models. As shown SIRS models with pathogen mutation have parameter sets where
oscillations can occur in the fraction of individuals infected. Mutation leads to an increase in the
number of nodes infected, while immunity leads to a decrease in the fraction infected. The small world
network affects the dynamics because the rewiring creates long-range connections [1]. A long range
connection allows infection to spread across the network to previously uninfected areas of the graph.
These long range connections increase the spread of pathogen strains.
10
Discrepancies
In repeating the work of the previous authors, we ran into a few discrepancies that future work
should attempt to explain. First, in all three cases the fraction of the number infected in our work was
higher than the original work. When testing the cross-immunity threshold our averages were exactly
four times larger than the authors. Secondly, for network size N = 104, the authors reported that the
number of infected decayed to zero for larger times. In our results the number infected displayed the
same damped oscillations as the larger networks.
Population at Risk and Vaccination
Having successfully replicated the fundamental behavior of the previous work, we now focus
our attention on expanding the model to more accurately reflect the susceptibility of various individuals
to infectious agents.
Or first task was to enhance the model to reflect variable susceptibility. Not all individuals are
equally susceptible to infection. The elderly, infants, those being treated with immuno-suppressant
drugs and persons with immune-deficiencies caused by diseases such as HIV, are more likely to
contract a virus if an outbreak occurs. By incorporating a Population at Risk, we can now study how
populations with diverse demographics (age, health, etc.) handle an outbreak of a mutating pathogen.
Our second objective was to examine how to best go about stopping an outbreak once it has
occurred. Much time and money is expended in trying to quell outbreaks. Sometimes these efforts
produce large amounts of waste, as evidenced by the recent dumping of vast amounts of H1N1 vaccine.
To combat this waste and stop an outbreak we would like to know who and how many people to
inoculate, and when to inoculate them. In particular we looked at vaccinating a proportion of a random
sampling of the population, at vaccinating certain susceptible individuals, the Population at Risk, and at
11
vaccinating those who come in contact with large segments of the public (represented by highly
connected nodes in our small-world network model), such as taxi drivers, bus drivers, mail-persons,
and teachers.
Population at Risk Model
We chose to model the Population at Risk. Since we are not concerned with categorical
variables, we only considered the proportion of the population, ρ, that was most susceptible to
infection and had longer lasting symptoms. We will henceforth refer to this as the Proportion at Risk.
We chose to model this proportion of the population by giving these nodes longer infection durations –
three times that of the general population.
In the original model, if the immunity-threshold was crossed a node became infected with
probability 1. This effectively nullified the effect of extending the infection duration for the
susceptible subpopulation. Thus, in modeling the Proportion at Risk, we were forced to implement a
new parameter, pi, the infection probability. We justify this by noting that the small-world network
represents the structure of social contacts, and the infection probability, pi, represents the likelihood of
transmission between contacts. Care was taken in choosing pi to ensure that the model preserved the
decaying oscillatory behavior previously studied.
All simulations were run with immunity duration, τR = 150, cross-immunity threshold hthr = 2,
and network size N = 105. For the general population the infection duration, τi = 1, was used, while an
infection duration, τi = 3, was assigned to nodes in the Proportion at Risk. The infection probability, pi,
was fixed at 0.8.
In our comparison of vaccination schemes we fixed the Proportion at Risk, ρ=0.25. The
vaccine was administered at time step 150, to a proportion of the population being studied, γ. The

12
vaccine consisted of the original strain and source of the outbreak, 00….0, along with all of its first-
and second-generation mutations.
Results
Case 1: Effect of increasing ρ, the Proportion at Risk.
The simulation was run for various values of ρ, ranging from 0 to 1. Figure 5 shows the fraction of
infectious individuals as a function of the time step.
Fig. 5 Fraction of infectious individuals, nI, as a function of time step, τ, for various proportions, ρ, of the total
population, representing the Population at Risk.
13
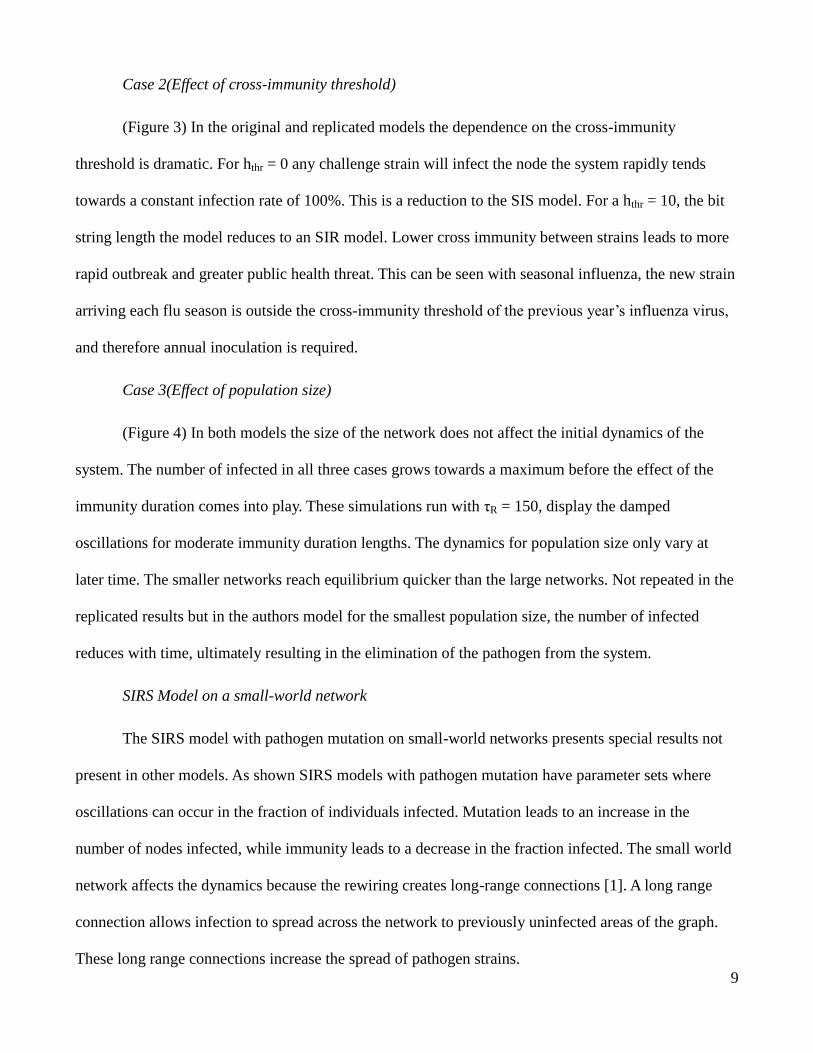
Case 2: Comparison between vaccination schemes.
The simulation was run for various values of γ, the proportion of the population vaccinated. The first
vaccine scheme was to inoculate a proportion of the population at random. The second scheme was to
inoculate various proportions of the most susceptible nodes; that is, targeting the Proportion at Risk.
The third scheme was to inoculate the entire Proportion at Risk, plus an additional proportion of the
general population. (The fourth scheme, inoculating a proportion of the most well-connected nodes, is
not show. See Discussion) Figure 6 shows the fraction of trials, ne, in which the pathogen was
completely eradicated as a function of the proportion of the total population, γ, given the vaccine, for
each of the various vaccination schemes.
Fig. 6 Fraction of trials, ne, in which the pathogen was completely eradicated as a function of the proportion of the
total population, γ, given the vaccine, for each of the various vaccination schemes.
14
Discussion
Case 1: Effect of increasing ρ, the Proportion at Risk.
It is clear from Figure 5 that increasing the Proportion at Risk, ρ, leads to higher saturation levels
(higher infection rates) of the pathogen in the population. We conclude that a large Proportion at Risk
provides an ample breeding ground for mutagenic pathogens and leads to persistently high infection
rates.
Case 2: Comparison between vaccination schemes.
As evidenced from Figure 6, there is a distinct difference between the vaccination schemes. Targeting
the vaccines to the most vulnerable subpopulation, the Proportion at Risk, is substantially more
effective in containing an outbreak and staving off an epidemic. For instance, when 15% of the
population is vaccinated, the untargeted vaccination scheme leads to pathogen extinction in only about
5% of trials. In contrast, fully 35% of trials in the targeted vaccination scheme lead to pathogen
extinction.
The figure also illustrates how each scheme has a maximum cost-effectiveness. Vaccinating
80% of the population at random is, on average, no more effective in containing an outbreak than is
vaccinating 40%. The results also show that the maximum benefit of the scheme which vaccinates
100% of the Proportion at Risk plus a proportion of the population in general is higher than that of the
scheme in which a random proportion of the population in general is vaccinated.
It should be noted that the vaccination scheme in which a proportion of the most highly-
connected nodes are inoculated is not present in Figure 6. This is due to the fact that these nodes
represent less than 1% of the total population. Thus, vaccinating these nodes had little or no effect.
Vaccinating 100% of these nodes led to pathogen extinction in only 2% of cases. Had we chosen to run

15
the simulation on small-world networks with a larger rewiring probability, say p=0.1, then we might
have seen a larger impact from vaccination. We suggest that this be a focus of future work.
Conclusion
Mutating pathogens are a major threat to public health. The interaction of the immune response
and disease mutation leads to oscillations in the number of infected when the outbreak is on a small
world network. In real socio-spatial networks this is also the case as novel pathogens can rapidly
spread across a network if a majority of individuals are immune. Understanding when a pathogen will
not naturally be eliminated from the network, as in the saturation and oscillation cases, forces societies
to take steps to reduce its impact and attempt to eradicate it. In the 20th
century the eradication of
Small Pox from circulation due to a massive immunization effort represents the lone success in truly
eliminating a harmful pathogen from the planet. Novel pathogens created by random chance mutations
such as the case of the H1N1/2009 pandemic will always be a scourge on society, but proper analysis
and timely application of vaccines targeted to the most vulnerable subpopulations can help to control
and suppress an epidemic. This model can be used to assess effectiveness of countermeasures to
epidemics such as H1N1/2009. Being better prepared to deal with the next pandemic could save
millions of lives.
Acknowledgements
This project was mentored by Toby Shearman, whose help is acknowledged with great appreciation.
We would also like to thank Ildar Gabitov for introducing us to the original paper on this fascinating
topic, and to mathematical modeling in general.
16
References
[1] Zhi-Gang Shao, Zhi-Jie Tan, Xian-Wu Zhou, Zhun-Zhi Jin, Physica A 363 (2006) 561-566.
[2]B.T. Grenfell, O.N. Bjornstad, J. Kappey, Nature 414 (2001) 716.
[3] R. Albert, A.-L. Baraba´ si, Rev. Mod. Phys. 74 (2002) 47.
Top Related