


Languages
Pages
Legal

RELACIÓN ENTRE LA MICROBIOTA
INTESTINAL Y LA SALUD Y
CONTRIBUCIÓN DE LA FIBRA EN LA DIETA
Laboratorio de Ecología Microbiana, Nutrición y Salud.
MARINA ROMANÍ-PÉREZ
Laboratorio de Ecología Microbiana, Nutrición y Salud.
MARINA ROMANÍ-PÉREZ
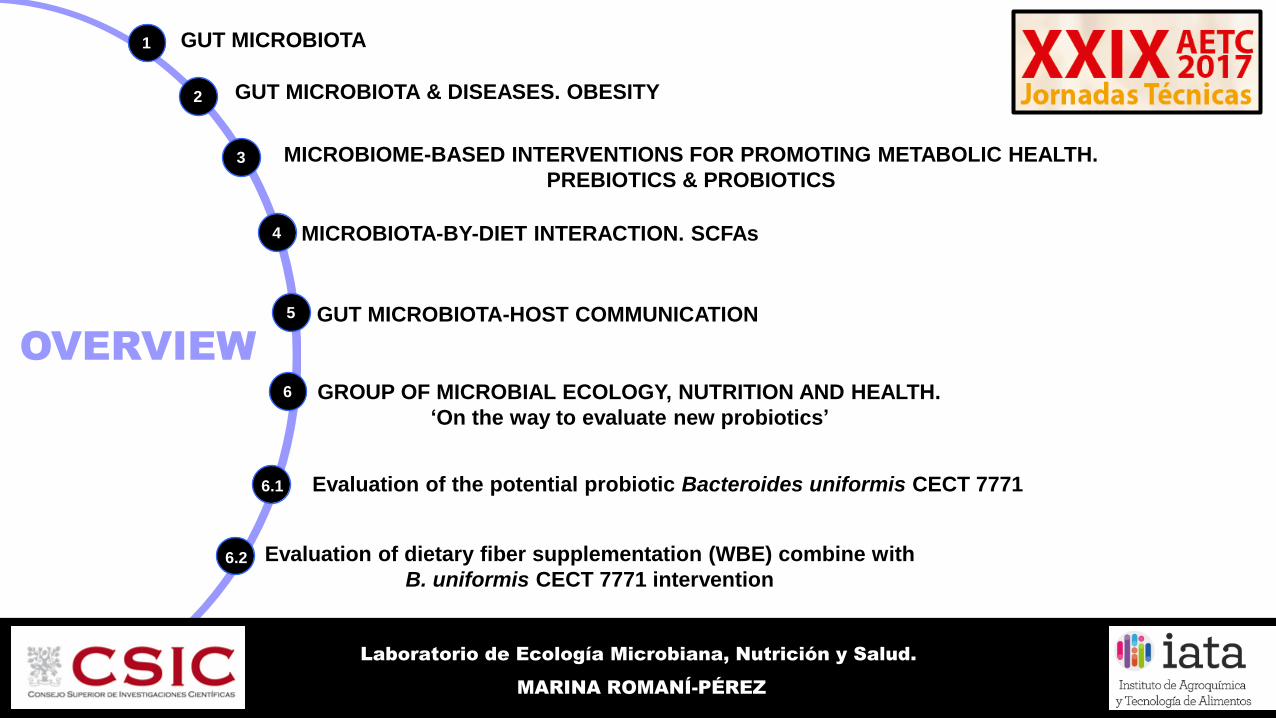
OVERVIEW
GUT MICROBIOTA
GUT MICROBIOTA & DISEASES. OBESITY
MICROBIOME-BASED INTERVENTIONS FOR PROMOTING METABOLIC HEALTH.
PREBIOTICS & PROBIOTICS
GUT MICROBIOTA-HOST COMMUNICATION
GROUP OF MICROBIAL ECOLOGY, NUTRITION AND HEALTH.
‘On the way to evaluate new probiotics’
Evaluation of the potential probiotic Bacteroides uniformis CECT 7771
Evaluation of dietary fiber supplementation (WBE) combine with
B. uniformis CECT 7771 intervention
MICROBIOTA-BY-DIET INTERACTION. SCFAs
1
2
3
4
5
6
6.1
6.2
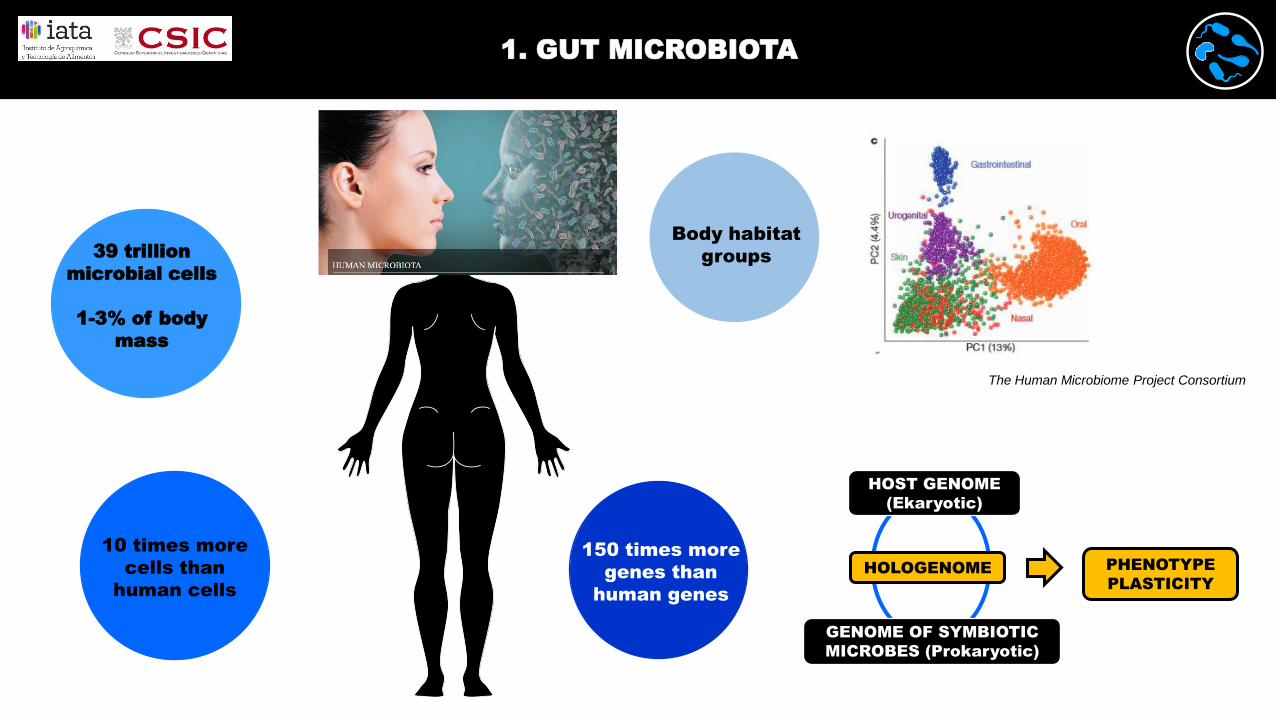
39 trillion
microbial cells
1-3% of body
mass
10 times more
cells than
human cells
150 times more
genes than
human genes
1. GUT MICROBIOTA
Body habitat
groups
HOLOGENOME
HOST GENOME
(Ekaryotic)
GENOME OF SYMBIOTIC
MICROBES (Prokaryotic)
PHENOTYPE
PLASTICITY
The Human Microbiome Project Consortium
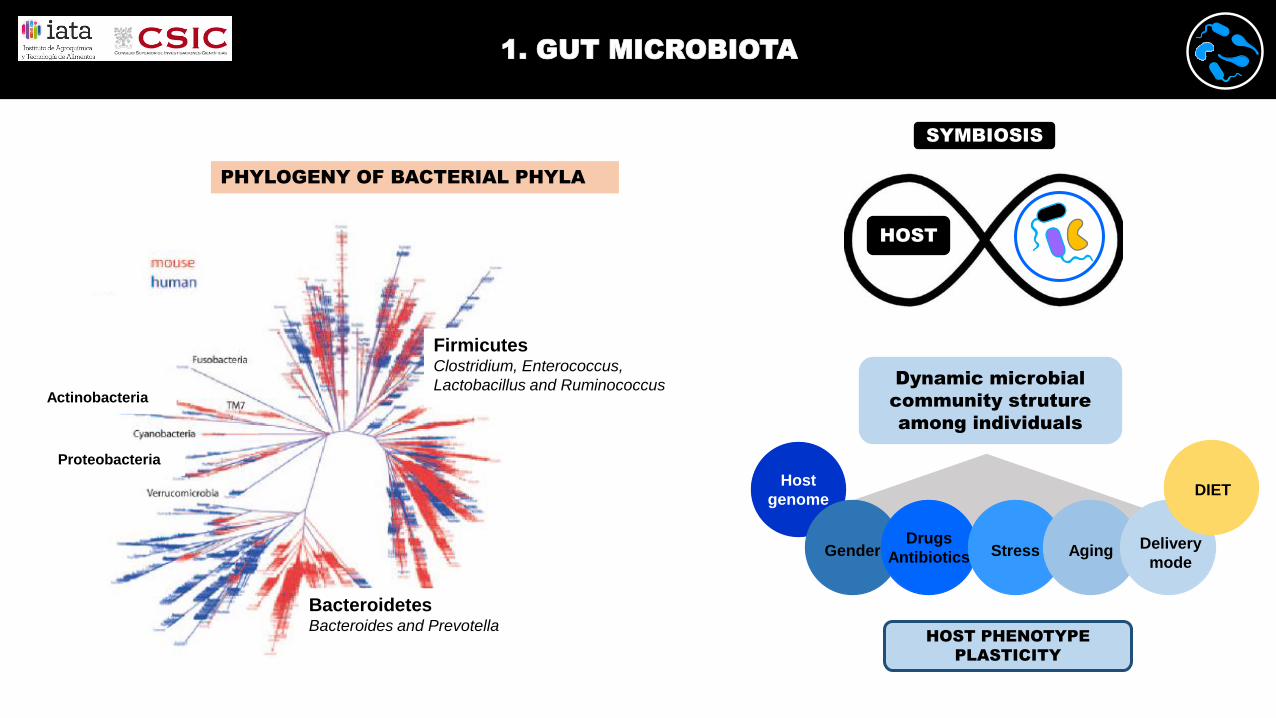
HOST
SYMBIOSIS
Dynamic microbial
community struture
among individuals
Host
genome
GenderDrugs
Antibiotics Stress Aging Delivery
mode
DIET
HOST PHENOTYPE
PLASTICITY
FirmicutesClostridium, Enterococcus,
Lactobacillus and Ruminococcus
BacteroidetesBacteroides and Prevotella
Actinobacteria
Proteobacteria
PHYLOGENY OF BACTERIAL PHYLA
1. GUT MICROBIOTA
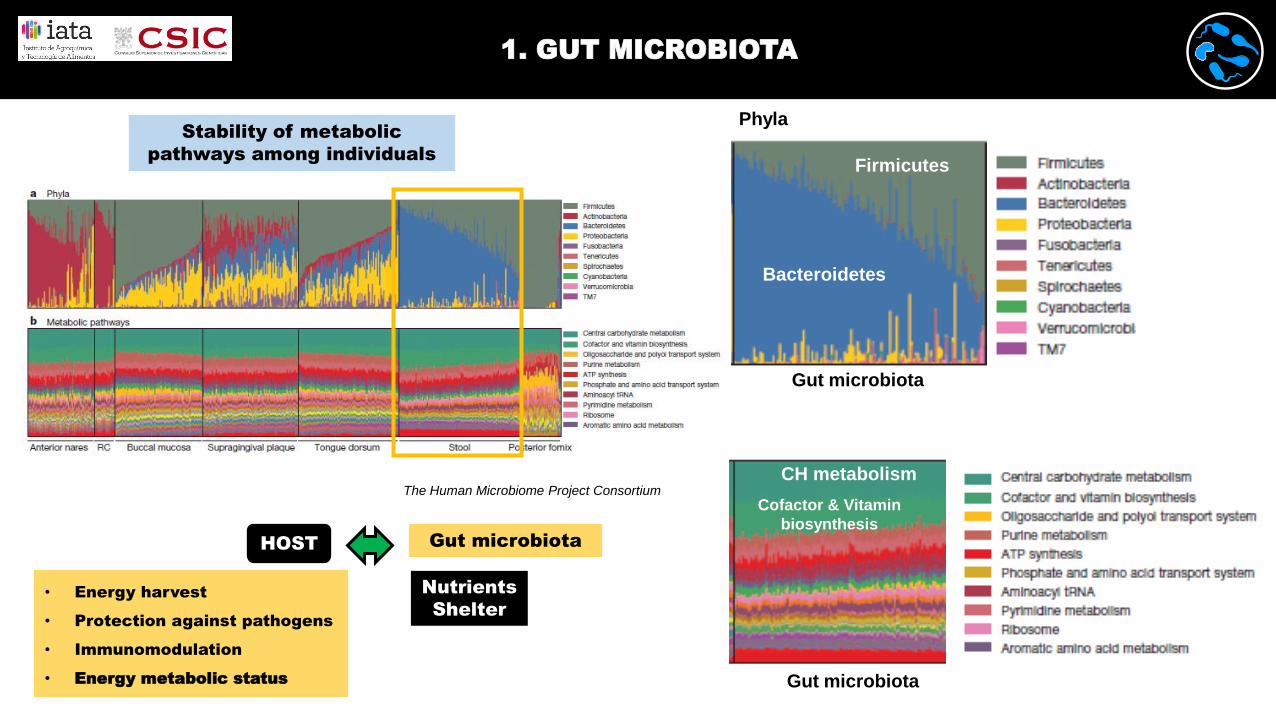
The Human Microbiome Project Consortium
Stability of metabolic
pathways among individuals
Gut microbiota
Nutrients
Shelter
HOST
• Energy harvest
• Protection against pathogens
• Immunomodulation
• Energy metabolic status
Gut microbiota
Firmicutes
Bacteroidetes
Phyla
CH metabolism
Cofactor & Vitamin
biosynthesis
Gut microbiota
1. GUT MICROBIOTA
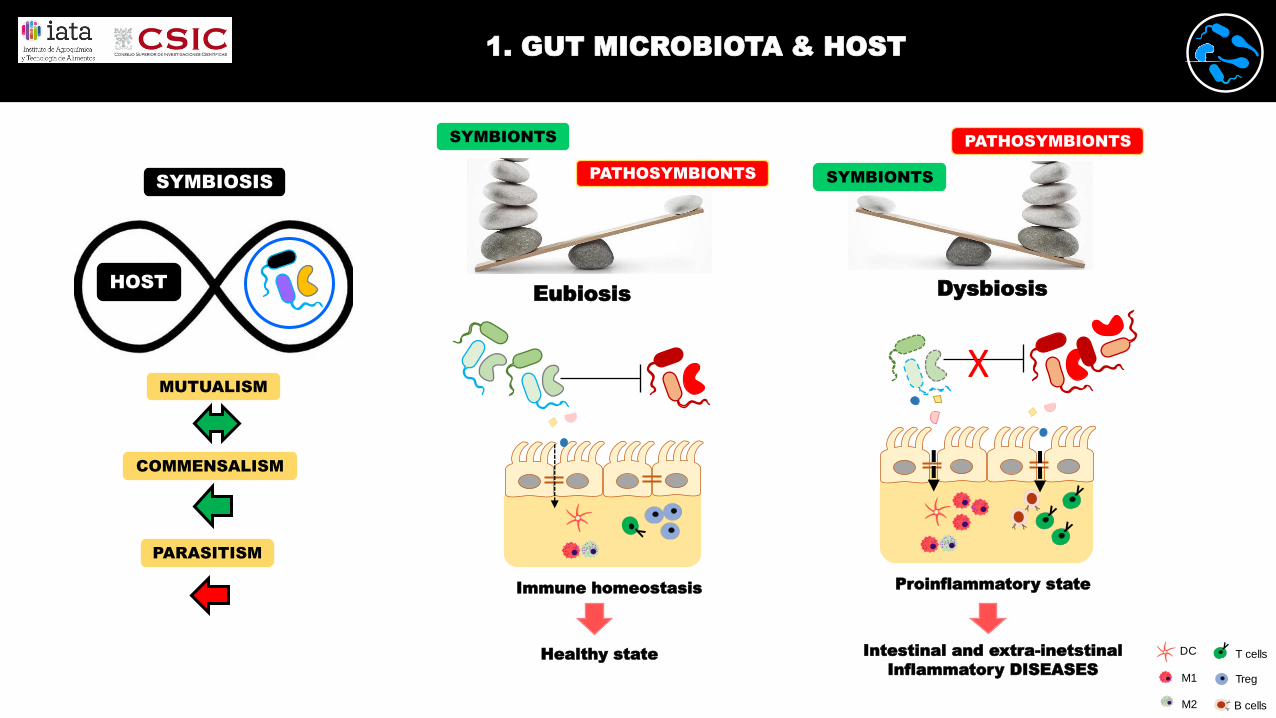
HOST
SYMBIOSIS
MUTUALISM
COMMENSALISM
PARASITISM
Eubiosis
SYMBIONTS
Dysbiosis
PATHOSYMBIONTS
SYMBIONTS
X
PATHOSYMBIONTS
Immune homeostasisProinflammatory state
Intestinal and extra-inetstinal
Inflammatory DISEASES
DC
M1
M2
T cells
Treg
B cells
Healthy state
1. GUT MICROBIOTA & HOST
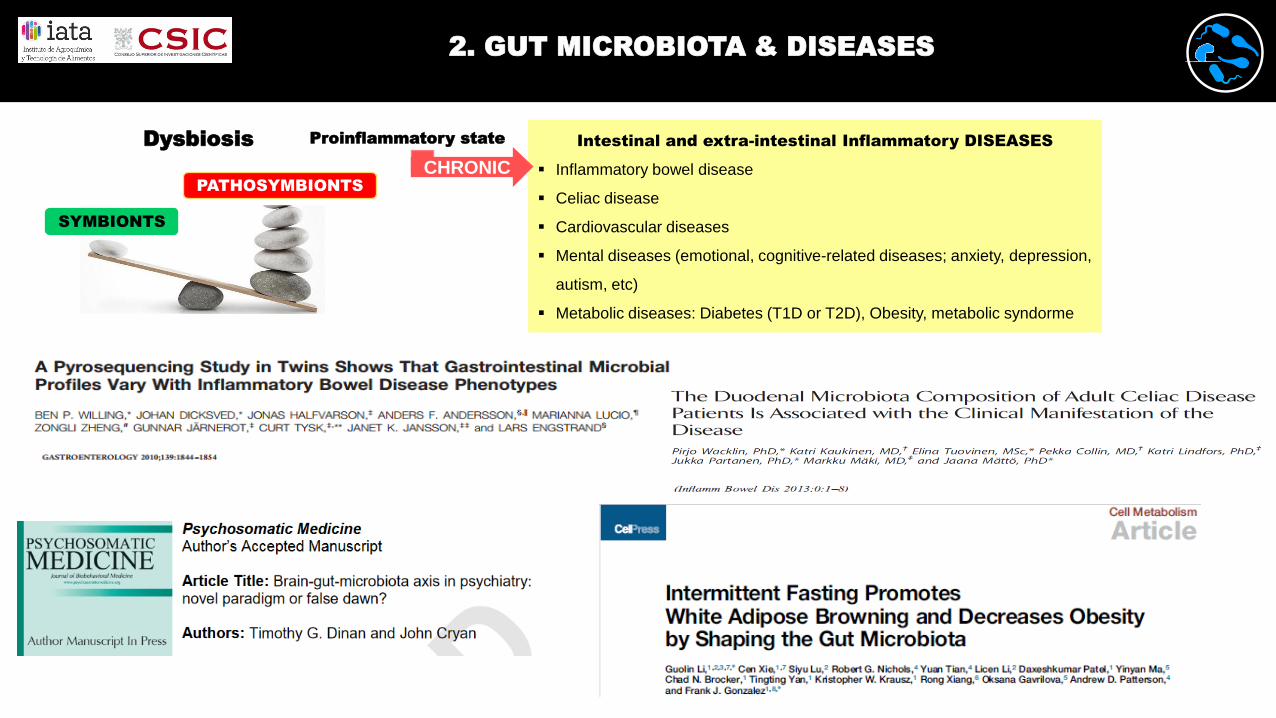
Intestinal and extra-intestinal Inflammatory DISEASES
Inflammatory bowel disease
Celiac disease
Cardiovascular diseases
Mental diseases (emotional, cognitive-related diseases; anxiety, depression,
autism, etc)
Metabolic diseases: Diabetes (T1D or T2D), Obesity, metabolic syndorme
Dysbiosis
PATHOSYMBIONTS
SYMBIONTS
Proinflammatory state
CHRONIC
2. GUT MICROBIOTA & DISEASES
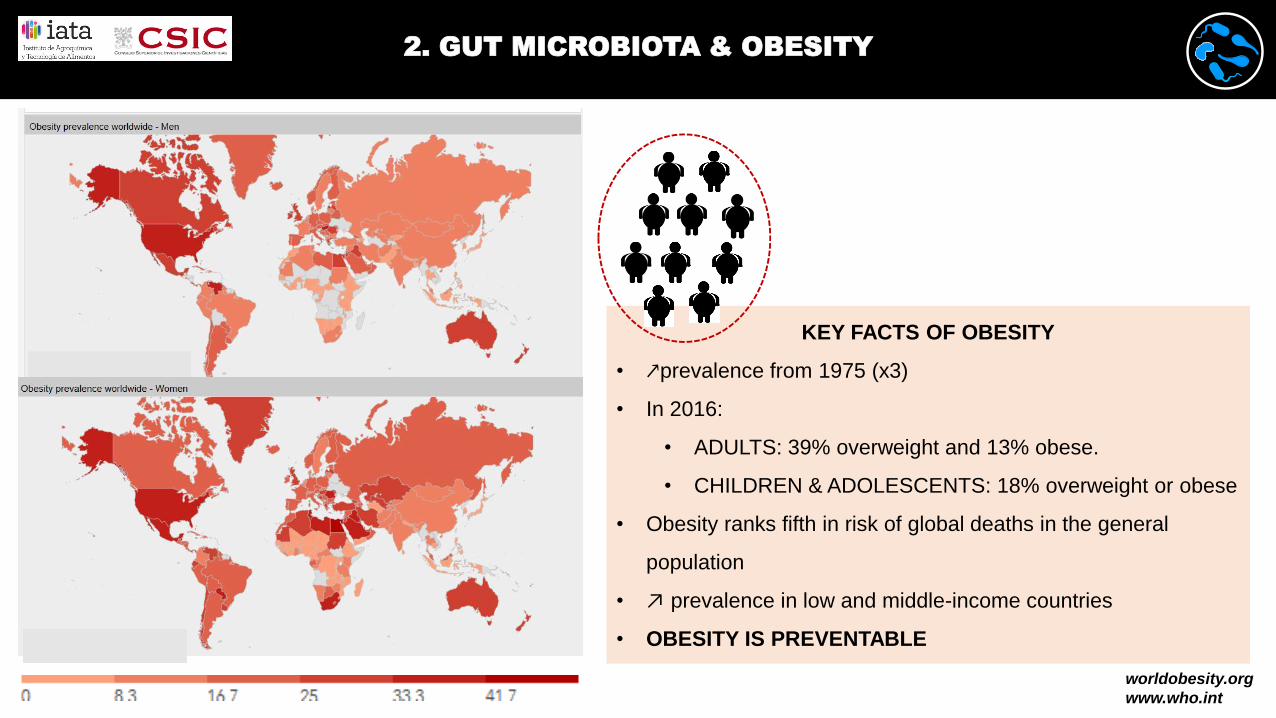
worldobesity.org
www.who.int
KEY FACTS OF OBESITY
• ↗prevalence from 1975 (x3)
• In 2016:
• ADULTS: 39% overweight and 13% obese.
• CHILDREN & ADOLESCENTS: 18% overweight or obese
• Obesity ranks fifth in risk of global deaths in the general
population
• ↗ prevalence in low and middle-income countries
• OBESITY IS PREVENTABLE
2. GUT MICROBIOTA & OBESITY
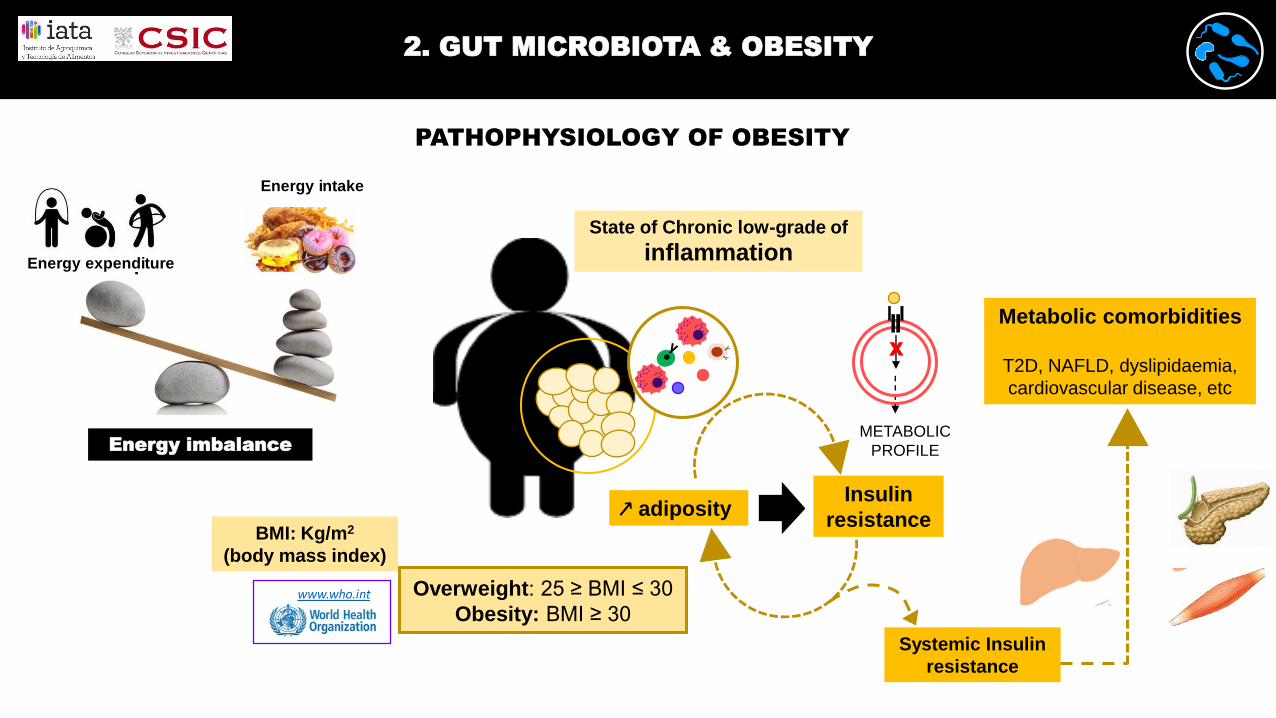
Systemic Insulin
resistance
↗ adiposity
www.who.int Overweight: 25 ≥ BMI ≤ 30
Obesity: BMI ≥ 30
BMI: Kg/m2
(body mass index)
Insulin
resistance
Metabolic comorbidities
T2D, NAFLD, dyslipidaemia,
cardiovascular disease, etc
State of Chronic low-grade of
inflammation
METABOLIC
PROFILE
X
EnergyintakeEnergy
expenditureEnergy expenditure
Energy intake
Energy imbalance
2. GUT MICROBIOTA & OBESITY
PATHOPHYSIOLOGY OF OBESITY
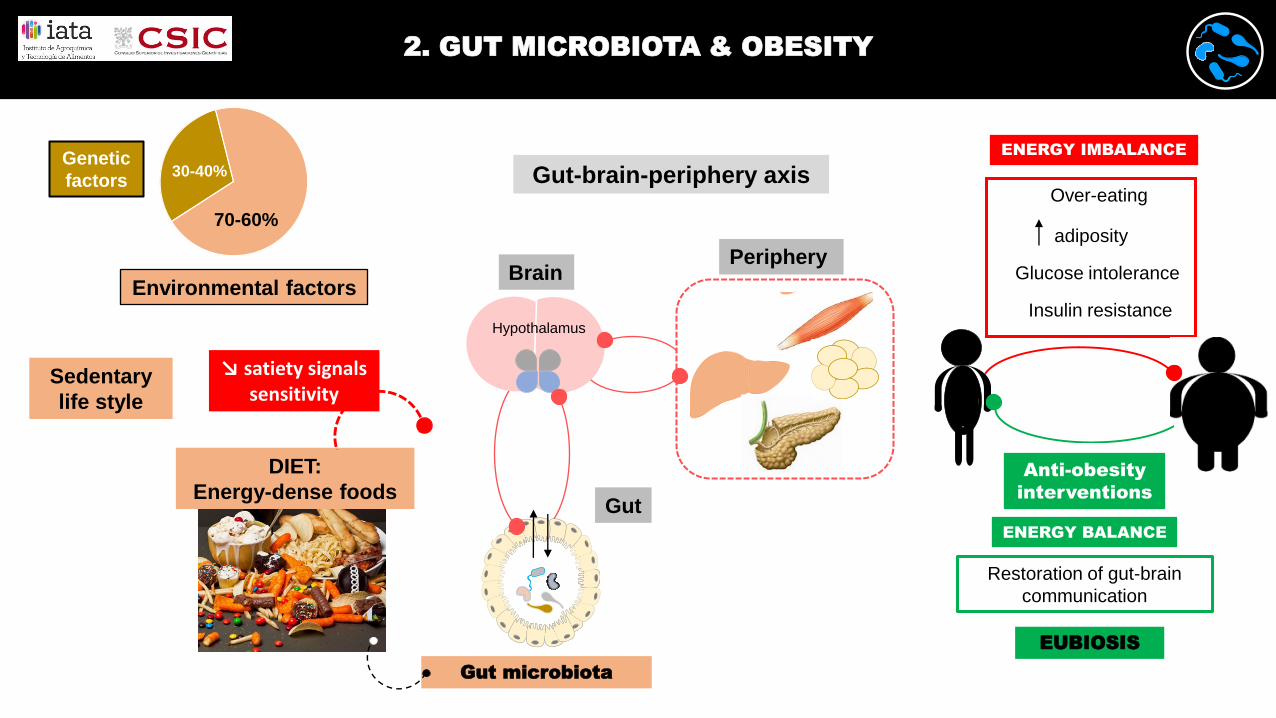
adiposity
Glucose intolerance
Over-eating
Insulin resistance
ENERGY IMBALANCE
Brain
Hypothalamus
Gut-brain-periphery axis
Gut
DIET:
Energy-dense foods
Gut microbiota
Periphery
↘ satiety signals sensitivity
ENERGY BALANCE
Restoration of gut-brain
communication
Anti-obesity
interventions
Genetic
factors30-40%
70-60%
Environmental factors
Sedentary
life style
EUBIOSIS
2. GUT MICROBIOTA & OBESITY
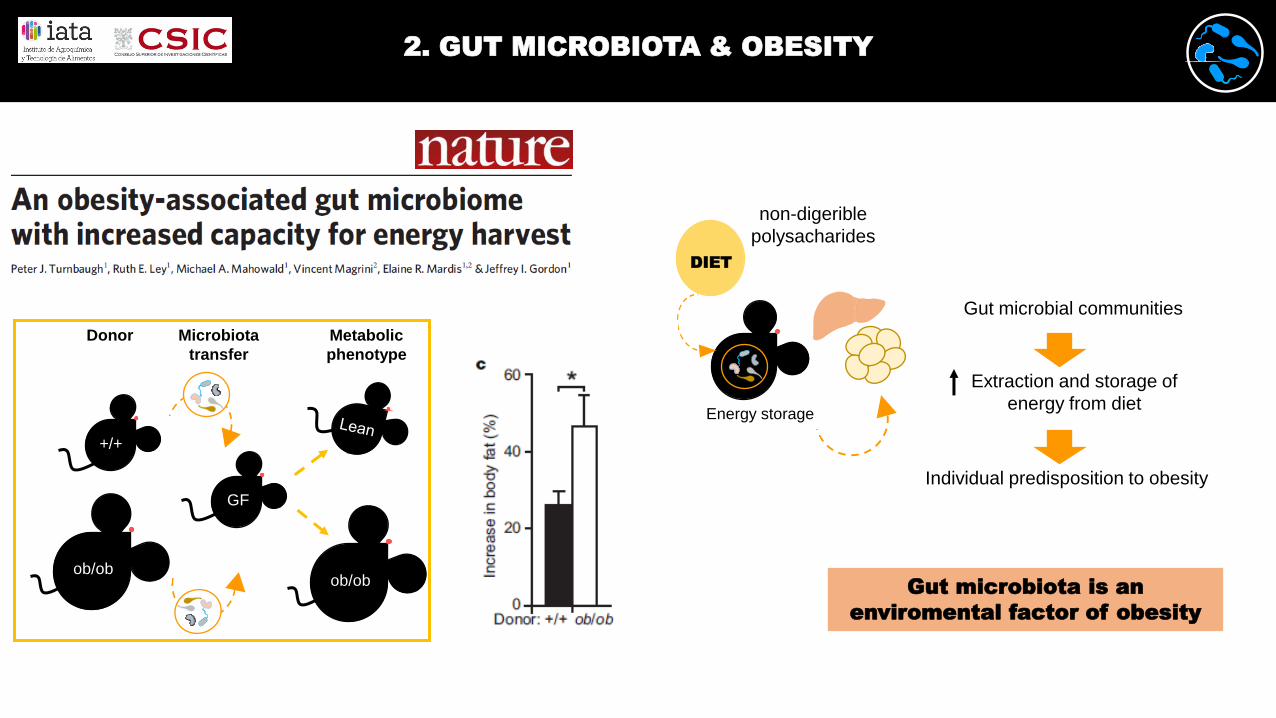
+/+
ob/ob
GF
ob/ob
Donor Metabolic
phenotype
Microbiota
transfer
non-digerible
polysacharides
Energy storage
Individual predisposition to obesity
Gut microbial communities
Extraction and storage of
energy from diet
Gut microbiota is an
enviromental factor of obesity
DIET
2. GUT MICROBIOTA & OBESITY
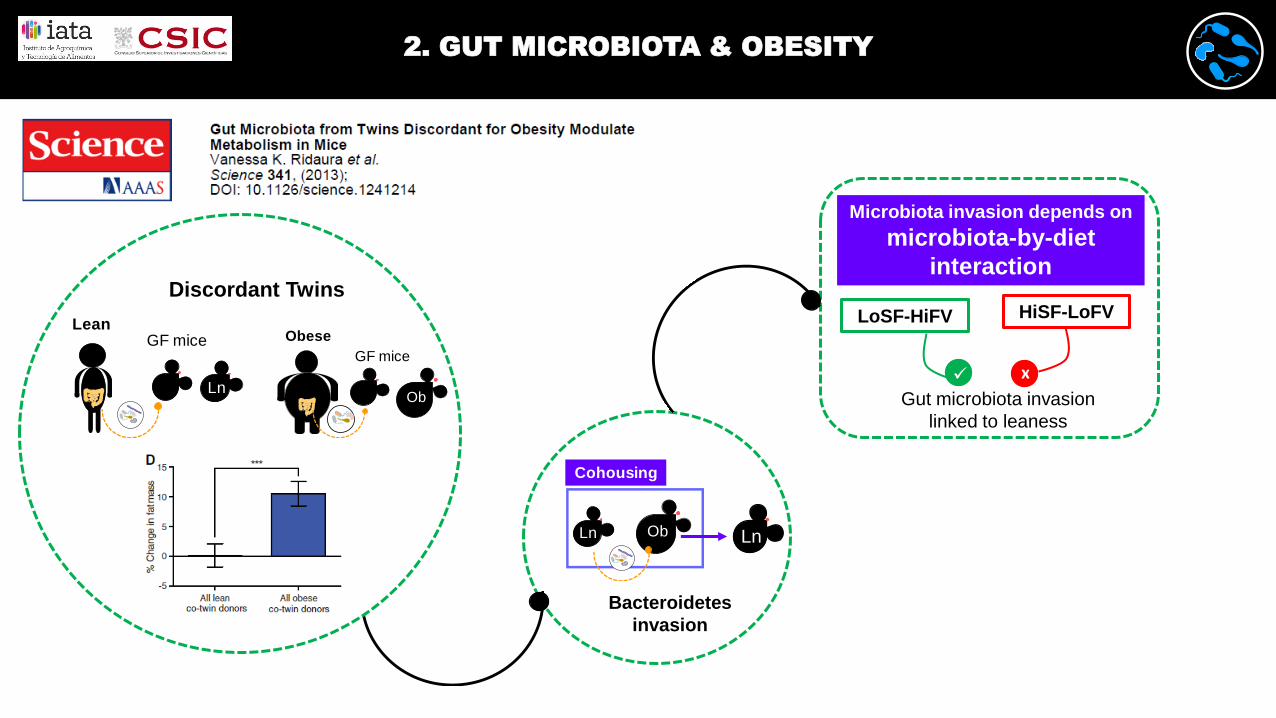
Ln
Bacteroidetes
invasion
Cohousing
Ln Ob
Discordant Twins
LeanGF mice
Ln
GF mice
Obese
Ob
Microbiota invasion depends on
microbiota-by-diet
interaction
LoSF-HiFV HiSF-LoFV
Gut microbiota invasion
linked to leaness
x
2. GUT MICROBIOTA & OBESITY
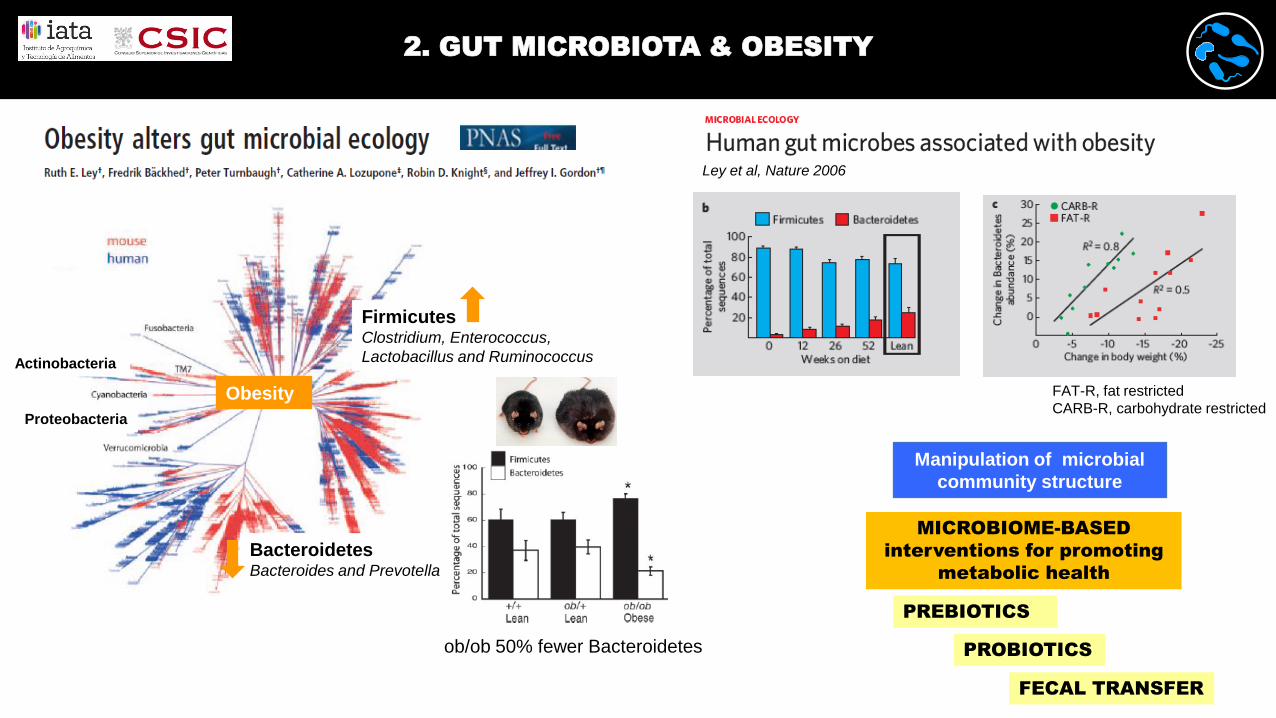
Manipulation of microbial
community structure
FirmicutesClostridium, Enterococcus,
Lactobacillus and Ruminococcus
BacteroidetesBacteroides and Prevotella
Actinobacteria
Proteobacteria
Obesity
ob/ob 50% fewer Bacteroidetes
Ley et al, Nature 2006
FAT-R, fat restricted
CARB-R, carbohydrate restricted
PROBIOTICS
PREBIOTICS
FECAL TRANSFER
MICROBIOME-BASED
interventions for promoting
metabolic health
2. GUT MICROBIOTA & OBESITY
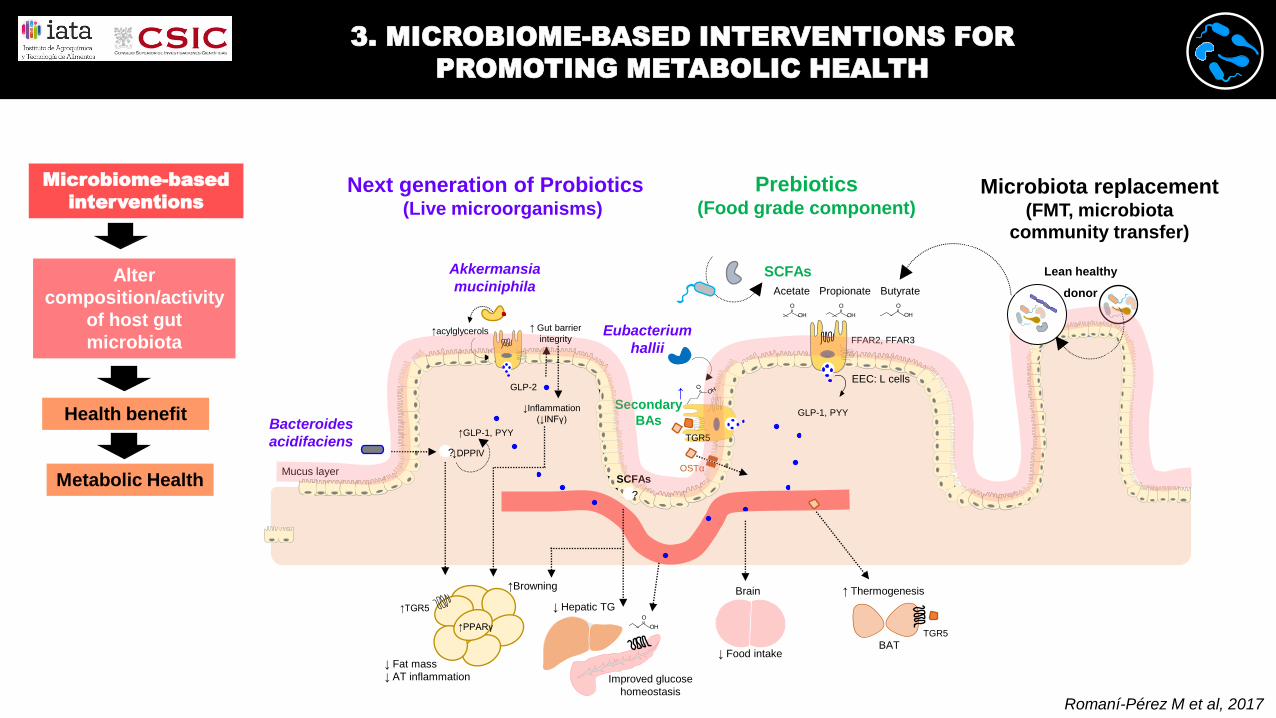
3. MICROBIOME-BASED INTERVENTIONS FOR
PROMOTING METABOLIC HEALTH
Romaní-Pérez M et al, 2017
Prebiotics(Food grade component)
Akkermansia
muciniphila
↓ Fat mass
↓ AT inflammation
↑acylglycerols
Improved glucose
homeostasis
GLP-2
↓Inflammation
(↓INFγ)Bacteroides
acidifaciens
Eubacterium
hallii
SCFAs
O=
OH
=
OH
ButyratePropionateAcetate
O=
OH
=
OH
O=
OH
=
OH
EEC: L cells
GLP-1, PYY
↑GLP-1, PYY
FFAR2, FFAR3
Brain
↓ Food intake
?
↑TGR5
↑PPARγ
↓DPPIV
↓ Hepatic TG
SCFAs
?
↑Browning
Secondary
BAs
↑ Thermogenesis
BATTGR5
Mucus layer
Lean healthy
donor
TGR5
OSTα
↑O=
OH
=
OH
O=OH
=
OH
↑ Gut barrier
integrity
Next generation of Probiotics(Live microorganisms)
Microbiota replacement(FMT, microbiota
community transfer)
Microbiome-based
interventions
Alter
composition/activity
of host gut
microbiota
Health benefit
Metabolic Health
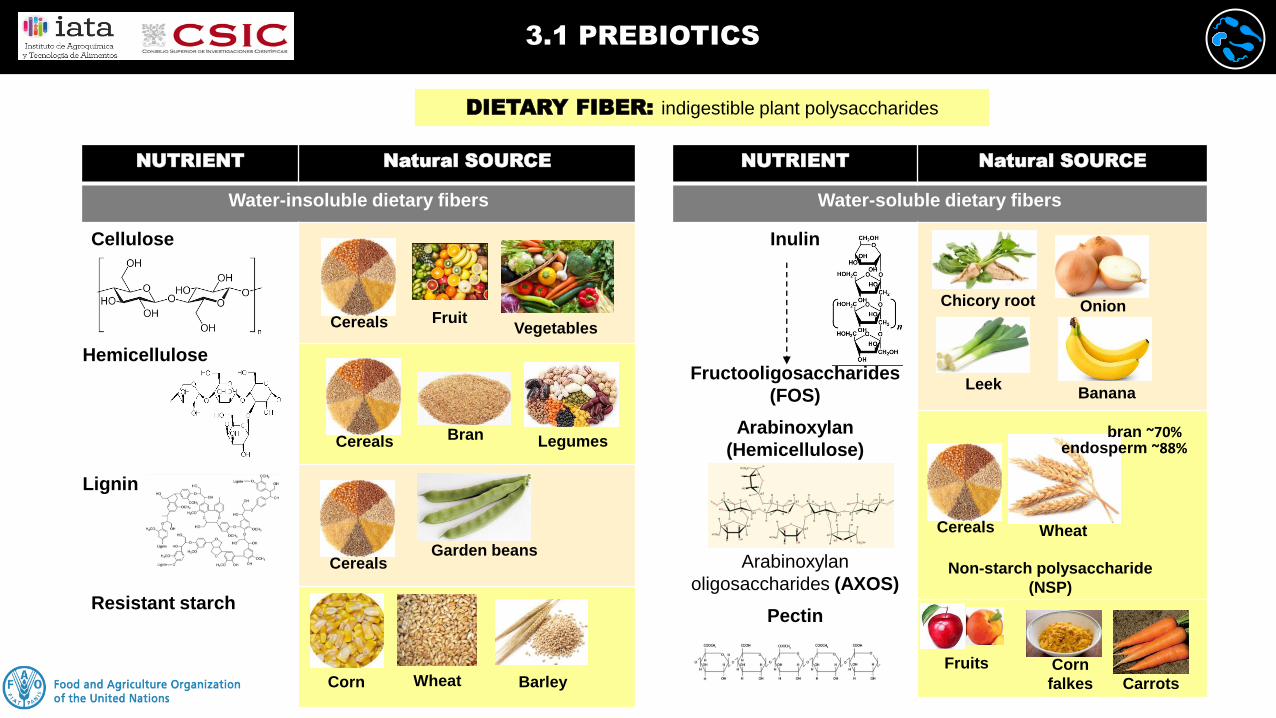
NUTRIENT Natural SOURCE
Water-insoluble dietary fibers
Cellulose
Resistant starch
Cereals FruitVegetables
BranCereals Legumes
CerealsGarden beans
Corn Wheat Barley
NUTRIENT Natural SOURCE
Water-soluble dietary fibers
Inulin
Fructooligosaccharides
(FOS)
Arabinoxylan
(Hemicellulose)
Arabinoxylan
oligosaccharides (AXOS)
Pectin
Chicory root
Banana
Onion
Leek
Hemicellulose
Cereals Wheat
Non-starch polysaccharide
(NSP)
bran ~70%endosperm ~88%
Lignin
Fruits Corn
falkes Carrots
3.1 PREBIOTICS
DIETARY FIBER: indigestible plant polysaccharides
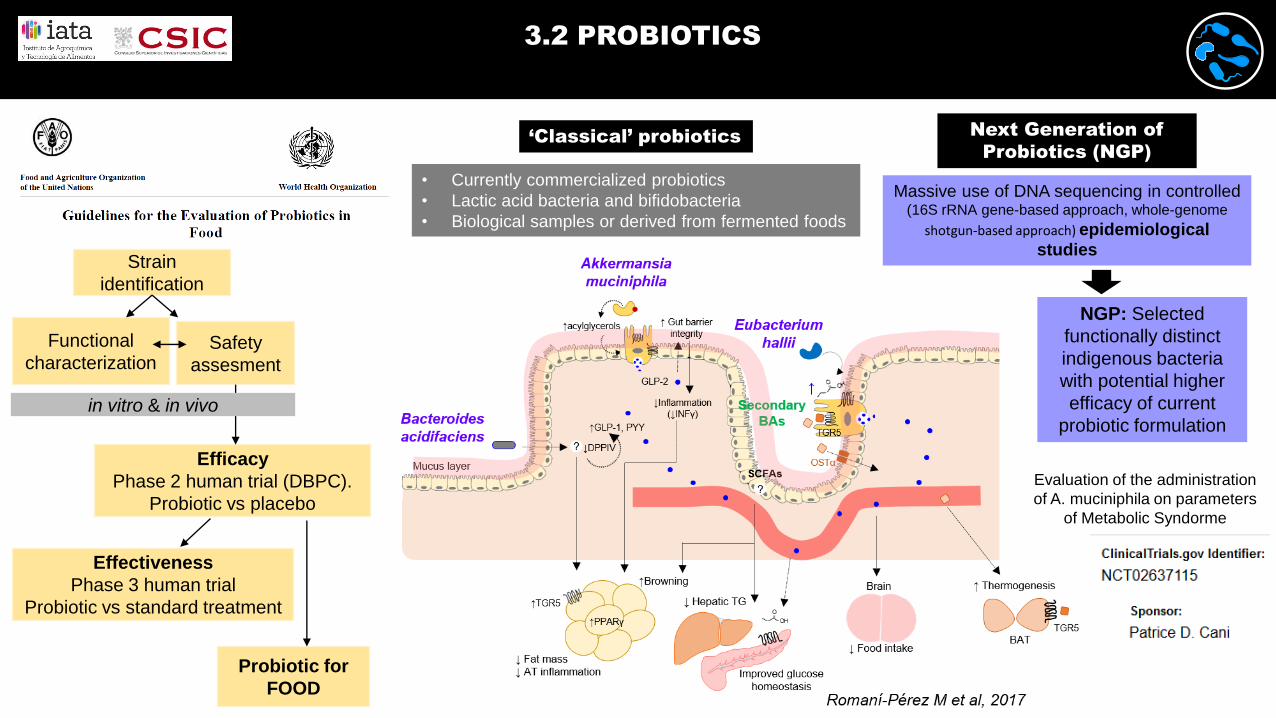
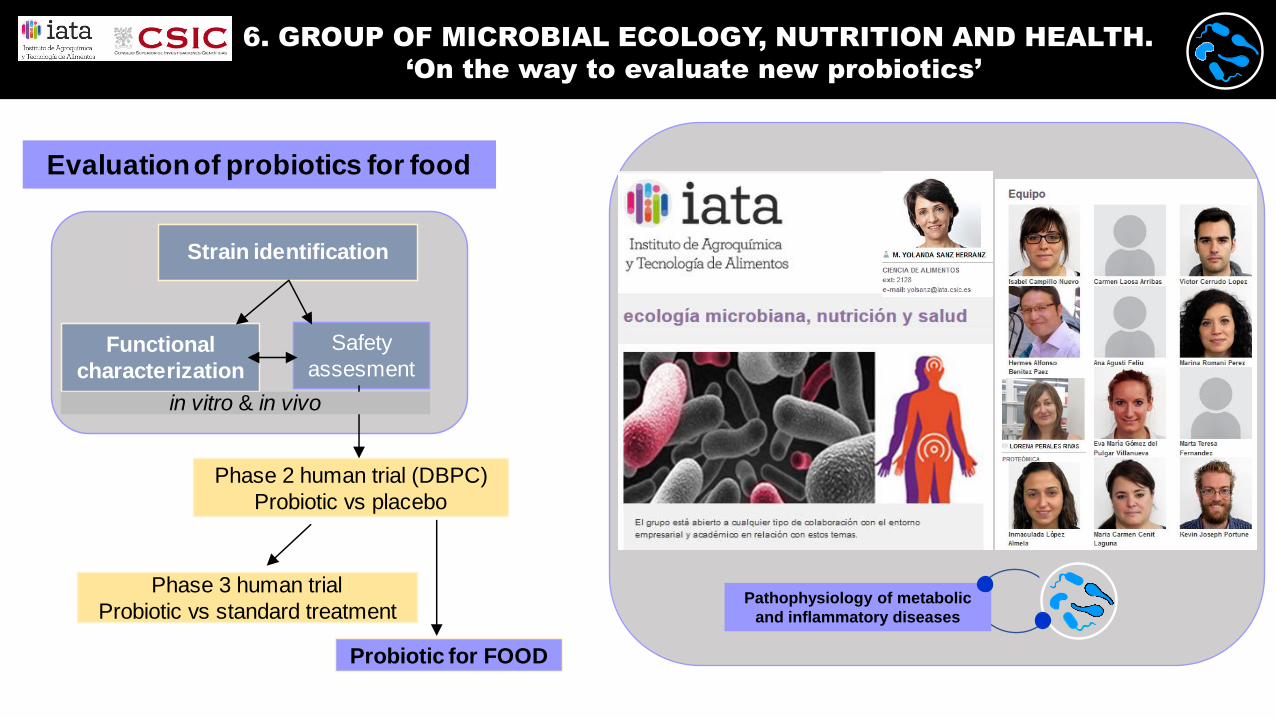
Strain
identification
Functional
characterizationSafety
assesment
Efficacy
Phase 2 human trial (DBPC).
Probiotic vs placebo
Effectiveness
Phase 3 human trial
Probiotic vs standard treatment
Probiotic for
FOOD
‘Classical’ probiotics
• Currently commercialized probiotics
• Lactic acid bacteria and bifidobacteria
• Biological samples or derived from fermented foods
Next Generation of
Probiotics (NGP)
Massive use of DNA sequencing in controlled(16S rRNA gene-based approach, whole-genome
shotgun-based approach) epidemiological
studies
NGP: Selected
functionally distinct
indigenous bacteria
with potential higher
efficacy of current
probiotic formulation
Evaluation of the administration
of A. muciniphila on parameters
of Metabolic Syndorme
in vitro & in vivo
3.2 PROBIOTICS
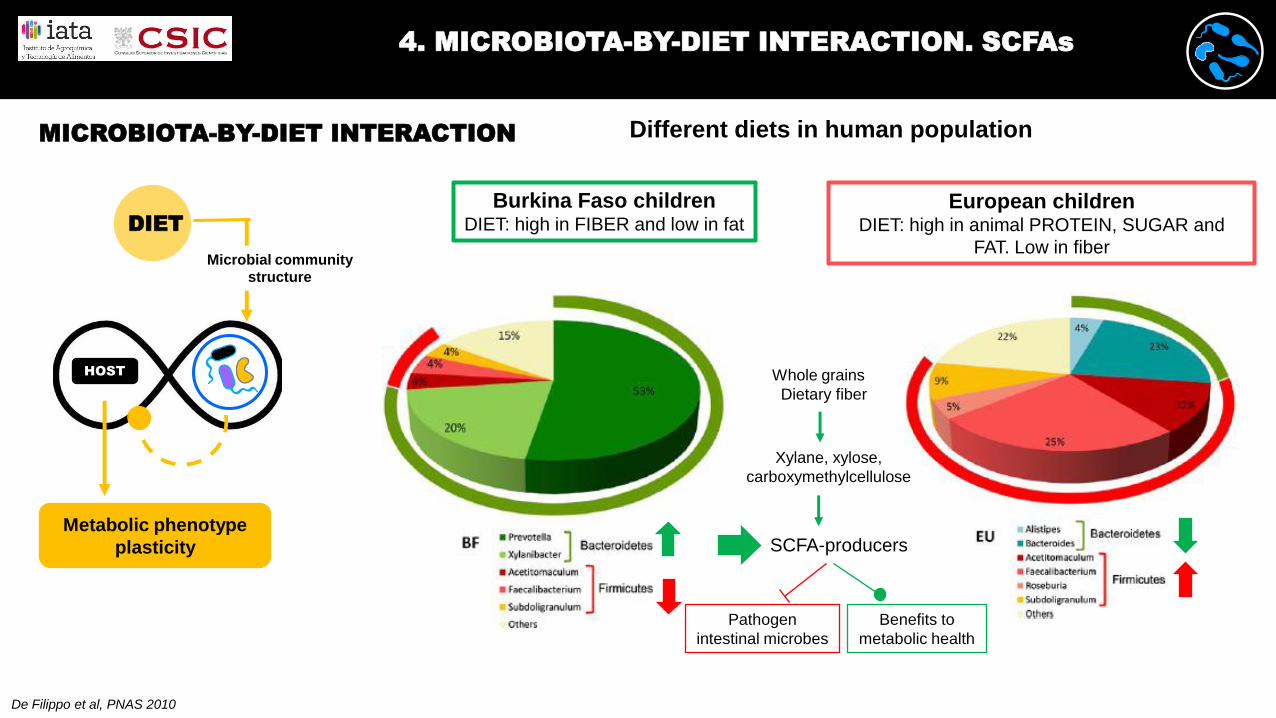
De Filippo et al, PNAS 2010
Burkina Faso childrenDIET: high in FIBER and low in fat
Different diets in human population
European childrenDIET: high in animal PROTEIN, SUGAR and
FAT. Low in fiber
SCFA-producers
Pathogen
intestinal microbes
Benefits to
metabolic health
Xylane, xylose,
carboxymethylcellulose
Whole grains
Dietary fiber
HOST
DIET
Metabolic phenotype
plasticity
Microbial community
structure
MICROBIOTA-BY-DIET INTERACTION
4. MICROBIOTA-BY-DIET INTERACTION. SCFAs
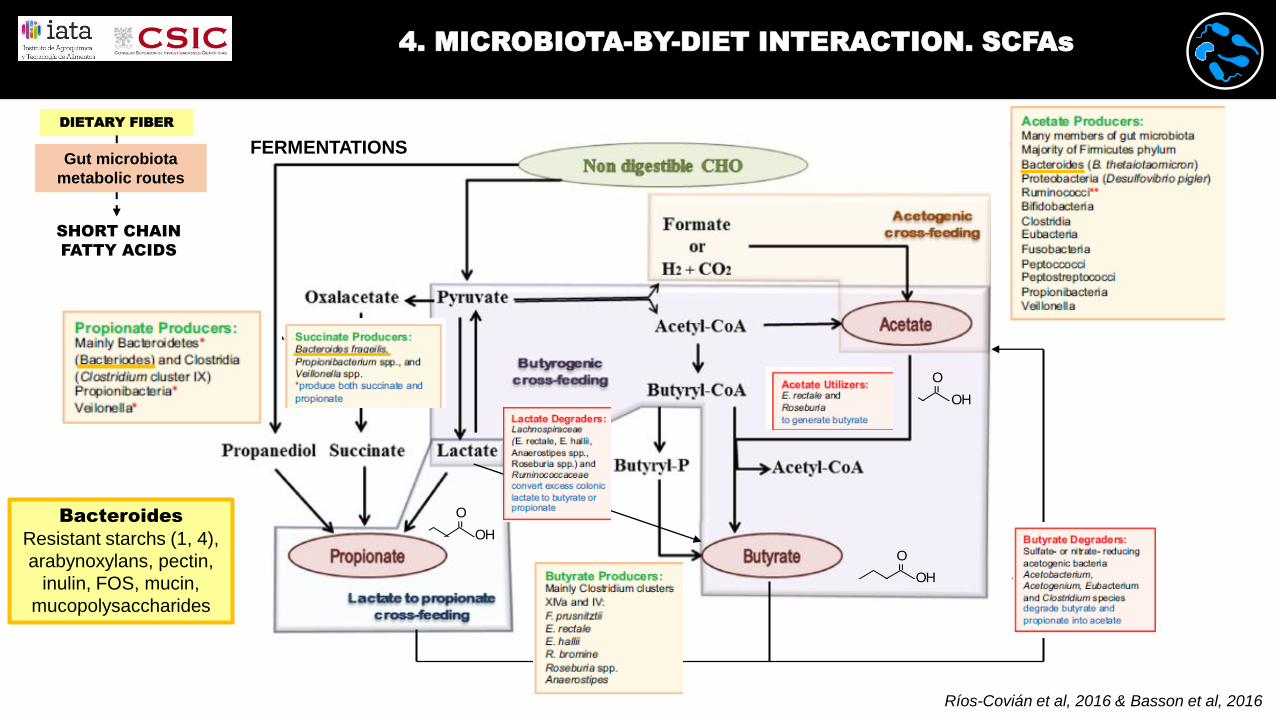
DIETARY FIBER
O=
OH
=
OH
O=
OH
=
OH
O=
OH
=
OH
FERMENTATIONS
Ríos-Covián et al, 2016 & Basson et al, 2016
Bacteroides
Resistant starchs (1, 4),
arabynoxylans, pectin,
inulin, FOS, mucin,
mucopolysaccharides
Gut microbiota
metabolic routes
SHORT CHAIN
FATTY ACIDS
4. MICROBIOTA-BY-DIET INTERACTION. SCFAs
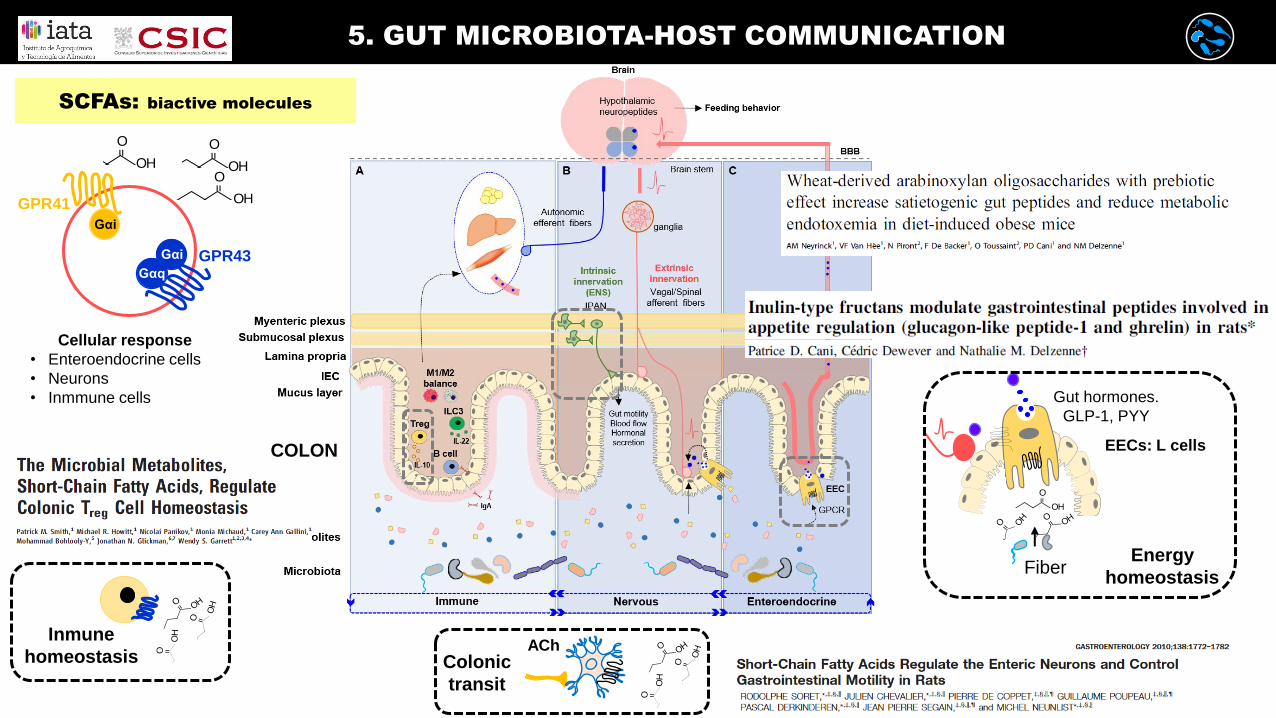
Fiber
Gut hormones.
GLP-1, PYY
EECs: L cells
SCFAs: biactive molecules
O=
OH
=
OHO=
OH
=
OHO=
OH
=
OHGPR41
Gαi
Cellular response
• Enteroendocrine cells
• Neurons
• Inmmune cells
GPR43Gαi
Gαq
O= OH
= OH O =
OH
=
OH
O=
OH
=
OH
Inmune
homeostasis
Energy
homeostasis
COLON
AChColonic
transit
O= OH
= OH O =
OH
=
OH
O=
OH
=
OH
O=
OH
=
OH
O= OH
= OH
O= OH
= OH
5. GUT MICROBIOTA-HOST COMMUNICATION
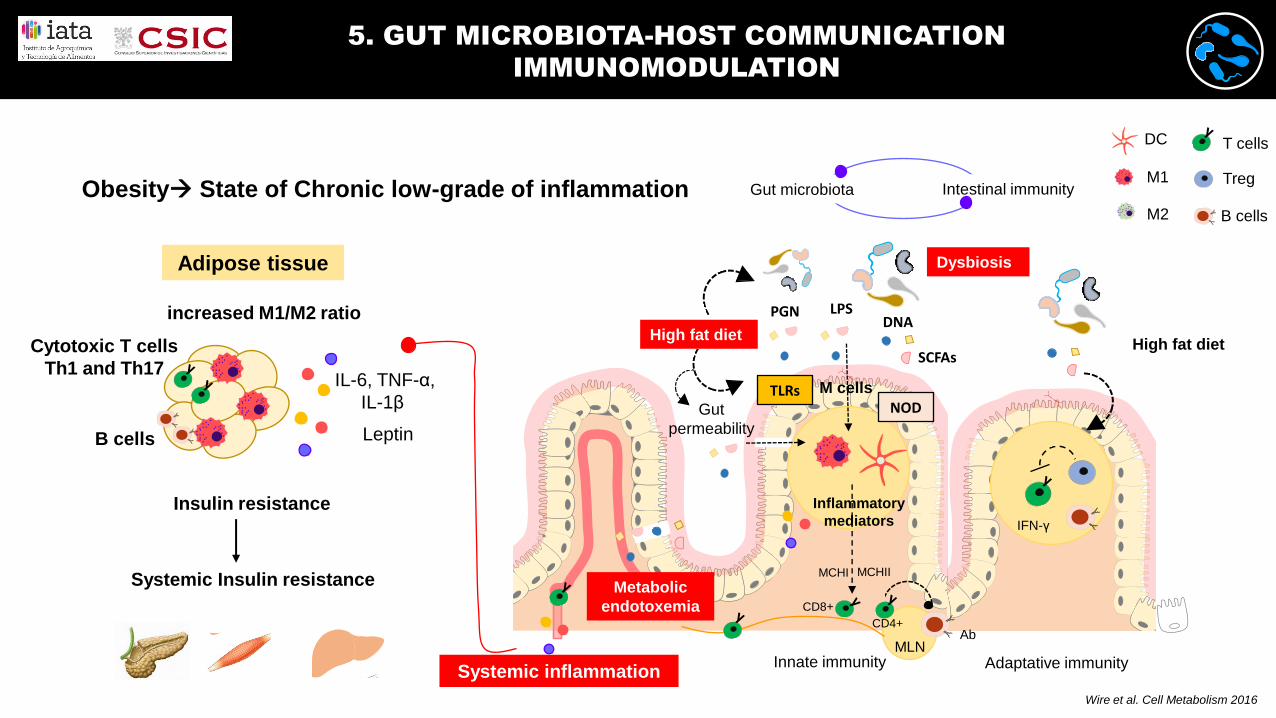
Adipose tissue
Obesity State of Chronic low-grade of inflammation
increased M1/M2 ratio
IL-6, TNF-α,
IL-1β
LeptinB cells
Cytotoxic T cells
Th1 and Th17
Insulin resistance
Systemic Insulin resistance
DC
M1
M2
T cells
Treg
B cells
MLN
M cellsTLRsNOD
Innate immunitySystemic inflammation
Gut microbiota Intestinal immunity
Gut
permeability
High fat diet
Dysbiosis
High fat diet
LPSDNA
PGN
Metabolic
endotoxemia
Wire et al. Cell Metabolism 2016
IFN-γ
Ab
Adaptative immunity
Inflammatory
mediators
CD4+
MCHI MCHII
CD8+
SCFAs
5. GUT MICROBIOTA-HOST COMMUNICATION
IMMUNOMODULATION
Strain identification
Functional
characterization
Safety
assesment
Phase 2 human trial (DBPC)
Probiotic vs placebo
Phase 3 human trial
Probiotic vs standard treatment
Probiotic for FOOD
in vitro & in vivo
Evaluationof probiotics for food
Pathophysiology of metabolic
and inflammatory diseases
6. GROUP OF MICROBIAL ECOLOGY, NUTRITION AND HEALTH.
‘On the way to evaluate new probiotics’
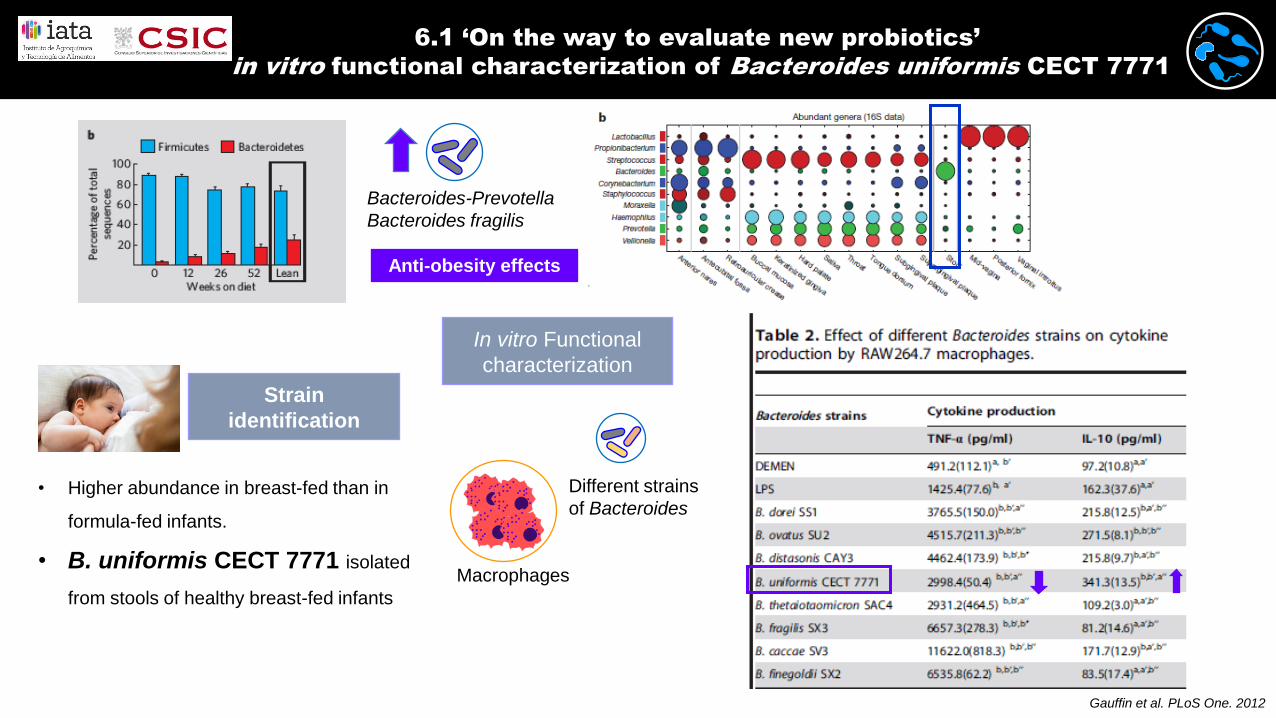
Bacteroides-Prevotella
Bacteroides fragilis
Anti-obesity effects
• Higher abundance in breast-fed than in
formula-fed infants.
• B. uniformis CECT 7771 isolated
from stools of healthy breast-fed infants
Strain
identification
In vitro Functional
characterization
Gauffin et al. PLoS One. 2012
Macrophages
Different strains
of Bacteroides
6.1 ‘On the way to evaluate new probiotics’
in vitro functional characterization of Bacteroides uniformis CECT 7771
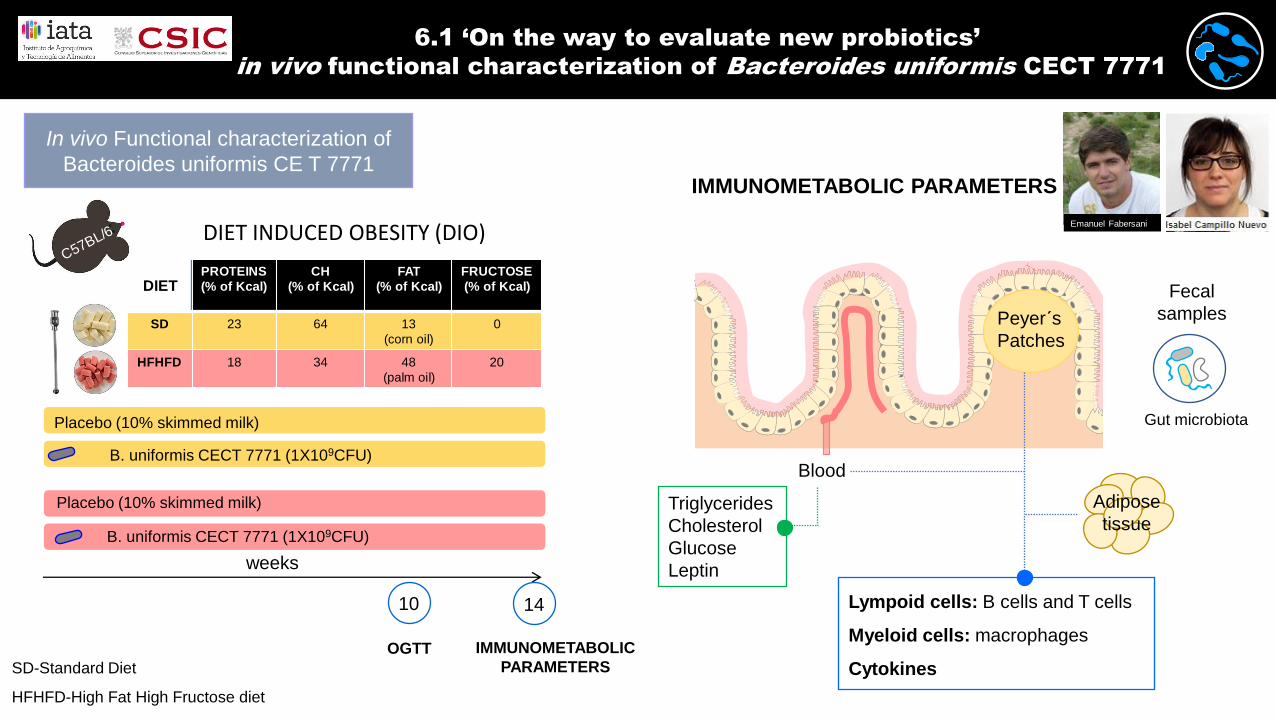
C57BL/6
HFHFD-High Fat High Fructose diet
SD-Standard Diet
Placebo (10% skimmed milk)
B. uniformis CECT 7771 (1X10⁹CFU)
Placebo (10% skimmed milk)
B. uniformis CECT 7771 (1X10⁹CFU)
weeks
PROTEINS
(% of Kcal)
CH
(% of Kcal)
FAT
(% of Kcal)
FRUCTOSE
(% of Kcal)
SD 23 64 13
(corn oil)
0
HFHFD 18 34 48
(palm oil)
20
DIET
10 14
OGTT IMMUNOMETABOLIC
PARAMETERS
IMMUNOMETABOLIC PARAMETERS
Peyer´s
Patches
Blood
Adipose
tissue
Lympoid cells: B cells and T cells
Myeloid cells: macrophages
Cytokines
Triglycerides
Cholesterol
Glucose
Leptin
Emanuel Fabersani
DIET INDUCED OBESITY (DIO)
Fecal
samples
Gut microbiota
In vivo Functional characterization of
Bacteroides uniformis CE T 7771
6.1 ‘On the way to evaluate new probiotics’
in vivo functional characterization of Bacteroides uniformis CECT 7771
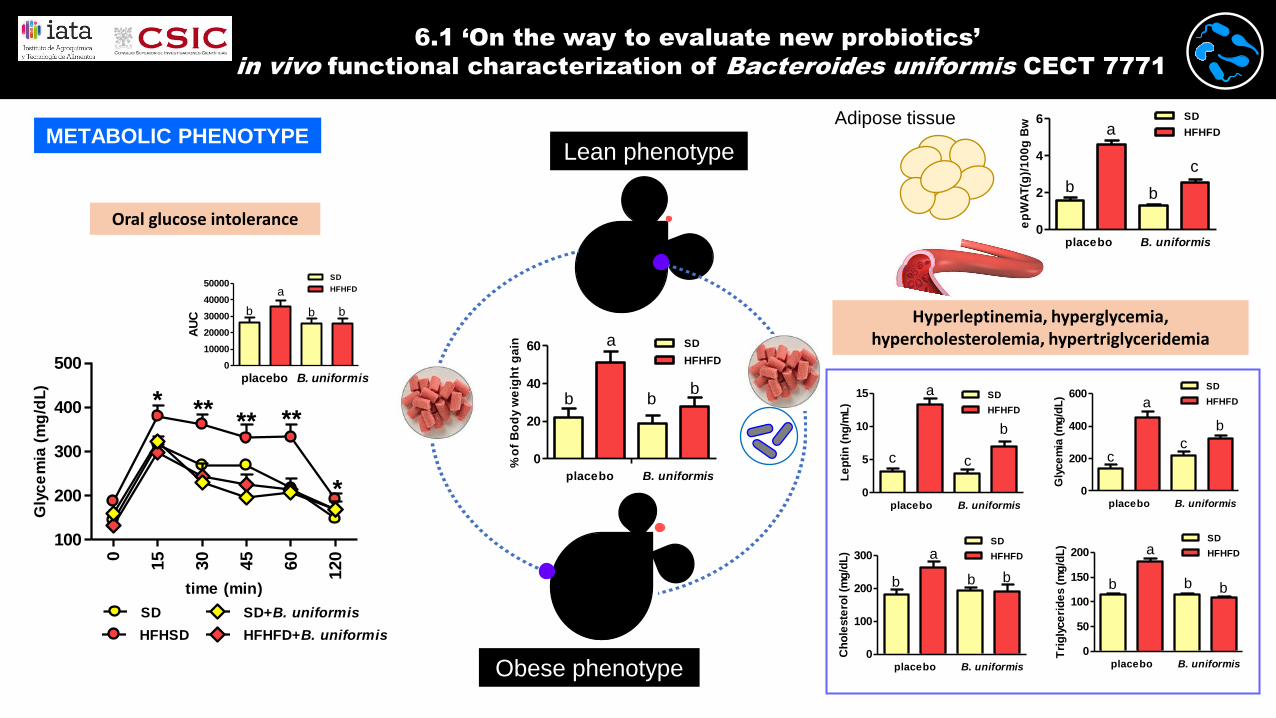
METABOLIC PHENOTYPE
0
200
400
600
placebo B. uniformis
a
c
b
c
HFHFD
SD
Gly
ce
mia
(m
g/d
L)
0
100
200
300
placebo B. uniformis
HFHFD
SD
a
b b b
Ch
ole
ste
rol (m
g/d
L)
0
50
100
150
200
placebo B. uniformis
HFHFD
SD
a
b b b
Tri
gly
ce
rid
es (
mg
/dL
)
0
5
10
15
placebo B. uniformis
HFHFD
SDa
c c
b
Le
pti
n (
ng
/mL
)
Hyperleptinemia, hyperglycemia, hypercholesterolemia, hypertriglyceridemia
0
15
30
45
60
120
100
200
300
400
500
SD SD+B. uniformis
HFHSD HFHFD+B. uniformis
* **** **
*
time (min)
Gly
ce
mia
(m
g/d
L)
0
10000
20000
30000
40000
50000SD
HFHFDa
b b b
placebo B. uniformis
AU
C
Oral glucose intolerance0
2
4
6 SD
HFHFDa
c
bb
placebo B. uniformis
ep
WA
T(g
)/1
00
g B
wAdipose tissue
0
20
40
60 SD
HFHFD
placebo B. uniformis
a
b bb
% o
f B
od
y w
eig
ht
ga
in
Lean phenotype
Obese phenotype
PROTEINS
(% of Kcal)
CH
(% of Kcal)
FAT
(% of Kcal)
FRUCTOSE
(% of Kcal)
SD 23 64 13
(corn oil)
0
HFHFD 18 34 48
(palm oil)
20
DIET
PROTEINS
(% of Kcal)
CH
(% of Kcal)
FAT
(% of Kcal)
FRUCTOSE
(% of Kcal)
SD 23 64 13
(corn oil)
0
HFHFD 18 34 48
(palm oil)
20
DIET
6.1 ‘On the way to evaluate new probiotics’
in vivo functional characterization of Bacteroides uniformis CECT 7771
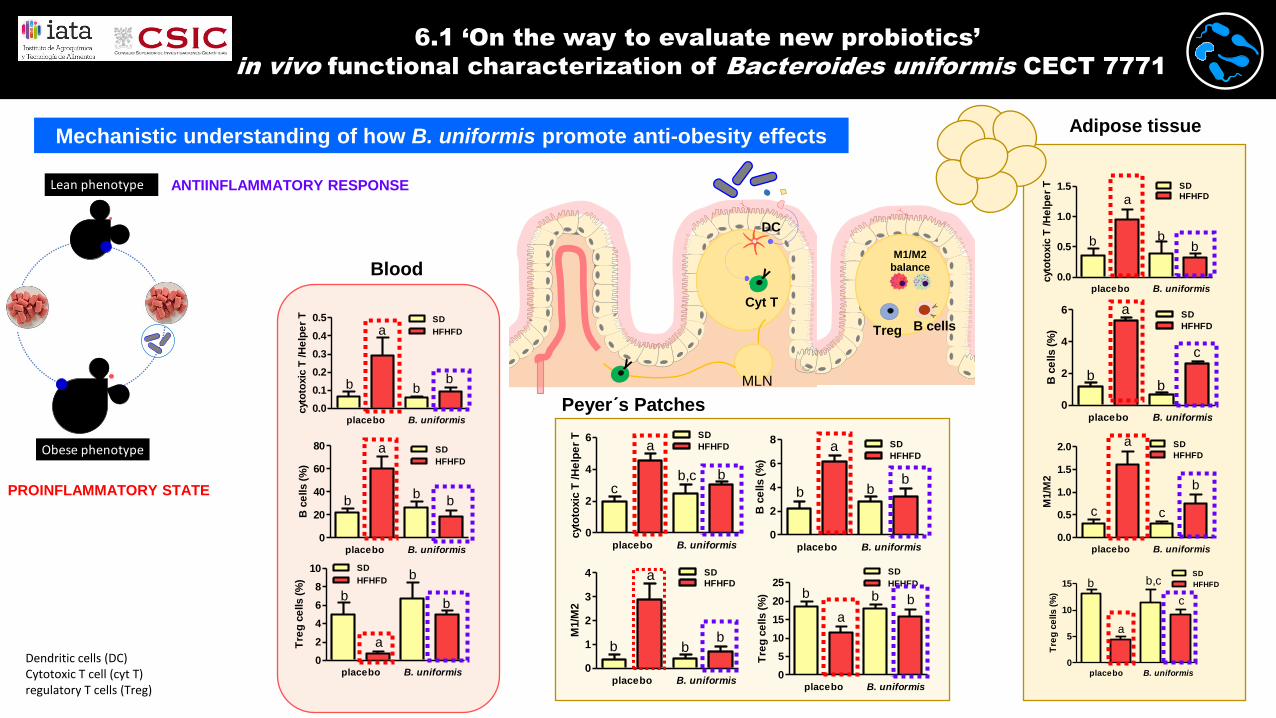
Mechanistic understanding of how B. uniformis promote anti-obesity effectsAdipose tissue
Peyer´s Patches
MLN
Dendritic cells (DC)Cytotoxic T cell (cyt T) regulatory T cells (Treg)
Cyt T
DC
M1/M2
balance
B cellsTreg
Blood
0
1
2
3
4
placebo B. uniformis
HFHFD
SDa
b bbM
1/M
2
0.0
0.5
1.0
1.5
2.0
placebo B. uniformis
HFHFD
SDa
c c
b
M1/M
2
0
2
4
6
8
10
placebo B. uniformis
HFHFD
SD
a
b
b
b
Tre
g c
ells (
%)
0
5
10
15
20
25
placebo B. uniformis
HFHFD
SD
a
b b b
Tre
g c
ells (
%)
0
5
10
15
placebo B. uniformis
HFHFD
SD
a
b b,c
c
Tre
g c
ells (
%)
Lean phenotype
Obese phenotype
0
2
4
6
8
placebo B. uniformis
HFHFD
SDa
b bb
B c
ells (
%)
0
2
4
6
placebo B. uniformis
HFHFD
SDa
bb
c
B c
ells (
%)
0
20
40
60
80
placebo B. uniformis
HFHFD
SDa
bb
b
B c
ells (
%)
0.0
0.1
0.2
0.3
0.4
0.5
placebo B. uniformis
HFHFD
SD
a
b bb
cyt
oto
xic
T /H
elp
er
T
0.0
0.5
1.0
1.5
placebo B. uniformis
HFHFD
SD
a
b bb
cyt
oto
xic
T /H
elp
er
T
0
2
4
6
placebo B. uniformis
HFHFD
SD
a
cb,c b
cyt
oto
xic
T /H
elp
er
T
PROTEINS
(% of Kcal)
CH
(% of Kcal)
FAT
(% of Kcal)
FRUCTOSE
(% of Kcal)
SD 23 64 13
(corn oil)
0
HFHFD 18 34 48
(palm oil)
20
DIET
PROTEINS
(% of Kcal)
CH
(% of Kcal)
FAT
(% of Kcal)
FRUCTOSE
(% of Kcal)
SD 23 64 13
(corn oil)
0
HFHFD 18 34 48
(palm oil)
20
DIET
PROINFLAMMATORY STATE
ANTIINFLAMMATORY RESPONSE
6.1 ‘On the way to evaluate new probiotics’
in vivo functional characterization of Bacteroides uniformis CECT 7771
Peyer´s Patches
EpWATblood
MLN
Cyt T
DC
M1/M2
balance
B cellsTreg
0
20
40
60
80
placebo B. uniformis
HFHFD
SDa
bb
b
B c
ells (
%)
0
20
40
60
80
placebo B. uniformis
HFHFD
SDa
bb
b
B c
ells (
%)
0
20
40
60
80
placebo B. uniformis
HFHFD
SDa
bb
b
B c
ells (
%)
Lean phenotype
Obese phenotype
0
1000
2000
3000
4000
5000
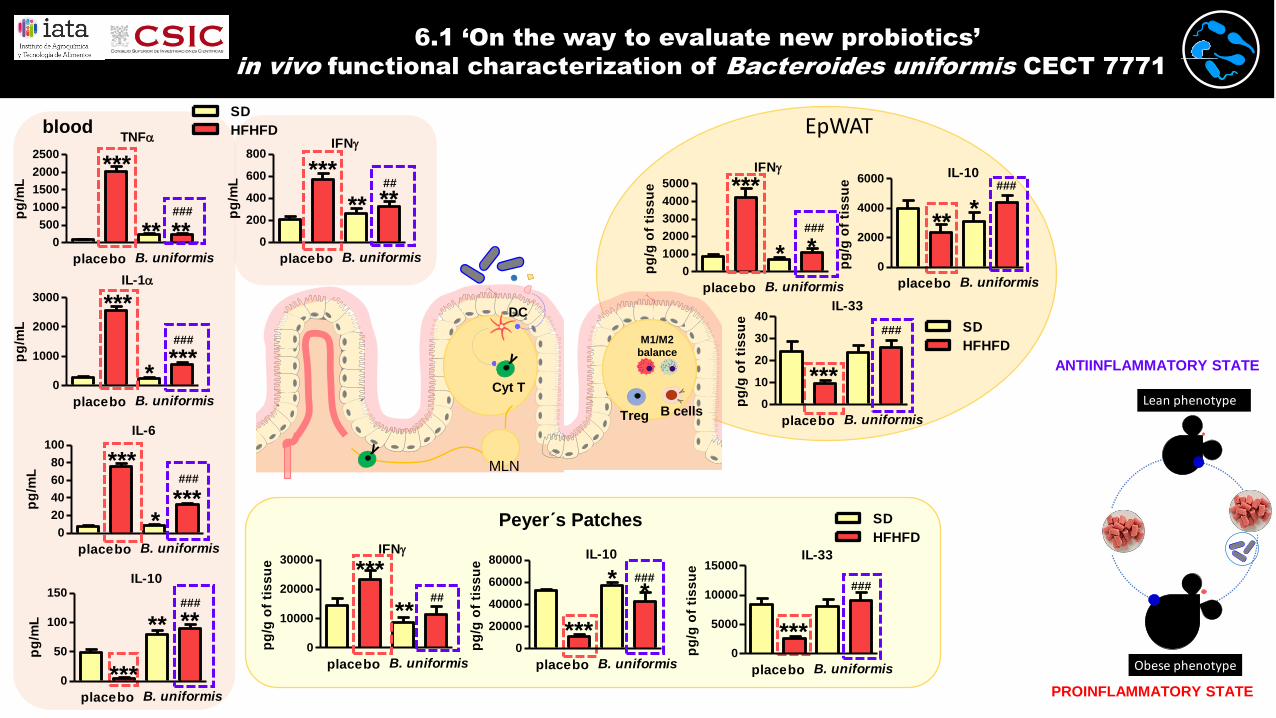
placebo B. uniformis
IFN
***
*
###
*
pg
/g o
f ti
ss
ue
0
10000
20000
30000
placebo B. uniformis
IFN
***
**##
pg
/g o
f ti
ss
ue
PROTEINS
(% of Kcal)
CH
(% of Kcal)
FAT
(% of Kcal)
FRUCTOSE
(% of Kcal)
SD 23 64 13
(corn oil)
0
HFHFD 18 34 48
(palm oil)
20
DIET
0
500
1000
1500
2000
2500
placebo B. uniformis
TNF
***
** **###p
g/m
L
0
1000
2000
3000
placebo B. uniformis
IL-1
***
*
###
***pg
/mL
0
20
40
60
80
100
placebo B. uniformis
IL-6
***
*
###
***pg
/mL
0
200
400
600
800
placebo B. uniformis
IFN
***
** **##
pg
/mL
PROINFLAMMATORY STATE
ANTIINFLAMMATORY STATE
0
10
20
30
40
placebo B. uniformis
IL-33
***
###
pg
/g o
f ti
ss
ue
0
5000
10000
15000
placebo B. uniformis
IL-33
***
###
pg
/g o
f ti
ss
ue
0
2000
4000
6000
placebo B. uniformis
IL-10
***
###
pg
/g o
f ti
ss
ue
0
20000
40000
60000
80000
placebo B. uniformis
IL-10
***
* ###
*
pg
/g o
f ti
ss
ue
0
50
100
150
placebo B. uniformis
IL-10
***
****###
pg
/mL
PROTEINS
(% of Kcal)
CH
(% of Kcal)
FAT
(% of Kcal)
FRUCTOSE
(% of Kcal)
SD 23 64 13
(corn oil)
0
HFHFD 18 34 48
(palm oil)
20
DIET
6.1 ‘On the way to evaluate new probiotics’
in vivo functional characterization of Bacteroides uniformis CECT 7771

TLRs
Peyer´s Patchesileum
placebo B. uniformis
Adipose tissue
Lean phenotype
Obese phenotype
TLR5
PROTEINS
(% of Kcal)
CH
(% of Kcal)
FAT
(% of Kcal)
FRUCTOSE
(% of Kcal)
SD 23 64 13
(corn oil)
0
HFHFD 18 34 48
(palm oil)
20
DIET
TLR2
TLR4
TLR5
placebo B. uniformis
placebo B. uniformis
placebo B. uniformis
0
20
40
60
80
placebo B. uniformis
HFHFD
SDa
bb
b
B c
ells (
%)
PROTEINS
(% of Kcal)
CH
(% of Kcal)
FAT
(% of Kcal)
FRUCTOSE
(% of Kcal)
SD 23 64 13
(corn oil)
0
HFHFD 18 34 48
(palm oil)
20
DIET
6.1 ‘On the way to evaluate new probiotics’
in vivo functional characterization of Bacteroides uniformis CECT 7771
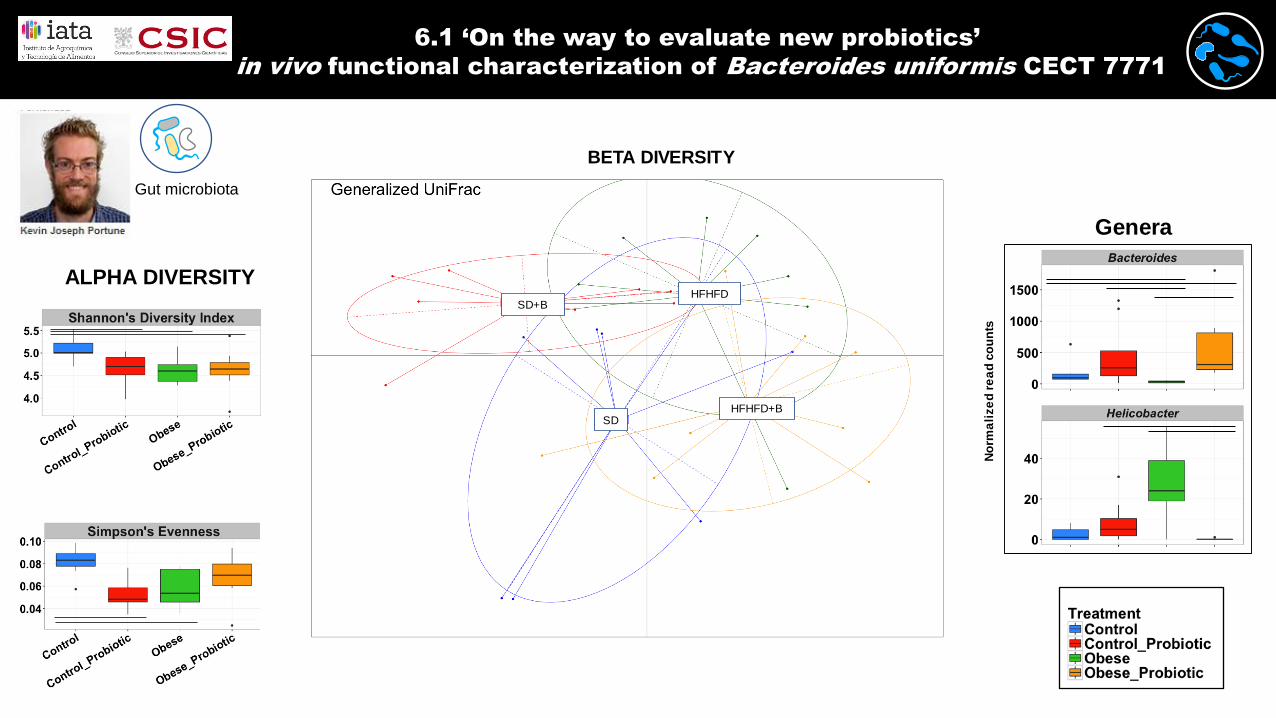
ALPHA DIVERSITY
Gut microbiota
BETA DIVERSITY
SD
SD+BHFHFD
HFHFD+B
No
rma
lize
dre
ad
co
un
ts
Genera
6.1 ‘On the way to evaluate new probiotics’
in vivo functional characterization of Bacteroides uniformis CECT 7771
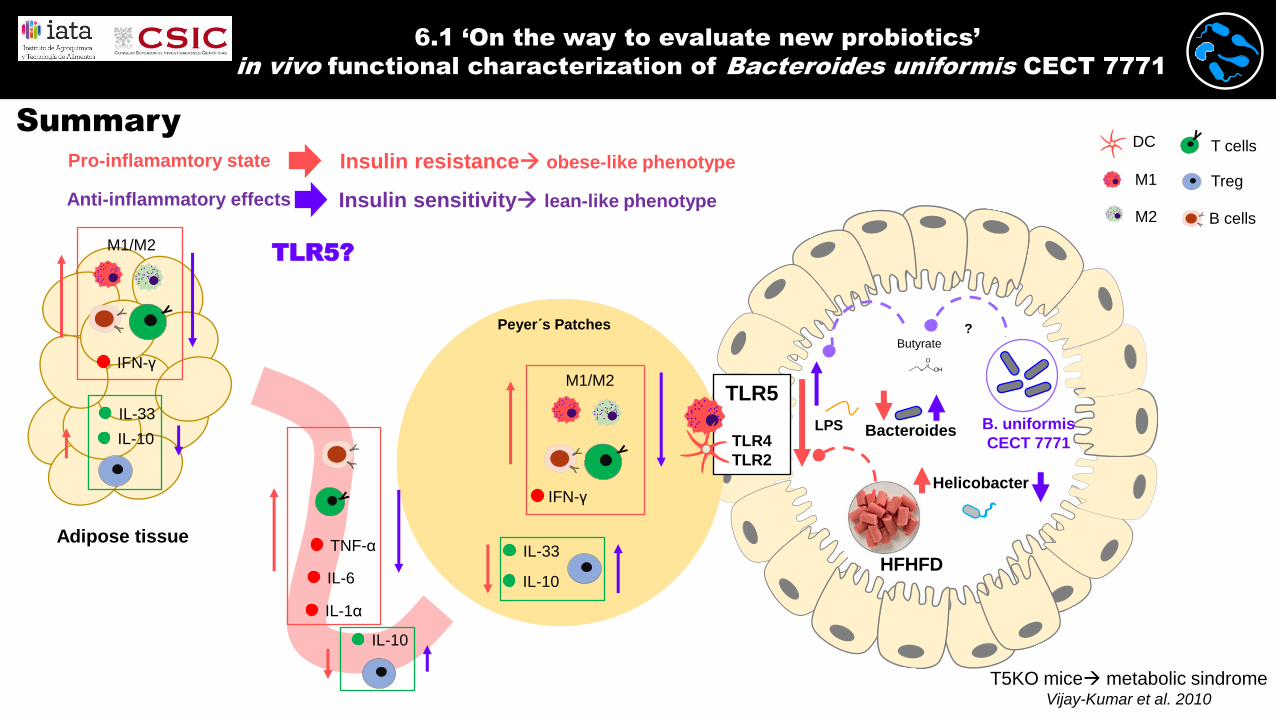
T5KO mice metabolic sindromeVijay-Kumar et al. 2010
PROTEINS
(% of Kcal)
CH
(% of Kcal)
FAT
(% of Kcal)
FRUCTOSE
(% of Kcal)
SD 23 64 13
(corn oil)
0
HFHFD 18 34 48
(palm oil)
20
DIET
HFHFD
Peyer´s Patches
Adipose tissue
B. uniformis
CECT 7771
O=
OH
=
OH
?Butyrate
BacteroidesLPS
Helicobacter
DC
M1
M2
T cells
Treg
B cells
TLR5
TLR4
TLR2
M1/M2
IFN-γ
Pro-inflamamtory state Insulin resistance obese-like phenotype
IL-33
IL-10
IL-10
M1/M2
IFN-γ
IL-10
IL-33
Summary
TNF-α
IL-6
IL-1α
Anti-inflammatory effects Insulin sensitivity lean-like phenotype
TLR5?
6.1 ‘On the way to evaluate new probiotics’
in vivo functional characterization of Bacteroides uniformis CECT 7771
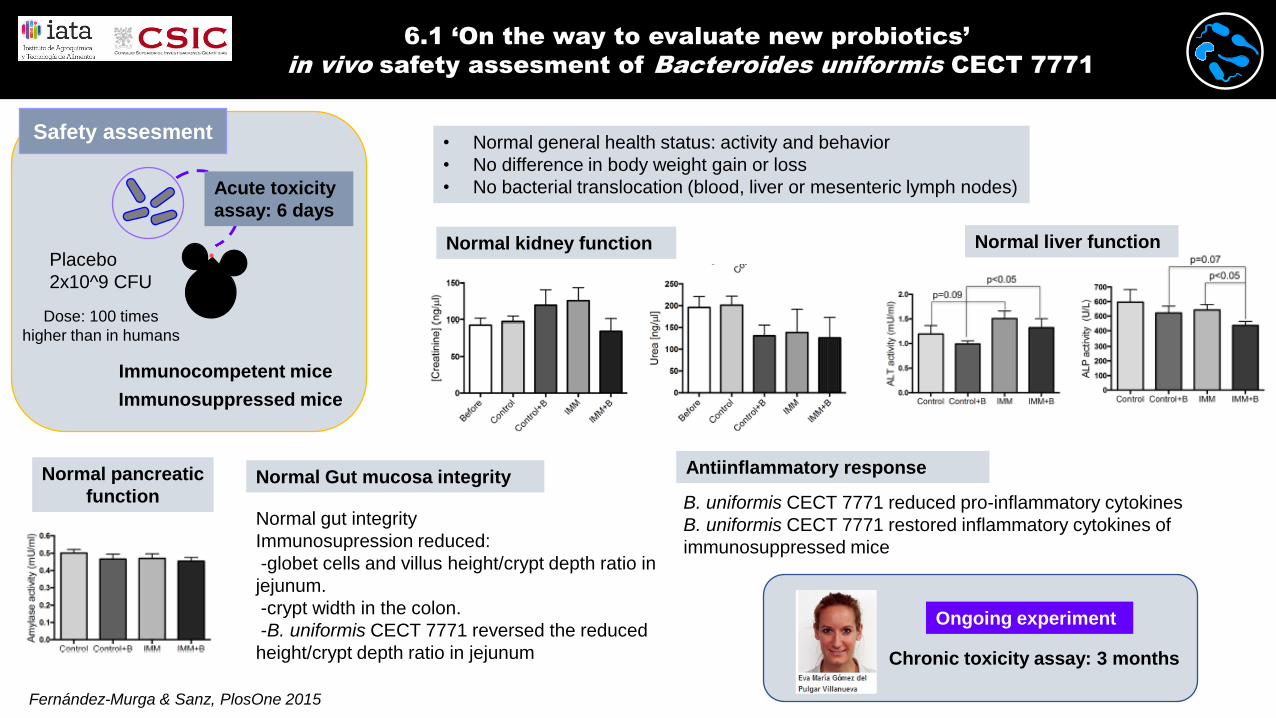
Fernández-Murga & Sanz, PlosOne 2015
• Normal general health status: activity and behavior
• No difference in body weight gain or loss
• No bacterial translocation (blood, liver or mesenteric lymph nodes)
Normal kidney function Normal liver function
Normal pancreatic
functionNormal Gut mucosa integrity
Normal gut integrity
Immunosupression reduced:
-globet cells and villus height/crypt depth ratio in
jejunum.
-crypt width in the colon.
-B. uniformis CECT 7771 reversed the reduced
height/crypt depth ratio in jejunum
Antiinflammatory response
B. uniformis CECT 7771 reduced pro-inflammatory cytokines
B. uniformis CECT 7771 restored inflammatory cytokines of
immunosuppressed mice
Ongoing experiment
Chronic toxicity assay: 3 months
Placebo
2x10^9 CFU
Immunocompetent mice
Immunosuppressed mice
Dose: 100 times
higher than in humans
Acute toxicity
assay: 6 days
Safety assesment
6.1 ‘On the way to evaluate new probiotics’
in vivo safety assesment of Bacteroides uniformis CECT 7771
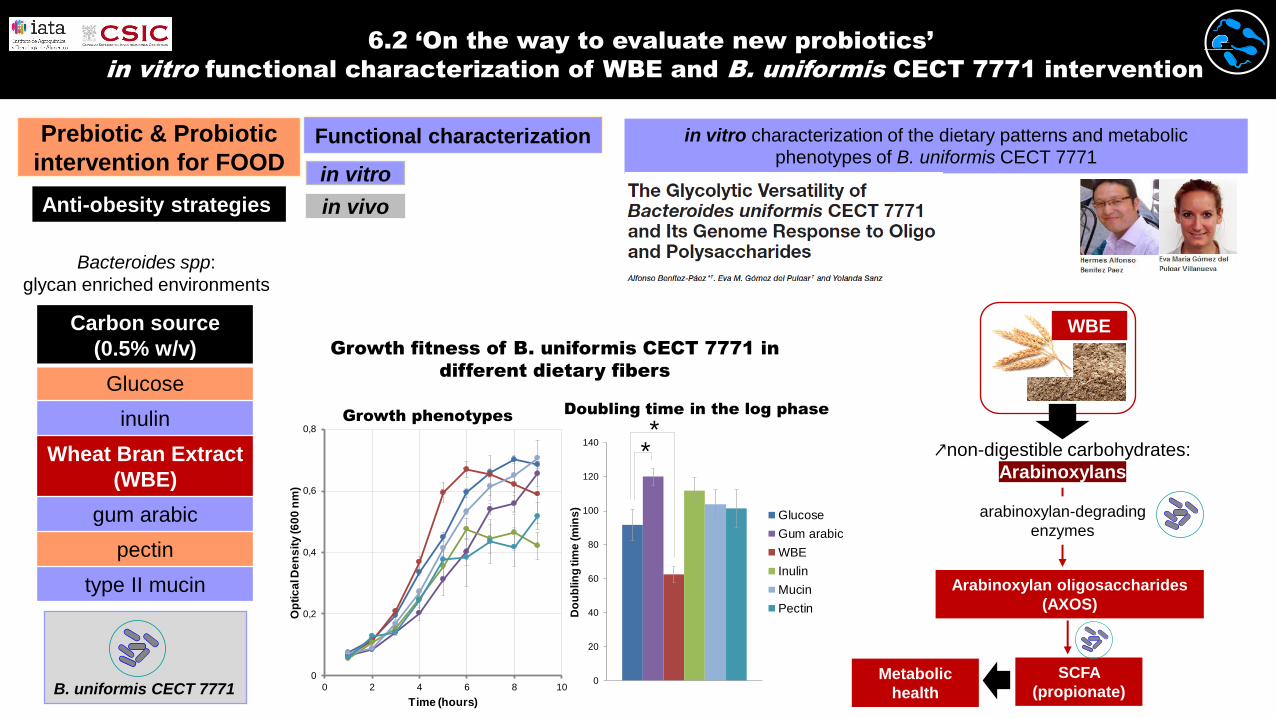
Functional characterizationPrebiotic & Probiotic
intervention for FOODin vitro
Anti-obesity strategies in vivo
in vitro characterization of the dietary patterns and metabolic phenotypes of B. uniformis CECT 7771
Carbon source
(0.5% w/v)
Glucose
inulin
Wheat Bran Extract
(WBE)
gum arabic
pectin
type II mucin
Bacteroides spp:
glycan enriched environments
B. uniformis CECT 7771
Growth fitness of B. uniformis CECT 7771 in
different dietary fibers
Growth phenotypes
0
0,2
0,4
0,6
0,8
0 2 4 6 8 10
Op
tic
al D
en
sit
y (6
00
nm
)
Time (hours)
Doubling time in the log phase
0
20
40
60
80
100
120
140
Do
ub
lin
g tim
e (m
ins
)
Glucose
Gum arabic
WBE
Inulin
Mucin
Pectin
**
WBE
↗non-digestible carbohydrates:
Arabinoxylans
arabinoxylan-degrading
enzymes
Arabinoxylan oligosaccharides
(AXOS)
SCFA
(propionate)Metabolic
health
6.2 ‘On the way to evaluate new probiotics’
in vitro functional characterization of WBE and B. uniformis CECT 7771 intervention
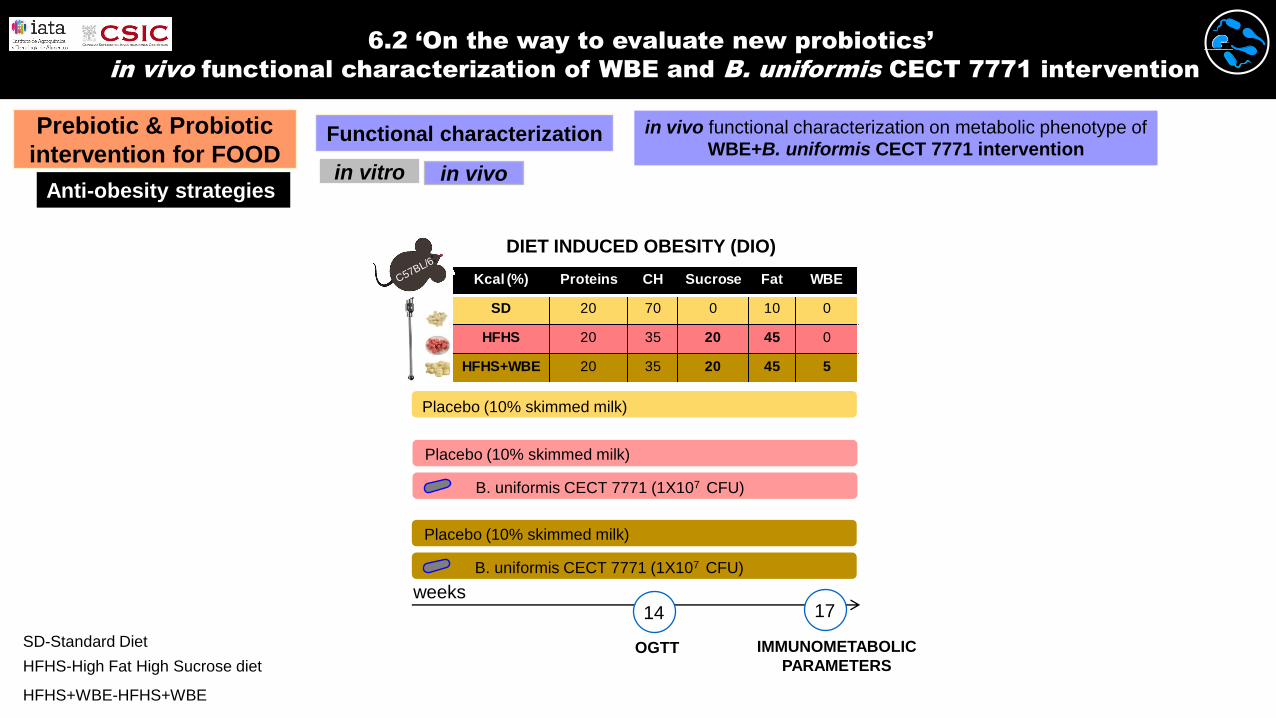
Functional characterizationPrebiotic & Probiotic
intervention for FOODin vitro
Anti-obesity strategiesin vivo
in vivo functional characterization on metabolic phenotype of WBE+B. uniformis CECT 7771 intervention
Placebo (10% skimmed milk)
Placebo (10% skimmed milk)
B. uniformis CECT 7771 (1X10⁷ CFU)
weeks1714
OGTT IMMUNOMETABOLIC
PARAMETERS
Placebo (10% skimmed milk)
B. uniformis CECT 7771 (1X10⁷ CFU)
DIET INDUCED OBESITY (DIO)
Kcal (%) PROTEINS CH SUCROSE FAT WHEAT BRAN EXTRACT
Control 20 70 0 10 0
HFHS 20 35 20 45 0
HFHS+F 20 35 20 45 5
WHEAT BRAN
EXTRACTFATSUCROSECHPROTEINSKcal (%)
Kcal (%) Proteins CH Sucrose Fat WBE
SD 20 70 0 10 0
HFHS 20 35 20 45 0
HFHS+WBE 20 35 20 45 5
HFHS-High Fat High Sucrose diet
SD-Standard Diet
HFHS+WBE-HFHS+WBE
C57BL/6
6.2 ‘On the way to evaluate new probiotics’
in vivo functional characterization of WBE and B. uniformis CECT 7771 intervention
0 1 2 3 4 5 6 7 8 9
10
11
12
13
14
15
16
17
20
25
30
35
40
45
SD-Vehicle HFHS+WBE
HFHS HFHS+WBE B. uniformis
***
*** *** *** ******
*** *** *****
*
*****
******
*** ***
*** **
***
HFHS B. uniformis
week
Bo
dy w
eig
ht
(g)
0 1 2 3 4 5 6 7 8 9
10
11
12
13
14
15
16
17
20
25
30
35
40
45
SD-Vehicle HFHS+WBE
HFHS HFHS+WBE B. uniformis
***
*** *** *** ******
*** *** *****
*
*****
******
*** ***
*** **
***
HFHS B. uniformis
week
Bo
dy w
eig
ht
(g)
0
10000
20000
30000
40000
50000 *** at least p<0.05*
SD
HFHS
HFHS+WBE
placebo B. uniformis
AU
C
0
10000
20000
30000
40000
50000 *** at least p<0.05*
SD
HFHS
HFHS+WBE
placebo B. uniformis
AU
C
0
2
4
6
at least p<0.01
p=0.08
SD
HFHS
HFHS+WBE
placebo B. uniformis
ep
WA
T(g
)/1
00
g B
w
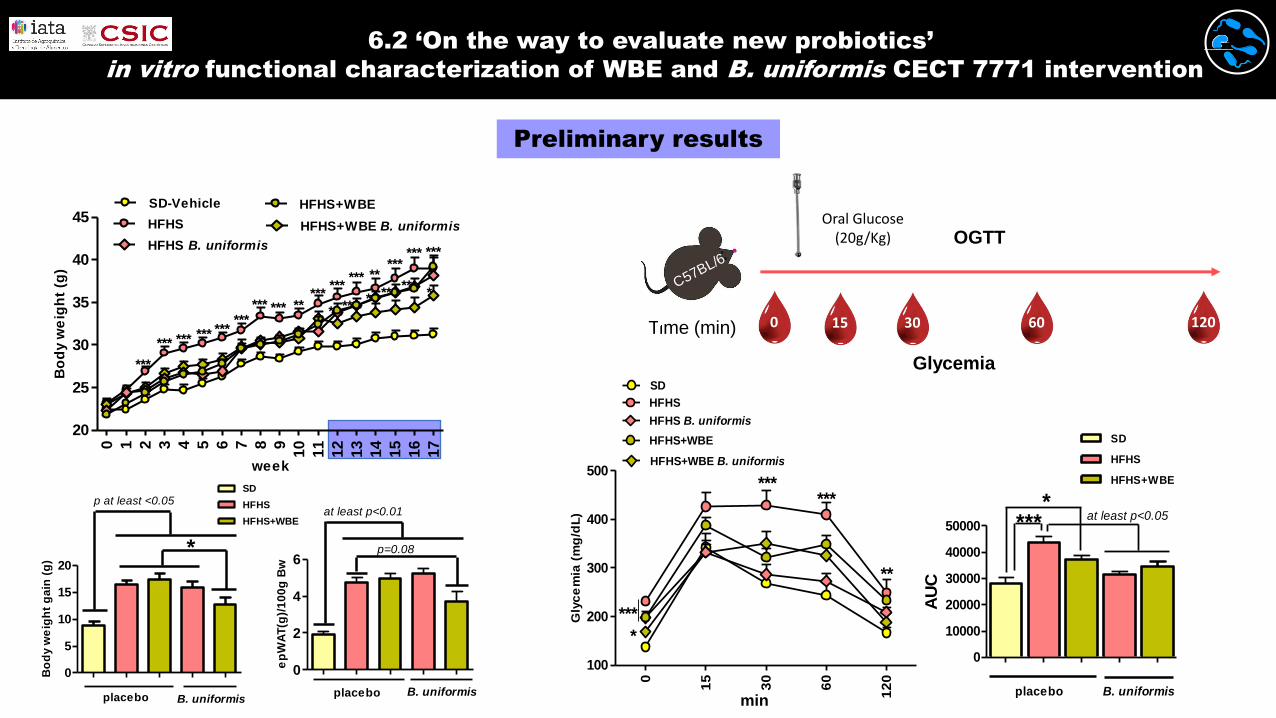
6.2 ‘On the way to evaluate new probiotics’
in vitro functional characterization of WBE and B. uniformis CECT 7771 intervention
0
5
10
15
20
placebo B. uniformis
HFHS
HFHS+WBE
SD
p at least <0.05
*
Bo
dy w
eig
ht
ga
in (
g)
0
5
10
15
20
placebo B. uniformis
HFHS
HFHS+WBE
SD
p at least <0.05
*
Bo
dy w
eig
ht
ga
in (
g)
Preliminary results
Time (min) 0
Oral Glucose(20g/Kg)
15 30 60 120
C57BL/6
Glycemia
OGTT
0
15
30
60
12
0
100
200
300
400
500
SD
HFHS+WBE
HFHS
HFHS+WBE B. uniformis
***
*
******
**
HFHS B. uniformis
week
Gly
ce
mia
(m
g/d
L)
0
15
30
60
12
0
100
200
300
400
500
SD
HFHS+WBE
HFHS
HFHS+WBE B. uniformis
***
*
******
**
HFHS B. uniformis
week
Gly
ce
mia
(m
g/d
L)
min
6.2 ‘On the way to evaluate new probiotics’
in vitro functional characterization of WBE and B. uniformis CECT 7771 intervention
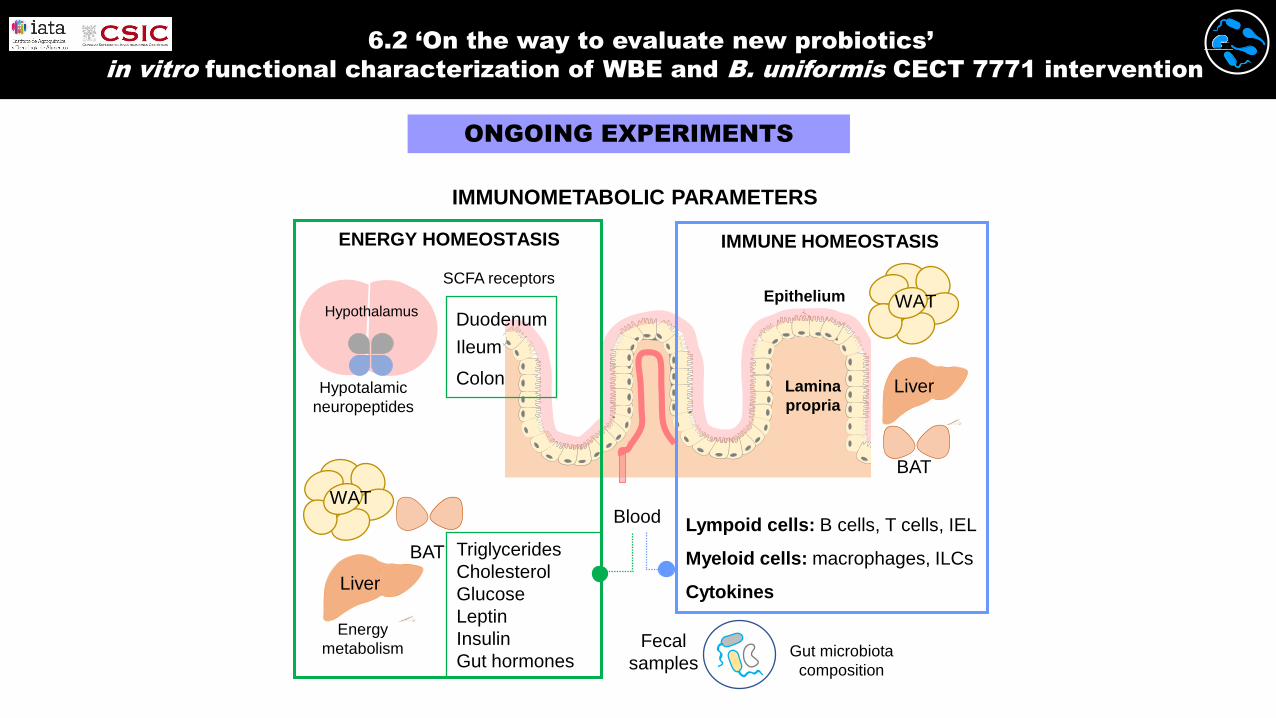
ONGOING EXPERIMENTS
IMMUNOMETABOLIC PARAMETERS
Blood
Fecal
samplesGut microbiota
composition
WAT
Lympoid cells: B cells, T cells, IEL
Myeloid cells: macrophages, ILCs
Cytokines
Lamina
propria
Epithelium
Liver
BAT
Triglycerides
Cholesterol
Glucose
Leptin
Insulin
Gut hormones
Hypothalamus
WAT
Liver
BAT
Duodenum
Ileum
Colon
SCFA receptors
Hypotalamic
neuropeptides
Energy
metabolism
ENERGY HOMEOSTASIS IMMUNE HOMEOSTASIS
MARINA ROMANÍ-PÉREZ
THANK YOU FOR YOUR
ATTENTION
Top Related