


Languages
Pages
Legal


1
Expression of Matrix Metalloproteinase Genes in Regressing or Remodeling
Organs during the Amphibian Metamorphosis
Running Title: TREs in Xenopus MMP Genes
Kenta Fujimoto, Keisuke Nakajima and Yoshio Yaoita*
Division of Embryology and Genetics, Institute for Amphibian Biology, Graduate
School of Science, Hiroshima University, Higashihiroshima 739-8526, Japan
*Author to whom all correspondence should be addressed.
Email: [email protected]
Fax: +81 82 424 0739
Tel: +81 82 424 7481

2
Abstract
Several matrix metalloproteinases (MMP) are induced by thyroid hormone
(TH) during the climax of amphibian metamorphosis, and play a pivotal role in the
remodeling intestine and the regressing tail and gills by degrading the extracellular
matrix (ECM). We compared MMP gene expression levels precisely by the quantitative
real time reverse transcription-polymerase chain reaction. The expression of MMP
genes increases prominently at NF stages 60, 60-61, and 62 in the intestine, gills, and
tail, respectively, when the drastic morphological change starts in each organ. The gene
expression analysis in the TH-treated tadpoles and cell line revealed that MMP mRNAs
are up-regulated in response to TH quickly within several hours to low levels and then
increase in a day to high levels. All TH-induced MMP genes have thyroid hormone
response elements (TREs). The presence of high affinity TREs in MMP genes correlates
with the early TH-induction. Based on these results, we propose that TH stimulates the
transcription of MMP genes through TREs within several hours to low levels, and then
bring about the main increase of mRNAs by TH-induced transcriptional factors
including TH receptor β in cell type-specific transcriptional environment.
Key words: Amphibian metamorphosis, Matrix metalloproteinases, Thyroid hormone
response element, Thyroid hormone, Xenopus

3
Introduction
The systematic and dramatic transformation is induced by thyroid hormone
(TH) during the amphibian metamorphosis in order to transit from aquatic to terrestrial
life style. At the climax of metamorphosis from Nieuwkoop and Faber stage (NF stage)
58 to 66 when endogenous TH levels peak, Xenopus laevis tadpoles undergo many
morphological changes including the remodeling of intestine, skin, skeleton, pancreas,
etc. and the absorption of both the tail and gills in the temporally predetermined order
(Dodd & Dodd, 1976).
At NF stage 59 the lumen of the entire intestinal tract narrows progressively,
and a considerable shortening of the intestinal tract takes place between NF stage 61 and
62 (Nieuwkoop & Faber, 1956, Marshall & Dixon, 1978). The larval epithelial cells
undergo programmed cell death, and are replaced by the newly differentiated adult
epithelial cells (Bonneville, 1963). Resorption of gills starts at NF stage 60 and is
completed by NF stage 63 (Berry et al., 1998a, Minnich et al., 2002). In tadpole tail, the
notochord begins to degenerate posteriorly at NF stage 61, and massive resorption starts
around NF stage 62 when a length is reduced rapidly (Nieuwkoop & Faber, 1956).
The interactions of cells with the extracellular matrix (ECM) are critical for
the normal development and function of the organism, because ECM serves as a
structural support and a medium for cell-cell interactions. The matrix metalloproteinases
(MMP) regulate the cell migration, the activity of biologically active molecules, and
ECM microenvironment leading to cell proliferation, apoptosis, or morphogenesis by
4
degrading the components of ECM, and have been suggested in many physiological
processes including the embryonic development, tissue resorption and remodeling, and
pathological events such as tumor invasion and arthritis (Vu & Werb, 2000, Nelson et al.,
2000, Martel-Pelletier, 1999). The extensive degradation and reconstruction of ECM are
involved in regressing or remodeling organs during the metamorphosis. In tailfins of
TH-treated tadpoles, the collagenous layers and fibrils of the basement membrane begin
to fray and separate, and the basement membrane is invaded by the mesenchymal cells,
whose cytoplasm is filled with bundles of collagen fibrils. The basement membrane in
the resorbing tail swells tenfold from a compact layer to a diffuse fragmented region
filled with the large mesenchymal cells (Usuku & Gross, 1965). The basement
membrane in the intestine suddenly folds vigorously into accordion-like pleats at NF
stage 60, and becomes thicker, irregular, and granular till NF stage 62, while collagen
fibers rapidly increase in number and density around NF stage 60 and many packed
collagen fibers are observed in the entire extracellular space throughout the
metamorphic climax (Ishizuya-Oka & Shimozawa, 1987).
The matrix metalloproteinases are a family of proteinases capable of
degrading various components of ECM. The first reported collagenase activity is
observed in skin, gut, and gills of amphibian tadpoles (Gross & Lapiere, 1962), and
implied to be involved in remodeling of the connective tissue by the degradation of both
collagen fibers and interfibrillar ground substance in concert with hyaluronidase activity
during the metamorphosis (Eisen & Gross, 1965). The TH-induced resorption of tailfins
in an organ culture is accompanied by the appearance of collagenase in medium and by

5
the concurrent loss of collagen from the tissues (Davis et al., 1975). Furthermore, the
similar result is obtained by using gills (Derby et al., 1979). These experiments support
the concept that collagenase plays an important role in the physiologic removal of
collagen in resorbing tailfins and gills, and is controlled by TH. MMP-11
(stromelysin-3), MMP-13 (collagenase-3), and fibroblast activation protein α (FAPα)
are isolated by PCR-based subtractive hybridization as ECM-degrading proteinase genes
highly expressed in the regressing tail (Wang & Brown, 1993). Thereafter, MMP-18
(collagenase-4), MMP-2, MMP-9TH, and MMP-14 (the membrane-type 1 MMP) genes
are reported to be up-regulated in the resorbing tail during the metamorphosis (Stolow et
al., 1996, Jung et al., 2002, Fujimoto et al., 2006, Hasebe et al., 2006). These proteinase
genes except for MMP-13 and FAPα are also induced in the remodeling intestine. A few
of MMP genes are known to be activated in the intestine earlier than in the tail (Patterton
et al., 1995, Fujimoto et al., 2006). It is essential and important for studying the
regulation of developmental timing of MMP gene expression in morphologically
changing organs to compare the expression pattern of each MMP gene quantitatively
during the spontaneous and TH-induced metamorphosis.
Since exogenous TH up-regulates mRNA of thyroid hormone receptor (TR) β
as much as 20-fold in a tadpole, it is hypothesized that the cascade of metamorphosis is
repressed during the premetamorphosis by TRα protein binding to thyroid hormone
response element (TRE) in TRβ genes, and that the increasing TH relieves this
repression during development and up-regulates the expression of TRβ, which, in turn,
activates the downstream genes in the cascade (Yaoita & Brown, 1990). This idea is
6
supported by a report that the highest expression of TRβ localizes to fibroblasts that
strongly up-regulate the delayed response genes such as MMP-13 and FAPα (Berry et
al., 1998b). How the up-regulation of TRβ genes leads to the activation of
ECM-degrading enzyme genes remains to be solved.
In the present study, we have carried out the extensive quantitative real time
reverse transcription-polymerase chain reaction to examine the developmental
expression profile and the TH-induced expression of each MMP gene in regressing or
remodeling organs. ECM-degrading proteinase genes including both early and delayed
response genes are induced simultaneously and prominently just before the
transformation of a organ during the spontaneous metamorphosis, and activated in the
intestine, tail and gills during the TH-induced metamorphosis and in TH-treated cultured
cell line. All examined MMP and FAPα genes have TRE, to which the heterodimer of
TR and 9-cis-retinoic acid receptor (RXR) binds in vitro. These data suggest that the
expression of MMP genes is activated directly in response to TH through TRE to low
levels, and then up-regulated strongly by TH-induced transcriptional factors including
TRβ protein.

7
Materials and Methods
Animals and thyroid hormone treatment
Xenopus laevis tadpoles were staged according to Nieuwkoop and Faber (1956). The
intestine, tail, and gills were dissected from tadpoles of NF stage 57 to 63 to analyze the
developmental expression profiles. For the TH-induced expression analysis, tadpoles
were immersed from NF stage 51-52 in 1 mM methimazole (SIGMA, St Louis, MO,
USA) for more than two weeks to block the synthesis of endogenous TH, and were
treated with 100 nM 3,3’,5-triiodo-L-thyronine (T3) (SIGMA) for 6, 12 and 24 h, or
with 5 nM T3 for 4 and 7 days in the presence of 1 mM methimazole. All operations
were performed after animals were anesthetized with 0.02% MS-222 (SIGMA).
Xenopus tropicalis tadpoles (Nigerian line) were the generous gifts of the National
Bioresource Project (Institute for Amphibian Biology, Hiroshima University). The
intestine, tail, and gills of tadpoles were isolated and immediately stored in RNAlater
(Qiagen, Mississauga, Ontario, Canada) for analysis of gene expression.
Cell Culture
XLT-15 cells were maintained as described previously (Yaoita & Nakajima,
1997). The cultured cells were treated with 10 nM T3 for 0, 2, 4, 8, 16, and 24 h. After
the TH-treatment, total RNA was prepared from these cells.
Real time reverse transcription-polymerase chain reaction
The quantitative real-time reverse transcription-polymerase chain reaction
(RT-PCR) was performed by using a LightCycler (Roche Molecular Biochemicals,
Mannheim, Germany) as described previously (Fujimoto et al., 2006). DNase-treated

8
RNAs extracted from tadpole organs and cultured cells were used to prepare
random-primed cDNAs with PowerScript (Clontech, Palo Alto, CA, USA) according to
the manufacturer’s protocols. Real-time PCR reactions were carried out using SYBR
Premix ExTaq (TaKaRa, Otsu, Japan). The levels of specific mRNA were quantified
and normalized to the levels of X. laevis elongation factor 1-α (EF) (Krieg et al., 1989),
because its expression levels are unchanged during the spontaneous metamorphosis and
in TH-treated XLT-15 cultured cells (Fujimoto et al., 2006). Triplicate data obtained for
each point were averaged. The primer sequences for the amplifications are described in
Table 1.
PCR cloning of the 5’-ends of MMP and FAPα mRNAs
The transcription start site was determined by 5’-rapid amplification of cDNA
ends (5’-RACE) (Frohman et al., 1988). Reverse transcription was performed using 2.6
μg of total RNA from NF stage 63 X. tropicalis tadpole tails and PowerScript with the
following primers: 5’-GCATCCTTAAGAACCATCA-3’ for MMP-2,
5'-CATCGAAGGGGTAAGGATC-3' for MMP-9TH,
5’-TCTTGTCCCAGCGTCCTC-3’ for MMP-11, 5’-CTCCTTCAGCTTGGTCTC-3’
for MMP-13, and 5’-CTGAATATTTGGTGGAAGCTC-3’ for FAPα. The 5’ fragments
of each cDNA were obtained using an anchor primer
5’-GTCGACATCGATCTCGAG(T)18-3’ and amplification primers as follows:
5’-GACATTTATCCTTAGGGCAG-3’ for MMP-2,
5'-GGAATAGTTCAGGATACGA-3' for MMP-9TH,
5’-TGACGATTTCGCCCGCTG-3’ for MMP-11,

9
5’-CCGGAATTCTGTAGGTCTCCTGGTGTC-3’ for MMP-13, and
5’-GCTGTGTAAGAGTATCTCC-3’ for FAPα. PCR products were cloned using the
pGEM-T easy Vector Systems (Promega, Madison, WI, USA). Individual clones were
isolated and sequenced using Thermo Sequenase Cycle Sequencing kit (Amersham,
Buckinghamshire, UK).
Gel mobility shift assay
The gel mobility shift assay was performed as described previously (Fujimoto
et al., 2006). Briefly, Xenopus TRα and RXRα proteins were synthesized in vitro using
the TNT kit (Promega). The sequences for the TRE binding experiments of one strand of
nucleotides are follows: 5’-CCTAGGCAGGTCATTTCAGGACAGCCCAGC-3’ for
Xenopus TRβ DR4 TRE, 5’-CCTAGGCAGGTCATTTCAAAACAGCCCAGC-3’ for
Xenopus TRβ mDR4 TRE (the nucleotides changed from wild type are underlined),
5’-TGTTTCCTGTCCTACTCTGCCCTGCCTGTG-3’ for XtMMP-2 TRE1,
5’-ACTGTACTGTCCAAGTCTGACCCGCACGAA-3’ for XtMMP-2 TRE2,
5’-TGTCTTCTGCCCTACTCTACCCTGCCTGTG-3’ for XtMMP-2 TRE3,
5’-GAATCATTTACCTCCTGTAACCCTGAGGAG-3’ for XtMMP-9TH TRE1,
5’-GAGTGTGTGTCCTTATCTGACCTCCAGTCA-3’ for XtMMP-9TH TRE2,
5’-ACTATCCTGTCCTTAGTTTACCTGCTATCC-3’ for XtMMP-9TH TRE3,
5’-AATTGTGTGACCTTACCAGACCTGCCATCA-3’ for XtMMP-11TRE1,
5’-AGCCTGAAGGTCAGTTAAGGTGAGATTGGA-3’ for XtMMP-11TRE2,
5’-CCATGGATGATCTTATTTGCCCTATTAATA-3’ for XtMMP-13 TRE1,
5’-CACATACAGACCCATACTGACCTATCTATC-3’ for XtMMP-13 TRE2,

10
5’-CACATACAGACCCACACTGACCTATCTATC-3’ for XtMMP-13 TRE3,
5’-CACATACAGACCCAGACTGACCTATCTATC-3’ for XtMMP-13 TRE4,
5’-CTTACCATGCCCTCCTGTGACCCCATTTAG-3’ for XtMMP-14 TRE1,
5’-CCTATAATGACTTGTAATGATCCCAACTGG-3’ for XtMMP-18 TRE1, and
5’-CTCTTCCATGTCAAAGCAGGTCATGGGGGG-3’ for XtFAPα TRE1. Bold
letters indicate the TRE half-sites. Oligonucleotides were annealed by heating at 95°C
for 5 min and then cooling to the room temperature before use as probes. The probes
were labeled using T4 polynucleotide kinase and [γ-32P]ATP (Amersham).
11
Results
Developmental expression of MMP mRNAs in the intestine, tail, and gills during the
spontaneous metamorphosis
To compare the developmental expression profiles of MMP, FAPα and TRβ
genes, quantitative RT-PCR was performed using total RNA prepared from the intestine,
tail, and gills of X. laevis tadpoles from NF stage 57 to 63 during the spontaneous
metamorphosis (Fig. 1). Gills were only analyzed from NF stage 57 to 61 due to the
limited amount of tissue available. These three organs were chosen because they
represent the tissue remodeling and resorption (Dodd & Dodd, 1976).
In the intestine, MMP-9TH, MMP-11, and MMP-14 mRNAs were expressed
at low levels at NF stage 57, increased slightly at NF stage 58, showed the prominent
rise at NF stage 60, and peaked at NF stage 61 (Fig. 1A) following the increase of
endogenous TH (Leloup & Buscaglia, 1977). Thereafter, these expressions were
decreased. These expression patterns resemble that of TRβ gene, although TRβ gene
expression was much lower than mRNAs of the MMP genes (Fig. 1A). MMP-13 and
FAPα were also up-regulated at NF stage 58 and had a very small peak at NF stage
60-61 (Fig. 1A). The developmental expression of these genes is roughly in parallel
with the changes of T3 concentrations in plasma (Leloup & Buscaglia, 1977). In
contrast, MMP-2 gene increased to the maximum at NF stage 62 when adult epithelial
cells proliferate. The expression of MMP-18 was very low and reached a very small
peak at NF stage 62, consistent with the Northern blot analysis (Stolow et al., 1996).
The distinct expression patterns of MMP genes suggest that different ECM-degrading
12
proteinases play different roles in intestinal remodeling.
In the tail, MMP-9TH and MMP-14 genes were barely increased before NF
stage 61, very strongly up-regulated at NF stage 62 when the tail starts rapid shortening
(Nieuwkoop & Faber, 1956), and continued to increase till NF stage 63 (Fig. 1B). The
expression levels were much higher than those in the intestine. Expression levels of
MMP-9TH and MMP-14 mRNAs exceeded that of the elongation factor 1-α in copy
number at NF stage 63. The expression of MMP-13, FAPα, and MMP-2 genes started to
increase at NF stage 58, and was promoted abruptly at NF stage 62 concomitantly with
MMP-9TH, MMP-11, and MMP-14 genes. TRβ mRNA was also up-regulated similarly
to MMP-9TH and MMP-14 genes.
The up-regulation of MMP and FAPα genes was barely detectable from the
beginning of the climax (NF stage 58) in gills. The drastic and coincident up-regulation
was observed at NF stage 60-61 when the degradation of the branchial arches begins
(Fig. 1C). The up-regulation of MMP-9TH, MMP-14 and MMP-13 genes was
conspicuous at NF stage 61. TRβ expression was gradually increased from NF stage 58
to NF stage 61.
Expression of MMP mRNAs in the intestine, tail, and gills during the TH-induced
metamorphosis
Since significant changes in the abundance of expressed transcripts for MMP
and FAPα genes were shown in three organs of tadpoles undergoing the spontaneous
metamorphosis, we examined the kinetics of MMP mRNA up-regulation during the
TH-induced metamorphosis. The premetamorphic tadpoles are functionally athyroid but
13
competent to respond to exogenous TH (Dodd & Dodd, 1976). The addition of T3
results in the activation of the Xenopus TRβ gene (Yaoita & Brown, 1990). To
investigate the expression of MMP and FAPα genes during the T3-induced
metamorphosis, we treated the premetamorphic tadpoles immersed in 1 mM
methimazole with 100 nM T3 for 0-24 h or with 5 nM T3 for 0-7 days. Total RNA was
isolated from the intestine, tail and gills and analyzed by quantitative RT-PCR.
Addition of T3 caused the significant increase in TRβ mRNA levels in three
organs (Fig. 2A-C). TRβ expression was up-regulated by 6 h, and increasing slowly to
higher levels after 12-24 h of treatment, consistent with our previous report (Yaoita &
Brown, 1990). In contrast to TRβ, the significant induction of MMP-9TH, MMP-11,
MMP-13, MMP-14, and FAPα mRNAs was observed after 12-24 h of treatment (Fig.
2A-C). The expression of MMP-14, MMP-9TH, and MMP-11 genes increased
obviously in the intestine, while MMP-14, MMP-13 and FAPα genes were up-regulated
in the tail and gills. These five genes were activated to low levels 6 h after T3 treatment.
The expression of MMP-2 and MMP-18 genes increased a little within 24 h, and was
up-regulated more in the tail after the extended T3 treatment (Fig. 2D). Most of MMP
and FAPα genes reproduced developmental gene expression profiles in three organs.
The detailed analysis indicates that mRNA copy numbers of TH-responsive genes in
three organs of 24 h-treated tadpoles are comparable to those seen at NF stage 59-60
during the spontaneous metamorphosis (Fig. 1,2 and data not shown).
To confirm the T3–induction of MMP and FAPα mRNAs in a myoblastic cell
line derived from a tadpole tail, quantitative RT-PCR was performed using RNAs

14
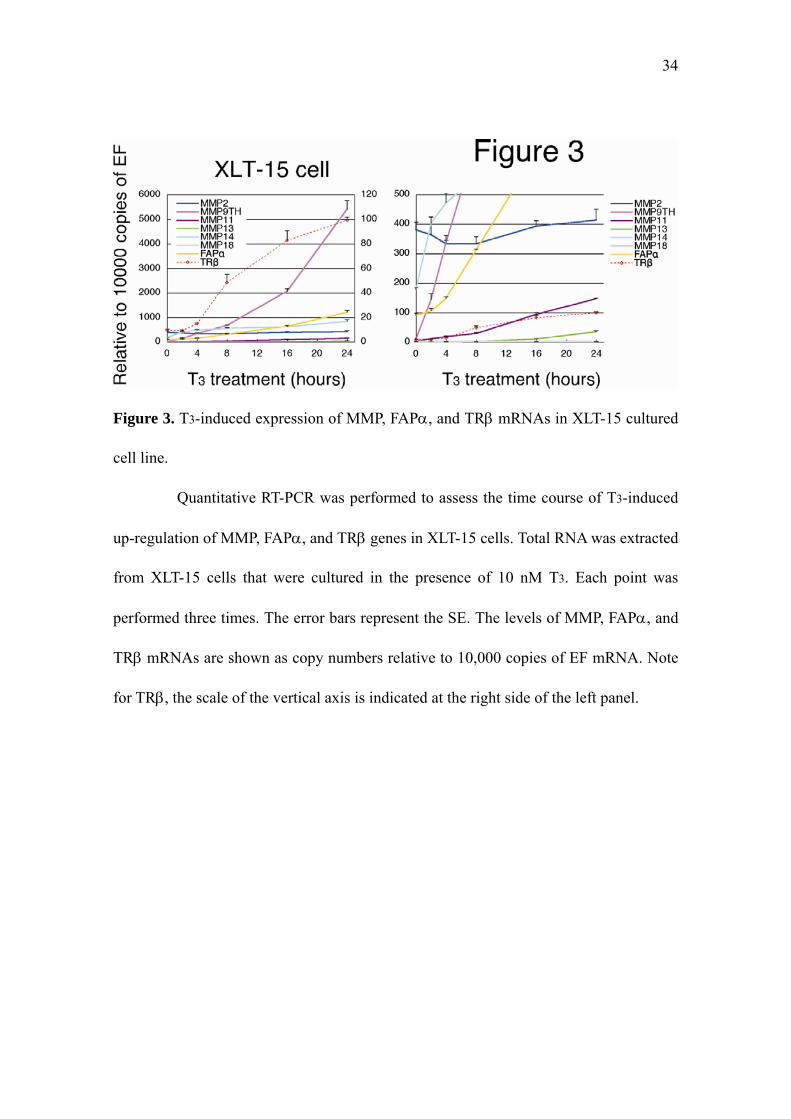
extracted from XLT-15 cells stimulated with 10 nM T3 (Fig. 3). TRβ mRNA started to
increase 8 h after T3 treatment of XLT-15 cells and then slowly (Fig. 3), consistent with
the up-regulation by 8 h in T3-treated XL-177 cells derived from embryonic epithelial
cells (Kanamori & Brown, 1992). The elevation in MMP-9TH mRNA began soon after
TH treatment, and the great parts of the up-regulation were observed in 16-24 h in
agreement with our results (Fujimoto et al., 2006). The expression of MMP-14 and
MMP-11 genes was also activated just after TH stimulation. MMP-13 and FAPα
mRNAs increased by 4-8 h, but their prominent up-regulation was observed after 2-4
days of exposure to 10 nM T3 (data not shown). The expression of MMP-2 and
MMP-18 was changed little by T3 treatment.
Identification of TREs in MMP and FAPα Genes
It has been shown that MMP-9TH and MMP-11 genes of X. laevis were direct
TH- response genes, i.e., activated at the transcriptional level through the nuclear
receptors of TH (Fujimoto et al., 2006, Fu et al., 2006), whereas MMP-2, MMP-13,
MMP-14, MMP-18, and FAPα genes are suggested to be late indirect T3 response genes
(Wang & Brown, 1993, Stolow et al., 1996, Hasebe et al., 2006). Since MMP-13 and
FAPα genes were up-regulated like MMP-9TH and MMP-11 genes in the tail and gills
of T3-treated tadpoles, we investigated whether there are any thyroid hormone response
elements (TREs) in the promoters of MMP and FAPα genes.
To determine the transcription start site of X. tropicalis MMP and FAPα genes,
5’-RACE was carried out using total RNA prepared from NF stage 63 tadpole tails of X.
tropicalis. Several MMP-9TH and MMP-13 cDNA clones were obtained that showed

15
clearly the position of the transcription start site and that had only a few nucleotide
changes compared with their respective genomic sequences. These changes were likely
derived from sequence polymorphisms or PCR errors by Taq polymerase. A consensus
TATA box was found 23-25 bp upstream of the start sites of both genes. In contrast, the
sequence analysis of MMP-2, MMP-11, and FAPα clones suggested the existence of
more than one start site. No TATA box was present upstream of the 5’-ends of MMP-2
and FAPα clones, implying that these genes have a TATA-less promoter. Although a
putative TATA box was found in MMP-11 promoter, it might not be effective as
previously shown in X. laevis (Li et al., 1998). The full-length cDNAs of MMP-14 and
MMP-18 were found in the X. tropicalis database.
The genomic structures of X. tropicalis MMP and FAPα genes were
determined by analyzing the X. tropicalis genome database (DOE Joint Genome
Institute). We searched for putative TREs in MMP and FAPα genes by using the NHR
Scan (Sandelin & Wasserman, 2005). In MMP-9TH and MMP-11 genes, the relative
positions of putative TREs are conserved between X. laevis and X. tropicalis, which
might indicate a functional role of these elements.
To assess whether TR/RXR heterodimer can bind to the putative TREs found
in MMP and FAPα genes, the gel shift assay was performed on elements in their natural
context (16 bp core with 7 bp of flanking sequences) using in vitro synthesized TR and
RXR. The high-affinity TRE are described as a perfect direct repeat of AGGTCA
separated by 4 bp (DR4) (Umesono et al., 1991). The binding of TR/RXR complexes to
a labeled MMP TRE was competed with the oligonucleotide containing the wild type or
16
mutated version of TRE derived from the TRβ promoter (Ranjan et al., 1994) (Table 2,
Fig. 4). Figure 5 shows the positions of putative TREs lying between -10 kb and +10 kb
of the transcriptional start site of each gene. All of the end-labeled TREs failed to form
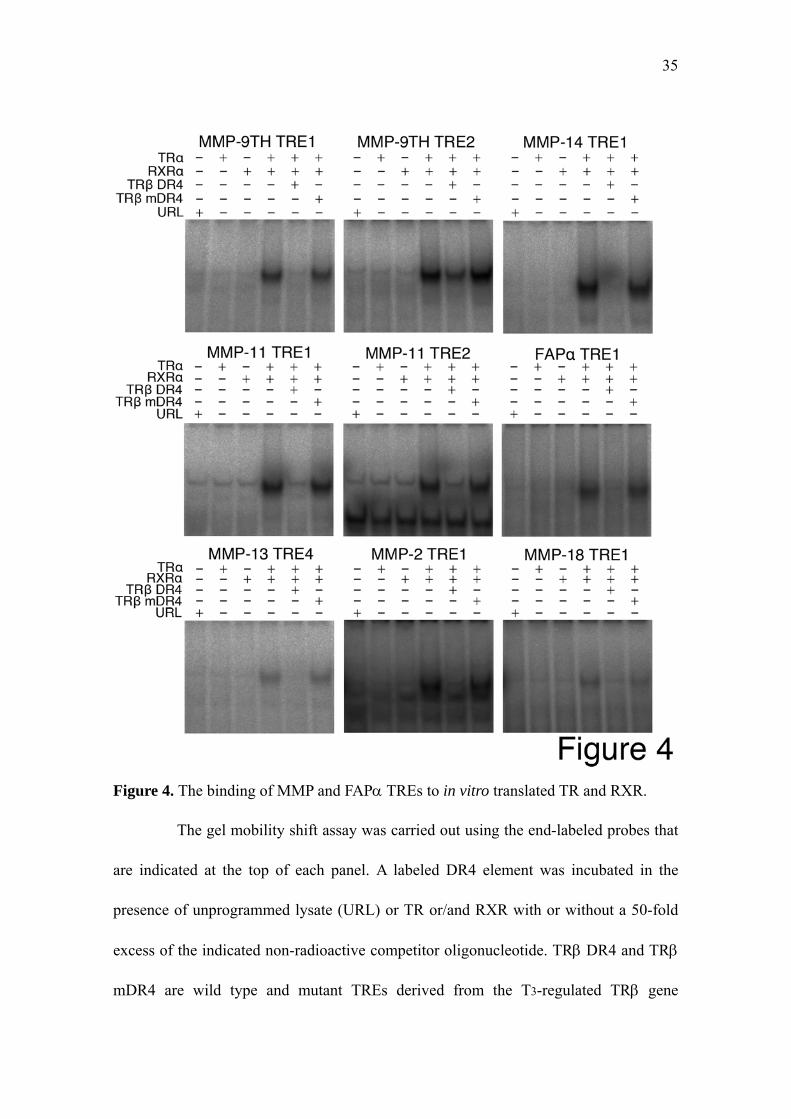
any specific complexes with the TR or RXR alone. The gel mobility shift assay revealed
that TR/RXR heterodimer binds to the DR4 of MMP-9TH, MMP-11, and MMP-14
strongly, whereas MMP-2 and MMP-18 TREs form a complex weakly (Table 2, Fig.
4,5). MMP-13 and FAPα TREs showed the moderate affinity to TR/RXR heterodimer.
No significant binding was detected with the DR4 of MMP-2 TRE2, MMP-2 TRE3,
MMP-13 TRE1, and MMP-13 TRE2 (Table 2). MMP-9TH and MMP-11 TREs are a
close match to the DR4 of optimal TRE, while MMP-18 TRE1 is more divergent (Table
2). These bindings were competed by 50-fold excess of cold TRβ DR4, but not by the
same amount of mutated version of TRβ DR4. Since the G residues at the second and
third positions of the second half-site are absolutely required for binding (Kurokawa et
al., 1993), our results suggest that TREs capable of binding to TR/RXR heterodimer in
vitro are functional in the transcriptional regulation of MMP genes.
17
Discussion
Cells die in the regressing organs by two mechanisms, suicide and murder
(Nakajima et al., 2005). A myoblastic cell line, XLT-15, derived from a tadpole tail
responds to TH by apoptosis (Yaoita & Nakajima, 1997), indicating that tail muscle cells
die cell-autonomously (a suicide model). The up-regulation of MMP-11 and MMP-13 in
the myotendinous junctions of a regressing tail implies that the TH-induced secretion of
MMP results in the degradation of the myotendinous junctions, which detaches muscle
cells from ECM and causes their death (a murder model) (Berry et al., 1998b). We
showed previously that TH induces the suicide of muscle cells at the beginning of the
climax, and then both the murder and suicide in a regressing tail to execute the death of
all muscle cells (Nakajima & Yaoita, 2003). Since ECM-degrading proteinases are
believed to play an important role in murder mechanism by regulating cell-cell
interactions, we have examined the developmental expression profiles of MMP genes
and their induction in the TH-treated tadpoles and cultured cells in order to understand
the molecular mechanism of the TH-induced MMP gene expression. The gel mobility
shift assay was also carried out to address whether the heterodimer of TR and RXR can
bind to the putative TREs that are speculated by the sequence analogy in the X.
tropicalis MMP genes.
The regulation of MMP gene expression during the climax of metamorphosis
Several reports show that MMP gene expression is induced in morphologically
changing organs during the climax of metamorphosis, as mentioned above. The in situ
hybridization analysis shows that FAPα, MMP-11, MMP-13, MMP-14, and MMP-2
18
genes are expressed in connective tissue, subepidermal fibroblast, notochord sheath,
notochord, myoseptum, and spinal cord of a regressing tail (NF stage 62-63), and that
MMP-11, MMP-13, MMP-14, and MMP-2 mRNAs are located in connective tissue of
the remodeling intestine, although there are some differences in signal intensities
(Ishizuya-Oka et al., 1996, Berry et al., 1998b, Damjanovski et al., 1999, Jung et al.,
2002, Hasebe et al., 2006). A comprehensive expression study using the common
materials is essential to understand the profiles of all TH-induced MMP genes and to
know the molecular mechanism of their expression. We have showed that the expression
of MMP genes is induced abruptly and concurrently in the different organs at the
different stages when the morphological changes take place during the climax of
metamorphosis.
In the intestine, MMP-14, MMP-11, and MMP-9TH gene expression starts
prominently at NF stage 60, and rises in parallel with the endogenous T3 concentration,
which has a peak around NF stage 61. The expression of FAPα and MMP-13 genes also
peak at the similar stage, although their maximal expression is quite low compared with
MMP-14, MMP-11, and MMP-9TH genes. The expression profiles of these five genes
might reflect the T3 concentration in plasma as TH-responsive genes. Because the
intestine expresses a low level of type III deiodinase known to inactivate active TH (T3)
till NF stage 61 (data not shown), which makes this organ sensitive to TH (Becker et al.,
1997). On the other hand, the expression of MMP-2 gene is maximal at NF stage 62.
This expression might be due to the secondary response to the apoptotic degeneration of
the larval epithelial cells and the proliferation of the adult epithelial cells.

19
ECM-degrading proteinase genes including FAPα are induced dramatically
and simultaneously at NF stage 62 and continue to increase in a regressing tail. The
induction of MMP gene expression in the tail is clearly delayed compared with the
intestine. This time lag might be caused by a high-level expression of type III deiodinase
from NF stage 59 to 61 in the tail (Wang & Brown, 1993), since type III deiodinase
regulates elaborately the cell proliferation and innervation during the development of
retina by inactivating T3 (Marsh-Armstrong et al., 1999), and can inhibit the anuran
metamorphosis, when this gene is overexpressed in a transgenic tadpole (Huang et al.,
1999). However, why type III deiodinase, one of direct TH-response genes, is
down-regulated at NF stage 62 when a level of T3 is still high in plasma remains to be
elucidated (Kawahara et al., 1999).
The concomitant and conspicuous induction of MMP genes begins at NF stage
60-61 in gills, which indicates MMP gene expression is repressed at NF stage 58 to 59
when T3 is increasing. Gills might not be sensitive enough to respond to a low level of
T3 by the unknown reasons, compared with the intestine.
MMP-9TH and MMP-14 among the examined genes are prominently
co-expressed in the remodeling intestine and the regressing tail and gills, suggesting that
they play an important role as main effectors in transforming organs. MMP-9TH has a
strong gelatinolytic activity (Fujimoto et al., 2006), and degrade native type IV collagen
(Wilhelm et al., 1989) that is the major structural component in the basement membrane.
MMP-11 and MMP-13 are also strongly induced in remodeling intestine and regressing
organs (a tail and gills), respectively. MMP-11 and the membrane type MMP such as
20
MMP-14 are activated by a furin-dependent cleavage intracellularly (Pei & Weiss, 1995,
Vu & Werb, 2000), but the other MMP proteins are secreted as inactive proenzymes and
their activation requires the removal of propeptide by cleavage, which imply that
MMP-14 and MMP-11 can contribute to the morphological changes as initiator
proteinases. MMP-14 can activate MMP-2 and MMP-13 on the cell surface (Itoh &
Seiki, 2006). It is suggested that MMP-14 participates in an activation cascade involving
MMP-13, MMP-2, and MMP-9 (Cowell et al., 1998). It is possible that the
intracellularly activated MMP-14 increases in transforming organs, and processes the
other TH-induced MMP proenzymes proteolytically into their biologically active forms
to degrade ECM, and that activated MMP-9TH digests the basement membrane, which
underlies all epithelial cell sheets in the intestine and gills and surrounds individual
muscle cells and notochord in the tail.
A function-blocking antibody against MMP-11 inhibits TH-induced apoptosis
of the larval epithelium, thickening of the basement membrane, and the invasion of the
adult epithelial primordia into the connective tissue in an organ culture of the intestine
(Ishizuya-Oka et al., 2000). The precocious expression of MMP-11 in the intestine leads
to ECM degradation and larval epithelial cell death in transgenic tadpoles expressing
MMP-11 under control of a heat shock-inducible promoter (Fu et al., 2005). Moreover,
MMP-11 is one of the early-induced genes in the intestine during the climax. It is
possible that the TH-induction of the intracellularly activated MMP-11 triggers the ECM
remodeling in the intestine, although there are no reports about MMP activation by
MMP-11 to our knowledge.
21
The two steps of MMP gene induction by TH
When methimazole-treated tadpoles (NF stage 54) are stimulated by 100 nM
T3, TRβ gene expression is up-regulated within 6 h in three organs and slowly increased
at 16-24 h. On the other hand, small amounts of MMP-9TH, MMP-11, MMP-13,
MMP-14, and FAPα mRNAs are induced just after T3 treatment, and their great parts of
TH-induction are observed after 12 h of treatment. In T3-treated cultured cells,
TRβ mRNA expression starts within 8 h, and is saturated around a day of treatment,
while the up-regulation of MMP-9TH, MMP-11, MMP-13, MMP-14, and FAPα genes
are accelerated after 16-24 h of exposure to 10 nM T3. Especially MMP-9TH mRNA is
up-regulated more than 15 times within 2 h. In all cases, the expression of MMP genes
are induced to very low levels just after T3 treatment, and increase prominently 12 h
later, whereas TRβ gene is activated in several hours, and up-regulated slowly after 16 h
of treatment. The time course of TRβ gene expression resembles that of the directly
TH-induced transcriptional factor, that is, the zinc finger transcription factor xBTEB1
(Furlow & Brown, 1999).
We and the other group reported the presence of the functional TREs in the
promoters of X. laevis MMP-9TH and MMP-11 genes, respectively (Fujimoto et al.,
2006, Fu et al., 2006). Our gel mobility shift assay has revealed that all TH-induced
ECM-degrading proteinase genes have TREs in X. tropicalis. The strongly and early
induced genes such as MMP-14, MMP-11, and MMP-9TH have higher affinity TREs,
while the weakly and late induced genes like MMP-2 and MMP-18 contain a lower
affinity TRE (Furlow & Kanamori, 2002). Moderate affinity TREs are located in the
22
promoters of MMP-13 and FAPα genes that are expressed at higher levels in the
regressing tail and gills, and induced reasonably in the tail and gills of TH-treated
tadpoles.
We searched for the putative TREs in 10 Mb of scaffold 1 and 2 from X.
tropicalis genome database using the NHR Scan, and found total 1053, of which 593,
417, 42, and 1 TREs share 9, 10, 11, and 12 of 12 nucleotides with an optimized TRE
sequence (AGGTCAnnnnAGGTCA), respectively. 50% of TREs (9/12), 71% of TREs
(10/12), and all TREs (11/12) showed a specific complex in the presence of TR/RXR in
our gel mobility shift assay. The expected numbers of TREs that can bind to TR/RXR
might be 0.19 and 1.27 in 3 kb and 20 kb genomic sequence, respectively. TREs are
located between -0.8 kb and +1.5 kb of the transcription start site in MMP-9TH,
MMP-11, MMP-14 and FAPα genes. MMP-13 gene has TREs 9 kb downstream of the
transcription start site, although they are 4 copies of TREs (+) and one copy of TRE (++).
MMP-2 and MMP-18 genes contain one TRE (+) 5.9 kb downstream and 9.4 kb
upstream, respectively, and it is suspected that they have TRE incidentally due to a
probability, but not inevitably. However, TRE in xBTEB1 gene lies 6.5 kb upstream of
the transcription start site, and is demonstrated to be functional in the gel mobility shift
assay and transient transfection assay (Furlow & Kanamori, 2002). This position of TRE
is also conserved in X. tropicalis BTEB1 gene. It is necessary to compare the promoter
sequences between X. tropicalis and X. laevis and to confirm whether these TREs are
functional or not by the chromatin immunoprecipitation assay. We have shown that
MMP-13, FAPα, and MMP-2 mRNAs increase in the tail at NF stage 58-61, whereas

23
MMP-9TH and MMP-11genes are suppressed. Since MMP-13, FAPα, and MMP-2
genes have no high affinity TREs, they are weakly repressed by TR and activated easily
by some developmentally up-regulated transcriptional factors, while MMP-9TH and
MMP-11 genes with high affinity TREs are depressed by unliganded TR in reduced
levels of T3 by type III deiodinase. The micro array analysis for 21654 genes of X. laevis
reveals that approximately 30% of examined genes are up- or down-regulated by TH
(Das et al., 2006), raising a possibility that most of them are controlled more or less
directly through TREs.
These results lead us to propose the two steps of MMP gene induction by TH.
As a level of T3 is rising, T3 is forming a complex with TRα/RXR already bound to TRE
in the promoters of TRβ, other TH-induced transcriptional factor, and MMP genes, and
directly induces their expression to low levels. TH-induced transcriptional factors
including TRβ protein accumulate and cause the second strong activation of MMP genes.
A high affinity TRE can form a stable complex with TR/RXR heterodimer, and directs
an early response, whereas a lower affinity TRE such as those of MMP-13 and FAPα
genes cannot bind firmly and delays a TH-response. A very low affinity TRE (+) in
MMP-2 and MMP-18 genes only give a marginal effect of TH to their promoter, and
their expression is dependent mainly on the gradually-induced transcriptional factors by
TH.
The up-regulation of TRβ mRNA in the tail and head results in the increase of
TR proteins (Eliceiri & Brown, 1994), which should promote the binding of TR to TRE
in MMP genes and activate their transcription in the presence of TH. Some TH-induced

24
transcriptional factors might be coactivators of TR, since steroid receptor coactivator 3
(SRC3) mRNA and protein increase in both the tail and intestine during the natural as
well as TH-induced metamorphosis, and this protein is recruited to target genes by TR
(Paul et al., 2005). The induced SRC3 is expected to activate MMP genes strongly
through binding to TR on their TRE in concert with TH-induced TRβ.
However, some factors do not appear to be coactivators. It is because TRβ
mRNA increases gradually and linearly in gills from NF stage 58, whereas MMP genes
show the drastic induction at NF stage 60. The expression of more than 360
transcriptional factor genes are known to be regulated by TH (Das et al., 2006),
suggesting a possibility that some of them contribute to the synchronous and abrupt
induction of MMP genes in the different organs at the different stages.

25
References
Becker, K. B., Stephens, K. C., Davey, J. C., Schneider, M. J. & Galton, V. A. 1997. The
type 2 and type 3 iodothyronine deiodinases play important roles in coordinating
development in Rana catesbeiana tadpoles. Endocrinology, 138, 2989-2997.
Berry, D. L., Rose, C. S., Remo, B. F. & Brown, D. D. 1998a. The expression pattern of
thyroid hormone response genes in remodeling tadpole tissues defines distinct
growth and resorption gene expression programs. Dev. Biol., 203, 24-35.
Berry, D. L., Schwartzman, R. A. & Brown, D. D. 1998b. The expression pattern of
thyroid hormone response genes in the tadpole tail identifies multiple resorption
programs. Dev. Biol., 203, 12-23.
Bonneville, M. A. 1963. Fine Structural Changes in the Intestinal Epithelium of the
Bullfrog During Metamorphosis. J. Cell Biol., 18, 579-597.
Cowell, S., Knauper, V., Stewart, M. L. et al. 1998. Induction of matrix
metalloproteinase activation cascades based on membrane-type 1 matrix
metalloproteinase: associated activation of gelatinase A, gelatinase B and
collagenase 3. Biochem. J., 331 ( Pt 2), 453-458.
Damjanovski, S., Ishizuya-Oka, A. & Shi, Y. B. 1999. Spatial and temporal regulation
of collagenases-3, -4, and stromelysin -3 implicates distinct functions in
apoptosis and tissue remodeling during frog metamorphosis. Cell Res., 9,
91-105.
Das, B., Cai, L., Carter, M. G. et al. 2006. Gene expression changes at metamorphosis
induced by thyroid hormone in Xenopus laevis tadpoles. Dev. Biol., 291,
342-355.
Davis, B. P., Jeffrey, J. J., Eisen, A. Z. & Derby, A. 1975. The induction of collagenase
by thyroxine in resorbing tadpole tailfin in vitro. Dev. Biol., 44, 217-222.
Derby, A., Jeffrey, J. J. & Eisen, A. Z. 1979. The induction of collagenase and acid
phosphatase by thyroxine in resorbing tadpole gills in vitro. J. Exp. Zool., 207,
391-398.
Dodd, M. H. I. & Dodd, J. M. 1976. THE BIOLOGY OF METAMORPHOSIS. In
Physiology of the Amphibia,Vol. III (Ed. Lofts, B.), pp. 467-599. Academic
Press, New York.
Eisen, A. Z. & Gross, J. 1965. The role of epithelium and mesenchyme in the
26
production of a collagenolytic enzyme and a hyaluronidase in the anuran tadpole.
Dev. Biol., 12, 408-418.
Eliceiri, B. P. & Brown, D. D. 1994. Quantitation of endogenous thyroid hormone
receptors alpha and beta during embryogenesis and metamorphosis in Xenopus
laevis. J. Biol. Chem., 269, 24459-24465.
Frohman, M. A., Dush, M. K. & Martin, G. R. 1988. Rapid production of full-length
cDNAs from rare transcripts: amplification using a single gene-specific
oligonucleotide primer. Proc. Natl Acad. Sci. USA, 85, 8998-9002.
Fu, L., Ishizuya-Oka, A., Buchholz, D. R., Amano, T., Matsuda, H. & Shi, Y. B. 2005. A
causative role of stromelysin-3 in extracellular matrix remodeling and epithelial
apoptosis during intestinal metamorphosis in Xenopus laevis. J. Biol. Chem.,
280, 27856-27865.
Fu, L., Tomita, A., Wang, H., Buchholz, D. R. & Shi, Y. B. 2006. Transcriptional
regulation of the Xenopus laevis Stromelysin-3 gene by thyroid hormone is
mediated by a DNA element in the first intron. J. Biol. Chem., 281,
16870-16878.
Fujimoto, K., Nakajima, K. & Yaoita, Y. 2006. One of the duplicated matrix
metalloproteinase-9 genes is expressed in regressing tail during anuran
metamorphosis. Dev. Growth Differ., 48, 223-241.
Furlow, J. D. & Brown, D. D. 1999. In vitro and in vivo analysis of the regulation of a
transcription factor gene by thyroid hormone during Xenopus laevis
metamorphosis. Mol. Endocrinol., 13, 2076-2089.
Furlow, J. D. & Kanamori, A. 2002. The transcription factor basic transcription
element-binding protein 1 is a direct thyroid hormone response gene in the frog
Xenopus laevis. Endocrinology, 143, 3295-3305.
Gross, J. & Lapiere, C. M. 1962. Collagenolytic activity in amphibian tissues: a tissue
culture assay. Proc. Natl Acad. Sci. USA, 48, 1014-1022.
Hasebe, T., Hartman, R., Matsuda, H. & Shi, Y. B. 2006. Spatial and temporal
expression profiles suggest the involvement of gelatinase A and membrane type
1 matrix metalloproteinase in amphibian metamorphosis. Cell Tissue Res., 324,
105-116.
Huang, H., Marsh-Armstrong, N. & Brown, D. D. 1999. Metamorphosis is inhibited in
transgenic Xenopus laevis tadpoles that overexpress type III deiodinase. Proc.
27
Natl Acad. Sci. USA, 96, 962-967.
Ishizuya-Oka, A., Li, Q., Amano, T., Damjanovski, S., Ueda, S. & Shi, Y. B. 2000.
Requirement for matrix metalloproteinase stromelysin-3 in cell migration and
apoptosis during tissue remodeling in Xenopus laevis. J. Cell Biol., 150,
1177-1188.
Ishizuya-Oka, A. & Shimozawa, A. 1987. Ultrastructural changes in the intestinal
connective tissue of Xenopus laevis during metamorphosis. J. Morphol., 193,
13-22.
Ishizuya-Oka, A., Ueda, S. & Shi, Y. B. 1996. Transient expression of stromelysin-3
mRNA in the amphibian small intestine during metamorphosis. Cell Tissue Res.,
283, 325-329.
Itoh, Y. & Seiki, M. 2006. MT1-MMP: a potent modifier of pericellular
microenvironment. J. Cell. Physiol., 206, 1-8.
Jung, J. C., Leco, K. J., Edwards, D. R. & Fini, M. E. 2002. Matrix metalloproteinases
mediate the dismantling of mesenchymal structures in the tadpole tail during
thyroid hormone-induced tail resorption. Dev. Dyn., 223, 402-413.
Kanamori, A. & Brown, D. D. 1992. The regulation of thyroid hormone receptor beta
genes by thyroid hormone in Xenopus laevis. J. Biol. Chem., 267, 739-745.
Kawahara, A., Gohda, Y. & Hikosaka, A. 1999. Role of type III iodothyronine
5-deiodinase gene expression in temporal regulation of Xenopus metamorphosis.
Dev. Growth Differ., 41, 365-373.
Krieg, P. A., Varnum, S. M., Wormington, W. M. & Melton, D. A. 1989. The mRNA
encoding elongation factor 1-α (EF1-α) is a major transcript at the midblastula transition in Xenopus. Dev. Biol., 133, 93-100.
Kurokawa, R., Yu, V. C., Naar, A. et al. 1993. Differential orientations of the
DNA-binding domain and carboxy-terminal dimerization interface regulate
binding site selection by nuclear receptor heterodimers. Genes Dev., 7,
1423-1435.
Leloup, J. & Buscaglia, M. 1977. La tiiodothyronine, hormone de la metamorphose des
Amphibiens. C. R. Acad. Sc., 284, 2261-2263.
Li, J., Liang, V. C., Sedgwick, T., Wong, J. & Shi, Y. B. 1998. Unique organization and
involvement of GAGA factors in transcriptional regulation of the Xenopus
stromelysin-3 gene. Nucleic Acids Res, 26, 3018-3025.
28
Marsh-Armstrong, N., Huang, H., Remo, B. F., Liu, T. T. & Brown, D. D. 1999.
Asymmetric growth and development of the Xenopus laevis retina during
metamorphosis is controlled by type III deiodinase. Neuron, 24, 871-878.
Marshall, J. A. & Dixon, K. E. 1978. Cell specialization in the epithelium of the small
intestine of feeding Xenopus laevis tadpoles. J. Anat., 126, 133-144.
Martel-Pelletier, J. 1999. Pathophysiology of osteoarthritis. Osteoarthritis Cartilage, 7,
371-373.
Minnich, B., Bartel, H. & Lametschwandtner, A. 2002. How a highly complex
three-dimensional network of blood vessels regresses: the gill blood vascular
system of tadpoles of Xenopus during metamorphosis. A SEM study on
microvascular corrosion casts. Microvasc. Res., 64, 425-437.
Nakajima, K., Fujimoto, K. & Yaoita, Y. 2005. Programmed cell death during
amphibian metamorphosis. Semin. Cell Dev. Biol., 16, 271-280.
Nakajima, K. & Yaoita, Y. 2003. Dual mechanisms governing muscle cell death in
tadpole tail during amphibian metamorphosis. Dev. Dyn., 227, 246-255.
Nelson, A. R., Fingleton, B., Rothenberg, M. L. & Matrisian, L. M. 2000. Matrix
metalloproteinases: biologic activity and clinical implications. J. Clin. Oncol.,
18, 1135-1149.
Nieuwkoop, P. D. & Faber, J. 1956. Normal table of Xenopus laevis. North-Holland
Publishing Company, Amsterdam.
Patterton, D., Hayes, W. P. & Shi, Y. B. 1995. Transcriptional activation of the matrix
metalloproteinase gene stromelysin-3 coincides with thyroid hormone-induced
cell death during frog metamorphosis. Dev. Biol., 167, 252-262.
Paul, B. D., Buchholz, D. R., Fu, L. & Shi, Y. B. 2005. Tissue- and gene-specific
recruitment of steroid receptor coactivator-3 by thyroid hormone receptor during
development. J. Biol. Chem., 280, 27165-27172.
Pei, D. & Weiss, S. J. 1995. Furin-dependent intracellular activation of the human
stromelysin-3 zymogen. Nature, 375, 244-247.
Ranjan, M., Wong, J. & Shi, Y. B. 1994. Transcriptional repression of Xenopus TR beta
gene is mediated by a thyroid hormone response element located near the start
site. J. Biol. Chem., 269, 24699-24705.
Sandelin, A. & Wasserman, W. W. 2005. Prediction of nuclear hormone receptor
response elements. Mol. Endocrinol., 19, 595-606.

29
Stolow, M. A., Bauzon, D. D., Li, J. et al. 1996. Identification and characterization of a
novel collagenase in Xenopus laevis: possible roles during frog development.
Mol. Biol. Cell, 7, 1471-1483.
Umesono, K., Murakami, K. K., Thompson, C. C. & Evans, R. M. 1991. Direct repeats
as selective response elements for the thyroid hormone, retinoic acid, and
vitamin D3 receptors. Cell, 65, 1255-1266.
Usuku, G. & Gross, J. 1965. Morphologic studies of connective tissue resorption in the
tail fin of metamorphosing bullfrog tadpole. Dev. Biol., 11, 352-370.
Vu, T. H. & Werb, Z. 2000. Matrix metalloproteinases: effectors of development and
normal physiology. Genes Dev., 14, 2123-2133.
Wang, Z. & Brown, D. D. 1993. Thyroid hormone-induced gene expression program for
amphibian tail resorption. J. Biol. Chem., 268, 16270-16278.
Wilhelm, S. M., Collier, I. E., Marmer, B. L., Eisen, A. Z., Grant, G. A. & Goldberg, G. I.
1989. SV40-transformed human lung fibroblasts secrete a 92-kDa type IV
collagenase which is identical to that secreted by normal human macrophages. J.
Biol. Chem., 264, 17213-17221.
Yaoita, Y. & Brown, D. D. 1990. A correlation of thyroid hormone receptor gene
expression with amphibian metamorphosis. Genes Dev., 4, 1917-1924.
Yaoita, Y. & Nakajima, K. 1997. Induction of apoptosis and CPP32 expression by
thyroid hormone in a myoblastic cell line derived from tadpole tail. J. Biol.
Chem., 272, 5122-5127.

30
Figure 1. Developmental expression of MMP, FAPα, and TRβ genes in the intestine,
tail, and gills during the spontaneous metamorphosis.
Total RNA was extracted from the intestine, tail and gills of X. laevis tadpoles
at indicated developmental stages and subjected to quantitative RT-PCR to determine
MMP, FAPα, and TRβ mRNA levels. Real-time RT-PCR was performed using total
RNA prepared from the intestine (A) and tail (B) of NF stage 57-63, and gills (C) of NF
stage 57-61 tadpoles. Each point was performed three times. The error bars represent
the SE. The levels of MMP, FAPα, and TRβ mRNAs are shown as copy numbers

31
relative to 10,000 copies of EF mRNA. Note for TRβ, the scale of the vertical axis is
indicated at the right side of each left panel.

32

33
Figure 2. T3-induced expression of MMP, FAPα, and TRβ mRNAs in tadpole organs.
Quantitative RT-PCR was performed to assess the time course of T3-induced
up-regulation of MMP, FAPα, and TRβ genes in tadpole organs. Total RNA was
prepared from the intestine (A), tail (B), and gills (C) in X. laevis premetamorphic
tadpoles treated with 100 nM T3, and the tail (D) in tadpoles treated with 5 nM T3 in the
presence of 1 mM methimazole for the indicated times. Each point was performed at
least three times. The error bars represent the SE. The levels of MMP, FAPα, and TRβ
mRNAs are shown as copy numbers relative to 10,000 copies of EF mRNA. Note for
TRβ, the scale of the vertical axis is indicated at the right side of each left panel.
34
Figure 3. T3-induced expression of MMP, FAPα, and TRβ mRNAs in XLT-15 cultured
cell line.
Quantitative RT-PCR was performed to assess the time course of T3-induced
up-regulation of MMP, FAPα, and TRβ genes in XLT-15 cells. Total RNA was extracted
from XLT-15 cells that were cultured in the presence of 10 nM T3. Each point was
performed three times. The error bars represent the SE. The levels of MMP, FAPα, and
TRβ mRNAs are shown as copy numbers relative to 10,000 copies of EF mRNA. Note
for TRβ, the scale of the vertical axis is indicated at the right side of the left panel.
35
Figure 4. The binding of MMP and FAPα TREs to in vitro translated TR and RXR.
The gel mobility shift assay was carried out using the end-labeled probes that
are indicated at the top of each panel. A labeled DR4 element was incubated in the
presence of unprogrammed lysate (URL) or TR or/and RXR with or without a 50-fold
excess of the indicated non-radioactive competitor oligonucleotide. TRβ DR4 and TRβ
mDR4 are wild type and mutant TREs derived from the T3-regulated TRβ gene

36
promoter, respectively (see Table 2). The gels were exposed for the following times:
MMP-9TH TRE1 and TRE2, MMP-14 TRE1, MMP-11 TRE1 and TRE2, FAPα TRE1,
and MMP-13 TRE4, 1 h; MMP-2 TRE1 and MMP-18 TRE1, 16 h.
37
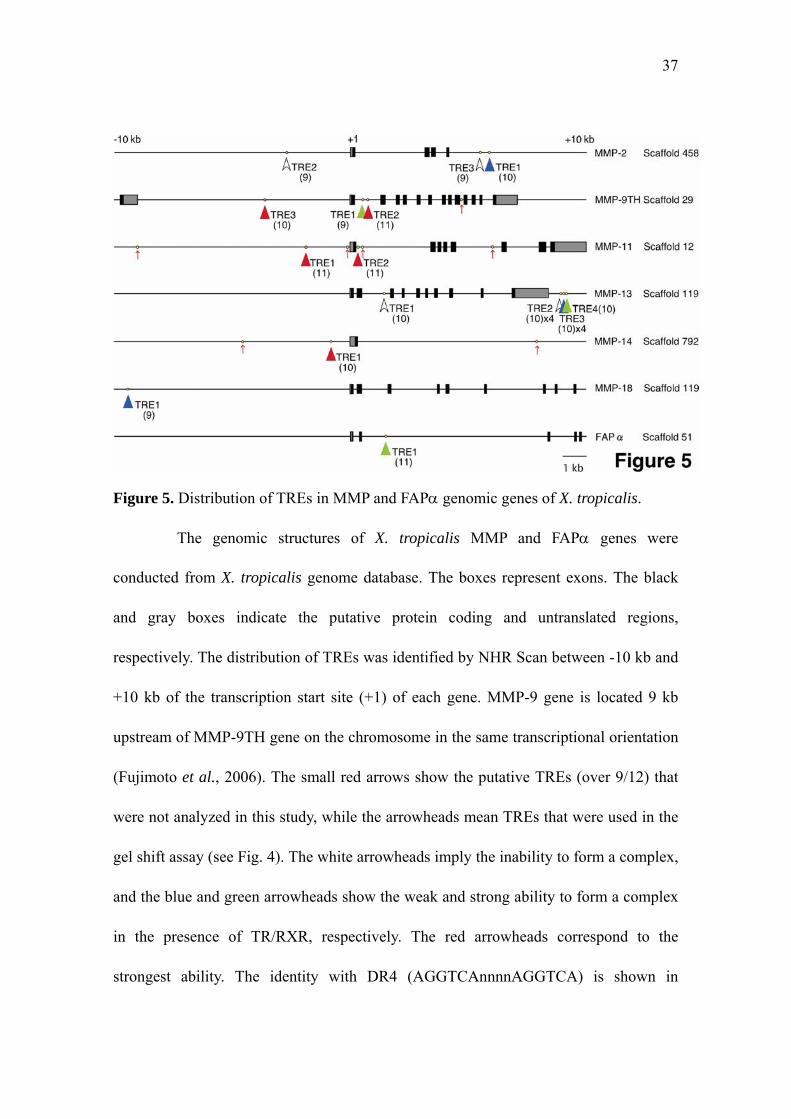
Figure 5. Distribution of TREs in MMP and FAPα genomic genes of X. tropicalis.
The genomic structures of X. tropicalis MMP and FAPα genes were
conducted from X. tropicalis genome database. The boxes represent exons. The black
and gray boxes indicate the putative protein coding and untranslated regions,
respectively. The distribution of TREs was identified by NHR Scan between -10 kb and
+10 kb of the transcription start site (+1) of each gene. MMP-9 gene is located 9 kb
upstream of MMP-9TH gene on the chromosome in the same transcriptional orientation
(Fujimoto et al., 2006). The small red arrows show the putative TREs (over 9/12) that
were not analyzed in this study, while the arrowheads mean TREs that were used in the
gel shift assay (see Fig. 4). The white arrowheads imply the inability to form a complex,
and the blue and green arrowheads show the weak and strong ability to form a complex
in the presence of TR/RXR, respectively. The red arrowheads correspond to the
strongest ability. The identity with DR4 (AGGTCAnnnnAGGTCA) is shown in

38
parenthesis.

39
Table 1. Primers used in quantitative PCR.
Primers Sequence (5’ to 3’)
XlMMP2-FW2 TGGTAATGCAGATGGAGAGTTC
XlMMP2-RV2 AGTTAAGGTAAATAGCAACTCATGTG
XlMMP9TH-FW2 CTCTCAGCCAAATGCAAAGT
XlMMP9TH-RV2 GTTTAGGATACGATATGTGAG
XlMMP11-FW1 CTGACGTACAAGATCATCCG
XlMMP11-RV1 TTATCTCCATGCCAGTACCG
XlMMP13-FW2 CTCTTTGTTGTTGCTGCTC
XlMMP13-RV2 AGGACCATACAGAACCTGAA
XlMMP14-FW4 AAGGAGCATTCATGGGCAGTGATG
XlMMP14-RV6 CCATCCAGTCGACCAAAACGGA
XlMMP18-FW1 AGGAAGAAATGGCAGAGAAT
XlMMP18-RV1 GTCCAATGTTCCTGTCACC
XlFAP-FW1 GTTGTAACTCTGCTAATAGTTACTGT
XlFAP-RV1 CGGATATATTCGTTCTCTGAAATCCA
XlTRβ-FW1 GAATGGCAACAGACTTGGTT
XlTRβ-RV1 GCTTCAGTGACAACTTGTATC

40
Table 2. TRE sequences in the X. tropicalis MMP and FAPα genes.
In the optimized sequence, ‘n’ means any nucleotide.
TRE sequences of MMP and FAPα genes are aligned with an optimized TRE
sequence. The AGGTCA-like motifs of the DR4 are in the capital letters, and bold
nucleotides indicate identity with the consensus motif. The intervening letters are in
lowercase. The plus and minus signs mean the ability and inability to form a specific
complex in the presence of TR/RXR in the gel shift assay, respectively. The number of
plus signs corresponds to the intensity of an observed complex: a single plus shows the
weak ability to form a complex (for example see Fig. 4 for MMP-2 and MMP-18 TREs)
and three plus signs correspond to the strongest ability to form a complex (see Fig. 4 for
MMP-9TH and MMP-11 TREs).
Gene TRE Relative binding of TR
DR4 TRE AGGTCAnnnnAGGTCA
xTRβ DR4 AGGTCAtttcAGGACA
xTRβ mDR4 AGGTCAtttcAAAACA
XtMMP-2 TRE1 AGGGCAgagtAGGACA +
XtMMP-2 TRE2 GGGTCAgactTGGACA -
XtMMP-2 TRE3 AGGGTAgagtAGGGCA -
XtMMP-9TH TRE1 GGGTTAcaggAGGTAA ++
XtMMP-9TH TRE2 AGGTCAgataAGGACA +++
XtMMP-9TH TRE3 AGGTAAactaAGGACA +++
XtMMP-11 TRE1 AGGTCTggtaAGGTCA +++

41
XtMMP-11 TRE2 AGGTCAgttaAGGTGA +++
XtMMP-13 TRE1 AGGGCAaataAGATCA -
XtMMP-13 TRE2 AGGTCAgtatGGGTCT -
XtMMP-13 TRE3 AGGTCAgtgtGGGTCT +
XtMMP-13 TRE4 AGGTCAgtctGGGTCT ++
XtMMP-14 TRE1 GGGTCAcaggAGGGCA +++
XtMMP-18 TRE1 GGATCAttacAAGTCA +
XtFAPα TRE1 ATGTCAaagcAGGTCA ++
Top Related