


Languages
Pages
Legal

Marron Bingle-Davis and Nick Jones
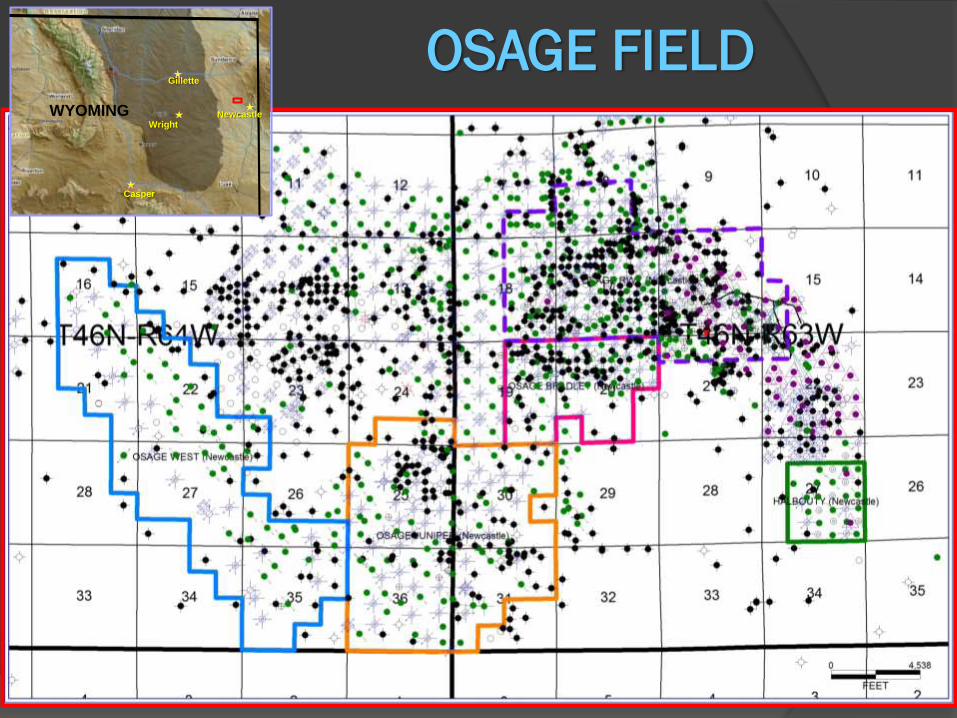
WYOMING
Casper
Wright
Gillette
OSAGE FIELDNewcastle

Dobbin and Miller, 1941
Producing Area
OSAGE HISTORY
Discovered in 1919 – Natural Oil Seeps
First well – 1919 – Mike Henry Oil Co. No. 1 in NESE Sec 5 T46N-R63W
330 ft deep
First deep well – 1920 – Alliance Oil Co. No. 1 in NWNE Sec 19 T46N-R63W
1,335 ft deep
IP 200 BOPD
Refinery capable of 500 BOPD built by mid 1920
Osage town quickly established to accommodate expanding field

Town of Osage, circa 1920
Sioux Oil Refinery, NewcastlePortable Star Drilling Machine , circa 1928
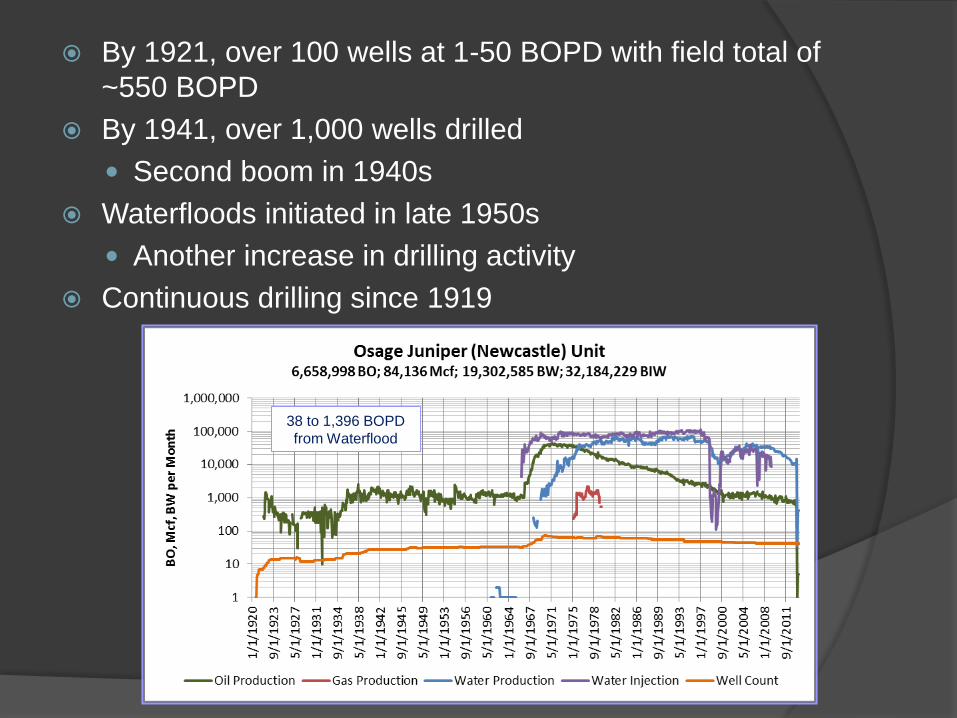
38 to 1,396 BOPD
from Waterflood
By 1921, over 100 wells at 1-50 BOPD with field total of
~550 BOPD
By 1941, over 1,000 wells drilled
Second boom in 1940s
Waterfloods initiated in late 1950s
Another increase in drilling activity
Continuous drilling since 1919

RockWell Petroleum purchased
Osage for oil mining in 2006
Drilled 14 ft x 14 ft portal
underneath formation
Drilled small horizontal wells from
a single well room up into
formation
Osage Partners, LLC
purchased Osage in 2012

CURRENT FIELD STATUS
~600 active wells (200 producers,
200 shut-in, 200 injectors)
4 active secondary recovery units
Initiated between 1955 and 1968
125 MMBBLS OOIP in field
32 MMBO cumulative production;
26% Recovery
20 MMBO on Primary
12 MMBO on Secondary
Currently producing 100-130
BOPD

OSAGE GEOLOGY
Newcastle Fm outcrop near Newcastle, WY
Newcastle Fm
Skull Creek SH
Muddy/Newcastle
Formation primary producer
at Osage
Some Belle Fourche
production
Up to 7 distinct sands
Fluvial and likely marginal
marine up-section
High clay content in some
sands poses problem for
waterfloods

Osage Field
• Osage part of Fiddler Creek trend of
Muddy/Newcastle production
• Field produces from 200 to 4,000 ft deep
• Some wells have made over 200,000 BO
• High oil saturations make Osage a good
target for chemical flooding

Top of Newcastle Fm
Skull Creek SH
1 sand
2 sand
3 sand
4 sand
5 sand
6 sand7 sand
Main
Producers

NEW DEVELOPMENTS

Rig at Osage
HORIZONTAL DRILLING Previous operators produced best
intervals ignoring the remainder of
the formation
Core data and logs suggest all oil
saturated but often tight
Drill short radius horizontal wells
with short laterals to
inexpensively improve the kh

MUD MOTORS VS ROTARY STEERABLE TOOLS
Currently testing two horizontal technologies at Osage
Mud Motors
Main draw – very cost effective, proven successful
Rotary Steerable
Main draw – no MWD, supposedly reproducible
Rotary Steerable Tool
Knuckle Joint
Bent Housing
Mud Motor
Rotary
Steerable
Tests
Rotary
Steerable
Tests
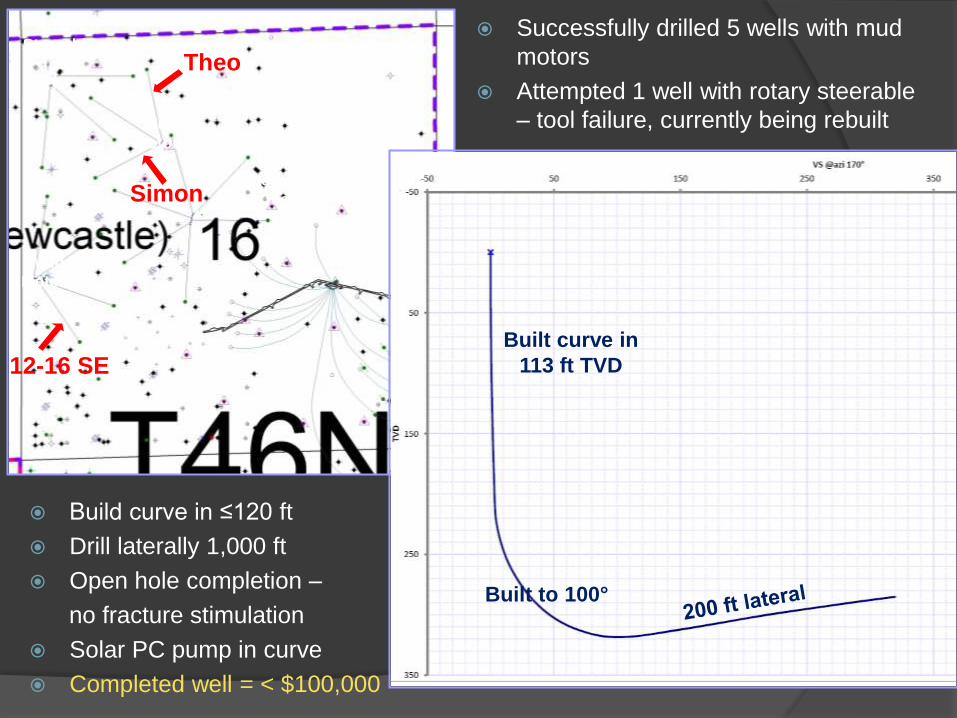
Built curve in
113 ft TVD
Built to 100°
Theo
Simon
12-16 SE
Mud
Motors
Mud
Motors
Build curve in ≤120 ft
Drill laterally 1,000 ft
Open hole completion –
no fracture stimulation
Solar PC pump in curve
Completed well = < $100,000
Successfully drilled 5 wells with mud
motors
Attempted 1 well with rotary steerable
– tool failure, currently being rebuilt

SIMON STATE 6-16-46-63H NW
Basal 5-7 sands are main target for horizontal drilling, but the uncommon
1 sand and even the waterflooded 3-4 sands may be potential targets –
Up to 150 MMBBLS OOIP for just the basal sands

6-well pad on 160 ac =
24 wells/section
= 553 wells over 13,800 acres Testing Area
Estimated 240,000 BO /section
recoverable – 5.5 MMBO
recoverable across field
Due to low cost in drilling –
Well only needs 2,000 BBLS
to payout

We are currently drilling
the first three wells on
the NE of section 17 pad
– Beginning of field-wide
expansion beyond testing
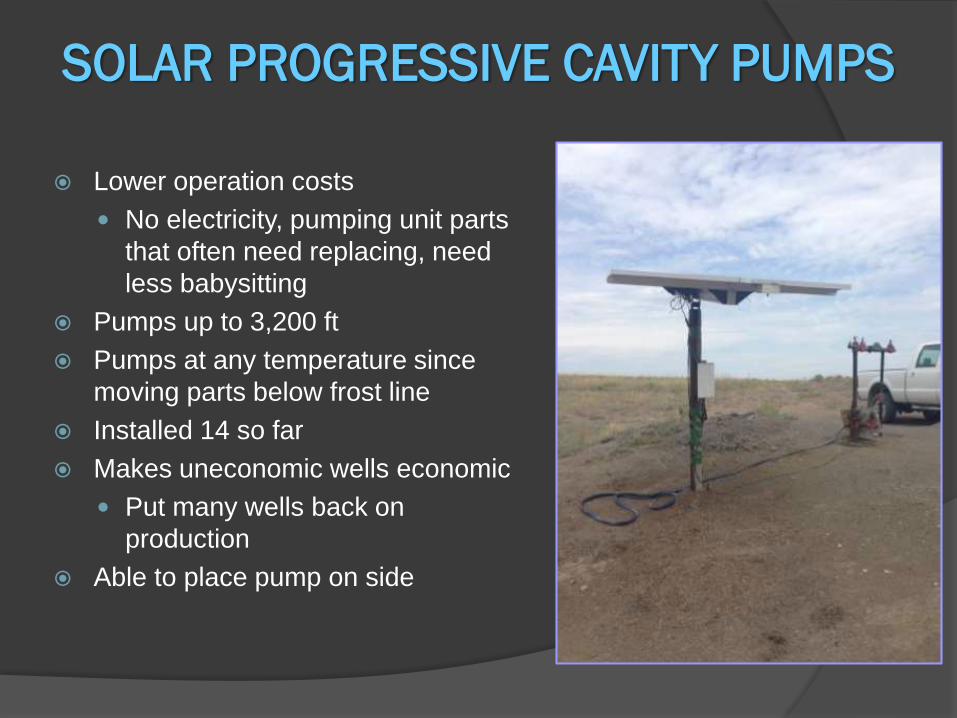
SOLAR PROGRESSIVE CAVITY PUMPS
– Place pump in curve
Lower operation costs
No electricity, pumping unit parts
that often need replacing, need
less babysitting
Pumps up to 3,200 ft
Pumps at any temperature since
moving parts below frost line
Installed 14 so far
Makes uneconomic wells economic
Put many wells back on
production
Able to place pump on side
ASP PILOT – BRADLEY UNIT
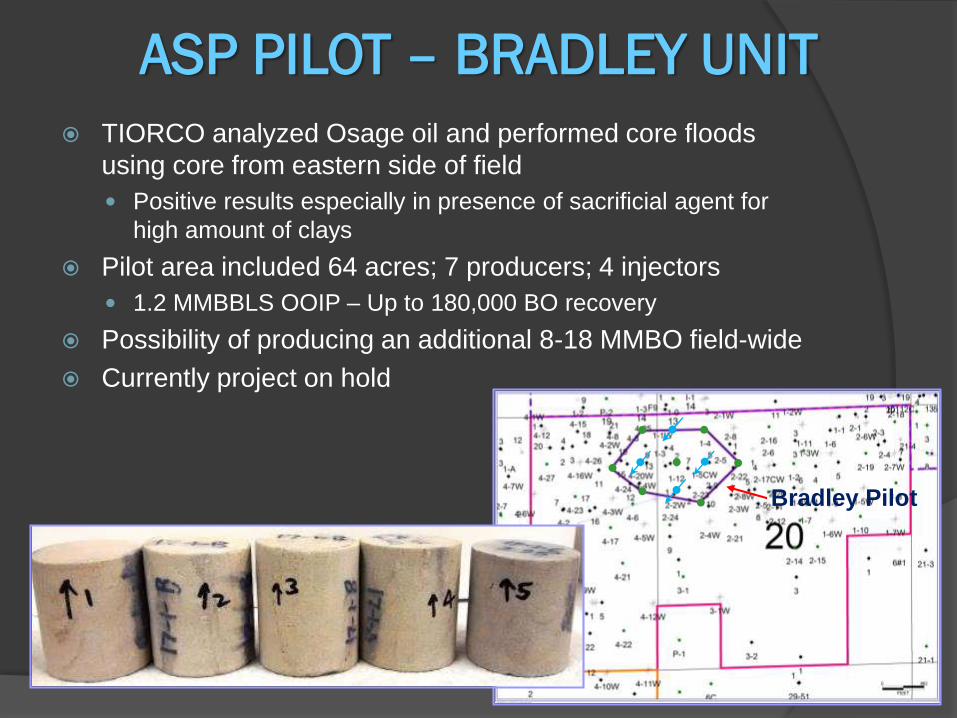
TIORCO analyzed Osage oil and performed core floods
using core from eastern side of field
Positive results especially in presence of sacrificial agent for
high amount of clays
Pilot area included 64 acres; 7 producers; 4 injectors
1.2 MMBBLS OOIP – Up to 180,000 BO recovery
Possibility of producing an additional 8-18 MMBO field-wide
Currently project on hold
Bradley Pilot

ASP CORE FLOOD (OIL RECOVERY ANALYSIS)
PV: 0.07 0.23 0.40 0.56 0.76 0.93 1.14 1.31 1.48 1.65
Oil Recovery in 1 PV (including ASP slug):
37 % of Residual oil
58 % of OOIP
Incremental Oil Recovery from WF:
41 % of Residual oil
28% of OOIP

Petrographic analysis
35 thins sections from four
cores
XRD and CEC
Whole-rock XRD on 14
samples
Clay mounts of 35 samples for
XRD
CEC on 15 samples
• Petrography and XRD focus
on clay analysis
• Detailed core description for
paleoenvironment
Core 17-1 288’ to 297’
ENHANCED OIL RECOVERY INSTITUTE


Calcite Cement
Shell fragments?
292.5 ft
1 sand
342 mD
30.3 % porosity
13 % Sw
45.8 % So
Clean, very fine-
grained sand; Minor
Kaolinite and
Chlorite

333.7 ft
6 sand
2.48 mD
19 % porosity
26.3 % Sw
38.4 % So
Organics
Flaser-irregular
bedded, mud-rich
very fine-grained
sandstone and
siltstone;
Carbonaceous
streaks common;
Kaolinite in cleaner
sands and Chlorite

EORI AND CHEMICAL TRACERS, INC.
Tracer Test 1: Sor = 32% ± 4%
Tracer Test 2: Sor = 10% ± 5%
Localized EOR
Flood
20 Feet
EtAc (ethyl acetate) + H2O EtOH (ethyl alcohol) + HAc
Conduct single well tracer test for
evaluation of ASP formula
Two tests performed – Test 1 before
EOR and Test 2 after a shut-in period
Chemical reaction occurs in situ
while shut-in; new tracer arrives at
surface before old tracer as fluid
produced back in presence of oil
Result in Sor before and after EOR
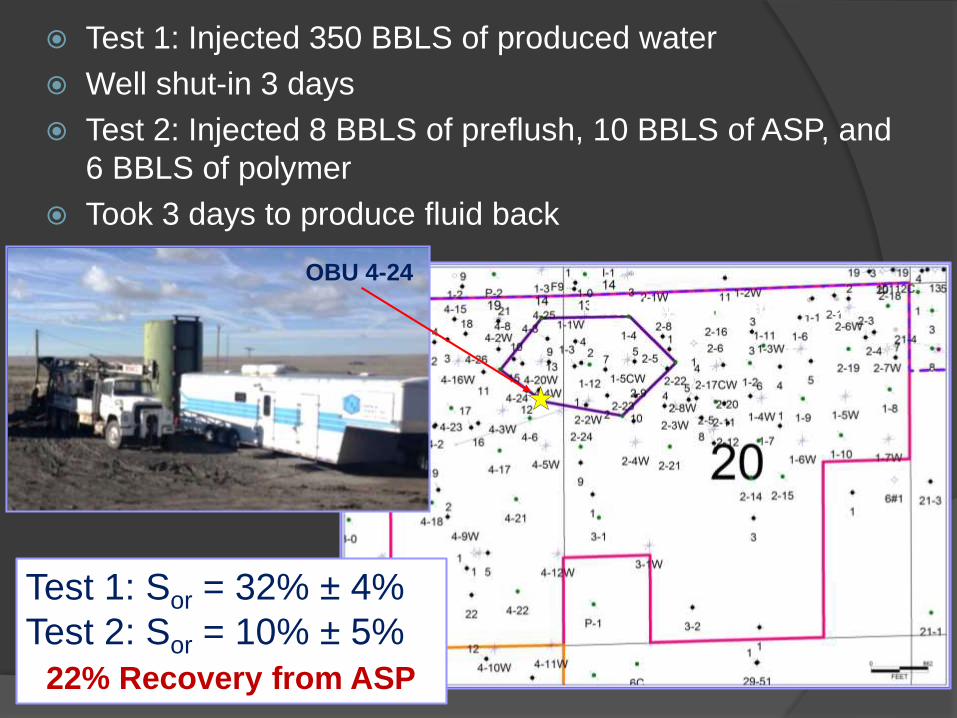
Test 1: Sor = 32% ± 4%
Test 2: Sor = 10% ± 5%
22% Recovery from ASP
Bradley Unit Pilot Area
OBU 4-24
Test 1: Injected 350 BBLS of produced water
Well shut-in 3 days
Test 2: Injected 8 BBLS of preflush, 10 BBLS of ASP, and
6 BBLS of polymer
Took 3 days to produce fluid back

Known chemical EOR projects in Muddy/Newcastle reservoirs
• Mush Creek -1969? –Polymer – Profitable
• Bell Creek -1977 – Surfactant – Successful
• Fiddler Creek -1985 – Polymer – Incomplete
• Clareton -1985 – Polymer – Discouraging results
• Osage - 2014 – Alkaline Surfactant Polymer – Successful
Average residual/immobile oil saturation ~30%
*Polymer + Alkaline & Surfactant = 20 to 25% recovery of residual oil
saturation.
e.g. (OOIP * 0.3)=Rso 0.25*Rso=Potential Incremental Production
Polymer
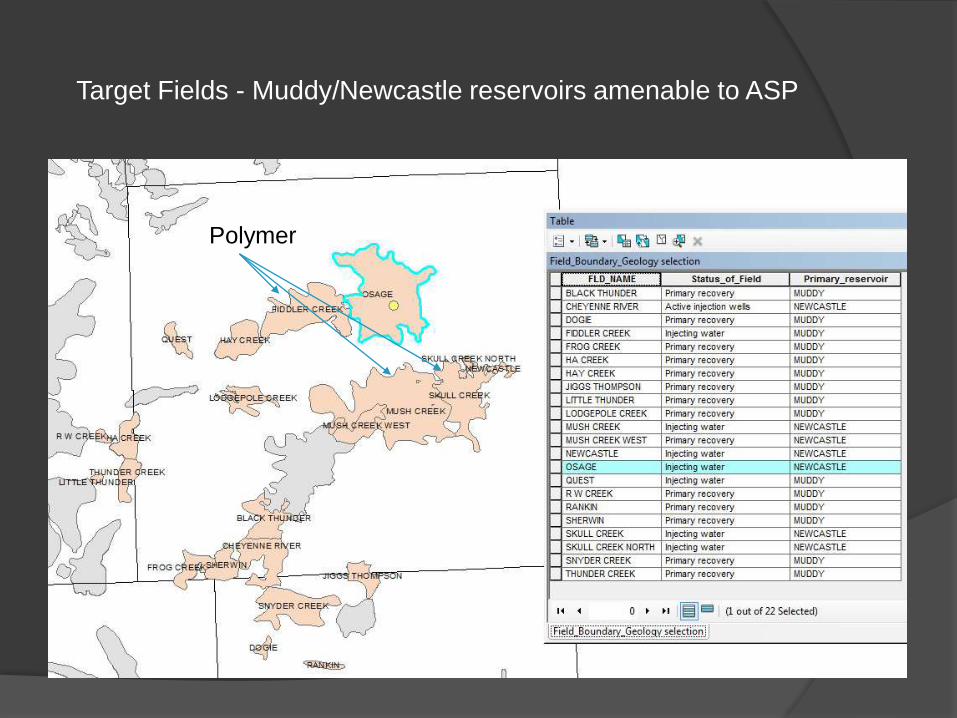
Target Fields - Muddy/Newcastle reservoirs amenable to ASP
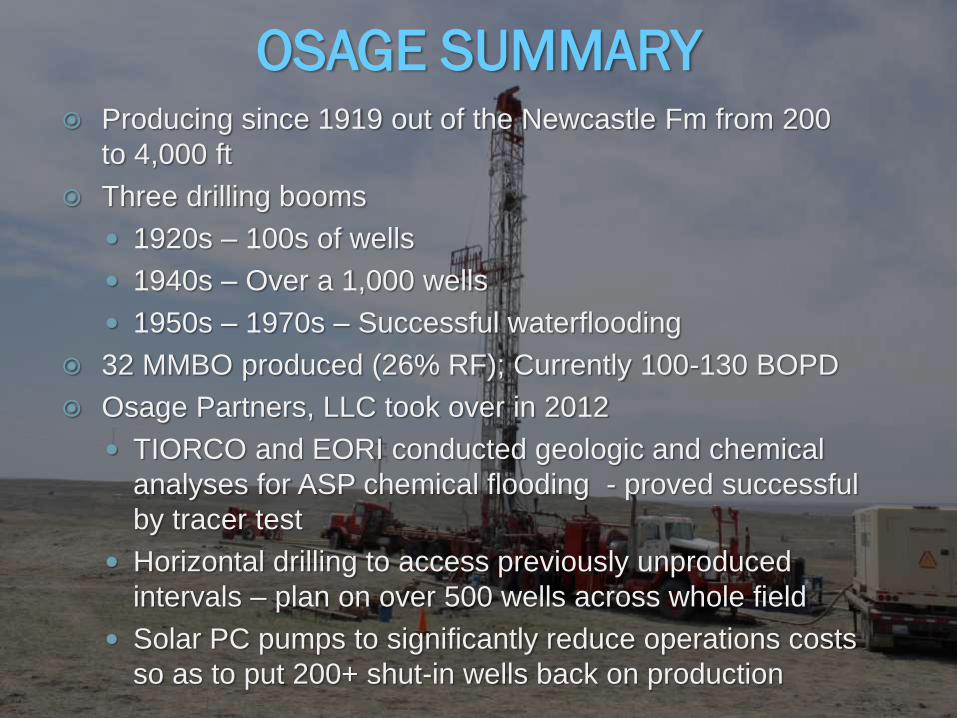
OSAGE SUMMARY Producing since 1919 out of the Newcastle Fm from 200
to 4,000 ft
Three drilling booms
1920s – 100s of wells
1940s – Over a 1,000 wells
1950s – 1970s – Successful waterflooding
32 MMBO produced (26% RF); Currently 100-130 BOPD
Osage Partners, LLC took over in 2012
TIORCO and EORI conducted geologic and chemical
analyses for ASP chemical flooding - proved successful
by tracer test
Horizontal drilling to access previously unproduced
intervals – plan on over 500 wells across whole field
Solar PC pumps to significantly reduce operations costs
so as to put 200+ shut-in wells back on production

ACKNOWLEDGEMENTS:
Wayne Neumiller (Osage Partners, LLC)
Mark Erickson (Osage Partners, LLC)
Mark Choury (Osage Partners, LLC)
Becky Podio (Osage Partners, LLC)
Stephen Tygard (Osage Partners, LLC)
Curtis Chopping (EORI)
Peigui Yin (EORI)
Charlie Carlisle (CTI)
Scott Badham (CTI)
Mike Lantz (TIORCO)
Neeraj Rohilla (TIORCO)
Ravi Ravikiran (TIORCO)
Paul Knox (TIORCO)

THANK YOU FOR YOUR TIME
ANY QUESTIONS?
Top Related