


Languages
Pages
Legal

MINISTRY OF TRADEAND INDUSTRY
REPUBLIC OF KOSOVO
KOSOVO MSME’S TRAINING NEEDS ANALYSIS
KOSOVO
YOUREADY FOR

This page is intentionally left blank

Page | 3…
FUNDED BY
Agjencia për Investime dhe Përkrahjen e Ndërmarrjeve në Kosovë Agencija za Investicije i Podršku Preduzeča na Kosovu Kosovo Investment and Enterprise Support Agency Str. Muharrem Fejza p.n. 10000 Pristina, Republic of Kosovo Tel: +383 (0)38 200 36 541 e-mail: [email protected] kiesa.rks-gov.net
IMPLEMENTED BY
D&D Business Support Center Square. "Edit Durham", H1, No.11, 10000 Pristina, Republic of Kosovo Tel: +377(0)44-693-564, E-mail: [email protected] www.dd-bsc.com
The views and opinions expressed in this report are those of the author and do not represent the official position of the Ministry of Trade and Industry of the Republic of Kosovo or of the Kosovo Investment and Enterprise Support Agency.
PRISHTINA, OCTOBER 2017
Page | 4…
CONTENTS LIST OF FIGURES ............................................................................................................................................. 7
LIST OF ABBREVIATIONS ............................................................................................................................. 8
1. EXECUTIVE SUMMARY ......................................................................................................................... 9
2. RESEARCH METHODOLOGY .............................................................................................................. 11
3. ANALYSIS OF DATA GENERATED FROM THE SURVEY .............................................................. 13
3.1. PART I - General information on SMEs ........................................................................................... 13
3.1.1. The establishment period of enterprises ........................................................................................ 13
3.1.2. Age and gender structure of employees in surveyed SMEs .......................................................... 14
3.1.3. Structure of surveyed SME employees by educational background ............................................. 15
3.1.4. Certification of surveyed enterprises with national or international standards ............................. 17
3.2. PART II – Trainings attended by the enterprises .............................................................................. 18
3.2.1. Human resources management at surveyed enterprises ................................................................ 18
3.2.2. Enterprises attended training activities in the past ........................................................................ 19
3.2.3. Types of training attended in the past by surveyed enterprises ..................................................... 20
3.2.4. Training impact to employees performance .................................................................................. 21
3.2.5. Training organization form (in-person/online) .............................................................................. 22
3.2.6. Online training impact to the performance of surveyed SMEs employees ................................... 23
3.2.7. The way of organizing trainings .................................................................................................... 24
3.2.8. Main funding source of training activities in the past ................................................................... 25
3.2.9. Assessment of training benefits against training costs .................................................................. 26
3.2.10. Reasons for not attending trainings in the past .............................................................................. 27
3.2.11. Obstacles and difficulties during the work process and the challenges of SMEs due non-participation
in training ...................................................................................................................................................... 28
3.3. PART III – SMEs training needs in the future .................................................................................. 29
3.1.3. Management training needs of enterprises .................................................................................... 29
3.3.1.1. Management Training Needs ..................................................................................................... 29
3.3.1.2. Human resources training needs ................................................................................................ 31
3.3.1.3. Public procurement and tendering training needs ..................................................................... 32
3.3.1.4. Financial management training needs ....................................................................................... 34
3.3.1.5. Market analysis training needs .................................................................................................. 36
3.3.1.6. Marketing training needs ........................................................................................................... 38
3.3.2. Operational/ administrative training needs of enterprise ............................................................... 39
3.3.2.1. Operational/administrative training needs ................................................................................. 39
3.3.2.2. Project preparation and management training needs ................................................................. 41
3.3.2.3. Finance management and accounting training needs ................................................................ 43
3.3.2.4. Client service training needs ...................................................................................................... 45
3.3.2.5. Communication technology, efficient use of energy and product certification training needs . 46
Page | 5…
3.3.3. Technical and/or professional training needs of SMEs ................................................................. 47
3.3.4. Readiness of surveyed enterprises for online trainings ................................................................. 50
4. SUMMARY .............................................................................................................................................. 51
5. ANNEX 1 – QUESTIONNAIRE .............................................................................................................. 53
LIST OF TABLES TABLE 1 - Comparison of SME requests for training ............................................................................................. 11
TABLE 2 - Enterprise establishment period ............................................................................................................ 13
TABLE 3 - Structure of man employees in surveyed SMEs .................................................................................... 14
TABLE 4 - Structure of women employees in surveyed SMEs ............................................................................... 14
TABLE 5 - Structure of employees by educational background ............................................................................. 15 TABLE 6 - Certification of surveyed SMEs with national/international standards ................................................ 17 TABLE 7 - Human resources management in 800 surveyed SMEs. ..................................................................... 18 TABLE 8 - Participation of SMEs in training sessions in the past ........................................................................ 19 TABLE 9 - Types of trainings held by SME workers ............................................................................................. 20 TABLE 10 - Training impact to employees performance ....................................................................................... 21 TALBE 11 - Training organization form ................................................................................................................ 22 TABLE 12 - Online training impact to the employee performance. ....................................................................... 23 TABLE 13 - Organization of training activities ...................................................................................................... 24 TABLE 14 - The main funding source of training .................................................................................................. 25 TABLE 15 - Assessment of training benefits against training costs by respondents .............................................. 26 TABLE 16 - Reasons for not attending trainings .................................................................................................... 27 TABLE 17 - Obstacles/difficulties during the work process and the challenges of SMEs due to the non-
participation in training ........................................................................................................................................... 28 TABLE 18 - Management training needs of Micro-enterprises .............................................................................. 30 TABLE 19 - Management training needs of Small-enterprises .............................................................................. 30 TABLE 20 - Management training needs of Medium-enterprises .......................................................................... 30 TABLE 21 - Human resources training needs of Micro-enterprise ........................................................................ 31 TABLE 22 - Human resources training needs of Small-enterprise ......................................................................... 31 TABLE 23 - Human resources training needs of Medium-enterprise ..................................................................... 32 TABLE 24 - Public procurement and tendering training needs of Micro-enterprises ............................................. 33 TABLE 25 - Public procurement and tendering training needs of Small-enterprises ............................................. 33 TABLE 26 - Public procurement and tendering training needs of Medium-enterprises ......................................... 33 TABLE 27 - Financial management training needs of Micro-enterprises .............................................................. 34 TABLE 28 - Financial management training needs of Small-enterprises ............................................................... 35 TABLE 29 - Financial management training needs of Medium-enterprises ........................................................... 35 TABLE 30 - Market Analysis training needs of Micro-enterprise .......................................................................... 36 TABLE 31 - Market Analysis training needs of Small-enterprises ......................................................................... 36 TABLE 32 - Market Analysis training needs of Medium-enterprises .................................................................... 37 TABLE 33 - Marketing training needs of Micro-enterprises .................................................................................. 38 TABLE 34 - Marketing training needs of Small-enterprises................................................................................... 38 TABLE 35 - Marketing training needs of Medium-enterprises .............................................................................. 38 TABLE 36 - Operational/administrative training needs of micro-enterprises ........................................................ 39 TABLE 37 - Operational/administrative training needs of small-enterprises ......................................................... 40 TABLE 38 - Operational/administrative training needs of medium-enterprises ..................................................... 40 TABLE 39 - Project preparation and management training needs of Micro-enterprises ........................................ 41 TABLE 40 - Project preparation and management training needs of Small-enterprises ......................................... 41 TABLE 41 - Project preparation and management training needs of Medium-enterprises .................................... 42 TABLE 42 - Finance management and accounting training needs of Micro-enterprises ....................................... 43 TABLE 43 - Finance management and accounting training needs of Small-enterprises ........................................ 43
Page | 6…
TABLE 44 - Finance management and accounting training needs of Medium-enterprises .................................... 44 TABLE 45 - Client service training needs of Micro-enterprises ............................................................................. 45 TABLE 46 - Client service training needs of Small-enterprises ............................................................................. 45 TABLE 47 - Client service training needs of Medium-enterprises ......................................................................... 45 TABLE 48 - Communication technology, efficient use of energy and product certification training needs of
Micro-enterprises ..................................................................................................................................................... 46 TABLE 49 - Communication technology, efficient use of energy and product certification training needs of
Small-enterprises ..................................................................................................................................................... 46 TABLE 50 - Communication technology, efficient use of energy and product certification training needs of
Medium-enterprises ................................................................................................................................................. 46 TABLE 51 - Technical/professional training needs of Micro-enterprises .............................................................. 47 TABLE 52 - Technical/professional training needs of Small-enterprises ............................................................... 48 TABLE 53 - Technical/professional training needs of Medium-enterprises ........................................................... 48 TABLE 54 - Readiness of surveyed enterprises for online trainings ...................................................................... 50 TABLE 55 - Recommended training activities ....................................................................................................... 52

Page | 7…
LIST OF FIGURES FIGURE 2 - SMSs employees by gender and age ................................................................................................... 15 FIGURE 3 - Structure of employees by educational background ........................................................................... 16 FIGURE 4 - Certification of surveyed SMEs with national/international standards .............................................. 17 FIGURE 5 - Human resources management in SMEs ............................................................................................ 18 FIGURE 6 - Participation of employees in previous trainings ................................................................................ 19 FIGURE 7 - Types of trainings attended by SMEs employees ............................................................................... 20 FIGURA 8 -Training impact to employees performance ........................................................................................ 21 FIGURE 9 - Training organization form ................................................................................................................. 22 FIGURE 10 - Online training impact to employee performance ............................................................................ 23 FIGURE 11 - Organization of training activities .................................................................................................... 24 FIGURE 12 - The main funding source of training activities ................................................................................. 25 FIGURE 13 - Assessment of training benefits against training costs by respondents ............................................ 26 FIGURE 14 - Reasons for not attending training activities ..................................................................................... 27 FIGURE 15 - Obstacles/difficulties during the work process and the challenges of SMEs due to the lack of
participation in training ........................................................................................................................................... 28 FIGURE 16 - Management training needs of SMEs ............................................................................................... 31 FIGURE 17 - Human resources training needs of SMEs ........................................................................................ 32 FIGURE 18 - Public procurement and tendering training need of SMEs ............................................................... 34 FIGURE 19 - Financial management training needs of SMEs................................................................................ 36 FIGURE 20 - Market Analysis training needs of SMEs ......................................................................................... 37 FIGURE 21 - Marketing training needs of SMEs ................................................................................................... 39 FIGURA 22 - Operational/administrative training needs of SMEs ......................................................................... 41 FIGURE 23 - Project preparation and management training needs of SMEs ......................................................... 43 FIGURE 24 - Finance management and accounting training needs of SMEs......................................................... 44 FIGURE 25 - Client service training needs of SMEs .............................................................................................. 46 FIGURE 26 - Communication technology, efficient use of energy and product certification training needs of
SMEs ....................................................................................................................................................................... 47 FIGURE 27 - Administrative and/or professional training needs of SMEs ............................................................ 49 FIGURE 28 - Readiness of surveyed enterprises for online training ...................................................................... 50

Page | 8…
LIST OF ABBREVIATIONS
TNA Training Needs Analysis
CE European Conformity
HACCP Hazard analysis and critical control points
ISO International Standardization Organization
EC European Commission
KIESA Kosovo Investment and Enterprise Support Agency
MTI Ministry of Trade and Industry
SME Small and Medium Enterprises
ME Manufacturing Enterprises
SE Service Enterprises
TE Trading Enterprises
SEECEL South East European Centre for Entrepreneurial Learning
SPSS Statistical Package for the Social Sciences

Page | 9…
1. EXECUTIVE SUMMARY
Human resources are undoubtedly one of the main factors in private sector, namely small and medium-
sized enterprises, sustainability and development. Based on many researches performed up to now, this
research, as well as in every opinion drawn from business community, it turns out that SMEs in the
Republic of Kosovo face serious difficulties in recruiting labour force in line with their needs. This is
due to the low level labour market needs related formal and informal education in provided by
educational institutions at all levels, both public and private. Being exposed to an open market, under
regional and international competitiveness, the sustainability and competitiveness increasing
opportunities for Kosovo SMEs, facing such challenges, are hampered both in the domestic market and
in access to exports. On the other hand, the development of human capacities, namely jobseekers training,
is an essential prerequisite to also attracting foreign direct investments.
The purpose of this research funded by Ministry of Trade and Industry/KIESA and implemented by D&D
Business Support Center, is to assess the current state regarding human resource capacities in SMEs and
to identify training needs for Kosovo SME employees. Findings from this research will serve KIESA
and other relevant institutions to develop SME supporting policies, and to develop programs and projects
facilitating access to appropriate training, online format, in the areas necessary to Kosovo SME
employees.
This research, inter alia, outlines the findings from800 SME respondents surveyed on issues focusing
particularly on:
• Training importance to enterprises,
• Main training benefits to enterprises,
• Training absence-related challenges faced by enterprises,
• Areas that enterprises need training,
• Willingness and opportunities of enterprises to use online training, and
• Proposing of online training form, acceptable and usable by the enterprises.
This Training Needs Analysis involved a sample of 800 SMEs, from the entire territory of Kosovo,
respectively from all seven regions of the Republic of Kosovo (Prishtina, Prizren, Ferizaj, Gjilan, Peja,
Gjakova and Mitrovica).
Moreover, this research involved also some comparisons of specific and relevant issues in relation to
other (nearly similar) researches performed before by various organizations. Also, many other important
data on the SME employees’ structure are generated.
With regards to the level of education of SME employees, as an important indicator for SMEs
development, this research indicates that in Kosovo the number of employees with completed secondary
education dominates with 68.1%, whereas in 2013, according to SEECEL research, this percentage was
73.36%, which was the highest percentage of employees with completed secondary education followed
by Croatia with 70.06%, Albania with 61.43% and Turkey with 38.49%.1 Also, the percentage of male
employees in enterprises in Kosovo is evident, which is significantly higher (71%) compare to women
(29%). If we compare the gender structure of employees with the average of Western Balkan and Turkey
(based on SEECEL research of 2013, with 35% for micro-enterprises and 49% for medium enterprises),
one can note that average of women employees in Kosovo is significantly lower than that of the Western
Balkans and Turkey.2
The research identified the main areas in which enterprises have expressed the need for intervention (as
"very necessary"), that reflected in a list of highly needed training, as follows:

Page | 10…
1. Management training;
2. Financial management training;
3. Market analysis training;
4. Marketing training;
5. Operational/Administrative Training;
6. Project development and management training;
7. Financial management and accounting training;
8. Customer service trainings.
It is worth mentioning that the surveyed SMEs expressed relatively low interest in human resources,
information and technology, and professional technical training. Demographic structure of SME
employees is another important factor in the development and adaptation to doing business environment
change. Thus, from this research, it results that age group 25-49 comprises the largest number of
employees in Kosovo or 77.77% in micro-enterprises, and 76.40% in medium enterprises, whereas
compared to SEECEL 2013 report this percentage of the age group is roughly the same in the Western
Balkans and Turkey, or 73.2% in micro enterprises and 64.9% in medium enterprises.3
During the research we analysed also human resource management, whereby the outcome indicates that
human resources in enterprises in Kosovo are managed by the owner itself in 95% of cases and 99% in
microenterprises, while in the Western Balkans and Turkey, human resources are managed by the
enterprise owner in around 75% of micro-enterprises.4
In regards to the manner of organizing trainings, according to SEECEL 2013 research, 49% of enterprises
in Kosovo have organized training activities internally (with experts within the enterprise) while the
current report shows that the internal trainings account for 15.3% of total training activities organised.
Out of the total number of training activities, 61.3% of them were organized with experts outside the
enterprise (outsourced) (46.0% outsourced training activities with local experts, 15.3% outsourced
training activities with international experts), and according to SEECEL2013 report, this figure in Kosovo
was 26%.5
We compared requested training by surveyed Kosovo SME against SEECEL2015 report for Western
Balkan and Turkey. Here we compared SME requested training indicated in SEECEL survey against
roughly the same requested training from this research.
1SEECEL: “Training needs analysis for SMEs” – Western Balkans and Turkey’s experience (2013) p.33 2SEECEL: “Training needs analysis for SMEs” – Western Balkans and Turkey’s experience (2013) p.28 3SEECEL: “Training needs analysis for SMEs” – Western Balkans and Turkey’s experience (2013) p.32 4SEECEL: “Training needs analysis for SMEs” – Western Balkans and Turkey’s experience (2015) p.36 5SEECEL: “Training needs analysis for SMEs” – Western Balkans and Turkey’s experience (2013) p.45

Page | 11…
Table 1 Comparison of SME requests for training
Source: SEECEL 2015; Data from 2017 TNA research.
Note: SME training needs assessment for the above training is carried out through training needs assessment rating, declared
by enterprises where:
• 1 - means that enterprises need training "to some extent"; and
• 2 - means that enterprises need training “highly”
The table above shows the comparison of SME needs for listed trainings, whereby one can note that
training needs assessment of SMEs in the Western Balkans (including Kosovo) and Turkey is higher than
the needs highlighted by the SMEs surveyed in this research, for all types of training. The most requested
training, in both SEECEL report and in this Research, is marketing and sales, where 41% of SMEs in
SEECEL report stated that this training is “highly needed”, and 40% “to some extent”, whereas 38% of
the surveyed SMEs in this Research rated it as “highly necessary”, and 10% rated as “to some extent”.6
2. RESEARCH METHODOLOGY
The SME survey was developed through a questionnaire specifically designed for this research. The
performed survey enabled a generation of significant statistical data and opinions that in turn enabled us
to conduct assessments, development trend analyse, comparative analysis between SME sectors at
different time periods, on SMEs human resources, respectively mapping of their capacity building needs.
The questionnaire was designed to ensure general and specific information for Training Needs Analysis
(TNA) for SMEs. The questionnaire contained a total of 36 questions, with some sub-questions about the
aforementioned purpose.
The questionnaire is divided into three (3) sections:
• Part I, contains SMEs general information, including enterprise data, establishment year, sector,
activity, structure of employees by age and gender, employees education level, and SMSs are certified
with any national or international standards.
• Part II, contains information on previous trainings attended by SMEs, training forms (online or in-
person) held up to date, training impact to the performance of employees, training organization method
(experts within the enterprise, local or international experts), training funding ways, reasons for non-
attendance of trainings and obstacles encountered in the work process due to lack of appropriate training.
• Part III, contains information on future training needs. 74 types of training grouped into 3 main
categories are listed in the questionnaire:
Requested training
SEECEL 2015 Report for
Western Balkans and
Turkey, including Kosovo
2017 TNA Report -
Kosovo
1 2 1 2
Marketing and sales 40% 41% 10% 38%
Qualitative Management and Standards 39% 41% 5% 9%
Market Analysis 41% 39% 4% 12%
Strategic planning and organization 37% 39% 13% 20%
Communication and Foreign Languages 37% 35% 4% 17%
Human resource Management 40% 34% 5% 8%
Financial Management and Accounting 39% 34% 8% 12%
Information and Communication Technology 49% 32% 2% 5%
Energy efficiency 36% 31% 3% 3%
6SEECEL: “Training needs analysis for SMEs” – Western Balkans and Turkey’s experience (2015) p.38

Page | 12…
o Management training;
o Operational/administrative trainings; and
o Professional /technical training.
This research was conducted by direct interviews method between surveyors and respondents,
respectively with the owners or representatives of SMEs. After completing the fieldwork, the
questionnaires were processed in the SPSS application, and at the same time, we conducted a constant
check of the compliance of the surveys was carried out with the predetermined sample for the survey.
The survey involved 800 enterprises, as per predetermined sample structure, as follows:
600 micro-enterprises, enterprises employing up to 9 employees;
o 300 Manufacturing;
o 90 Service;
o 210 Trading.
150 small enterprises, enterprises employing 10-49 employees;
o 70 Manufacturing;
o 10 Service;
o 70 Trading.
50 medium enterprises, enterprises employing 50-249 employees.
o 35 Manufacturing;
o 5 Service;
o 10 Trading.
The survey was carried out throughout the entire territory of Kosovo as below:
o Prishtina Region (319 SME);
o Prizren Region (89 SME);
o Ferizaj Region (87 SME);
o Gjilan Region (83 SME);
o Peja Region (84 SME);
o Gjakova Region (62 SME) and
o Mitrovica Region (76 SME).
Page | 13…
3. ANALYSIS OF DATA GENERATED FROM THE SURVEY
3.1. PART I - General information on SMEs
Part one of the questionnaire contains general information on SMEs, including enterprise data, year of
establishment, sector, activity, structure of employees by age and gender, employee education level and
certification (if certified) of the enterprise with national or international standards. The data generated by
the survey is presented below.
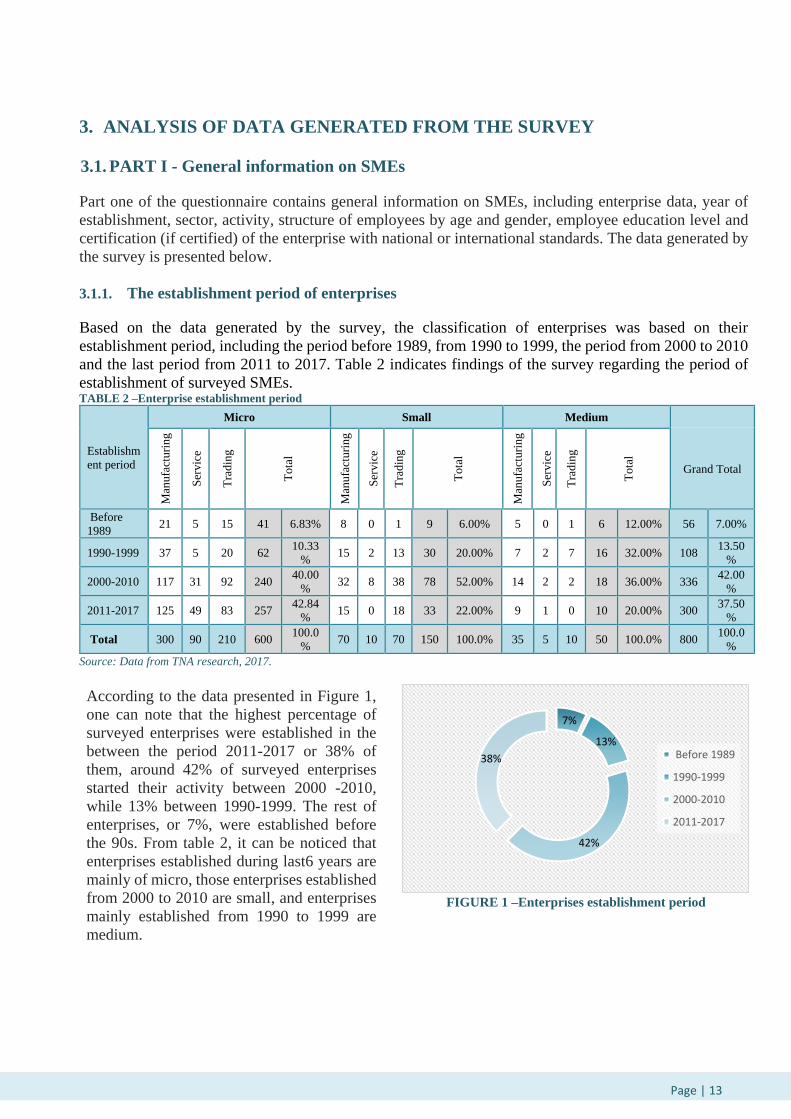
3.1.1. The establishment period of enterprises
Based on the data generated by the survey, the classification of enterprises was based on their
establishment period, including the period before 1989, from 1990 to 1999, the period from 2000 to 2010
and the last period from 2011 to 2017. Table 2 indicates findings of the survey regarding the period of
establishment of surveyed SMEs. TABLE 2 –Enterprise establishment period
Establishm
ent period
Micro Small Medium
Man
ufa
cturi
ng
Ser
vic
e
Tra
din
g
Tota
l
Man
ufa
cturi
ng
Ser
vic
e
Tra
din
g
Tota
l
Man
ufa
cturi
ng
Ser
vic
e
Tra
din
g
Tota
l
Grand Total
Before
1989 21 5 15 41 6.83% 8 0 1 9 6.00% 5 0 1 6 12.00% 56 7.00%
1990-1999 37 5 20 62 10.33
% 15 2 13 30 20.00% 7 2 7 16 32.00% 108
13.50
%
2000-2010 117 31 92 240 40.00
% 32 8 38 78 52.00% 14 2 2 18 36.00% 336
42.00
%
2011-2017 125 49 83 257 42.84
% 15 0 18 33 22.00% 9 1 0 10 20.00% 300
37.50
%
Total 300 90 210 600 100.0
% 70 10 70 150 100.0% 35 5 10 50 100.0% 800
100.0
%
Source: Data from TNA research, 2017.
According to the data presented in Figure 1,
one can note that the highest percentage of
surveyed enterprises were established in the
between the period 2011-2017 or 38% of
them, around 42% of surveyed enterprises
started their activity between 2000 -2010,
while 13% between 1990-1999. The rest of
enterprises, or 7%, were established before
the 90s. From table 2, it can be noticed that
enterprises established during last6 years are
mainly of micro, those enterprises established
from 2000 to 2010 are small, and enterprises
mainly established from 1990 to 1999 are
medium.
FIGURE 1 –Enterprises establishment period
7%
13%
42%
38% Before 1989
1990-1999
2000-2010
2011-2017
Page | 14…
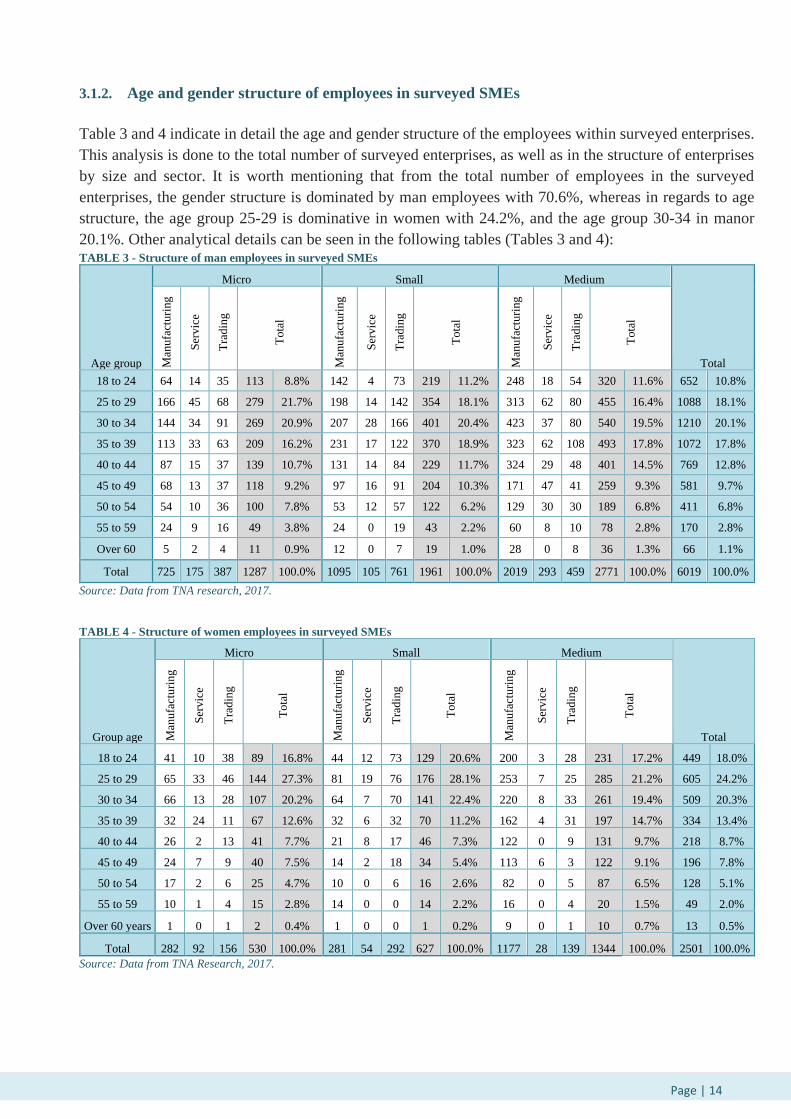
3.1.2. Age and gender structure of employees in surveyed SMEs
Table 3 and 4 indicate in detail the age and gender structure of the employees within surveyed enterprises.
This analysis is done to the total number of surveyed enterprises, as well as in the structure of enterprises
by size and sector. It is worth mentioning that from the total number of employees in the surveyed
enterprises, the gender structure is dominated by man employees with 70.6%, whereas in regards to age
structure, the age group 25-29 is dominative in women with 24.2%, and the age group 30-34 in manor
20.1%. Other analytical details can be seen in the following tables (Tables 3 and 4): TABLE 3 - Structure of man employees in surveyed SMEs
Age group
Micro Small Medium
Total Man
ufa
cturi
ng
Ser
vic
e
Tra
din
g
Tota
l
Man
ufa
cturi
ng
Ser
vic
e
Tra
din
g
Tota
l
Man
ufa
cturi
ng
Ser
vic
e
Tra
din
g
Tota
l
18 to 24 64 14 35 113 8.8% 142 4 73 219 11.2% 248 18 54 320 11.6% 652 10.8%
25 to 29 166 45 68 279 21.7% 198 14 142 354 18.1% 313 62 80 455 16.4% 1088 18.1%
30 to 34 144 34 91 269 20.9% 207 28 166 401 20.4% 423 37 80 540 19.5% 1210 20.1%
35 to 39 113 33 63 209 16.2% 231 17 122 370 18.9% 323 62 108 493 17.8% 1072 17.8%
40 to 44 87 15 37 139 10.7% 131 14 84 229 11.7% 324 29 48 401 14.5% 769 12.8%
45 to 49 68 13 37 118 9.2% 97 16 91 204 10.3% 171 47 41 259 9.3% 581 9.7%
50 to 54 54 10 36 100 7.8% 53 12 57 122 6.2% 129 30 30 189 6.8% 411 6.8%
55 to 59 24 9 16 49 3.8% 24 0 19 43 2.2% 60 8 10 78 2.8% 170 2.8%
Over 60 5 2 4 11 0.9% 12 0 7 19 1.0% 28 0 8 36 1.3% 66 1.1%
Total 725 175 387 1287 100.0% 1095 105 761 1961 100.0% 2019 293 459 2771 100.0% 6019 100.0%
Source: Data from TNA research, 2017.
TABLE 4 - Structure of women employees in surveyed SMEs
Group age
Micro Small Medium
Total Man
ufa
cturi
ng
Ser
vic
e
Tra
din
g
Tota
l
Man
ufa
cturi
ng
Ser
vic
e
Tra
din
g
Tota
l
Man
ufa
cturi
ng
Ser
vic
e
Tra
din
g
Tota
l
18 to 24 41 10 38 89 16.8% 44 12 73 129 20.6% 200 3 28 231 17.2% 449 18.0%
25 to 29 65 33 46 144 27.3% 81 19 76 176 28.1% 253 7 25 285 21.2% 605 24.2%
30 to 34 66 13 28 107 20.2% 64 7 70 141 22.4% 220 8 33 261 19.4% 509 20.3%
35 to 39 32 24 11 67 12.6% 32 6 32 70 11.2% 162 4 31 197 14.7% 334 13.4%
40 to 44 26 2 13 41 7.7% 21 8 17 46 7.3% 122 0 9 131 9.7% 218 8.7%
45 to 49 24 7 9 40 7.5% 14 2 18 34 5.4% 113 6 3 122 9.1% 196 7.8%
50 to 54 17 2 6 25 4.7% 10 0 6 16 2.6% 82 0 5 87 6.5% 128 5.1%
55 to 59 10 1 4 15 2.8% 14 0 0 14 2.2% 16 0 4 20 1.5% 49 2.0%
Over 60 years 1 0 1 2 0.4% 1 0 0 1 0.2% 9 0 1 10 0.7% 13 0.5%
Total 282 92 156 530 100.0% 281 54 292 627 100.0% 1177 28 139 1344 100.0% 2501 100.0%
Source: Data from TNA Research, 2017.

Page | 15…
Figure 2 illustrates the share of employees by gender, divided into different age groups, where one can
note a significantly higher number of men with 70.6% of the total number, while the number of women
employed in SMEs indicated to be around 29.4% of the total number.
FIGURE 2–SMEs employees by gender and age
3.1.3. Structure of surveyed SME employees by educational background
From the perspective of educational background level, this research reveals that surveyed SMEs employees
with secondary education account for 68.1%, followed by employees with higher education with 19.9%.
Table 5 shows the education background level by size and sector of surveyed enterprises.
TABLE 5 - Structure of employees by educational background
Education level
Micro Small Medium
Grand total
Man
ufa
cturi
ng
Ser
vic
e
Tra
din
g
Tota
l
Man
ufa
cturi
ng
Ser
vic
e
Tra
din
g
Tota
l
Man
ufa
cturi
ng
Ser
vic
e
Tra
din
g
Tota
l
Primary Education 56 9 11 76 4.2% 123 15 77 215 8.3% 260 19 43 322 7.8% 613 7.2%
Secondary Education 712 182 340 1234 67.9% 975 95 666 1736 67.1% 2179 251 403 2833 68.9% 5803 68.1%
Higher Education 221 62 177 460 25.3% 220 36 270 526 20.3% 559 32 122 713 17.3% 1699 19.9%
Postgraduate
Education 18 14 15 47 2.6% 58 14 40 112 4.3% 197 19 30 246 6.0% 405 4.8%
Total 1007 267 543 1817 100% 1376 160 1053 2589 100% 3195 321 598 4114 100% 8520 100%
Source: Data from TNA Research, 2017.
5.27
7.10
5.97
3.92
2.56
2.30
1.50
0.58
0.15
29.35
7.65
12.77
14.20
12.58
9.03
6.82
4.82
2.00
0.77
70.65
0.00 10.00 20.00 30.00 40.00 50.00 60.00 70.00 80.00
18 to 24
25 to 29
30 to 34
35 to 39
40 to 44
45 to 49
50 to 54
55 to 59
Over 60 years
Male Female
Page | 16…
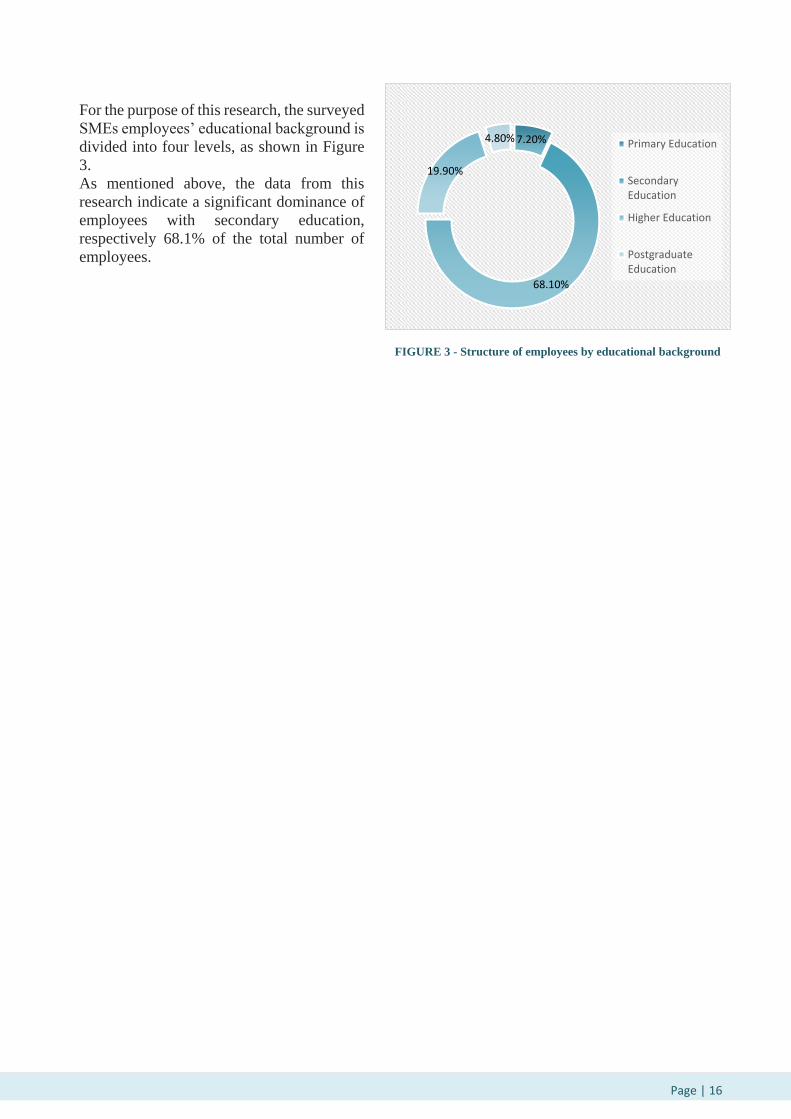
For the purpose of this research, the surveyed
SMEs employees’ educational background is
divided into four levels, as shown in Figure
3.
As mentioned above, the data from this
research indicate a significant dominance of
employees with secondary education,
respectively 68.1% of the total number of
employees.
FIGURE 3 - Structure of employees by educational background
7.20%
68.10%
19.90%
4.80% Primary Education
SecondaryEducation
Higher Education
PostgraduateEducation
Page | 17…
3.1.4. Certification of surveyed enterprises with national or international standards
The results from this research indicate a low percentage of quality standards applied by surveyed SMEs,
respectively certification with these standards. The vast majority of surveyed SMEs, or 95% of them, stated
that they are not certified with any standards.
Table 6, indicates the findings regarding the number of enterprises certified by national or international
standards.
TABLE 6 - Certification of surveyed SMEs with national/international standards
Certification
Micro Small Medium
Grand total
Man
ufa
cturi
ng
Ser
vic
e
Tra
din
g
Tota
l
Man
ufa
cturi
ng
Ser
vic
e
Tra
din
g
Tota
l
Man
ufa
cturi
ng
Ser
vic
e
Tra
din
g
Tota
l
No 295 86 209 590 98.00% 58 10 70 138 92.00% 18 4 9 31 62.00% 759 95.00%
Yes 5 4 1 10 2.00% 12 0 0 12 8.00% 17 1 1 19 38.00 % 41 5.00%
Total 300 90 210 600 100.0% 70 10 70 150 100.0% 35 5 10 50 100.0% 800 100.0%
Source: TNA survey data, 2017.
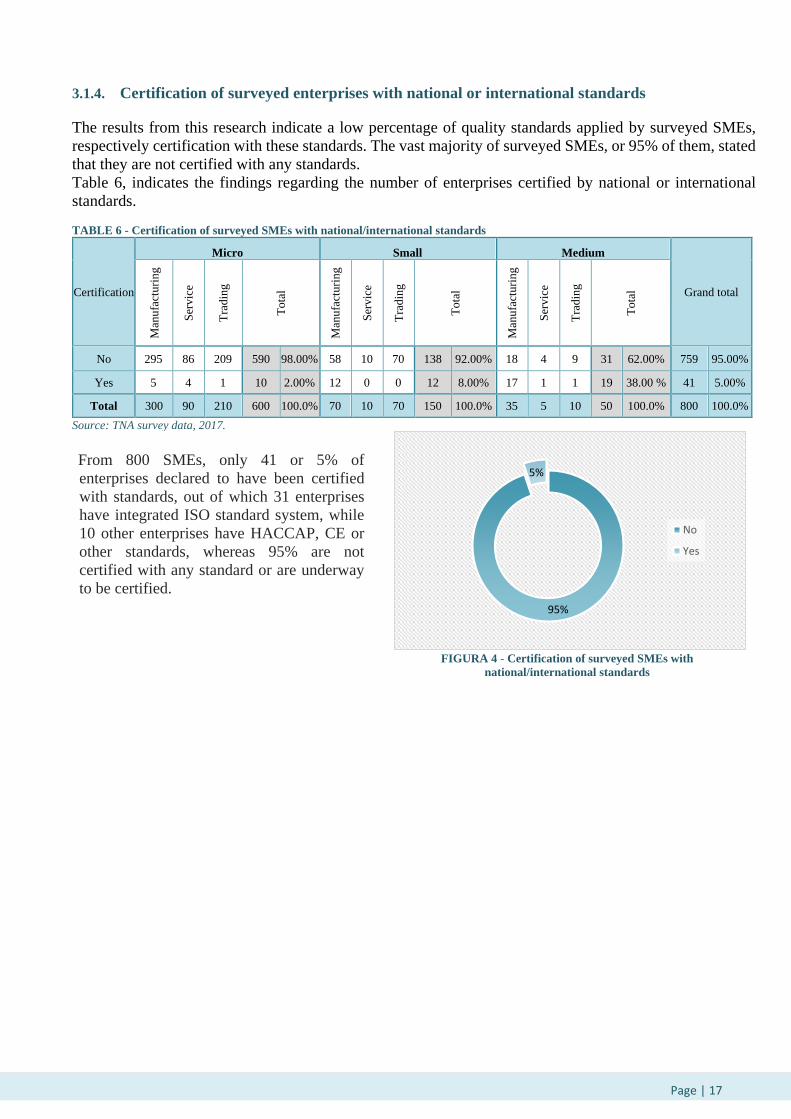
From 800 SMEs, only 41 or 5% of
enterprises declared to have been certified
with standards, out of which 31 enterprises
have integrated ISO standard system, while
10 other enterprises have HACCAP, CE or
other standards, whereas 95% are not
certified with any standard or are underway
to be certified.
FIGURA 4 - Certification of surveyed SMEs with
national/international standards
95%
5%
No
Yes

Page | 18…
3.2. PART II – Trainings attended by the enterprises
Part two of this research contains information on previous trainings attended by SMEs, training forms
(online or in-person) held up to date, training impact to the performance of employees, training organization
method (experts within the enterprise, local or international experts), training funding ways, reasons for non-
attendance of trainings and obstacles encountered in the work process due to lack of appropriate training.
3.2.1. Human resources management at surveyed enterprises
The human resources management at surveyed enterprises presented in the table below indicates that micro-
enterprises have a more simple organizational structure and human resources are managed by their owner
itself, unlike medium-sized enterprises, which have a relatively more advanced organizational structure.
TABLE 7- Human resources management in 800 surveyed SMEs.
Responsible for human
resources
Micro Small Medium
Grand total
Man
ufa
cturi
ng
Ser
vic
e
Tra
din
g
Tota
l
Man
ufa
cturi
ng
Ser
vic
e
Tra
din
g
Tota
l
Man
ufa
cturi
ng
Ser
vic
e
Tra
din
g
Tota
l
Owner 299 90 205 594 99.00% 62 10 60 132 88.00% 22 3 9 34 68.00% 760 95.00%
Director (other than the
owner) 1 0 4 5 1.00% 6 0 8 14 9.30% 8 1 0 9 18.00 % 28 3.50%
HR Department 0 0 1 1 0.00% 2 0 2 4 2.70% 5 1 1 7 14.00% 12 1.50%
Total 300 90 210 600 100.0% 70 10 70 150 100.0% 35 5 10 50 100% 800 100.0%
Source: Data from TNA research, 2017
Figure 5 shows that the responsibility for
human resources management in surveyed
SMEs is dominated by owners, where in
95% of surveyed enterprises the
responsibility falls on the owner, in 3% the
director (other than the owner) is the one
responsible and only in 2% are human
resources departments. If we analyse
(disaggregate) the responsibility of human
resource management by size of the
enterprises, the responsibility at micro
enterprises is under the owner or in 99% of
the cases, the small enterprises 88%, while in
the medium enterprises there is a lower
percentage of responsibility under the owner
and a higher percentage under the directors
and departments of human resources. This
shows that larger enterprises have more
advanced managerial organizational
structures.
FIGURE 5 - Human resources management in SMEs
95%
3%
2%
Owner
Director (other thanthe owner)
HR Department
Page | 19…
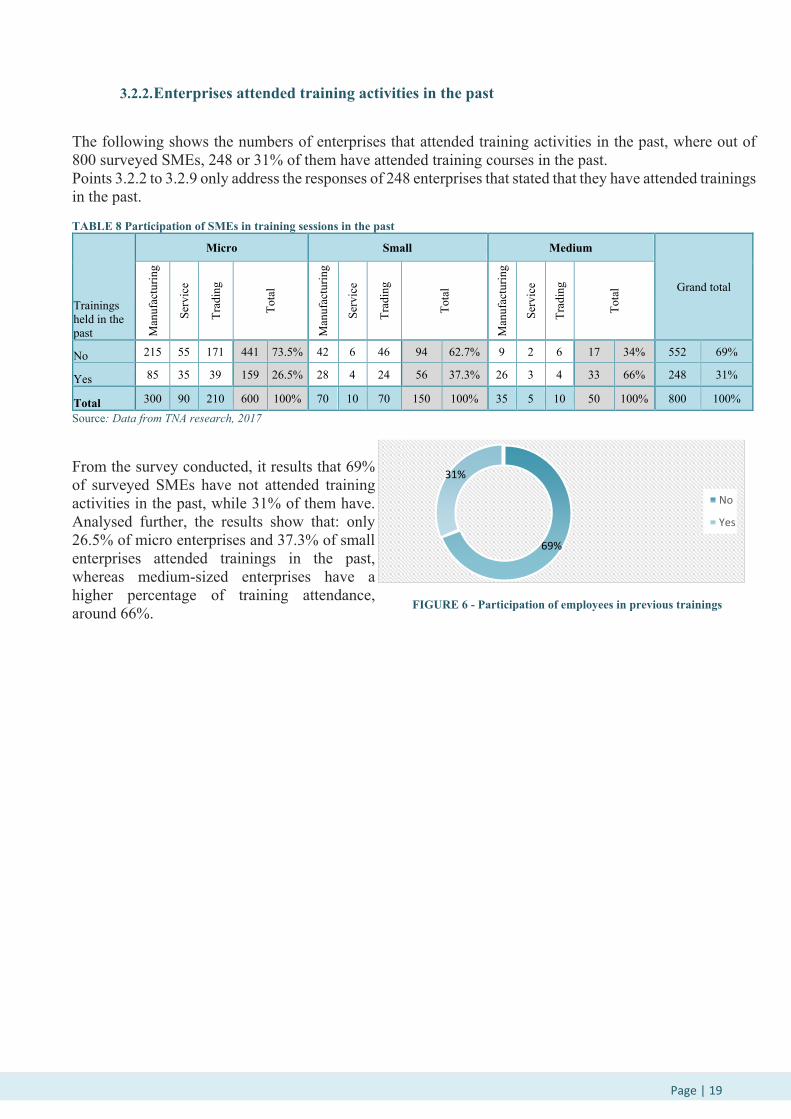
3.2.2. Enterprises attended training activities in the past
The following shows the numbers of enterprises that attended training activities in the past, where out of 800 surveyed SMEs, 248 or 31% of them have attended training courses in the past. Points 3.2.2 to 3.2.9 only address the responses of 248 enterprises that stated that they have attended trainings in the past. TABLE 8 Participation of SMEs in training sessions in the past
Trainings held in the past
Micro Small Medium
Grand total
Man
ufac
turin
g
Serv
ice
Trad
ing
Tota
l
Man
ufac
turin
g
Serv
ice
Trad
ing
Tota
l
Man
ufac
turin
g
Serv
ice
Trad
ing
Tota
l
No 215 55 171 441 73.5% 42 6 46 94 62.7% 9 2 6 17 34% 552 69%
Yes 85 35 39 159 26.5% 28 4 24 56 37.3% 26 3 4 33 66% 248 31%
Total 300 90 210 600 100% 70 10 70 150 100% 35 5 10 50 100% 800 100% Source: Data from TNA research, 2017
From the survey conducted, it results that 69% of surveyed SMEs have not attended training activities in the past, while 31% of them have. Analysed further, the results show that: only 26.5% of micro enterprises and 37.3% of small enterprises attended trainings in the past, whereas medium-sized enterprises have a higher percentage of training attendance, around 66%.
FIGURE 6 - Participation of employees in previous trainings
69%
31%
No
Yes

Page | 20…
3.2.3. Types of training attended in the past by surveyed enterprises
Depending on the business activities of the enterprises, the trainings that they have attended varied. The
table below (Table 9) shows the most attended training sessions from 248 surveyed SMEs, which have stated
that their employees have undergone trainings in the past.
TABLE 9 - Types of trainings held by SME workers
10 Most attended trainings by businesses No. of businesses
1 Professional/Technical/Administrative Training 27
2 Business Management 23
3 Tailoring, fashion design 22
4 Marketing 17
5 Accounting 17
6 Sales training 16
7 Aesthetics training 16
8 Entrepreneurship 14
9 Production line 13
10 Business Plan 11 Source: Data from TNA research, 2017
Table 9 indicates that the most attended trainings by surveyed enterprises employees are
professional/technical/administrative training (27), business management training (23), tailoring and fashion
design (22), marketing (17), accounting (17), sales (16), aesthetics (16), entrepreneurship (14), production
lines (13) and business plan trainings (11). In addition to the training activities listed in Table 9, 72 surveyed
enterprises have stated that they have attended other trainings depending of their business activity, such as:
training on web design, jewellery repair, handicrafts, pharmacy, etc.
FIGURE 7 - Types of trainings attended by SMEs employees
0 5 10 15 20 25 30
Professional/Technical/Administrative Training
Business Management
Tailoring, fashion design
Marketing
Accounting
Sales training
Aesthetics training
Entrepreneurship
Production line
Business Plan
27
23
22
17
17
16
16
14
13
11

Page | 21…
3.2.4. Training impact to employees performance
Given that the purpose of employee training in the enterprise is to increase the performance of the employees
and consequently to increase the sustainability and competitiveness of the enterprises, this research has
addressed the effect of earlier trainings to employees’ performance enhancement. Findings from this
perspective are reflected in Table 10.
TABELA 10–Training impact to employees performance
How would you
rate employee
performance
enhancement due
to trainings?
Micro Small Medium
Grand total
Man
ufa
cturi
ng
Ser
vic
e
Tra
din
g
Tota
l
Man
ufa
cturi
ng
Ser
vic
e
Tra
din
g
Tota
l
Man
ufa
cturi
ng
Ser
vic
e
Tra
din
g
Tota
l
High 49 15 21 85 53.46% 14 2 12 28 50.0% 13 1 4 18 54.55% 131 52.82%
Moderate 30 15 18 63 39.62% 10 2 11 23 41.1% 12 2 0 14 42.42% 100 40.32%
Low 6 3 1 10 6.29% 3 0 1 4 7.1% 1 0 0 1 3.03% 15 6.05%
Not at all 0 1 0 1 0.63% 1 0 0 1 1.8% 0 0 0 0 0.0% 2 0.81%
Total 85 34 40 159 100.0% 28 4 24 56 100% 26 3 4 33 100.0% 248 100.0%
Source: Data from TNA research, 2017
Figure 8 shows that most enterprises, or 53%
of them, rated attended training as highly
effective, while 40% of the respondents rated
attended trainings as moderately effective.
Only 6% stated that the attended training had
low effect, and 1% rated hem as not at all
effective.
FIGURA 8 -Training impact to employees performance
53%40%
6%1%
High
Moderate
Low
Not at all
Page | 22…
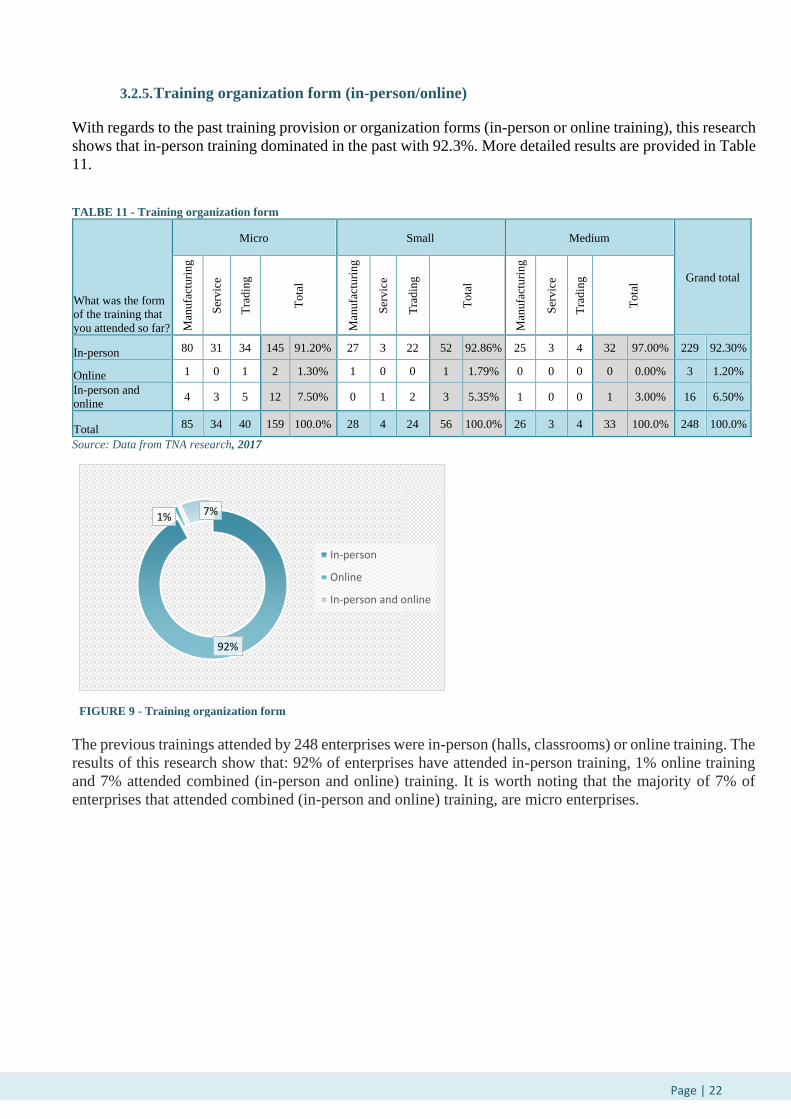
3.2.5. Training organization form (in-person/online)
With regards to the past training provision or organization forms (in-person or online training), this research
shows that in-person training dominated in the past with 92.3%. More detailed results are provided in Table
11.
TALBE 11 - Training organization form
What was the form
of the training that
you attended so far?
Micro Small Medium
Grand total
Man
ufa
cturi
ng
Ser
vic
e
Tra
din
g
Tota
l
Man
ufa
cturi
ng
Ser
vic
e
Tra
din
g
Tota
l
Man
ufa
cturi
ng
Ser
vic
e
Tra
din
g
Tota
l
In-person 80 31 34 145 91.20% 27 3 22 52 92.86% 25 3 4 32 97.00% 229 92.30%
Online 1 0 1 2 1.30% 1 0 0 1 1.79% 0 0 0 0 0.00% 3 1.20%
In-person and
online 4 3 5 12 7.50% 0 1 2 3 5.35% 1 0 0 1 3.00% 16 6.50%
Total 85 34 40 159 100.0% 28 4 24 56 100.0% 26 3 4 33 100.0% 248 100.0%
Source: Data from TNA research, 2017
FIGURE 9 - Training organization form
The previous trainings attended by 248 enterprises were in-person (halls, classrooms) or online training. The
results of this research show that: 92% of enterprises have attended in-person training, 1% online training
and 7% attended combined (in-person and online) training. It is worth noting that the majority of 7% of
enterprises that attended combined (in-person and online) training, are micro enterprises.
92%
1% 7%
In-person
Online
In-person and online
Page | 23…
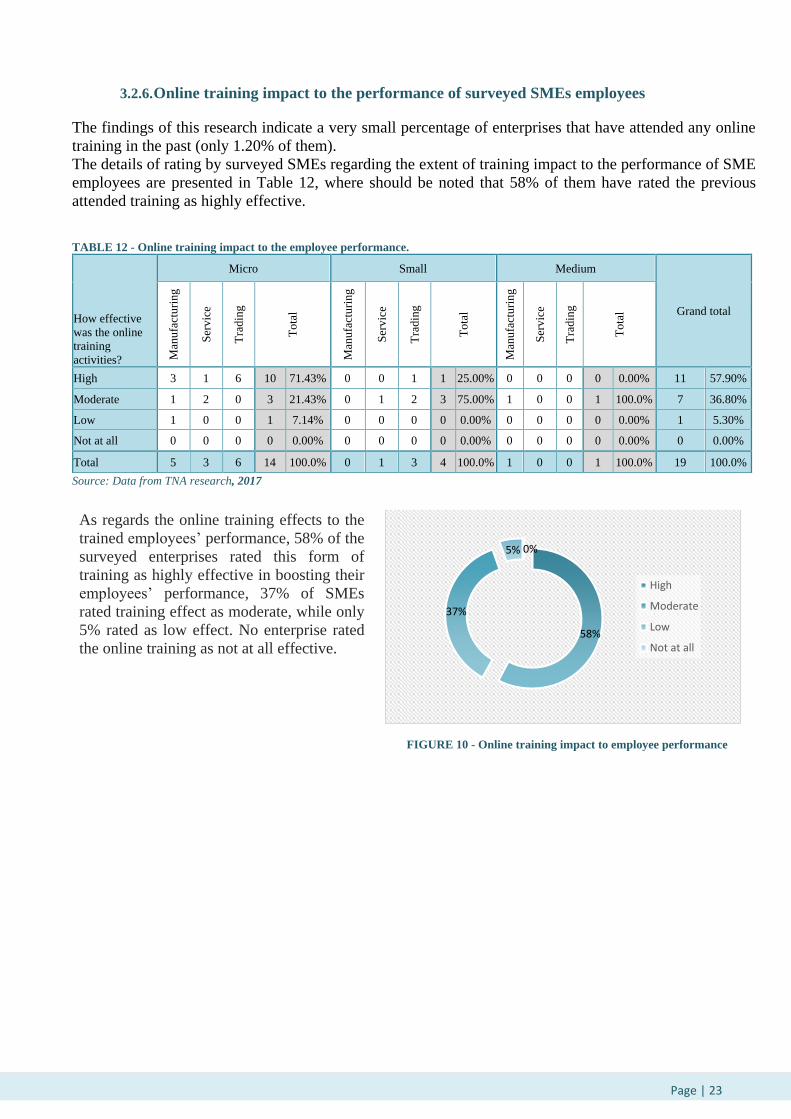
3.2.6. Online training impact to the performance of surveyed SMEs employees
The findings of this research indicate a very small percentage of enterprises that have attended any online
training in the past (only 1.20% of them).
The details of rating by surveyed SMEs regarding the extent of training impact to the performance of SME
employees are presented in Table 12, where should be noted that 58% of them have rated the previous
attended training as highly effective.
TABLE 12 - Online training impact to the employee performance.
How effective
was the online
training
activities?
Micro Small Medium
Grand total
Man
ufa
cturi
ng
Ser
vic
e
Tra
din
g
Tota
l
Man
ufa
cturi
ng
Ser
vic
e
Tra
din
g
Tota
l
Man
ufa
cturi
ng
Ser
vic
e
Tra
din
g
Tota
l
High 3 1 6 10 71.43% 0 0 1 1 25.00% 0 0 0 0 0.00% 11 57.90%
Moderate 1 2 0 3 21.43% 0 1 2 3 75.00% 1 0 0 1 100.0% 7 36.80%
Low 1 0 0 1 7.14% 0 0 0 0 0.00% 0 0 0 0 0.00% 1 5.30%
Not at all 0 0 0 0 0.00% 0 0 0 0 0.00% 0 0 0 0 0.00% 0 0.00%
Total 5 3 6 14 100.0% 0 1 3 4 100.0% 1 0 0 1 100.0% 19 100.0%
Source: Data from TNA research, 2017
As regards the online training effects to the
trained employees’ performance, 58% of the
surveyed enterprises rated this form of
training as highly effective in boosting their
employees’ performance, 37% of SMEs
rated training effect as moderate, while only
5% rated as low effect. No enterprise rated
the online training as not at all effective.
FIGURE 10 - Online training impact to employee performance
58%
37%
5% 0%
High
Moderate
Low
Not at all

Page | 24…
3.2.7. The way of organizing trainings
From the perspective of organizing trainings, with internal experts (within the enterprise) and/or external
experts (outsourced experts), it results that 46% of the surveyed enterprises, which have conducted training
for the staff of their enterprises, have carried out the training with experts outside the enterprise (outsourced
local experts). The comparative results in this regard are shown in detail in Table 13.
TABLE 13 - Organization of training activities
How was the training
organized?
Micro Small Medium
Grand total
Man
ufa
cturi
ng
Ser
vic
e
Tra
din
g
Tota
l
Man
ufa
cturi
ng
Ser
vic
e
Tra
din
g
Tota
l
Man
ufa
cturi
ng
Ser
vic
e
Tra
din
g
Tota
l
Internal - provided by the
staff of the enterprise 14 3 2 19 12.3% 6 3 1 10 16.1% 7 1 1 9 29.0% 38 15.3%
External - provided by
outsourced local experts 51 21 17 89 57.4% 10 0 9 19 30.6% 5 1 0 6 19.4% 114 46.0%
External - provided by
outsourced international
experts
8 1 13 22 14.2% 4 2 7 13 21.0% 2 1 0 3 9.7% 38 15.3%
Combined 11 8 6 25 16.1% 11 1 8 20 32.3% 10 0 3 13 41.9% 58 23.4%
Total 84 33 38 155 100% 31 6 25 62 100% 24 3 4 31 100% 248 100%
Source: Data from TNA research, 2017
FIGURE 11 - Organization of training activities
Based on the data obtained from the research, it has been observed that 15% of enterprises have organized
internal training activities (with experts within the enterprise). The largest numbers of training attended were
external training (outsourced), with local experts, with around 46%, while 15% are external training
activities with international experts, and 24% of training activities were organized as combination of local
and international experts, within or outside the enterprise.
15%
46%
15%
24% Internal - provided by the staff of theenterprise
External - provided by outsourced localexperts
External - provided by outsourcedinternational experts
Combined

Page | 25…
3.2.8. Main funding source of training activities in the past
In terms of training financing sources, it turns out that the majority of surveyed enterprises, or 57% of them
trained their employees in the past, funded training activities from their own sources, respectively from the
enterprise budget.
Funding sources of training in the past are given in more detail in Table 14.
TABLE 14- The main funding source of training
What was the main
funding source of
training activities?
Micro Small Medium
Grand total
Man
ufa
cturi
ng
Ser
vic
e
Tra
din
g
Tota
l
Man
ufa
cturi
ng
Ser
vic
e
Tra
din
g
Tota
l
Man
ufa
cturi
ng
Ser
vic
e
Tra
din
g
Tota
l
Own-sources 38 16 24 78 48.40% 17 4 18 39 70.91% 21 1 4 26 81.25% 143 57.70%
Employees 9 5 4 18 11.20% 3 0 1 4 7.28% 2 0 0 2 6.25% 24 9.70%
Public institutions 17 8 4 29 18.00% 1 0 2 3 5.45% 2 0 0 2 6.25% 34 13.70%
International
organizations 21 5 7 33 20.50% 4 0 2 6 10.91% 1 0 0 1 3.12% 40 16.10%
Other 1 2 0 3 1.90% 2 0 1 3 5.45% 0 1 0 1 3.13% 7 2.80%
Total 86 36 39 161 100.0% 27 4 24 55 100.0% 26 2 4 32 100.0% 248 100.0%
Source: Data from TNA research, 2017
Figure 12 shows that 57.7% of surveyed
enterprises used their own financial
resources to organize the necessary training
activities, while 16.1% of them ensured
funds from international organizations, from
public institutions 13.7%, from employees
9.7%, as well as from other sources (usually
from the headquarters of the enterprise)
2.8%.
Also, if viewed from financing structure
based on the size of the enterprises, there is a
similar structure with funding resources
dominating at micro and small and medium
enterprises.
FIGURE 12- The main funding source of training activities
57.70%
9.70%
13.70%
16.10%2.80%
Own-sources
Employees
Public institutions
Internationalorganizations
Other

Page | 26…
3.2.9. Assessment of training benefits against training costs
As noted above, out of a total of 248 enterprises that have trained employees in the past, 143 or 57% of
them have used their own budget for the organization of training activities. Table 15 indicates the level of
satisfaction of surveyed SMEs with the benefits of training compared to the cost of such training
organization.
TABLE 15 Assessment of training benefits against training costs by respondents
If it was funded by
own resources, what
was the cost of
training compared
against benefits?
Micro Small Medium
Grand total
Man
ufa
cturi
ng
Ser
vic
e
Tra
din
g
Tota
l
Man
ufa
cturi
ng
Ser
vic
e
Tra
din
g
Tota
l
Man
ufa
cturi
ng
Ser
vic
e
Tra
din
g
Tota
l
High 1 2 3 6 7.79% 0 0 0 0 0.00% 2 0 1 3 10.70% 9 6.29%
Moderate 13 7 13 33 42.86% 12 1 14 27 71.06% 10 0 1 11 39.30% 71 49.66%
Low 15 4 3 22 28.57% 3 1 2 6 15.79% 6 1 1 8 28.60% 36 25.17%
Not at all 3 1 2 6 7.79% 0 1 1 2 5.26% 2 0 1 3 10.70% 11 7.69%
No answer 7 2 1 10 12.99% 1 1 1 3 7.89% 3 0 0 3 10.70% 16 11.19%
Total 39 16 22 77 100.0% 16 4 18 38 100.0% 23 1 4 28 100.0% 143 100.0%
Source: Data from TNA research, 2017
As is can be noted from survey data
presented in Figure 13, the vast majority of
surveyed enterprises, around 50%, assess the
organized training as being moderately
costly in relation to the benefits received
from them, while 25% of respondents rated
as low, 8% not at all costly, 6% rated as high,
and 11% did not answer.
If viewed from size of the enterprises, one
can note a similar structure of responses to
all three types of enterprises, such as micro,
small and medium enterprises, where the
‘moderate’ response dominates, followed by
‘low’.
FIGURE 13 - Assessment of training benefits against training costs by
respondents
6%
50%25%
8%
11%
High
Moderate
Low
Not at all
No answer

Page | 27…
3.2.10. Reasons for not attending trainings in the past
Out of 800 surveyed enterprises, 552 or 69% of them stated that they did not attend any training in the past.
The reasons for not attending trainings was analysed during the research and based on the enterprises
responses it results that 42% of them did not consider training as necessary, followed by the other responses
presented in Table 16.
TABLE 16 - Reasons for not attending trainings
The reasons for not
attending previous
trainings
Micro Small Medium
Grand total
Man
ufa
cturi
ng
Ser
vic
e
Tra
din
g
Tota
l
Man
ufa
cturi
ng
Ser
vic
e
Tra
din
g
Tota
l
Man
ufa
cturi
ng
Ser
vic
e
Tra
din
g
Tota
l
High cost 15 8 8 31 7.00% 4 1 3 8 8.50% 1 0 1 2 11.80% 41 7.40%
Trainings have not been
considered necessary 93 16 75 184 41.70% 17 5 20 42 44.70% 6 1 3 10 58.80% 236 42.80%
We did not know about
training opportunities 69 18 62 149 33.80% 14 0 14 28 29.80% 2 1 1 4 23.50% 181 32.80%
Training opportunities
din not fit us 27 6 14 47 10.70% 7 0 4 11 11.70% 0 0 1 1 5.90% 59 10.70%
Other 11 6 13 30 6.80% 0 0 5 5 5.30% 0 0 0 0 0.00% 35 6.30%
Total 215 54 172 441 100.0% 42 6 46 94 100.0% 9 2 6 17 100% 552 100.0%
Source: Data from TNA research, 2017
The research found that the reason for not attending trainings for a large number of enterprises i.e. 43%
of them was that they did not consider the training as necessary, 33% stated that they did not know about
the training opportunities, 11% of them stated that opportunities offered for training did not fit them, 7%
stated that the costs were high, while 6% provided other answers.
FIGURE 14 - Reasons for not attending training activities
7%
43%
33%
11%6%
High cost
Trainings have notbeen considerednecessary
We did not knowabout trainingopportunities
Trainingopportunities dinnot fit us

Page | 28…
3.2.11. Obstacles and difficulties during the work process and the challenges of SMEs
due non-participation in training
The following analysis which was conducted for the purpose of identifying difficulties the enterprises face
due to non-participation in training showed that insufficient sales are the main challenges for SMEs.
The assessments of the surveyed enterprises in relation to this issue are listed in the Table 17.
TABLE 17 - Obstacles/difficulties during the work process and the challenges of SMEs due to the non-participation in training
What are the
obstacles/difficulties
Micro Small Medium
Total
Man
ufa
cturi
ng
Ser
vic
e
Tra
din
g
Tota
l
Man
ufa
cturi
ng
Ser
vic
e
Tra
din
g
Tota
l
Man
ufa
cturi
ng
Ser
vic
e
Tra
din
g
Tota
l
Poor management of the
enterprise 1 3 4 8 1.82% 0 1 1 2 2.13% 0 0 0 0 0.00% 10 1.81%
No appropriate control 8 3 7 18 4.09% 6 0 3 9 9.57% 0 0 1 1 5.56% 28 5.07%
Insufficient sales 82 18 76 176 40.00% 11 0 11 22 23.40% 3 1 1 5 27.78% 203 36.78%
Inadequate marketing 30 12 29 71 16.14% 7 1 11 19 20.22% 1 0 0 1 5.55% 91 16.49%
Output and efficiency in
production/service 16 3 2 21 4.77% 7 2 2 11 11.70% 4 0 0 4 22.22% 36 6.52%
Other 7 2 4 13 2.95% 3 0 2 5 5.32% 0 0 0 0 0.00% 18 3.26%
No answer 70 14 49 133 30.23% 8 2 16 26 27.66% 2 1 4 7 38.89% 166 30.07%
Total 214 55 171 440 100.0% 42 6 46 94 100.0% 10 2 6 18 100.0% 552 100.0%
Source: Data from TNA research, 2017
37% of the surveyed enterprises state that the difficulties they encounter due to non-participation in training
are inadequate sales, while 16.5% of them point to the lack of adequate marketing.
Other obstacles mentioned by the surveyed SMEs were poor management of the enterprise (2%), no
adequate control (5%), output and efficiency in production or services (3%), and other (3%), while on the
other hand, 30% of SMEs have not responded to this question.
FIGURE 15 - Obstacles/difficulties during the work process and the challenges of SMEs due to the lack of participation in
training
2% 5%
37%
16%
7%
3%
30%
Poor management of the enterprise
No appropriate control
Insufficient sales
Inadequate marketing
Output and efficiency inproduction/service
Other
No answer
Page | 29…
3.3. PART III – SMEs training needs in the future
Part three of the questionnaire, consequently of this research contains information on future training
needs. 74 types of training grouped into 3 main categories are listed in the questionnaire:
o Management training;
o Operational/Administrative training; and
o Professional/Technical training.
The SME training needs assessment for the above trainings activities is carried out through three (3)
ratings (score), where:
o 0 - Implies that enterprises need no training activities;
o 1 - Implies that enterprises need training activities to some extent; and
o 2 - Implies that enterprises highly need training activities.
In the following part of this report the needs of SMEs for these trainings were analysed in detail, whereby
we mapped SMEs immediate and long-term training needs.
3.1.3. Management training needs of enterprises
In the Management training part, a total of 37 trainings considered the most important of this field were
chosen, where the same are divided into six (6) main training groups, including:
o Management Training;
o Human Resources;
o Public Procurement and Tendering;
o Financial Management;
o Market Analysis; and
o Marketing.
This part analysed the Management Training needs of surveyed SMEs, and we mapped enterprise
immediate and long-term training needs.
3.3.1.1. Management Training Needs
The category “Management Training’ included training such as: overall enterprise management, strategic
planning and organization, business plan development, managerial decision making, and the alike. Tables
18, 19 and 20 list the trainings from these fields, as well as the needs of the surveyed SMEs to attend
these trainings:

Page | 30…
TABLE 18 - Management training needs of Micro-enterprises
MANAGEMENT TRAINING
Micro
Manufacturing Service Trading Total
0 1 2 0 1 2 0 1 2 0 1 2
Strategic planning and organization 209 43 48 67 7 16 138 29 43 69.00% 13.17% 17.83%
Business plan 166 33 101 51 6 33 115 30 65 55.33% 11.50% 33.17%
Overall enterprise management 223 23 54 66 7 17 143 18 49 72.00% 8.00% 20.00%
Management decision-making 267 15 18 84 3 3 188 6 16 89.83% 4.00% 6.17%
Quality management and enterprise 267 10 23 83 3 4 188 7 15 89.67% 3.33% 7.00%
Risk management and assessment 273 12 15 85 1 4 194 9 7 92.00% 3.67% 4.33%
Business presentation and
representation 252 12 36 77 2 11 168 9 33 82.83% 3.83% 13.33%
Pursue of audit recommendations 291 5 4 86 2 2 203 3 4 96.67% 1.67% 1.67%
Source: Data from TNA research, 2017
TABLE 19–Management training needs of Small-enterprises
MANAGEMENT TRAINING
Small
Manufacturing Service Trading Total
0 1 2 0 1 2 0 1 2 0 1 2
Strategic planning and organization 40 6 24 6 1 3 45 10 15 60.67% 11.33% 28.00%
Business plan 41 7 22 6 1 3 47 9 14 62.67% 11.33% 26.00%
Overall enterprise management 44 6 20 7 0 3 44 8 18 63.33% 9.33% 27.33%
Management decision-making 54 4 12 6 2 2 53 9 8 75.33% 10.00% 14.67%
Quality management and enterprise 58 3 9 8 1 1 54 6 10 80.00% 6.67% 13.33%
Risk management and assessment 60 5 5 8 1 1 60 4 6 85.33% 6.67% 8.00%
Business presentation and
representation 50 3 17 10 0 0 48 8 14 72.00% 7.33% 20.67%
Pursue of audit recommendations 66 2 2 9 0 1 67 0 3 94.67% 1.33% 4.00%
Source: Data from TNA research, 2017
TABLE 20–Management training needs of Medium-enterprises
MANAGEMENT TRAINING
Medium
Manufacturing Service Trading Total
0 1 2 0 1 2 0 1 2 0 1 2
Strategic planning and organization 21 7 7 3 1 1 6 2 2 60.00% 20.00% 20.00%
Business plan 20 9 6 4 0 1 7 2 1 62.00% 22.00% 16.00%
Overall enterprise management 21 6 8 4 0 1 5 1 4 60.00% 14.00% 26.00%
Management decision-making 26 6 3 4 1 0 8 1 1 76.00% 16.00% 8.00%
Quality management and enterprise 23 6 6 4 1 0 9 0 1 72.00% 14.00% 14.00%
Risk management and assessment 25 5 5 4 0 1 8 1 1 74.00% 12.00% 14.00%
Business presentation and representation 22 5 8 4 1 0 5 2 3 62.00% 16.00% 22.00%
Pursue of audit recommendations 28 4 3 4 0 1 8 1 1 80.00% 10.00% 10.00%
Source: Data from TNA research, 2017
Figure 16 shows graphically the needs of enterprises for management training, as mentioned above, the
greatest need has been indicated for business plan design training, which is rated as “high’ by 30.75% of

Page | 31…
enterprises, ‘to some extent’ by 12.3% of them, while it is considered as unnecessary by 57.13%. Another
important topic under this category is enterprise management training, which was rated as ‘high’ by
21.75% of SMEs, as ‘to some extent’ by 8.63% of enterprises and irrelevant by 69.93% of the surveyed
SMEs. Strategic planning and organization is also considered as a necessary training by the surveyed
SMEs, where 19.88% of enterprises rated it as “high’, while 13.25% stated that this training is somewhat
necessary in their enterprises. A relatively large share of respondents, or 66.88%, rated this training as
irrelevant to their activity.
FIGURE 16–Management training need
3.3.1.2. Human resources training needs
The category of human resources training covers areas such as human resources management, delegation
of responsibilities, performance monitoring and measurement, and time management. Tables 21, 22 and
23below indicate survey outcomes for training needs of SMEs in this field.
TABLE 21–Human resources training needs of Micro-enterprise
HUMAN RESOURCES
Micro
Manufacturing Service Trading Total
0 1 2 0 1 2 0 1 2 0 1 2
Human resources management 271 15 14 86 2 2 194 7 9 91.83% 4.00% 4.17%
Delegation of responsibilities 283 11 6 83 2 5 202 6 2 94.67% 3.17% 2.17%
Performance monitoring and
measurement 274 11 15 83 3 4 194 9 7 91.83% 3.83% 4.33%
Motivation 272 13 15 81 3 6 189 11 10 90.33% 4.50% 5.17%
Time management 264 12 24 81 3 6 188 10 12 88.83% 4.17% 7.00%
Source: Data from TNA research, 2017
TABLE 22–Human resources training needs of Small-enterprise
HUMAN RESOURCES
Small
Manufacturing Service Trading Total
0 1 2 0 1 2 0 1 2 0 1 2
Human resources management 52 5 13 6 1 3 52 7 11 73.33% 8.67% 18.00%
Delegation of responsibilities 60 3 7 6 1 3 60 4 6 84.00% 5.33% 10.67%
95.25%
79.50%
89.63%
86.75%
86.25%
69.63%
57.13%
66.88%
2.13%
5.25%
4.75%
4.63%
5.88%
8.63%
12.13%
13.25%
2.63%
15.25%
5.63%
8.63%
7.88%
21.75%
30.75%
19.88%
0.00% 20.00% 40.00% 60.00% 80.00% 100.00% 120.00%
Pursue of audit recommendations
Business presentation and representation
Risk management and assessment
Quality management and enterprise
Management decision-making
Overall enterprise management
Business plan
Strategic planning and organization
0 - Implies that enterprises need no training activities;
1 - Implies that enterprises need training activities to some extent; and
2 - Implies that enterprises highly need training activities.
Page | 32…
Performance monitoring and
measurement 51 7 12 6 3 1 58 9 3 76.67% 12.67% 10.67%
Motivation 53 6 11 6 1 3 56 6 8 76.67% 8.67% 14.67%
Time management 55 4 11 7 1 2 53 7 10 76.67% 8.00% 15.33%
Source: Data from TNA research, 2017
TABLE 23–Human resources training needs of Medium-enterprise
HUMAN RESOURCES
Medium
Manufacturing Service Trading Total
0 1 2 0 1 2 0 1 2 0 1 2
Human resources management 23 3 9 4 0 1 5 2 3 64.00% 10.00% 26.00%
Delegation of responsibilities 27 4 4 4 0 1 8 1 1 78.00% 10.00% 12.00%
Performance monitoring and
measurement 23 6 6 4 0 1 9 0 1 72.00% 12.00% 16.00%
Motivation 25 4 6 4 0 1 7 2 1 72.00% 12.00% 16.00%
Time management 25 4 6 4 0 1 8 1 1 74.00% 10.00% 16.00%
Source: Data from TNA research, 2017
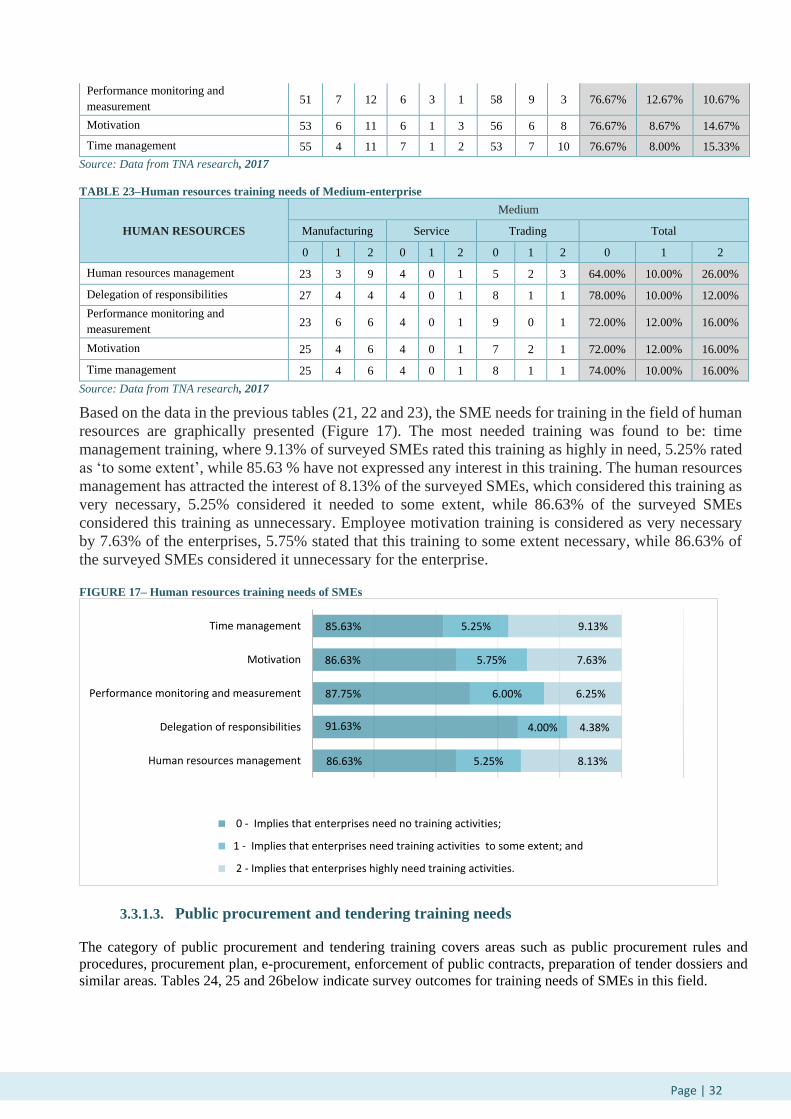
Based on the data in the previous tables (21, 22 and 23), the SME needs for training in the field of human
resources are graphically presented (Figure 17). The most needed training was found to be: time
management training, where 9.13% of surveyed SMEs rated this training as highly in need, 5.25% rated
as ‘to some extent’, while 85.63 % have not expressed any interest in this training. The human resources
management has attracted the interest of 8.13% of the surveyed SMEs, which considered this training as
very necessary, 5.25% considered it needed to some extent, while 86.63% of the surveyed SMEs
considered this training as unnecessary. Employee motivation training is considered as very necessary
by 7.63% of the enterprises, 5.75% stated that this training to some extent necessary, while 86.63% of
the surveyed SMEs considered it unnecessary for the enterprise. FIGURE 17– Human resources training needs of SMEs
3.3.1.3. Public procurement and tendering training needs
The category of public procurement and tendering training covers areas such as public procurement rules and
procedures, procurement plan, e-procurement, enforcement of public contracts, preparation of tender dossiers and
similar areas. Tables 24, 25 and 26below indicate survey outcomes for training needs of SMEs in this field.
86.63%
91.63%
87.75%
86.63%
85.63%
5.25%
4.00%
6.00%
5.75%
5.25%
8.13%
4.38%
6.25%
7.63%
9.13%
Human resources management
Delegation of responsibilities
Performance monitoring and measurement
Motivation
Time management
0 - Implies that enterprises need no training activities;
1 - Implies that enterprises need training activities to some extent; and
2 - Implies that enterprises highly need training activities.

Page | 33…
TABLE 24–Public procurement and tendering training needs of Micro-enterprises
PUBLIC PROCUREMENT AND
TENDERING
Micro
Manufacturing Service Trading Total
0 1 2 0 1 2 0 1 2 0 1 2
National rules and procedures applied in
public procurement 265 20 15 82 5 3 182 15 13 88.17% 6.67% 5.17%
Procurement planning 264 18 18 83 3 4 181 13 16 88.00% 5.67% 6.33%
Electronic procurement 264 13 23 82 2 6 180 9 21 87.67% 4.00% 8.33%
Enforcement of public contracts 270 12 18 83 3 4 185 6 19 89.67% 3.50% 6.83%
Preparation of Terms of Reference 276 10 14 82 4 4 189 10 11 91.17% 4.00% 4.83%
Preparation of tender dossiers,
launching calls for tenders 271 12 17 82 1 7 192 8 10 90.83% 3.50% 5.67%
Tender evaluation committee/
Shortlisting panel 278 12 10 85 1 4 197 8 5 93.33% 3.50% 3.17%
Tendering procedures for
services/goods/works/grants 273 13 14 83 2 5 194 8 8 91.67% 3.83% 4.50%
Source: Data from TNA research, 2017
TABLE 25–Public procurement and tendering training needs of Small-enterprises
PUBLIC PROCUREMENT AND
TENDERING
Small
Manufacturing Service Trading Total
0 1 2 0 1 2 0 1 2 0 1 2
National rules and procedures applied in
public procurement 54 7 9 8 1 1 56 8 6 78.67% 10.67% 10.67%
Procurement planning 52 5 13 9 1 0 59 4 7 80.00% 6.67% 13.33%
Electronic procurement 52 5 13 9 1 0 56 6 8 78.00% 8.00% 14.00%
Enforcement of public contracts 54 7 9 9 1 0 59 5 6 81.33% 8.67% 10.00%
Preparation of Terms of Reference 58 6 6 9 1 0 59 5 6 84.00% 8.00% 8.00%
Preparation of tender dossiers,
launching calls for tenders 59 4 7 9 1 0 56 5 9 82.67% 6.67% 10.67%
Tender evaluation committee/
Shortlisting panel 63 3 4 8 1 1 62 3 5 88.67% 4.67% 6.67%
Tendering procedures for
services/goods/works/grants 60 3 7 9 1 0 62 3 5 87.33% 4.67% 8.00%
Source: Data from TNA research, 2017
TABLE 26–Public procurement and tendering training needs of Medium-enterprises
PUBLIC PROCUREMENT AND
TENDERING
Medium
Manufacturing Service Trading Total
0 1 2 0 1 2 0 1 2 0 1 2
National rules and procedures applied in
public procurement 27 3 5 4 0 1 8 0 2 78.00% 6.00% 16.00%
Procurement planning 26 5 4 4 0 1 8 0 2 76.00% 10.00% 14.00%
Electronic procurement 27 4 4 4 0 1 6 1 3 74.00% 10.00% 16.00%
Enforcement of public contracts 28 3 4 5 0 0 8 0 2 82.00% 6.00% 12.00%
Preparation of Terms of Reference 29 3 3 4 0 1 8 0 2 82.00% 6.00% 12.00%

Page | 34…
Preparation of tender dossiers, launching
calls for tenders 28 2 5 5 0 0 8 1 1 82.00% 6.00% 12.00%
Tender evaluation committee/
Shortlisting panel 28 2 5 5 0 0 9 0 1 84.00% 4.00% 12.00%
Tendering procedures for
services/goods/works/grants 27 4 4 5 0 0 7 0 3 78.00% 8.00% 14.00%
Source: Data from TNA research, 2017
Figure 18 shows the needs of surveyed SMEs for training in the area of public procurement and tendering.
Training qualified as the most needed by this category of training is e-procurement training, which is
considered as very necessary by 9.88% of surveyed SMEs, to some extent by 5.13% of surveyed SMEs,
while 85% considered it as irrelevant to their activity.
Another training of interest for the surveyed SMEs was training on procurement planning, where 8.13%
of enterprises rated it as very necessary, 6.13% to some extent necessary and 85.75% as unnecessary.
Enforcement of public contracts has attracted the interest of 7.75% of the surveyed SMEs that rated it as
very necessary, 4.63% as to some extent necessary, while 87.63% of the respondents considered it
irrelevant.
FIGURE 18–Public procurement and tendering training need of SMEs
3.3.1.4. Financial management training needs
The training provided under this category covers areas such as financial and investment planning, cost-
benefit analysis, fund planning and flow, certification, etc. Tables 27, 28 and 29 below indicate survey
outcomes for training needs of SMEs in this field. TABLE 27–Financial management training needs of Micro-enterprises
FINANCIAL MANAGEMENT
Micro
Manufacturing Service Trading Total
0 1 2 0 1 2 0 1 2 0 1 2
Financial planning 285 8 7 86 2 2 198 10 2 94.83% 3.33% 1.83%
Investment planning 282 7 11 85 3 2 199 9 2 94.33% 3.17% 2.50%
Product/business cost-benefit analysis 285 5 10 86 3 1 200 5 5 95.17% 2.17% 2.67%
Fund flow 293 3 4 88 2 0 202 7 1 97.17% 2.00% 0.83%
Fund planning 287 8 5 88 1 1 205 2 3 96.67% 1.83% 1.50%
85.75%
85.75%
85.00%
87.63%
89.25%
88.75%
91.88%
90.00%
7.38%
6.13%
5.13%
4.63%
4.88%
4.25%
3.75%
4.25%
6.88%
8.13%
9.88%
7.75%
5.88%
7.00%
4.38%
5.75%
National rules and procedures applied in public procurement
Procurement planning
Electronic procurement
Enforcement of public contracts
Preparation of Terms of Reference
Preparation of tender dossiers, launching calls for tenders
Tender evaluation committee/ Shortlisting panel
Tendering procedures for services/goods/works/grants
0 - Implies that enterprises need no training activities;
1 - Implies that enterprises need training activities to some extent; and
2 - Implies that enterprises highly need training activities.

Page | 35…
Soliciting funds from EC (European
Commission) 249 4 47 81 4 5 198 5 7 88.00% 2.17% 9.83%
Expenditure certification/verification 294 2 4 90 0 0 208 0 2 98.67% 0.33% 1.00%
Program closure 298 1 1 89 1 0 207 2 1 99.00% 0.67% 0.33%
Reallocation of funds 298 1 1 89 1 0 208 1 1 99.17% 0.50% 0.33%
Source: Data from TNA research, 2017
TABLE 28–Financial management training needs of Small-enterprises
FINANCIAL MANAGEMENT
Small
Manufacturing Service Trading Total
0 1 2 0 1 2 0 1 2 0 1 2
Financial planning 58 8 4 8 2 0 63 4 3 86.00% 9.33% 4.67%
Investment planning 59 6 5 8 2 0 62 3 5 86.00% 7.33% 6.67%
Product/business cost-benefit analysis 64 3 3 9 0 1 62 3 5 90.00% 4.00% 6.00%
Fund flow 66 3 1 10 0 0 65 3 2 94.00% 4.00% 2.00%
Fund planning 66 3 1 9 1 0 64 3 3 92.67% 4.67% 2.67%
Soliciting funds from (European
Commission) 49 1 20 9 1 0 60 3 7 78.67% 3.33% 18.00%
Expenditure certification/verification 65 0 5 10 0 0 62 4 4 91.33% 2.67% 6.00%
Program closure 68 1 1 10 0 0 67 1 2 96.67% 1.33% 2.00%
Reallocation of funds 68 1 1 10 0 0 66 3 1 96.00% 2.67% 1.33%
Source: Data from TNA research, 2017
TABLE 29–Financial management training needs of Medium-enterprises
FINANCIAL MANAGEMENT
Medium
Manufacturing Service Trading Total
0 1 2 0 1 2 0 1 2 0 1 2
Financial planning 30 4 1 4 0 1 8 0 2 84.00% 8.00% 8.00%
Investment planning 30 3 2 4 0 1 9 0 1 86.00% 6.00% 8.00%
Product/business cost-benefit analysis 30 4 1 4 1 0 9 0 1 86.00% 10.00% 4.00%
Fund flow 31 3 1 4 1 0 9 0 1 88.00% 8.00% 4.00%
Fund planning 31 3 1 4 1 0 9 0 1 88.00% 8.00% 4.00%
Soliciting funds from (European
Commission) 24 1 10 4 1 0 9 0 1 74.00% 4.00% 22.00%
Expenditure certification/verification 30 2 3 5 0 0 9 0 1 88.00% 4.00% 8.00%
Program closure 32 2 1 5 0 0 9 0 1 92.00% 4.00% 4.00%
Reallocation of funds 31 3 1 5 0 0 9 0 1 90.00% 6.00% 4.00%
Source: Data from TNA research, 2017
The training qualified as the most necessary under this training category was training on soliciting of
funds from European Commission (EC) which is rated as “high” by 12.13% of the surveyed SMEs, ‘to
some extent’ 2.5% of them, while 85.38% of the respondents considered it as not relevant for their
activity. Investment planning has attracted the interest of 3.63% of SMEs that rated it as “high’, and
4.13% of them rated as to some extent necessary, compared to 92.25% of SMEs that considered this
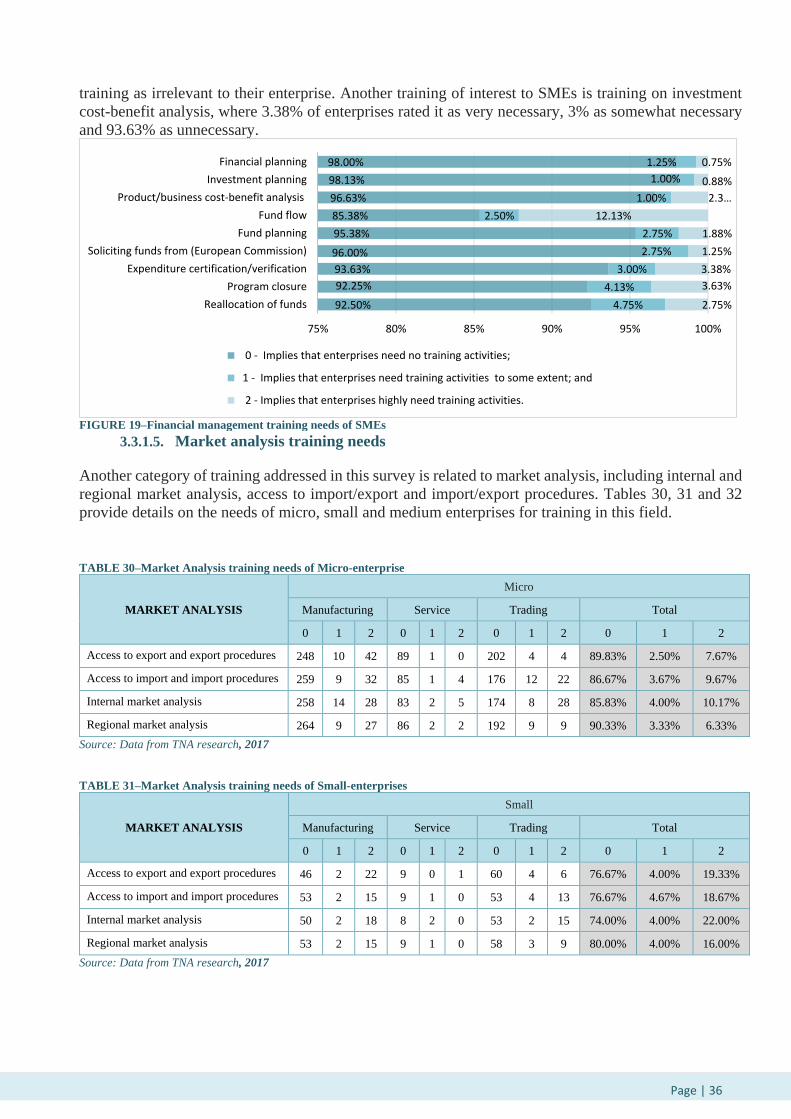
Page | 36…
training as irrelevant to their enterprise. Another training of interest to SMEs is training on investment
cost-benefit analysis, where 3.38% of enterprises rated it as very necessary, 3% as somewhat necessary
and 93.63% as unnecessary.
FIGURE 19–Financial management training needs of SMEs
3.3.1.5. Market analysis training needs
Another category of training addressed in this survey is related to market analysis, including internal and
regional market analysis, access to import/export and import/export procedures. Tables 30, 31 and 32
provide details on the needs of micro, small and medium enterprises for training in this field.
TABLE 30–Market Analysis training needs of Micro-enterprise
MARKET ANALYSIS
Micro
Manufacturing Service Trading Total
0 1 2 0 1 2 0 1 2 0 1 2
Access to export and export procedures 248 10 42 89 1 0 202 4 4 89.83% 2.50% 7.67%
Access to import and import procedures 259 9 32 85 1 4 176 12 22 86.67% 3.67% 9.67%
Internal market analysis 258 14 28 83 2 5 174 8 28 85.83% 4.00% 10.17%
Regional market analysis 264 9 27 86 2 2 192 9 9 90.33% 3.33% 6.33%
Source: Data from TNA research, 2017
TABLE 31–Market Analysis training needs of Small-enterprises
MARKET ANALYSIS
Small
Manufacturing Service Trading Total
0 1 2 0 1 2 0 1 2 0 1 2
Access to export and export procedures 46 2 22 9 0 1 60 4 6 76.67% 4.00% 19.33%
Access to import and import procedures 53 2 15 9 1 0 53 4 13 76.67% 4.67% 18.67%
Internal market analysis 50 2 18 8 2 0 53 2 15 74.00% 4.00% 22.00%
Regional market analysis 53 2 15 9 1 0 58 3 9 80.00% 4.00% 16.00%
Source: Data from TNA research, 2017
92.50%
92.25%
93.63%
96.00%
95.38%
85.38%
96.63%
98.13%
98.00%
4.75%
4.13%
3.00%
2.75%
2.75%
2.50%
1.00%
1.00%
1.25%
2.75%
3.63%
3.38%
1.25%
1.88%
12.13%
2.3…
0.88%
0.75%
75% 80% 85% 90% 95% 100%
Reallocation of funds
Program closure
Expenditure certification/verification
Soliciting funds from (European Commission)
Fund planning
Fund flow
Product/business cost-benefit analysis
Investment planning
Financial planning
0 - Implies that enterprises need no training activities;
1 - Implies that enterprises need training activities to some extent; and
2 - Implies that enterprises highly need training activities.

Page | 37…
TABLE 32 - Market Analysis training needs of Medium-enterprises
MARKET ANALYSIS
Medium
Manufacturing Service Trading Total
0 1 2 0 1 2 0 1 2 0 1 2
Access to export and export procedures 16 4 15 5 0 0 6 0 4 54.00% 8.00% 38.00%
Access to import and import procedures 20 5 10 5 0 0 7 0 3 64.00% 10.00% 26.00%
Internal market analysis 19 3 13 4 0 1 7 0 3 60.00% 6.00% 34.00%
Regional market analysis 21 3 11 5 0 0 9 0 1 70.00% 6.00% 24.00%
Source: Data from TNA research, 2017
Figure 20 shows the needs of enterprises in the area of market analysis, where training on internal market
analysis is estimated as very necessary by 13.88% of SMEs, as ‘to some extent’ by 4.13% of them, while
82% of the surveyed enterprises stated that this training is not relevant to their activity. Training on access
to import and import procedures was rated as ‘high’ by 12.38% of SMEs, 4.25% rated as ‘to some extent’
necessary, while 83.38% considered it unnecessary. Another training of interest to SMEs is training on
export access and export procedures, estimated as very necessary by 11.75% of the surveyed enterprises,
to some extent necessary by 3.13% of them, and not necessary by 85.13% of surveyed SMEs. On the
other hand, 9.25% of the surveyed enterprises stated that training on regional market analysis is very
necessary, followed by 3.63% rated as to some extent necessary, whereas the majority of respondents
(87.13%) evaluated it as not necessary for their activity.
FIGURE 20–Market Analysis training needs of SMEs
85.13%
83.38%
82.00%
87.13%
3.13%
4.25%
4.13%
3.63%
11.75%
12.38%
13.88%
9.25%
0% 10% 20% 30% 40% 50% 60% 70% 80% 90% 100%
Access to export and export procedures
Access to import and import procedures
Internal market analysis
Regional market analysis
0 - Implies that enterprises need no training activities;
1 - Implies that enterprises need training activities to some extent; and
2 - Implies that enterprises highly need training activities.
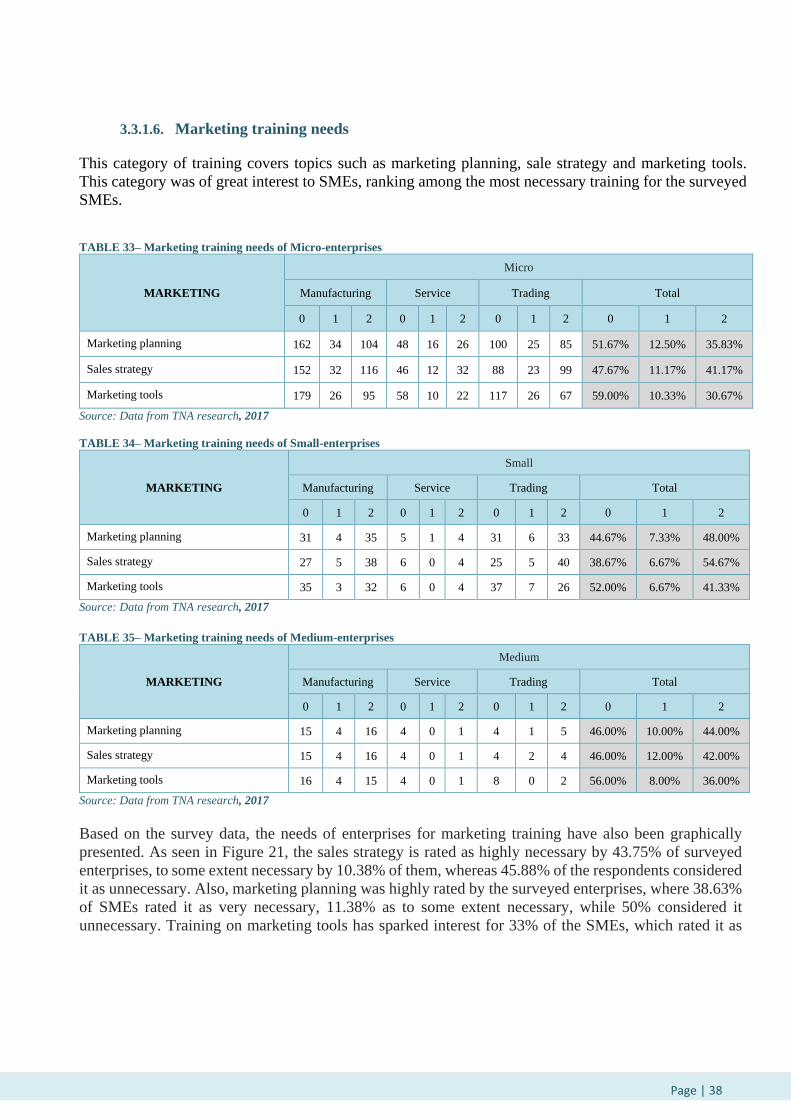
Page | 38…
3.3.1.6. Marketing training needs
This category of training covers topics such as marketing planning, sale strategy and marketing tools.
This category was of great interest to SMEs, ranking among the most necessary training for the surveyed
SMEs.
TABLE 33– Marketing training needs of Micro-enterprises
MARKETING
Micro
Manufacturing Service Trading Total
0 1 2 0 1 2 0 1 2 0 1 2
Marketing planning 162 34 104 48 16 26 100 25 85 51.67% 12.50% 35.83%
Sales strategy 152 32 116 46 12 32 88 23 99 47.67% 11.17% 41.17%
Marketing tools 179 26 95 58 10 22 117 26 67 59.00% 10.33% 30.67%
Source: Data from TNA research, 2017
TABLE 34– Marketing training needs of Small-enterprises
MARKETING
Small
Manufacturing Service Trading Total
0 1 2 0 1 2 0 1 2 0 1 2
Marketing planning 31 4 35 5 1 4 31 6 33 44.67% 7.33% 48.00%
Sales strategy 27 5 38 6 0 4 25 5 40 38.67% 6.67% 54.67%
Marketing tools 35 3 32 6 0 4 37 7 26 52.00% 6.67% 41.33%
Source: Data from TNA research, 2017
TABLE 35– Marketing training needs of Medium-enterprises
MARKETING
Medium
Manufacturing Service Trading Total
0 1 2 0 1 2 0 1 2 0 1 2
Marketing planning 15 4 16 4 0 1 4 1 5 46.00% 10.00% 44.00%
Sales strategy 15 4 16 4 0 1 4 2 4 46.00% 12.00% 42.00%
Marketing tools 16 4 15 4 0 1 8 0 2 56.00% 8.00% 36.00%
Source: Data from TNA research, 2017
Based on the survey data, the needs of enterprises for marketing training have also been graphically
presented. As seen in Figure 21, the sales strategy is rated as highly necessary by 43.75% of surveyed
enterprises, to some extent necessary by 10.38% of them, whereas 45.88% of the respondents considered
it as unnecessary. Also, marketing planning was highly rated by the surveyed enterprises, where 38.63%
of SMEs rated it as very necessary, 11.38% as to some extent necessary, while 50% considered it
unnecessary. Training on marketing tools has sparked interest for 33% of the SMEs, which rated it as
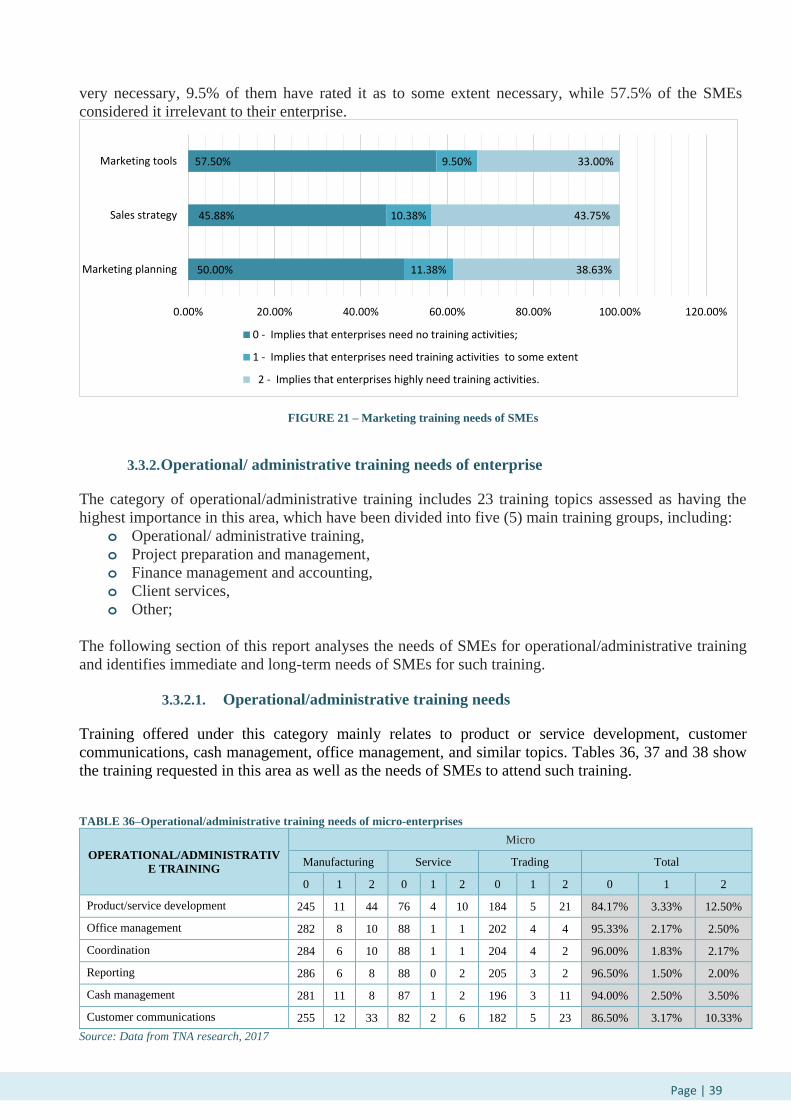
Page | 39…
very necessary, 9.5% of them have rated it as to some extent necessary, while 57.5% of the SMEs
considered it irrelevant to their enterprise.
FIGURE 21 – Marketing training needs of SMEs
3.3.2. Operational/ administrative training needs of enterprise
The category of operational/administrative training includes 23 training topics assessed as having the
highest importance in this area, which have been divided into five (5) main training groups, including:
o Operational/ administrative training,
o Project preparation and management,
o Finance management and accounting,
o Client services,
o Other;
The following section of this report analyses the needs of SMEs for operational/administrative training
and identifies immediate and long-term needs of SMEs for such training.
3.3.2.1. Operational/administrative training needs
Training offered under this category mainly relates to product or service development, customer
communications, cash management, office management, and similar topics. Tables 36, 37 and 38 show
the training requested in this area as well as the needs of SMEs to attend such training.
TABLE 36–Operational/administrative training needs of micro-enterprises
OPERATIONAL/ADMINISTRATIV
E TRAINING
Micro
Manufacturing Service Trading Total
0 1 2 0 1 2 0 1 2 0 1 2
Product/service development 245 11 44 76 4 10 184 5 21 84.17% 3.33% 12.50%
Office management 282 8 10 88 1 1 202 4 4 95.33% 2.17% 2.50%
Coordination 284 6 10 88 1 1 204 4 2 96.00% 1.83% 2.17%
Reporting 286 6 8 88 0 2 205 3 2 96.50% 1.50% 2.00%
Cash management 281 11 8 87 1 2 196 3 11 94.00% 2.50% 3.50%
Customer communications 255 12 33 82 2 6 182 5 23 86.50% 3.17% 10.33%
Source: Data from TNA research, 2017
50.00%
45.88%
57.50%
11.38%
10.38%
9.50%
38.63%
43.75%
33.00%
0.00% 20.00% 40.00% 60.00% 80.00% 100.00% 120.00%
Marketing planning
Sales strategy
Marketing tools
0 - Implies that enterprises need no training activities;
1 - Implies that enterprises need training activities to some extent
2 - Implies that enterprises highly need training activities.

Page | 40…
TABLE 37 - Operational/administrative training needs of small-enterprises
OPERATIONAL/ADMINISTRATIV
E TRAINING
Small
Manufacturing Service Trading Total
0 1 2 0 1 2 0 1 2 0 1 2
Product/service development 49 5 16 6 1 3 61 3 6 77.33% 6.00% 16.67%
Office management 58 6 6 9 0 1 63 4 3 86.67% 6.67% 6.67%
Coordination 59 4 7 9 0 1 63 4 3 87.33% 5.33% 7.33%
Reporting 59 5 6 9 0 1 66 3 1 89.33% 5.33% 5.33%
Cash management 56 7 7 8 0 2 62 3 5 84.00% 6.67% 9.33%
Customer communications 52 4 14 7 2 1 59 3 8 78.67% 6.00% 15.33%
Source: Data from TNA research, 2017
TABLE 38–Operational/administrative training needs of medium-enterprises
OPERATIONAL/ADMINISTRATIV
E TRAINING
Medium
Manufacturing Service Trading Total
0 1 2 0 1 2 0 1 2 0 1 2
Product/service development 24 3 8 3 1 1 4 1 5 62.00% 10.00% 28.00%
Office management 26 5 4 3 0 2 6 2 2 70.00% 14.00% 16.00%
Coordination 26 4 5 3 0 2 8 1 1 74.00% 10.00% 16.00%
Reporting 27 4 4 3 0 2 8 1 1 76.00% 10.00% 14.00%
Cash management 26 6 3 4 0 1 7 2 1 74.00% 16.00% 10.00%
Customer communications 26 4 5 4 0 1 5 1 4 70.00% 10.00% 20.00%
Source: Data from TNA research, 2017
Figure 22, generated from survey data, identified SMEs needs for operational/administrative training.
Training considered as most needed under this training category was product development training, which
was rated as very necessary by 14.25% of the surveyed SMEs, followed by 4.25% of enterprises rated as
to some extent necessary, whereas 81.5% of the surveyed SMEs considered it irrelevant to their activity.
Another training of interest to SMEs was training on customer communication, where 11.88% of
enterprises rated it as very necessary, 4.13% as to some extent necessary, and 84% as unnecessary. Cash
management has sparked the interest of 5% of SMEs that rated it as very necessary, followed by 4.13%
that rated it as to some extent necessary, while 90.88% of SMEs rated this training as irrelevant to their
enterprise.
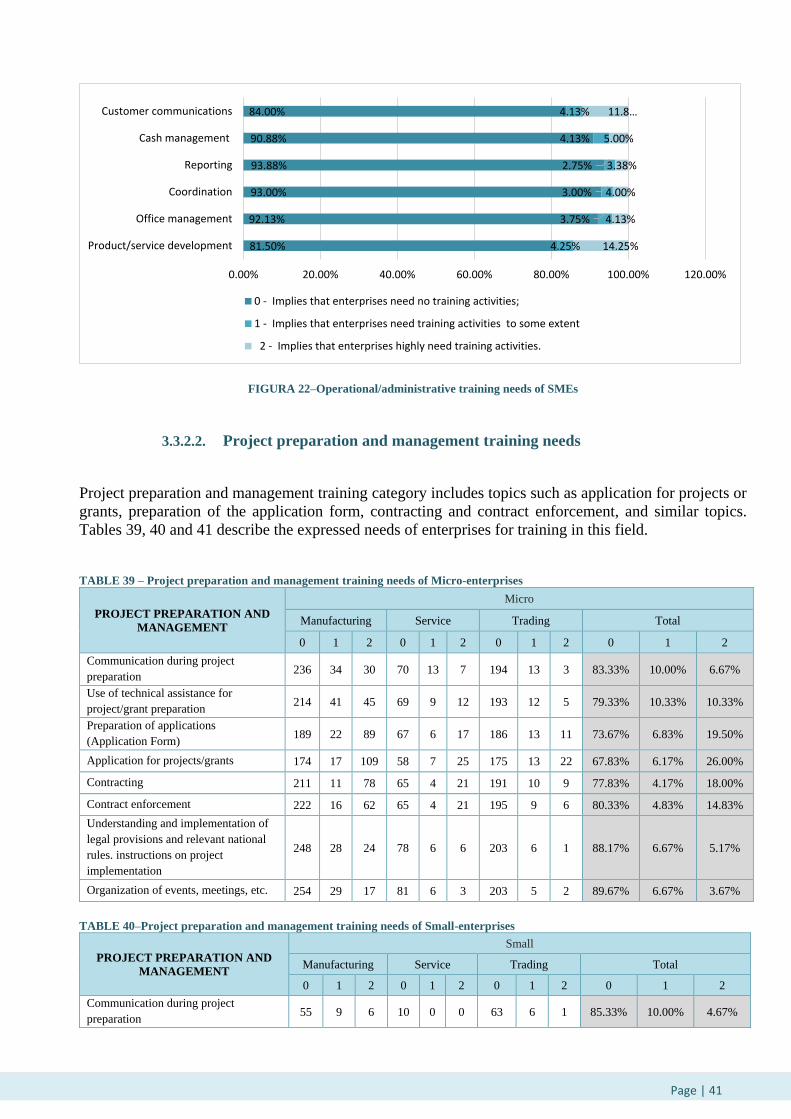
Page | 41…
FIGURA 22–Operational/administrative training needs of SMEs
3.3.2.2. Project preparation and management training needs
Project preparation and management training category includes topics such as application for projects or
grants, preparation of the application form, contracting and contract enforcement, and similar topics.
Tables 39, 40 and 41 describe the expressed needs of enterprises for training in this field.
TABLE 39 – Project preparation and management training needs of Micro-enterprises
PROJECT PREPARATION AND
MANAGEMENT
Micro
Manufacturing Service Trading Total
0 1 2 0 1 2 0 1 2 0 1 2
Communication during project
preparation 236 34 30 70 13 7 194 13 3 83.33% 10.00% 6.67%
Use of technical assistance for
project/grant preparation 214 41 45 69 9 12 193 12 5 79.33% 10.33% 10.33%
Preparation of applications
(Application Form) 189 22 89 67 6 17 186 13 11 73.67% 6.83% 19.50%
Application for projects/grants 174 17 109 58 7 25 175 13 22 67.83% 6.17% 26.00%
Contracting 211 11 78 65 4 21 191 10 9 77.83% 4.17% 18.00%
Contract enforcement 222 16 62 65 4 21 195 9 6 80.33% 4.83% 14.83%
Understanding and implementation of
legal provisions and relevant national
rules. instructions on project
implementation
248 28 24 78 6 6 203 6 1 88.17% 6.67% 5.17%
Organization of events, meetings, etc. 254 29 17 81 6 3 203 5 2 89.67% 6.67% 3.67%
TABLE 40–Project preparation and management training needs of Small-enterprises
PROJECT PREPARATION AND
MANAGEMENT
Small
Manufacturing Service Trading Total
0 1 2 0 1 2 0 1 2 0 1 2
Communication during project
preparation 55 9 6 10 0 0 63 6 1 85.33% 10.00% 4.67%
81.50%
92.13%
93.00%
93.88%
90.88%
84.00%
4.25%
3.75%
3.00%
2.75%
4.13%
4.13%
14.25%
4.13%
4.00%
3.38%
5.00%
11.8…
0.00% 20.00% 40.00% 60.00% 80.00% 100.00% 120.00%
Product/service development
Office management
Coordination
Reporting
Cash management
Customer communications
0 - Implies that enterprises need no training activities;
1 - Implies that enterprises need training activities to some extent
2 - Implies that enterprises highly need training activities.

Page | 42…
Use of technical assistance for
project/grant preparation 52 9 9 9 1 0 61 6 3 81.33% 10.67% 8.00%
Preparation of applications (Application
Form) 43 7 20 8 1 1 54 8 8 70.00% 10.67% 19.33%
Application for projects/grants 38 8 24 8 0 2 51 6 13 64.67% 9.33% 26.00%
Contracting 48 7 15 9 0 1 60 5 5 78.00% 8.00% 14.00%
Contract enforcement 50 6 14 9 0 1 63 3 4 81.33% 6.00% 12.67%
Understanding and implementation of
legal provisions and relevant national
rules. instructions on project
implementation
60 4 6 9 1 0 64 4 2 88.67% 6.00% 5.33%
Organization of events, meetings, etc. 62 2 6 9 1 0 62 6 2 88.67% 6.00% 5.33%
Source: Data from TNA research, 2017
TABLE 41- Project preparation and management training needs of Medium-enterprises
PROJECT PREPARATION AND
MANAGEMENT
Medium
Manufacturing Service Trading Total
0 1 2 0 1 2 0 1 2 0 1 2
Communication during project
preparation 23 9 3 4 0 1 8 1 1 70.00% 20.00% 10.00%
Use of technical assistance for
project/grant preparation 24 6 5 4 0 1 9 0 1 74.00% 12.00% 14.00%
Preparation of applications (Application
Form) 24 5 6 4 0 1 8 0 2 72.00% 10.00% 18.00%
Application for projects/grants 21 6 8 4 0 1 7 0 3 64.00% 12.00% 24.00%
Contracting 24 5 6 4 0 1 9 0 1 74.00% 10.00% 16.00%
Contract enforcement 23 7 5 4 0 1 9 0 1 72.00% 14.00% 14.00%
Understanding and implementation of
legal provisions and relevant national
rules. instructions on project
implementation
23 8 4 4 0 1 8 0 2 70.00% 16.00% 14.00%
Organization of events, meetings, etc. 24 7 4 4 0 1 8 0 2 72.00% 14.00% 14.00%
Source: Data from TNA research, 2017
Based on the survey outcomes, the needs of SMEs for trainings on project preparation and management
are graphically presented. As seen in Figure 23, training on application for projects or grants is rated as
very necessary by 25.88% of surveyed enterprises, followed by 7.13% of them that rated it as to some
extent necessary, while 67% of the surveyed SMEs rated it as unnecessary. Also, the training on the
preparation of applications was rated satisfactorily by the surveyed enterprises, where 19.38% of SMEs
rated it as very necessary, 7.75% as to some extent necessary, while 72.88% considered it unnecessary.
Training on contract signature attracted the interest of 17.13% of the SMEs, which rated it as very
necessary, followed by 5.25% that rated it as to some extent necessary, while 77.63% of enterprises rated
it as unnecessary.
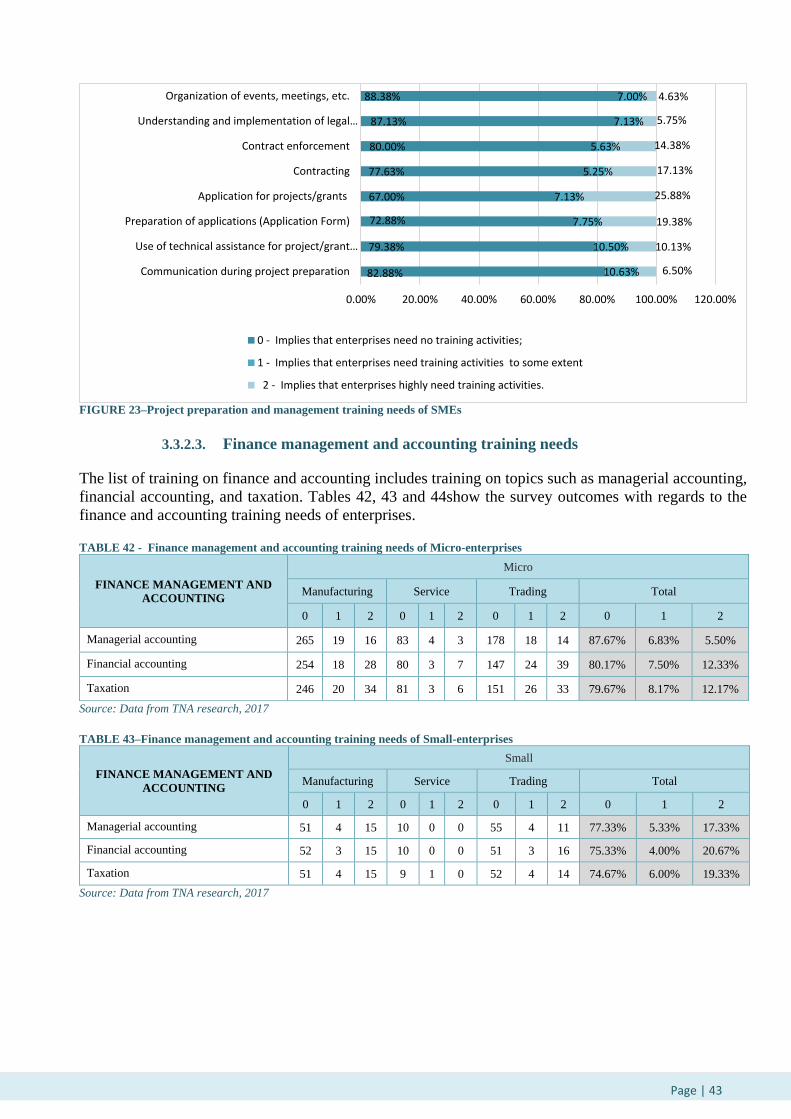
Page | 43…
FIGURE 23–Project preparation and management training needs of SMEs
3.3.2.3. Finance management and accounting training needs
The list of training on finance and accounting includes training on topics such as managerial accounting,
financial accounting, and taxation. Tables 42, 43 and 44show the survey outcomes with regards to the
finance and accounting training needs of enterprises. TABLE 42 - Finance management and accounting training needs of Micro-enterprises
FINANCE MANAGEMENT AND
ACCOUNTING
Micro
Manufacturing Service Trading Total
0 1 2 0 1 2 0 1 2 0 1 2
Managerial accounting 265 19 16 83 4 3 178 18 14 87.67% 6.83% 5.50%
Financial accounting 254 18 28 80 3 7 147 24 39 80.17% 7.50% 12.33%
Taxation 246 20 34 81 3 6 151 26 33 79.67% 8.17% 12.17%
Source: Data from TNA research, 2017
TABLE 43–Finance management and accounting training needs of Small-enterprises
FINANCE MANAGEMENT AND
ACCOUNTING
Small
Manufacturing Service Trading Total
0 1 2 0 1 2 0 1 2 0 1 2
Managerial accounting 51 4 15 10 0 0 55 4 11 77.33% 5.33% 17.33%
Financial accounting 52 3 15 10 0 0 51 3 16 75.33% 4.00% 20.67%
Taxation 51 4 15 9 1 0 52 4 14 74.67% 6.00% 19.33%
Source: Data from TNA research, 2017
82.88%
79.38%
72.88%
67.00%
77.63%
80.00%
87.13%
88.38%
10.63%
10.50%
7.75%
7.13%
5.25%
5.63%
7.13%
7.00%
6.50%
10.13%
19.38%
25.88%
17.13%
14.38%
5.75%
4.63%
0.00% 20.00% 40.00% 60.00% 80.00% 100.00% 120.00%
Communication during project preparation
Use of technical assistance for project/grant…
Preparation of applications (Application Form)
Application for projects/grants
Contracting
Contract enforcement
Understanding and implementation of legal…
Organization of events, meetings, etc.
0 - Implies that enterprises need no training activities;
1 - Implies that enterprises need training activities to some extent
2 - Implies that enterprises highly need training activities.
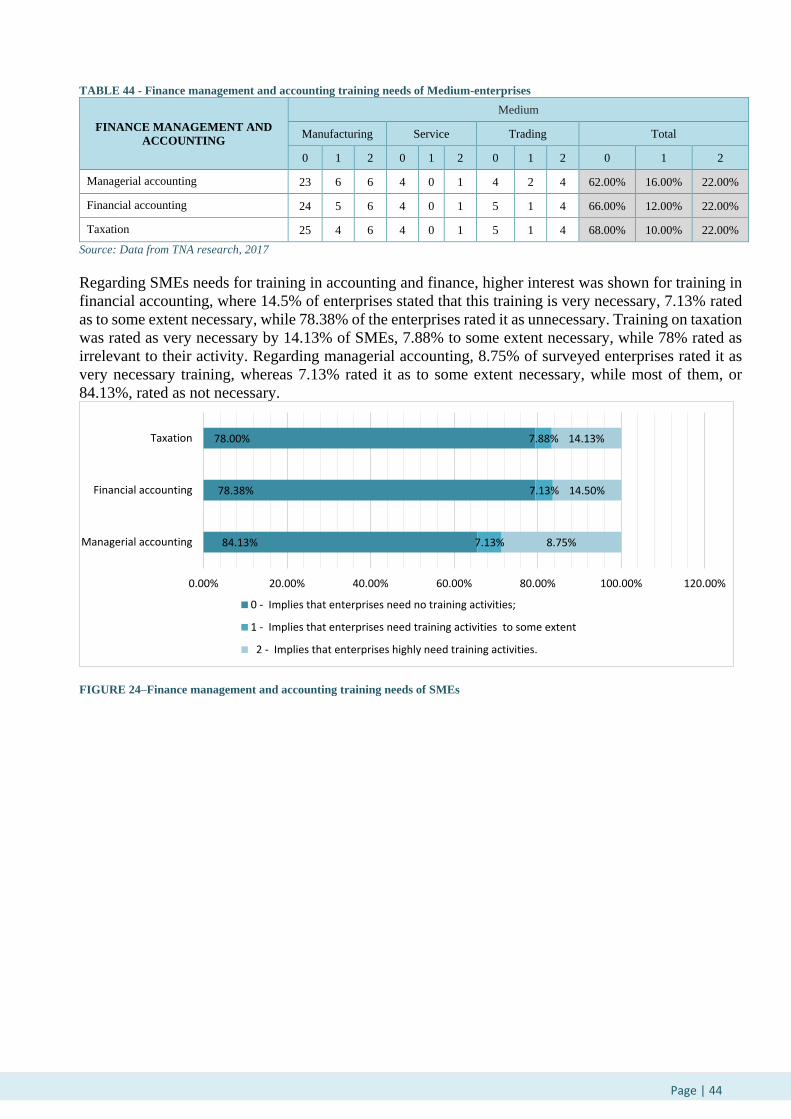
Page | 44…
TABLE 44 - Finance management and accounting training needs of Medium-enterprises
FINANCE MANAGEMENT AND
ACCOUNTING
Medium
Manufacturing Service Trading Total
0 1 2 0 1 2 0 1 2 0 1 2
Managerial accounting 23 6 6 4 0 1 4 2 4 62.00% 16.00% 22.00%
Financial accounting 24 5 6 4 0 1 5 1 4 66.00% 12.00% 22.00%
Taxation 25 4 6 4 0 1 5 1 4 68.00% 10.00% 22.00%
Source: Data from TNA research, 2017
Regarding SMEs needs for training in accounting and finance, higher interest was shown for training in
financial accounting, where 14.5% of enterprises stated that this training is very necessary, 7.13% rated
as to some extent necessary, while 78.38% of the enterprises rated it as unnecessary. Training on taxation
was rated as very necessary by 14.13% of SMEs, 7.88% to some extent necessary, while 78% rated as
irrelevant to their activity. Regarding managerial accounting, 8.75% of surveyed enterprises rated it as
very necessary training, whereas 7.13% rated it as to some extent necessary, while most of them, or
84.13%, rated as not necessary.
FIGURE 24–Finance management and accounting training needs of SMEs
84.13%
78.38%
78.00%
7.13%
7.13%
7.88%
8.75%
14.50%
14.13%
0.00% 20.00% 40.00% 60.00% 80.00% 100.00% 120.00%
Managerial accounting
Financial accounting
Taxation
0 - Implies that enterprises need no training activities;
1 - Implies that enterprises need training activities to some extent
2 - Implies that enterprises highly need training activities.

Page | 45…
3.3.2.4. Client service training needs
Client service training resulted as relatively highly rated training, by the surveyed SMEs.
TABLE 45 - Client service training needs of Micro-enterprises
CLIENT SERVICE
Micro
Production Service Commercial Total
0 1 2 0 1 2 0 1 2 0 1 2
Client communication 215 17 68 63 7 20 128 13 69 67.67% 6.17% 26.17%
Networking 252 3 45 75 6 9 170 12 28 82.83% 3.50% 13.67%
Communication and foreign languages 251 11 38 76 1 13 165 11 34 82.00% 3.83% 14.17%
Source: Data from TNA research, 2017
TABLE 46 - Client service training needs of Small-enterprises
CLIENT SERVICE
Small
Manufacturing Service Trading Total
0 1 2 0 1 2 0 1 2 0 1 2
Client communication 42 1 27 6 1 3 42 1 27 60.00% 2.00% 38.00%
Networking 44 4 22 8 0 2 50 3 17 68.00% 4.67% 27.33%
Communication and foreign languages 48 2 20 7 0 3 54 2 14 72.67% 2.67% 24.67%
Source: Data from TNA research, 2017
TABLE 47 - Client service training needs of Medium-enterprises
CLIENT SERVICE
Medium
Manufacturing Service Trading Total
0 1 2 0 1 2 0 1 2 0 1 2
Client communication 20 5 10 5 0 0 4 1 5 58.00% 12.00% 30.00%
Networking 26 4 5 5 0 0 6 1 3 74.00% 10.00% 16.00%
Communication and foreign languages 24 3 8 5 0 0 6 1 3 70.00% 8.00% 22.00%
Source: Data from TNA research, 2017
Figure 25 presents graphically the need and willingness of SME to attend client service training activities,
where 28.63% of the enterprises rated client communication training as very necessary, whereas 5.75%
rated as to some extent necessary, and 65.63% rated it as unnecessary. Networking training is rated as
very necessary by 16.38% of SMEs, 4.13% rated it as to some extent necessary, whereas 79.5% of SMEs
rated it as unnecessary. Communication and foreign languages training is rated as very necessary by the
16.63% of SMEs, whereas 3.88% rated it as to some extent necessary, and 79.5% rated it as irrelevant
for their activities.

Page | 46…
FIGURE 25 – Client service training needs of SMEs
3.3.2.5. Communication technology, efficient use of energy and product
certification training needs
Here are included the needs for training such as computer-based electronic data transfer, use of electronic data,
quality, standards and product certification and trainings, all these training triggered no high interest among
surveyed SME-s. Table 48, 49 and 50, it has been presented the need SME to undergo these trainings.
TABLE 48 – Communication technology, efficient use of energy and product certification training needs of Micro-enterprises
INFORMATION AND
COMMUNICATION
TECHNOLOGY
Micro
Manufacturing Service Trading Total
0 1 2 0 1 2 0 1 2 0 1 2
Computer-based system
[electronic transfer of data] 289 5 6 86 2 2 196 3 11 95.17% 1.67% 3.17%
Efficient use of energy 284 10 6 86 3 1 206 2 2 96.00% 2.50% 1.50%
Product quality, standards and
certification 271 5 24 84 3 3 201 4 5 92.67% 2.00% 5.33%
Source: Data from TNA research, 2017
TABLE 49 - Communication technology, efficient use of energy and product certification training needs of Small-enterprises
INFORMATION AND
COMMUNICATION
TECHNOLOGY
Small
Manufacturing Service Trading Total
0 1 2 0 1 2 0 1 2 0 1 2
Computer-based system
[electronic transfer of data] 61 3 6 10 0 0 59 2 9 86.67% 3.33% 10.00%
Efficient use of energy 62 3 5 9 0 1 65 2 3 90.67% 3.33% 6.00%
Product quality, standards and
certification 55 6 9 10 0 0 62 2 6 84.67% 5.33% 10.00%
Source: Data from TNA research, 2017
TABLE 50 - Communication technology, efficient use of energy and product certification training needs of Medium-enterprises
65.63%
79.50%
79.50%
5.75%
4.12%
3.88%
28.63%
16.38%
16.63
84% 86% 88% 90% 92% 94% 96% 98% 100%
Client communication
Networking
Communication and foreign languages
0 - Implies that enterprises need no training activities;
1 - Implies that enterprises need training activities to some extent
2 - Implies that enterprises highly need training activities.
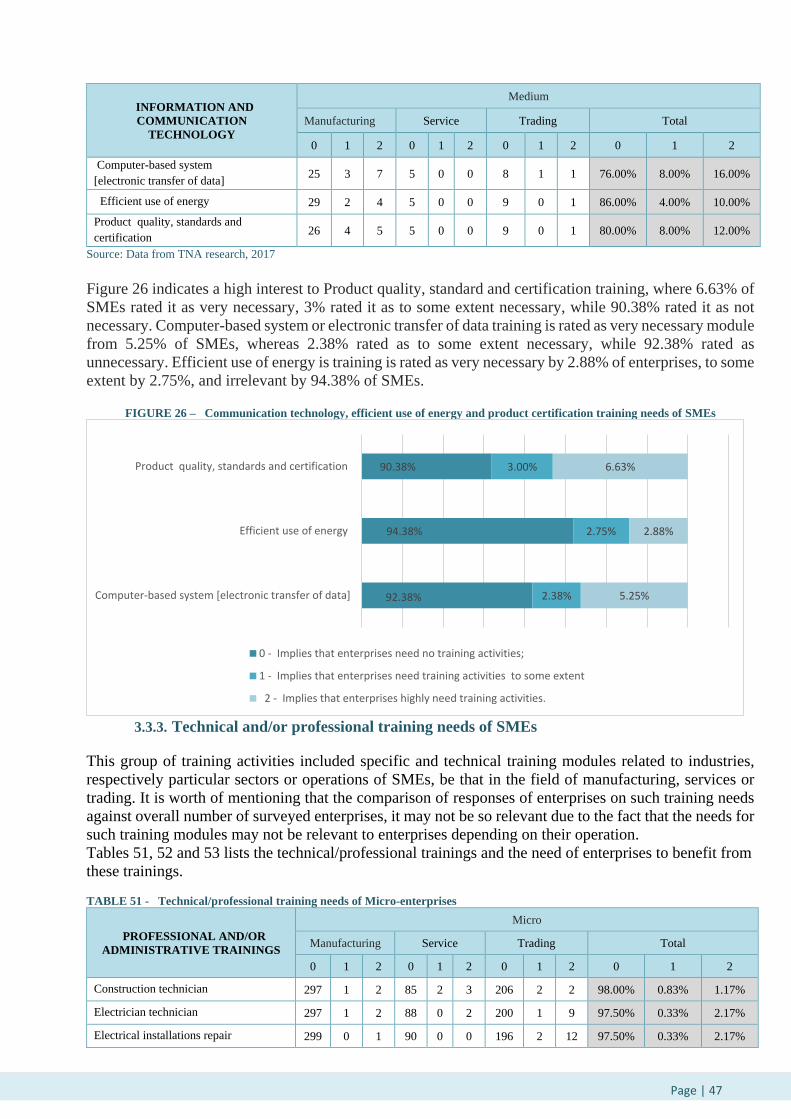
Page | 47…
INFORMATION AND
COMMUNICATION
TECHNOLOGY
Medium
Manufacturing Service Trading Total
0 1 2 0 1 2 0 1 2 0 1 2
Computer-based system
[electronic transfer of data] 25 3 7 5 0 0 8 1 1 76.00% 8.00% 16.00%
Efficient use of energy 29 2 4 5 0 0 9 0 1 86.00% 4.00% 10.00%
Product quality, standards and
certification 26 4 5 5 0 0 9 0 1 80.00% 8.00% 12.00%
Source: Data from TNA research, 2017
Figure 26 indicates a high interest to Product quality, standard and certification training, where 6.63% of
SMEs rated it as very necessary, 3% rated it as to some extent necessary, while 90.38% rated it as not
necessary. Computer-based system or electronic transfer of data training is rated as very necessary module
from 5.25% of SMEs, whereas 2.38% rated as to some extent necessary, while 92.38% rated as
unnecessary. Efficient use of energy is training is rated as very necessary by 2.88% of enterprises, to some
extent by 2.75%, and irrelevant by 94.38% of SMEs.
FIGURE 26 – Communication technology, efficient use of energy and product certification training needs of SMEs
3.3.3. Technical and/or professional training needs of SMEs
This group of training activities included specific and technical training modules related to industries,
respectively particular sectors or operations of SMEs, be that in the field of manufacturing, services or
trading. It is worth of mentioning that the comparison of responses of enterprises on such training needs
against overall number of surveyed enterprises, it may not be so relevant due to the fact that the needs for
such training modules may not be relevant to enterprises depending on their operation.
Tables 51, 52 and 53 lists the technical/professional trainings and the need of enterprises to benefit from
these trainings.
TABLE 51 - Technical/professional training needs of Micro-enterprises
PROFESSIONAL AND/OR
ADMINISTRATIVE TRAININGS
Micro
Manufacturing Service Trading Total
0 1 2 0 1 2 0 1 2 0 1 2
Construction technician 297 1 2 85 2 3 206 2 2 98.00% 0.83% 1.17%
Electrician technician 297 1 2 88 0 2 200 1 9 97.50% 0.33% 2.17%
Electrical installations repair 299 0 1 90 0 0 196 2 12 97.50% 0.33% 2.17%
92.38%
94.38%
90.38%
2.38%
2.75%
3.00%
5.25%
2.88%
6.63%
Computer-based system [electronic transfer of data]
Efficient use of energy
Product quality, standards and certification
0 - Implies that enterprises need no training activities;
1 - Implies that enterprises need training activities to some extent
2 - Implies that enterprises highly need training activities.

Page | 48…
Plumbing technician 296 0 4 90 0 0 202 1 7 98.00% 0.17% 1.83%
Interior technician 280 3 17 88 1 1 202 1 7 95.00% 0.83% 4.17%
Machinery technician 283 3 14 86 0 4 201 1 8 95.00% 0.67% 4.33%
Auto-mechanic and use of digital
technology 288 1 11 84 0 6 199 1 10 95.17% 0.33% 4.50%
Carpenter 253 2 45 89 0 1 200 3 7 90.33% 0.83% 8.83%
Graphic design 259 4 37 87 1 2 205 1 4 91.83% 1.00% 7.17%
Tailoring and fashion design 244 1 55 88 0 2 199 1 10 88.50% 0.33% 11.17%
IT and web/application developer 289 0 11 85 2 3 204 2 4 96.33% 0.67% 3.00%
Welder 289 1 10 86 0 4 206 2 2 96.83% 0.50% 2.67%
Aesthetics 296 0 4 66 1 23 204 2 4 94.33% 0.50% 5.17%
Cook and gastronomy 269 2 29 76 0 14 207 2 1 92.00% 0.67% 7.33%
Source: Data from TNA research, 2017
TABLE 52- Technical/professional training needs of Small-enterprises
PROFESSIONAL AND/OR
ADMINISTRATIVE TRAINING
Small
Manufacturing Service Trading Total
0 1 2 0 1 2 0 1 2 0 1 2
Construction technician 65 2 3 9 0 1 66 0 4 93.33% 1.33% 5.33%
Electrician technician 62 1 7 10 0 0 66 0 4 92.00% 0.67% 7.33%
Electrical installations repair 67 1 2 9 0 1 68 0 2 96.00% 0.67% 3.33%
Plumbing technician 68 1 1 10 0 0 67 0 3 96.67% 0.67% 2.67%
Interior technician 60 2 8 10 0 0 67 0 3 91.33% 1.33% 7.33%
Machinery technician 56 3 11 9 0 1 68 0 2 88.67% 2.00% 9.33%
Auto-mechanic and use of digital
technology 59 1 10 10 0 0 68 0 2 91.33% 0.67% 8.00%
Carpenter 52 2 16 10 0 0 68 0 2 86.67% 1.33% 12.00%
Graphic design 59 4 7 9 1 0 64 0 6 88.00% 3.33% 8.67%
Tailoring and fashion design 65 1 4 10 0 0 69 0 1 96.00% 0.67% 3.33%
IT and web/application developer 67 2 1 10 0 0 69 0 1 97.33% 1.33% 1.33%
Welder 68 0 2 10 0 0 70 0 0 98.67% 0.00% 1.33%
Aesthetics 69 0 1 9 0 1 69 0 1 98.00% 0.00% 2.00%
Cook and gastronomy 66 1 3 10 0 0 69 1 0 96.67% 1.33% 2.00%
Source: Data from TNA research, 2017
TABLE 53 - Technical/professional training needs of Medium-enterprises
PROFESSIONAL AND/OR
ADMINISTRATIVE TRAININGS
Medium
Manufacturing Service Trading Total
0 1 2 0 1 2 0 1 2 0 1 2
Construction technician 32 1 2 4 0 1 10 0 0 92.00% 2.00% 6.00%
Electrician technician 30 3 2 5 0 0 9 0 1 88.00% 6.00% 6.00%
Electrical installations repair 33 2 0 5 0 0 10 0 0 96.00% 4.00% 0.00%
Plumbing technician 34 1 0 5 0 0 10 0 0 98.00% 2.00% 0.00%
Interior technician 32 1 2 5 0 0 10 0 0 94.00% 2.00% 4.00%

Page | 49…
Machinery technician 31 2 2 5 0 0 9 0 1 90.00% 4.00% 6.00%
Auto-mechanic and use of digital
technology 34 1 0 5 0 0 9 1 0 96.00% 4.00% 0.00%
Carpenter 29 1 5 5 0 0 10 0 0 88.00% 2.00% 10.00%
Graphic design 28 1 6 5 0 0 10 0 0 86.00% 2.00% 12.00%
Tailoring and fashion design 33 1 1 5 0 0 9 0 1 94.00% 2.00% 4.00%
IT and web/application developer 34 1 0 5 0 0 10 0 0 98.00% 2.00% 0.00%
Welder 34 1 0 5 0 0 10 0 0 98.00% 2.00% 0.00%
Aesthetics 33 1 1 5 0 0 10 0 0 96.00% 2.00% 2.00%
Cook and gastronomy 34 0 1 5 0 0 10 0 0 98.00% 0.00% 2.00%
Source: Data from TNA research, 2017
Upon analysing of professional and/or technical training needs of SMEs, one can note a high interest for
training activities for carpentry, where 9.5% of enterprises rated this training as very necessary, and 1%
rated it as to some extent necessary, while 89.5% of enterprises rate it as unnecessary. Tailoring and
fashion design training is rated as very necessary by 9.25% of SMEs, 0.5% rated as to some extent, while
90.25% of SMEs rated it as irrelevant for their activities. On the hand 7.75% of surveyed enterprises
rated graphic design training as very necessary, a share of 1.5% rated as to some extent necessary, while
majority or 90.75% of surveyed SMEs rated as unnecessary. Another training with interest of SMEs
Cook and gastronomy training, whereby 6% of surveyed enterprises rated it as very necessary, 0.75% to
some extent necessary, and 93.25% of surveyed SME as unnecessary.
FIGURE 27 –Administrative and/or professional training needs of SMEs
96.75%
95.88%
97.13%
97.75%
94.25%
93.50%
94.50%
89.50%
90.75%
90.25%
96.63%
97.25%
95.13%
93.25%
1.00%
0.75%
0.63%
0.38%
1.00%
1.13%
0.63%
1.00%
1.50%
0.50%
0.88%
0.50%
0.50%
0.75%
2.25%
3.38%
2.25%
1.88%
4.75%
5.38%
4.88%
9.50%
7.75%
9.25%
2.50%
2.25%
4.38%
6.00%
C O N S T R U C T I O N T E C H N I C I A N
E L E C T R I C I A N T E C H N I C I A N
E L E C T R I C A L I N S T A L L A T I O N S R E P A I R
P L U M B I N G T E C H N I C I A N
I N T E R I O R T E C H N I C I A N
M A C H I N E R Y T E C H N I C I A N
A U T O - M E C H A N I C A N D U S E O F D I G I T A L T E C H N O L O G Y
C A R P E N T E R
G R A P H I C D E S I G N
T A I L O R I N G A N D F A S H I O N D E S I G N
I T A N D W E B / A P P L I C A T I O N D E V E L O P E R
W E L D E R
A E S T H E T I C S
C O O K A N D G A S T R O N O M Y
0 - Implies that enterprises need no training activities;
1 - Implies that enterprises need training activities to some extent
2 - Implies that enterprises highly need training activities.
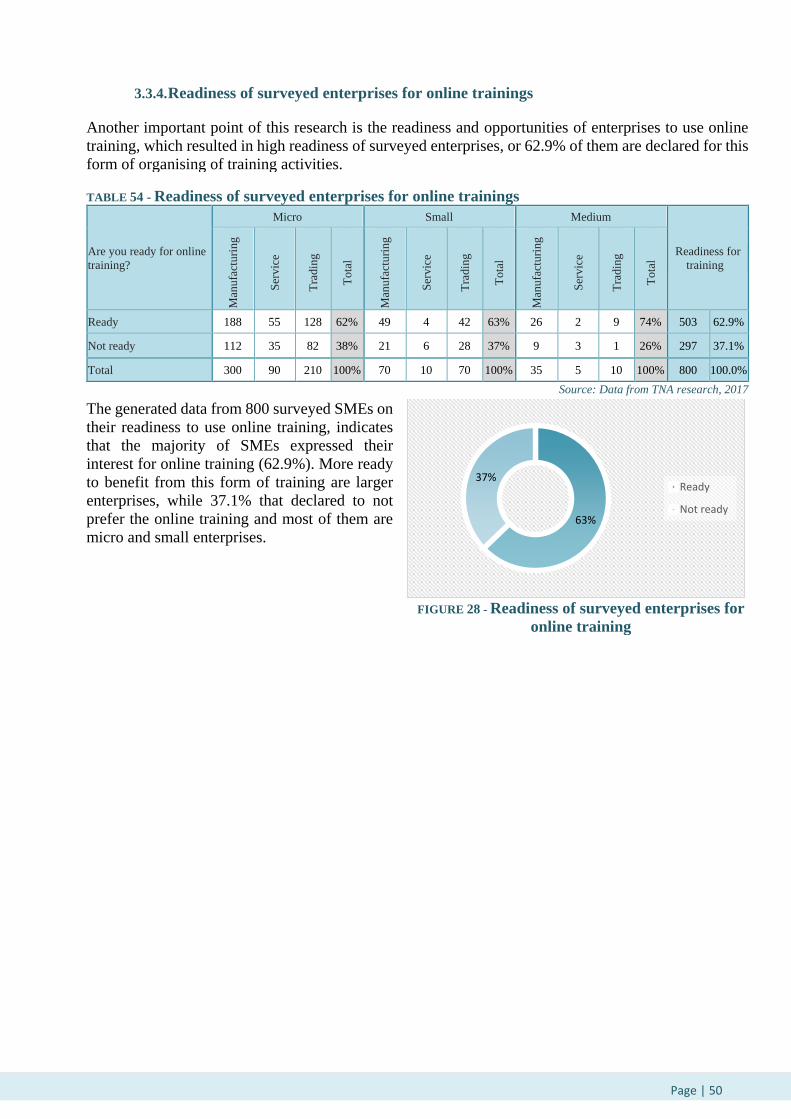
Page | 50…
3.3.4. Readiness of surveyed enterprises for online trainings
Another important point of this research is the readiness and opportunities of enterprises to use online
training, which resulted in high readiness of surveyed enterprises, or 62.9% of them are declared for this
form of organising of training activities.
TABLE 54 - Readiness of surveyed enterprises for online trainings
Are you ready for online
training?
Micro Small Medium
Readiness for
training
Man
ufa
cturi
ng
Ser
vic
e
Tra
din
g
Tota
l
Man
ufa
cturi
ng
Ser
vic
e
Tra
din
g
Tota
l
Man
ufa
cturi
ng
Ser
vic
e
Tra
din
g
Tota
l
Ready 188 55 128 62% 49 4 42 63% 26 2 9 74% 503 62.9%
Not ready 112 35 82 38% 21 6 28 37% 9 3 1 26% 297 37.1%
Total 300 90 210 100% 70 10 70 100% 35 5 10 100% 800 100.0%
Source: Data from TNA research, 2017
The generated data from 800 surveyed SMEs on
their readiness to use online training, indicates
that the majority of SMEs expressed their
interest for online training (62.9%). More ready
to benefit from this form of training are larger
enterprises, while 37.1% that declared to not
prefer the online training and most of them are
micro and small enterprises.
FIGURE 28 - Readiness of surveyed enterprises for
online training
63%
37%Ready
Not ready

Page | 51…
4. SUMMARY
The extracted data through this research lead to a highly qualified assessment on the current situation,
by translating the training needs into an indicator for absence of capacities of human resources at SMEs.
The analysed outcomes, from the research data show main areas in which enterprises have expressed
their priority needs for intervention, or rated as very necessary and that has reflected with a list of most
required/necessary training, (the specific training activities rated over 10% as very necessary are taken
as benchmark) as follows:
1. Managerial trainings;
1.1. Business plan – 30.75%
1.2. The general managing of the enterprise – 21.75%
1.3. Strategic planning and organization – 19.88%
2. Financial management training;
2.1. Soliciting funds from EC – 12.13%
3. Market analysis training;
3.1. Internal market analysis– 13.88 %
3.2. Access to import and import procedures – 12.38%
3.3. Access to export and export procedures – 11.75%
4. Marketing training;
4.1. Sales strategy – 43.75 %
4.2. Marketing plan – 38.63%
4.3. Marketing tools – 33.00%
5. Operative/ administrative trainings;
5.1. Products/services design – 14.25 %
5.2. Consumer Communication– 11.88%
6. Project preparation and management training;
6.1. Application for projects/grants – 25.88%
6.2. Compiling of applications (Application forms) – 19.38%
6.3. Signing of contract – 17.13%
6.4. Contract enforcement – 14.38%
6.5. Project preparation technical assistance use– 10.13%
7. Financial management and accounting training;
7.1. Financial accounting – 14.50%
7.2. Taxes and levies – 14.13%
8. Client service training;
8.1. Client Communication – 28.63%
8.2. Communication and foreign languages – 16.63%
8.3. Networking – 16.38%
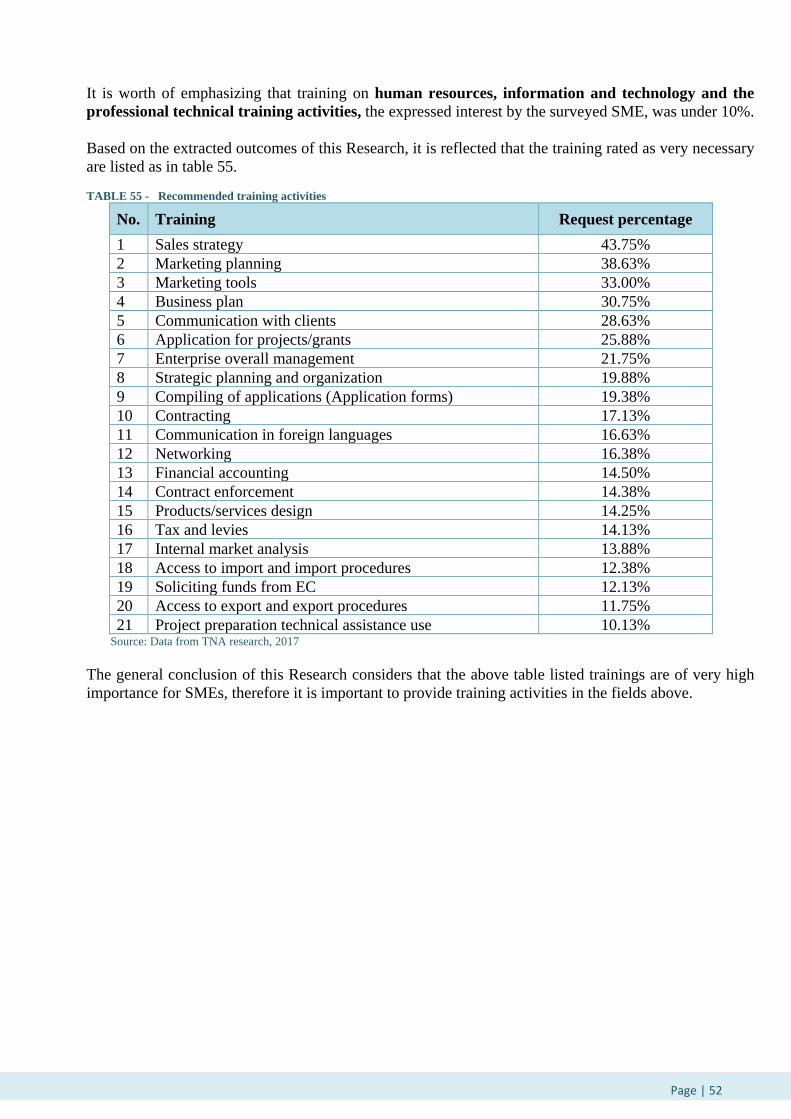
Page | 52…
It is worth of emphasizing that training on human resources, information and technology and the
professional technical training activities, the expressed interest by the surveyed SME, was under 10%.
Based on the extracted outcomes of this Research, it is reflected that the training rated as very necessary
are listed as in table 55.
TABLE 55 - Recommended training activities
No. Training Request percentage
1 Sales strategy 43.75%
2 Marketing planning 38.63%
3 Marketing tools 33.00%
4 Business plan 30.75%
5 Communication with clients 28.63%
6 Application for projects/grants 25.88%
7 Enterprise overall management 21.75%
8 Strategic planning and organization 19.88%
9 Compiling of applications (Application forms) 19.38%
10 Contracting 17.13%
11 Communication in foreign languages 16.63%
12 Networking 16.38%
13 Financial accounting 14.50%
14 Contract enforcement 14.38%
15 Products/services design 14.25%
16 Tax and levies 14.13%
17 Internal market analysis 13.88%
18 Access to import and import procedures 12.38%
19 Soliciting funds from EC 12.13%
20 Access to export and export procedures 11.75%
21 Project preparation technical assistance use 10.13% Source: Data from TNA research, 2017
The general conclusion of this Research considers that the above table listed trainings are of very high
importance for SMEs, therefore it is important to provide training activities in the fields above.
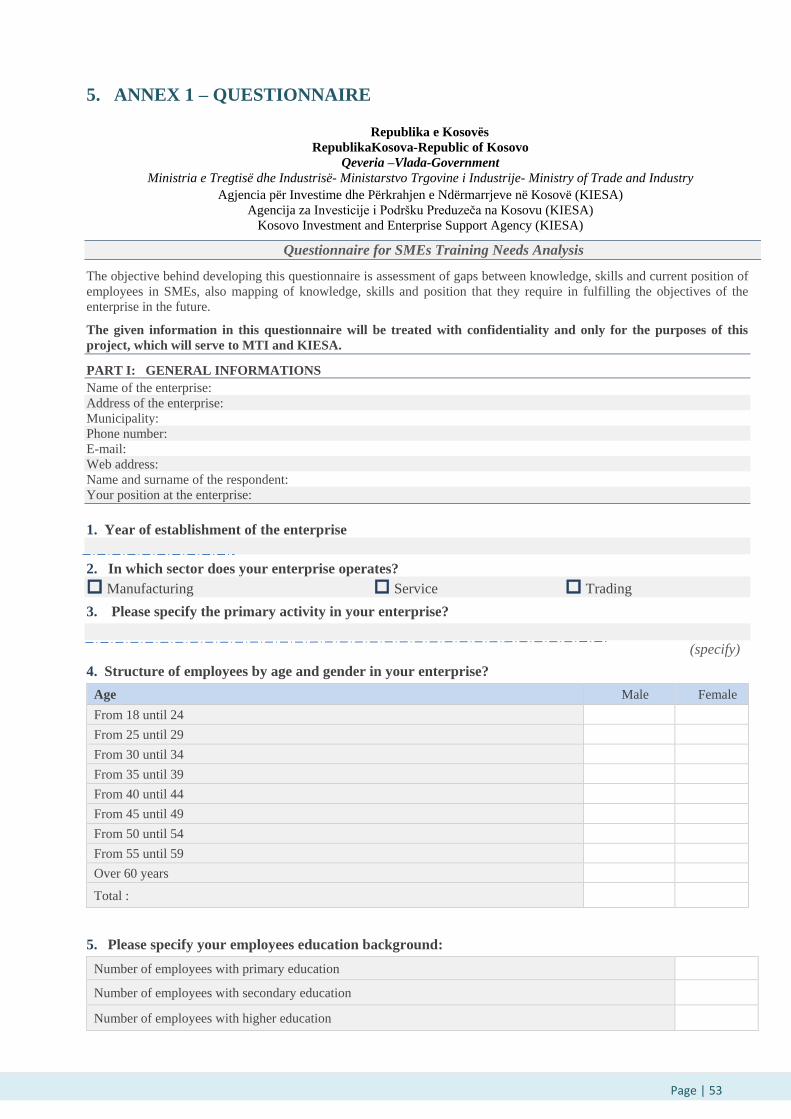
Page | 53…
5. ANNEX 1 – QUESTIONNAIRE
Republika e Kosovës
RepublikaKosova-Republic of Kosovo
Qeveria –Vlada-Government
Ministria e Tregtisë dhe Industrisë- Ministarstvo Trgovine i Industrije- Ministry of Trade and Industry
Agjencia për Investime dhe Përkrahjen e Ndërmarrjeve në Kosovë (KIESA)
Agencija za Investicije i Podršku Preduzeča na Kosovu (KIESA)
Kosovo Investment and Enterprise Support Agency (KIESA)
Questionnaire for SMEs Training Needs Analysis
The objective behind developing this questionnaire is assessment of gaps between knowledge, skills and current position of
employees in SMEs, also mapping of knowledge, skills and position that they require in fulfilling the objectives of the
enterprise in the future.
The given information in this questionnaire will be treated with confidentiality and only for the purposes of this
project, which will serve to MTI and KIESA.
PART I: GENERAL INFORMATIONS
Name of the enterprise:
Address of the enterprise:
Municipality:
Phone number:
E-mail:
Web address:
Name and surname of the respondent:
Your position at the enterprise:
1. Year of establishment of the enterprise
2. In which sector does your enterprise operates?
Manufacturing Service Trading
3. Please specify the primary activity in your enterprise?
(specify)
4. Structure of employees by age and gender in your enterprise?
Age Male Female
From 18 until 24
From 25 until 29
From 30 until 34
From 35 until 39
From 40 until 44
From 45 until 49
From 50 until 54
From 55 until 59
Over 60 years
Total :
5. Please specify your employees education background:
Number of employees with primary education
Number of employees with secondary education
Number of employees with higher education

Page | 54…
Number of employees with postgraduate education
6. Is your enterprise certified with national or international certification, if yes, which standard?
(specify)
PART II: INFORMATIONS ABOUT THE PREVIOUS TRAININGS
7. Who is responsible for Human Resources-HR at your enterprise?
Owner Director (other than the owner) Department of HR
8. Have your employees attended any training until now, related to the work they perform?
Yes No (go to question 16)
9. What training your employees attended?
(specify)
10. To what extent the training enhanced your employees’ performance?
High Moderate Low Not at all
11. What was the form of training attended so far? (multiple answer can be chosen)
In-person Online
12. How effective were the online training?
High Moderate Low Not at all
13. How were trainings organized??
Internal – provided by the staff of the enterprise
External – provided outside the enterprise by local experts(outsourced)
External – provided outside the enterprise by international experts
Combined – As needed
14. Which was the main source of funding for trainings?
Self-financing Employees Public institutions
International organizations Other
)
(specify)
15. If self-financed, how costly it was in comparison to benefits?
High Moderate To some extent Not at all
16. If you did not hold trainings, what were the reasons?
High cost
Trainings are not considered necessary
We did not know about training opportunities
Training opportunities din not fit us
Other
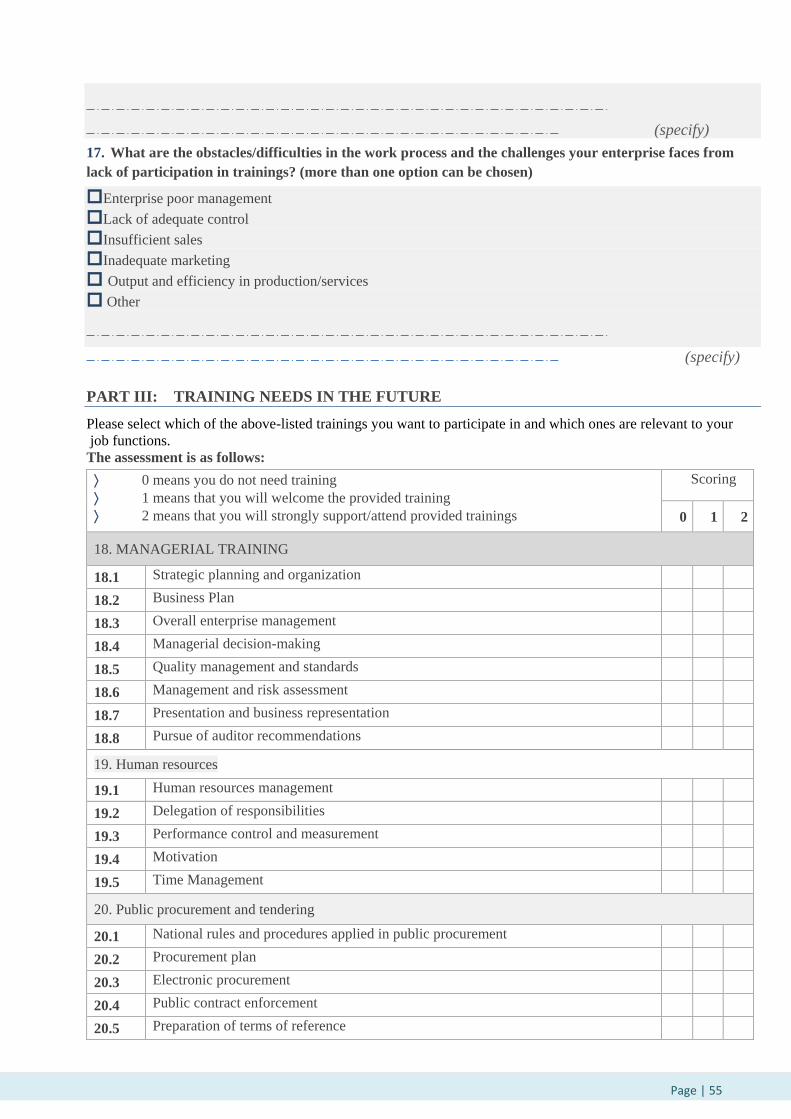
Page | 55…
(specify)
17. What are the obstacles/difficulties in the work process and the challenges your enterprise faces from
lack of participation in trainings? (more than one option can be chosen)
Enterprise poor management
Lack of adequate control
Insufficient sales
Inadequate marketing
Output and efficiency in production/services
Other
(specify)
PART III: TRAINING NEEDS IN THE FUTURE
Please select which of the above-listed trainings you want to participate in and which ones are relevant to your
job functions.
The assessment is as follows:
0 means you do not need training
1 means that you will welcome the provided training
2 means that you will strongly support/attend provided trainings
Scoring
0 1 2
18. MANAGERIAL TRAINING
18.1 Strategic planning and organization
18.2 Business Plan
18.3 Overall enterprise management
18.4 Managerial decision-making
18.5 Quality management and standards
18.6 Management and risk assessment
18.7 Presentation and business representation
18.8 Pursue of auditor recommendations
19. Human resources
19.1 Human resources management
19.2 Delegation of responsibilities
19.3 Performance control and measurement
19.4 Motivation
19.5 Time Management
20. Public procurement and tendering
20.1 National rules and procedures applied in public procurement
20.2 Procurement plan
20.3 Electronic procurement
20.4 Public contract enforcement
20.5 Preparation of terms of reference

Page | 56…
20.6 Preparation of tender dossier, launch of tenders/calls for proposals
20.7 Tender Evaluation Commission/Short-listing Panel
20.8 Tender procedures for services/supplies/works/grants
21. Financial Management
21.1 Financial planning
21.2 Investment planning
21.3 Cost/benefit analysis of product/business
21.4 Fund flows
21.5 Fund planning
21.6 Soliciting funds from the EC (European Commission)
21.7 Certification/Verification of expenditures
21.8 Program closing
21.9 Reallocation of funds
22. Market Analysis
22.1 Access to export and export procedures
22.2 Access to import and import procedures
22.3 Internal Market Analysis
22.4 Regional Market Analysis
23. Marketing
23.1 Marketing planning
23.2 Sales strategy
23.3 Marketing tools
24. Other (specify)
______________________________________________________________________________
25. OPERATIONAL/ADMINISTRATIVE TRAINING
25.1 Product/service design
25.2 Office Management
25.3 Coordination
25.4 Reporting
25.5 Cash management
25.6 Stakeholders Communication
26. Project Preparation and Management
26.1 Communication during project preparation
26.2 Project/grant preparation technical assistance use
26.3 Compiling of application (Application Form)
26.4 Application for projects/grants
26.5 Signing the contract
26.6 Contract enforcement
26.7 Understanding and Implementing legal provisions and relevant national
rules/Implementation Guidelines (project Implementation)

Page | 57…
26.8 Organizing events, meetings, etc.
27. Finance management and accounting
27.1 Managerial accounting
27.2 Financial Accounting
27.3 Tax and levies
28. Customer service
28.1 Client Communication
28.2 Networking
28.3 Communication and foreign languages
29. Information and Communication Technology
29.1 Computer-based system [electronic transfer of data]
30. Efficient use of energy
31. Product quality, standard, and certification 32. Other (specify) ______________________________________________________________________________
33. PROFESSIONAL AND/OR TECHNICAL TRAINING
33.1 Construction technician 33.2 Electricity technician 33.3 Repair of electrical installations 33.4 Plumbing technician 33.5 Interior technician 33.6 Machinery technician 33.7 Auto mechanics and use of digital technology 33.8 Carpentry 33.9 Graphic design 33.10 Tailoring and fashion design 33.11 IT and web/application developer 33.12 Welder 33.13 Aesthetics 33.14 Chef and gastronomy 34. Other (specify) ______________________________________________________________________________
35. Are you willing to attend online training?
Yes No 36. If you have any remarks or additional comments, please write in the box below?

Page | 58…
Name of the Surveyor:
Telephone No./ E-mail:
Date:
Signature:
Thank you for the time you spent completing this questionnaire!

This page is intentionally left blank
Top Related