


Languages
Pages
Legal


© 2008 Verizon. All Rights Reserved. PTEXXXXX XX/08
GLOBAL CAPABILITY.PERSONAL ACCOUNTABILITY.
Wade BakerMiniMetricon 2.5April 07, 2008
Investigative Response Case Metrics InitiativePreliminary findings from 700+ data compromise investigations

2
Agenda
Investigative Response @ Verizon Business
IR Case Metrics Initiative
IR Statistics & Trends

3
Who am I?

4
About Me – Hats I Wear

5
About Me – Hat I’d Never be Caught Wearing

6
About Me – Hat I’d Never be Caught Wearing
r = +.998

7
About Me – Hat I’m trying to Wear

8
About Me – Hats I Wear

9
About Me – Hats I Wear

10
About Me – Hats I Wear
Research

11
About Me – Hats I Wear
Intel

12
About Me – Hats I Wear
Innovate

13
About Me – Hats I Wear
Risk

14
About Me – Hats I Wear
Metrics

15
About Me – Hats I Wear
DSS

16
About Me – Hats I Wear
IR

17
About Me – Hats I Wear
“Then why are you here talking to us about investigative response trends?”
18
About Me – Hats I Wear
Investigative Response Metrics Products &
Services

19
About Me – Hats I Wear
Metrics

20
About Me – Hats I Wear
IR
21
Investigative Response @ Verizon Business

22
Investigative Response @ Verizon Business
IT Investigative Support (On-demand)Guaranteed Response (Retainer-based)Incident Response Training (CIRT)Computer Forensic TrainingElectronic Data Recovery / Destruction
Expert Witness TestimonyMock-Incident Testing
Corporate IR Program DevelopmentLitigation Support & eDiscoveryTactical Management Briefings
Services

23
Investigative Response @ Verizon Business
230 cases in 2007 (1/4 of disclosures*)
185 cases in 2006 (1/4 of disclosures*)
166 cases in 2005 (1/3 of disclosures*)
130 cases in 2004
*Source: http://www.idtheftcenter.com/

24
Investigative Response @ Verizon Business
3 of the 5 largest data breaches
25
Overview: IR Metrics Initiative

26
Overview: IR Metrics Initiative
2004 – Q3 2007: Some high-level statistics & trends; some diffusion of insight and data
Q4 2007 – Present: Hundreds of case metrics defined & operationalized; systematic collection for all previous cases
Near Future: Diffusion of data internally and externally; Reoccurring public report of findings

27
Overview: IR Metrics Initiative
What’s the current status of this effort?
What’s the dataset for this talk?

28
Overview: IR Metrics Initiative
Sampling of cases from 2004-Present
High-level caseload statistics and trends from each investigator
Data collection on case backlog: Mostly complete for 2007, Majority for 2006, Partial for 2005 & 2004

29
Overview: IR Metrics Initiative
Bottom Line: This is a work in progress but there is more than enough data to support these findings…

30
Overview: IR Metrics Initiative
…just add “-ish” to the end of all numbers

31
IR Case Metrics: Statistics and Trends

32
Industry
Note: 2007 cases only
IR Case Metrics: Statistics and Trends

33
What is the source of breaches?
IR Case Metrics: Statistics and Trends

34
IR Case Metrics: Statistics and TrendsSource

35
IR Case Metrics: Statistics and Trends
Source: External

36
IR Case Metrics: Statistics and Trends
Source: Internal
37
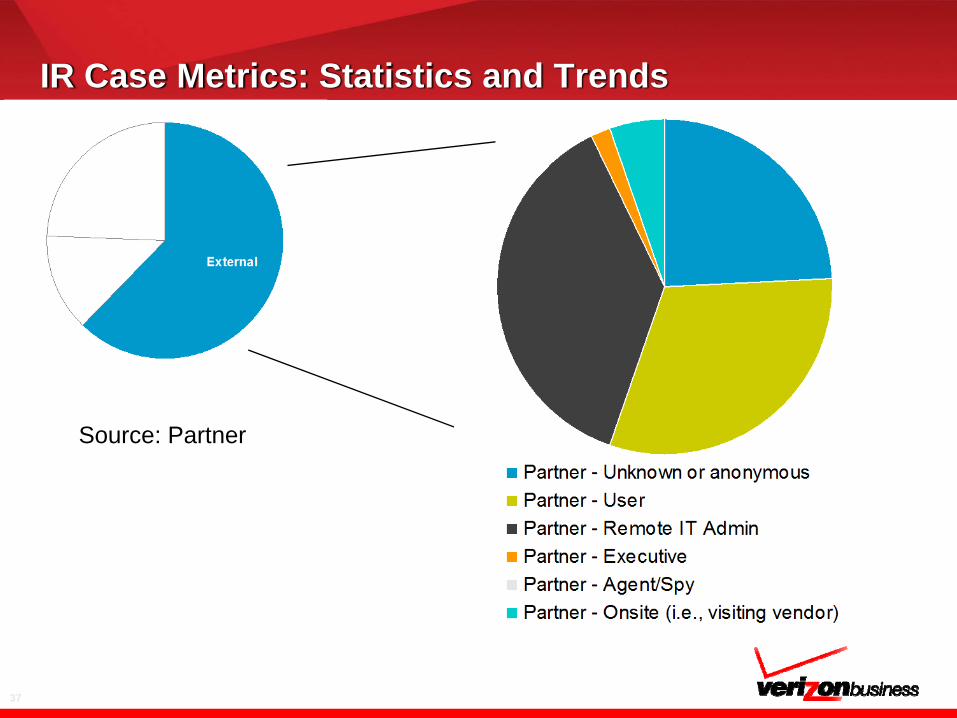
IR Case Metrics: Statistics and Trends
Source: Partner
38
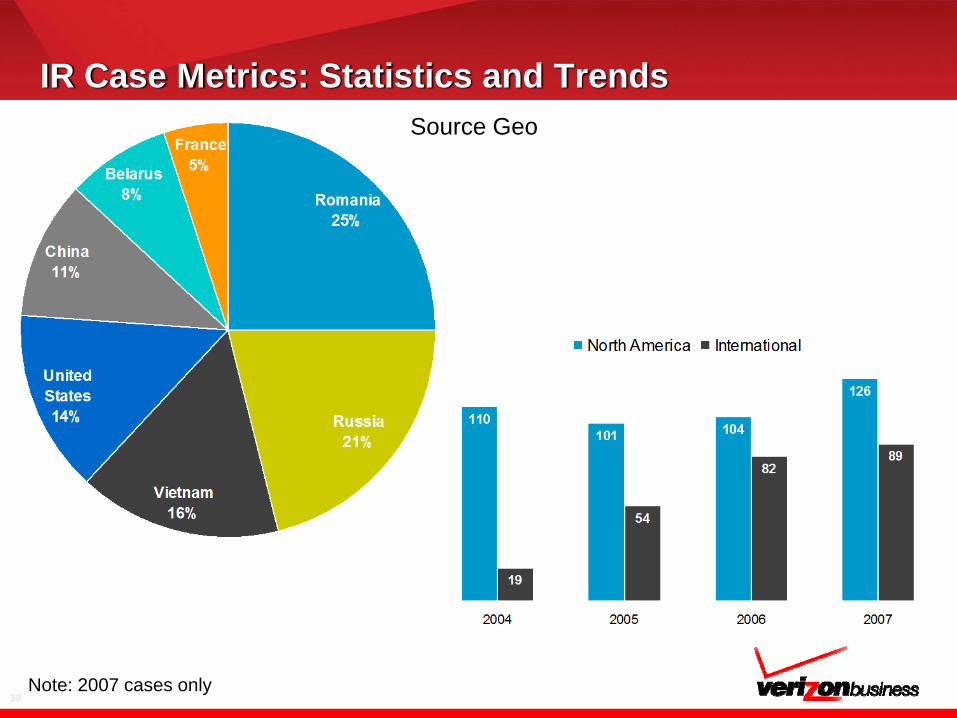
IR Case Metrics: Statistics and TrendsSource Geo
Note: 2007 cases only

39
How do breaches occur?
IR Case Metrics: Statistics and Trends

40
IR Case Metrics: Statistics and TrendsMethods, Top 10

41
IR Case Metrics: Statistics and TrendsMethods, Continued
Deceit - Social Engineering 13%
Misuse - Non-malicious misuse of corporate resources 13%
Malcode - Worm or Virus 13%
Error - User error 13%
Physical - Wiretapping / Sniffing 12%
Misuse - Malicious misuse / abuse of access or privilege 12%
Error - Inadvertent disclosure of sensitive data via web 10%
Physical - Theft from external location 8%
Error - Technical / system failure 8%
Physical - Loss or misplacement of asset 7%
Physical - System access or tampering 7%

42
IR Case Metrics: Statistics and TrendsDifficulty
High - Advanced skills and/or extensive resources were used
Moderate - The attack involved skilled attacks and/or significant resources
Low - Low-level skills and/or resources were used. Automated tools and Script Kiddies
None - No special skills or resources were used. The average user could have done it

43
IR Case Metrics: Statistics and TrendsTargeted vs Opportunistic

44
IR Case Metrics: Statistics and TrendsVector

45
IR Case Metrics: Statistics and TrendsCompromised Asset

46
IR Case Metrics: Statistics and TrendsCompromised Data

47
IR Case Metrics: Statistics and TrendsTime Span
Point of entry to compromise = ~Hours
Compromise to discovery = ~Months
Discovery to mitigation = ~Weeks

48
How are breaches discovered?
IR Case Metrics: Statistics and Trends

49
IR Case Metrics: Statistics and TrendsIncident Discovery
50
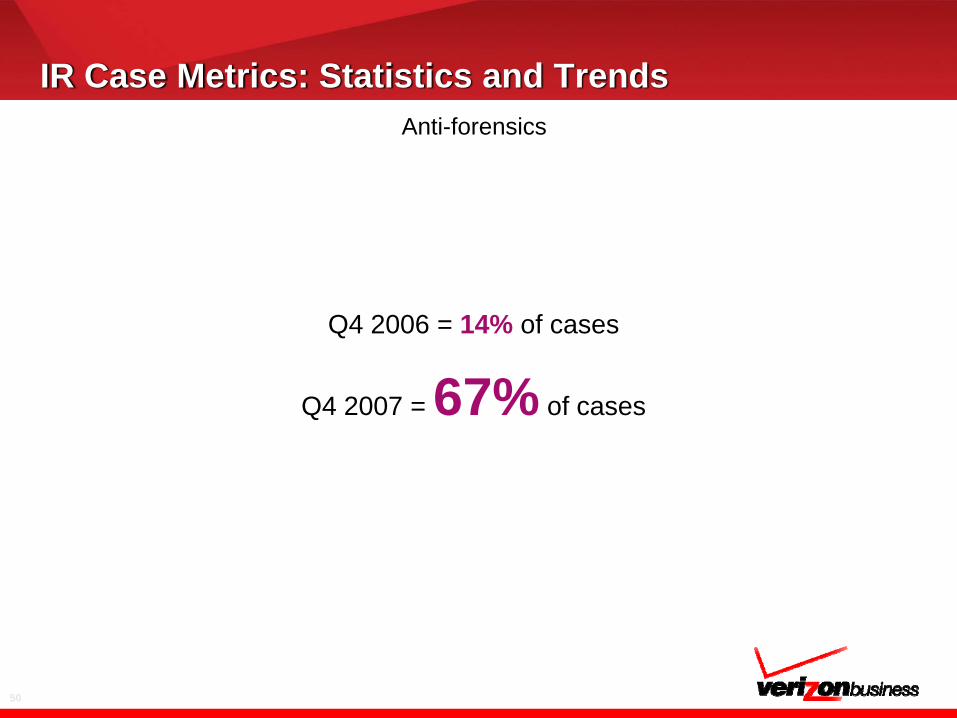
IR Case Metrics: Statistics and TrendsAnti-forensics
Q4 2006 = 14% of cases
Q4 2007 = 67% of cases
51
Can breaches be prevented?
IR Case Metrics: Statistics and Trends

52
IR Case Metrics: Statistics and Trends
87% of incidents could have been avoided through the use of "due diligence" or "reasonable" security controls.
Yes.

53
IR Case Metrics: Statistics and TrendsUnknown Unknowns

54
IR Case Metrics: Statistics and Trends
% of cases that would likely have been prevented (or at least
substantially mitigated) if the control had been in place (or of better
quality) at the time of the attack
Asset / Data discovery & classification 70%
Software / App development standards 57%
Minimization or removal of replicated data 52%
Identity Management 50%
More restrictive access privileges 50%
Firewalls / Routers configured for default-deny 47%
Network segmentation or zoning 47%
More consistent vulnerability patching 47%
System hardening / minimal config 47%
Disk Encryption 47%
IDS / Network monitoring 43%
55
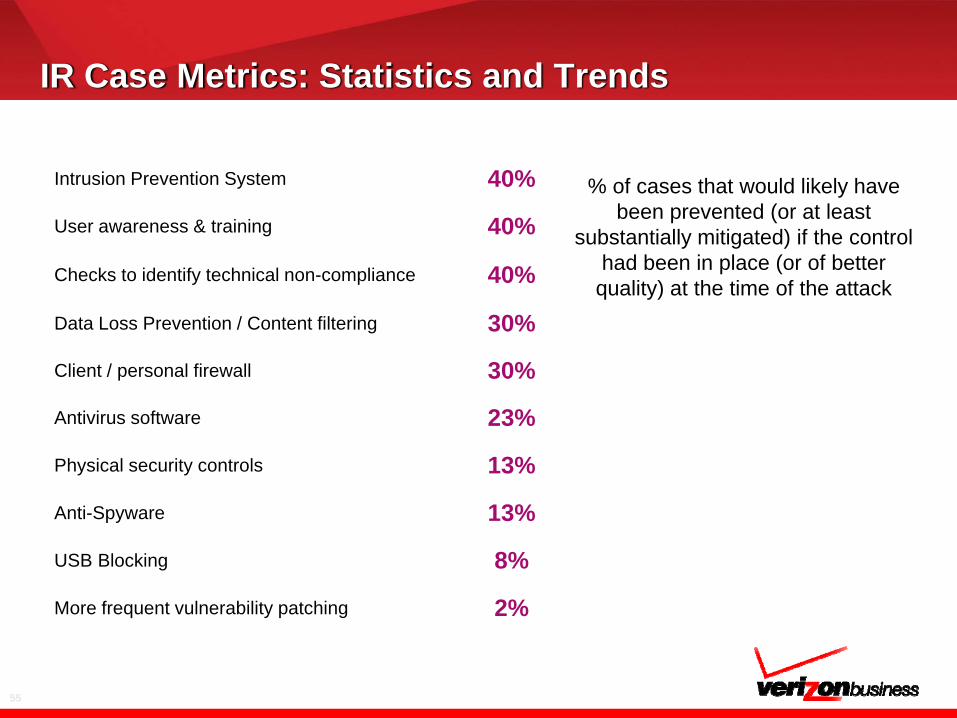
IR Case Metrics: Statistics and Trends
Intrusion Prevention System 40%
User awareness & training 40%
Checks to identify technical non-compliance 40%
Data Loss Prevention / Content filtering 30%
Client / personal firewall 30%
Antivirus software 23%
Physical security controls 13%
Anti-Spyware 13%
USB Blocking 8%
More frequent vulnerability patching 2%
% of cases that would likely have been prevented (or at least
substantially mitigated) if the control had been in place (or of better
quality) at the time of the attack
Top Related