


Languages
Pages
Legal

Introduction à Python pour la programmation scientifique
Sophie Bouffiès-Cloché, Marc-Antoine Drouin, Dmitry Khvorostyanov, Estelle Lorant, Vincent Noel, Jean-Yves Peterschmitt,
LMD, IPSL/CNRS-X-ENS-UPMC
Journée de formation IPSL – 2014-12-02Ecole Polytechnique, Palaiseau, France

III. Python pour la science : outils et librairies

1. IPythonL'interpréteur Python de base est un peu limité
•pas de cd, ls, rappels de lignes, etc.
• IPython : un interpréteur Python amélioré complète les commandes, fichiers/dossiers avec Tab aide intégrée : help(plot) affichage numérique et graphique interactif (cf la suite) raccourcis à la Matlab : cd, ls, pwd, !mkdir, who ça serait dommage de ne pas s'en servir v2.3 cette année ! (notebooks etc) http://ipython.org
•Astuce : ^d pour quitter


2. Modules Scientifiques
Deux modules importants•numpy•matplotlib
Et quelques autres•scipy•netCDF4•Basemap
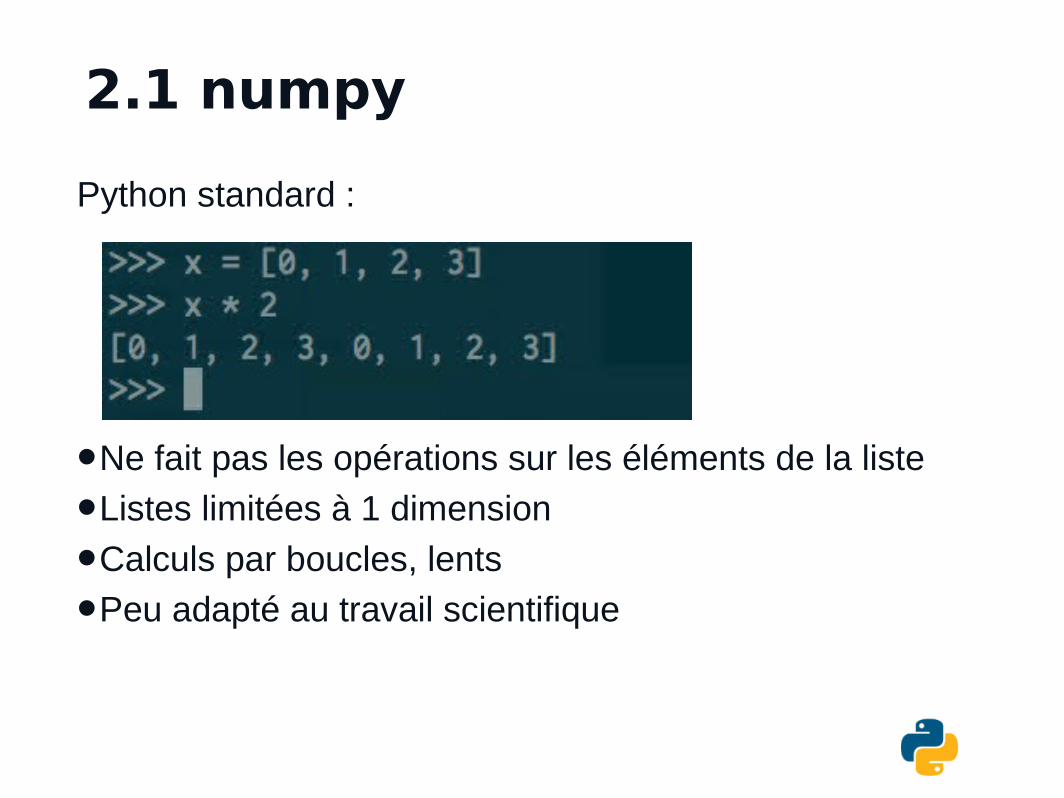
2.1 numpy
Python standard :
•Ne fait pas les opérations sur les éléments de la liste
•Listes limitées à 1 dimension
•Calculs par boucles, lents
•Peu adapté au travail scientifique

2.1 numpy•depuis 1995, suite de Numeric/numarray, aujourd’hui à v.1.9
• type "tableau de type fixe" à n dimensionsox = array([0, 1, 2, 3])oou x = r_[0, 1, 2, 3], x = r_[0:4]ooptimisé pour manipulations numériqueso très rapide
•scipy, matplotlib, netCDF, HDF... parlent numpy
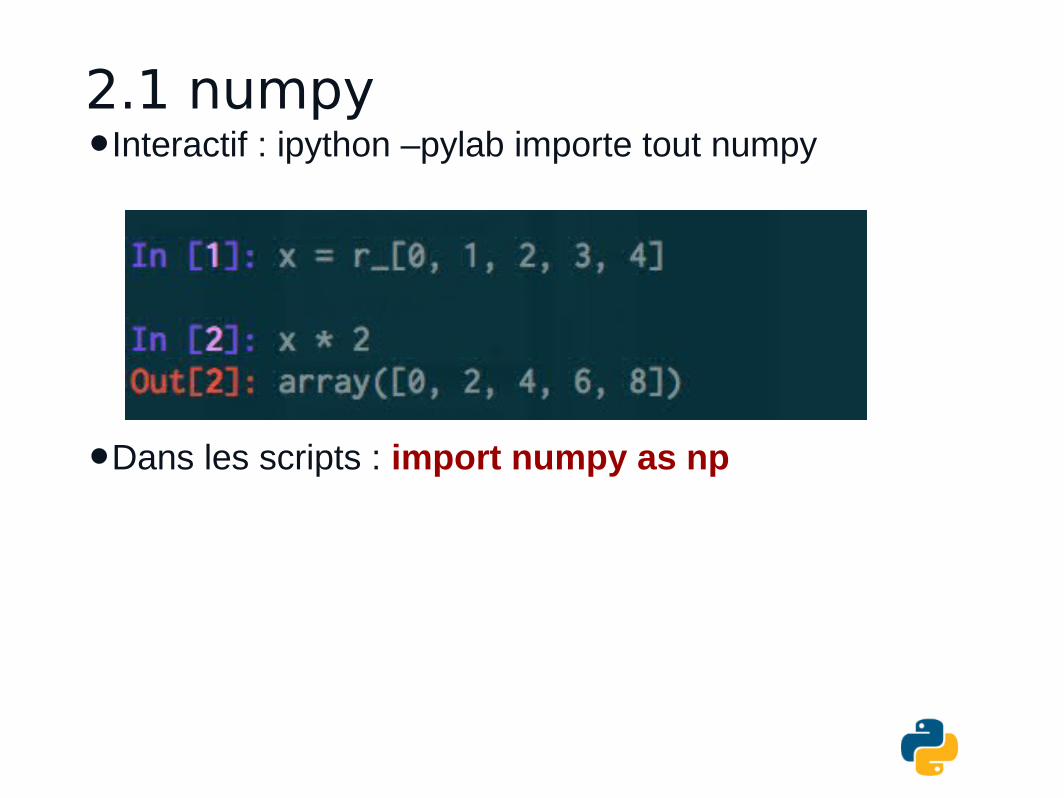
2.1 numpy•Interactif : ipython –pylab importe tout numpy
•Dans les scripts : import numpy as np

2.1 numpy
On indexe numpy comme une liste à n dimensions.
•x = r_[0:2:0.01]
•x[0], x[50:], x[:-10]
•x[:,:,:,3]
•x[x < 3] = 0
•x=x.T # transpose
•x=a*b
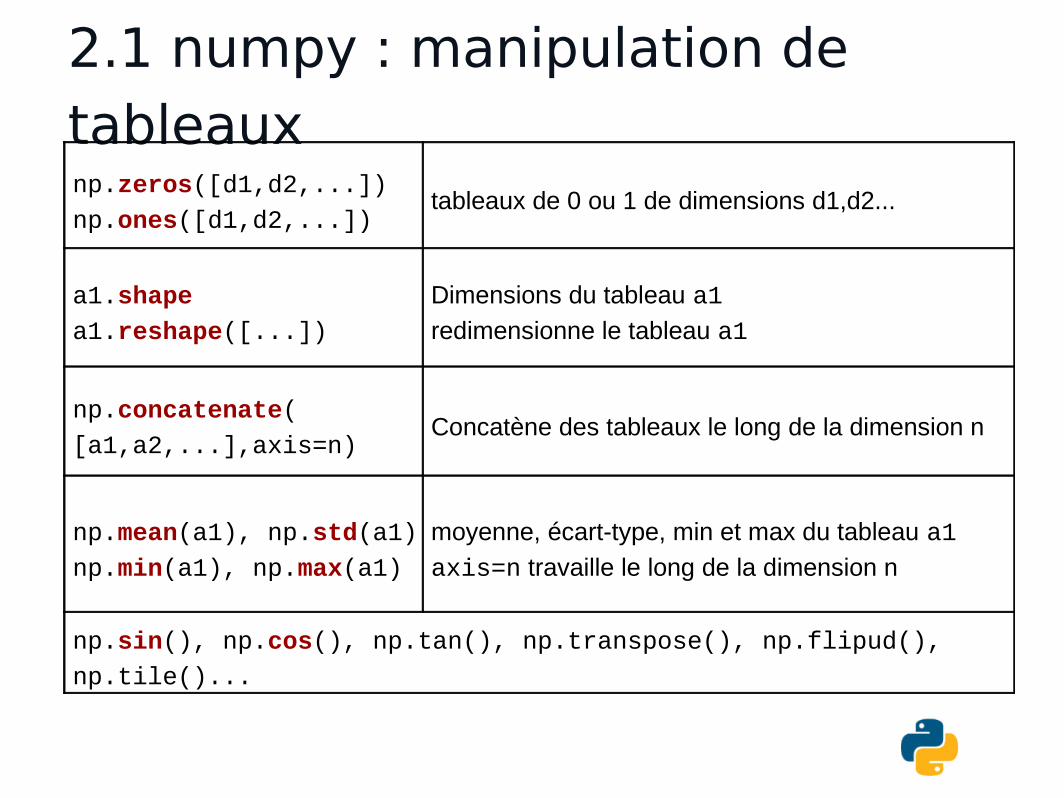
2.1 numpy : manipulation de tableauxnp.zeros([d1,d2,...])
np.ones([d1,d2,...])tableaux de 0 ou 1 de dimensions d1,d2...
a1.shape
a1.reshape([...])
Dimensions du tableau a1
redimensionne le tableau a1
np.concatenate(
[a1,a2,...],axis=n)Concatène des tableaux le long de la dimension n
np.mean(a1), np.std(a1)
np.min(a1), np.max(a1)
moyenne, écart-type, min et max du tableau a1
axis=n travaille le long de la dimension n
np.sin(), np.cos(), np.tan(), np.transpose(), np.flipud(),
np.tile()...
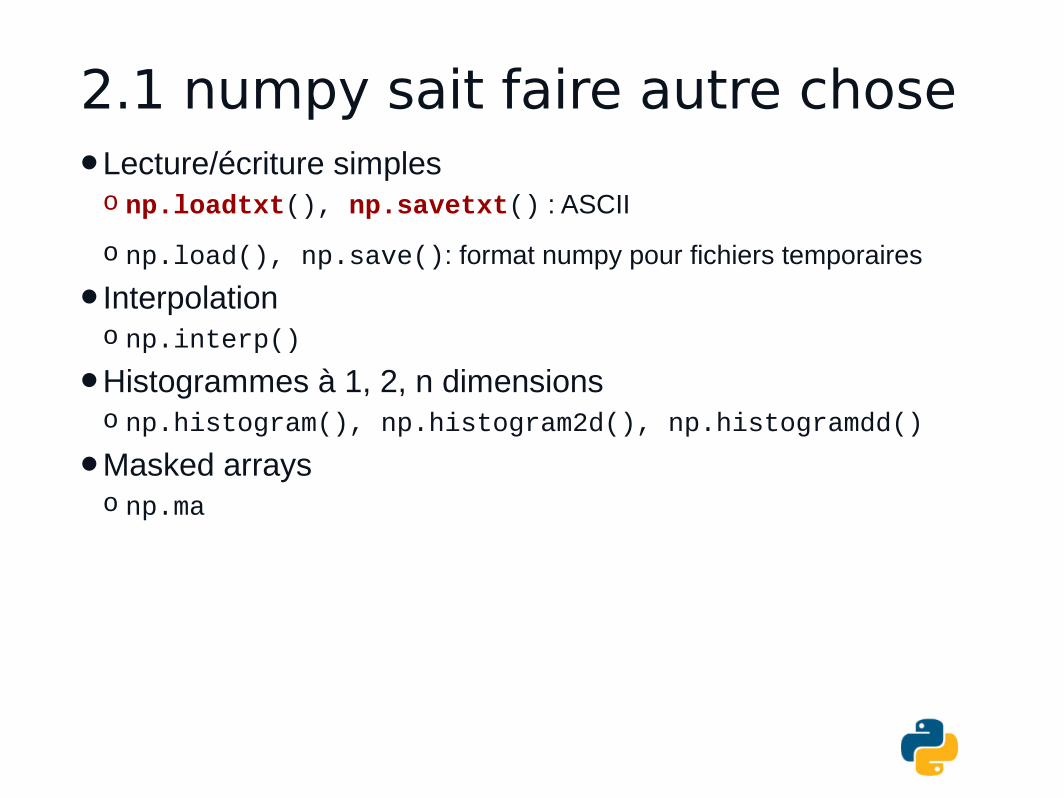
2.1 numpy sait faire autre chose•Lecture/écriture simpleso np.loadtxt(), np.savetxt() : ASCII
o np.load(), np.save(): format numpy pour fichiers temporaires
• Interpolationo np.interp()
•Histogrammes à 1, 2, n dimensions o np.histogram(), np.histogram2d(), np.histogramdd()
•Masked arrayso np.ma
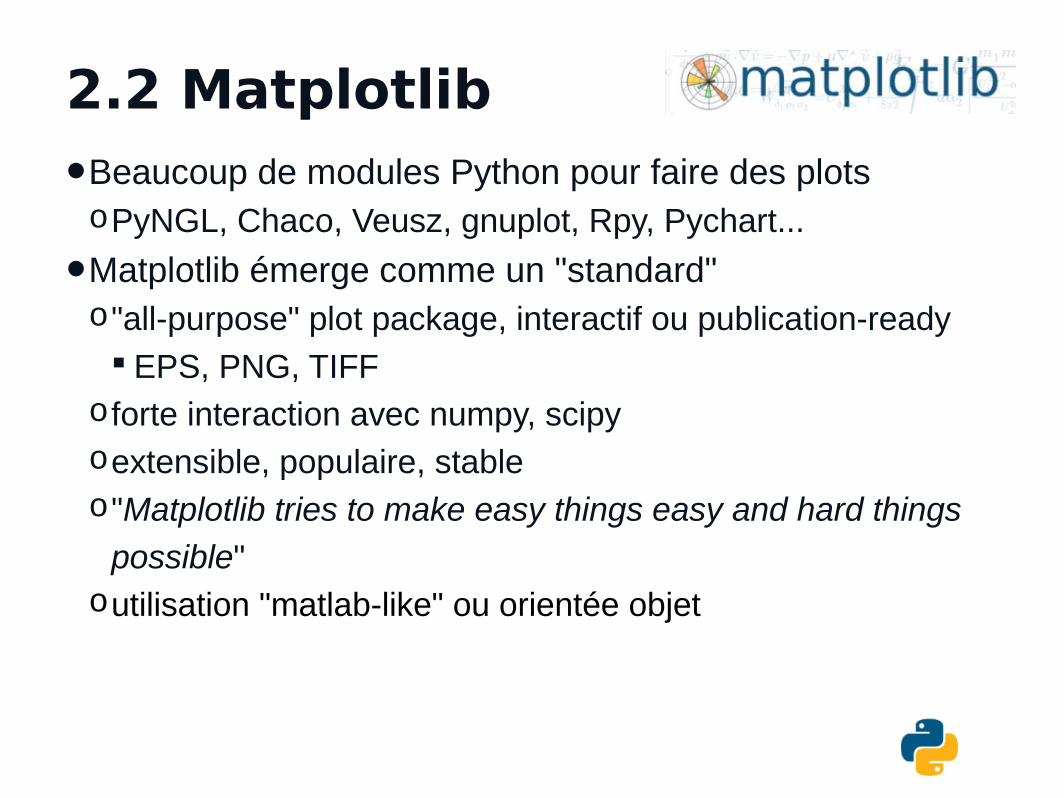
2.2 Matplotlib
•Beaucoup de modules Python pour faire des plotsoPyNGL, Chaco, Veusz, gnuplot, Rpy, Pychart...
•Matplotlib émerge comme un "standard"o"all-purpose" plot package, interactif ou publication-ready EPS, PNG, TIFF
oforte interaction avec numpy, scipyoextensible, populaire, stableo"Matplotlib tries to make easy things easy and hard things
possible" outilisation "matlab-like" ou orientée objet
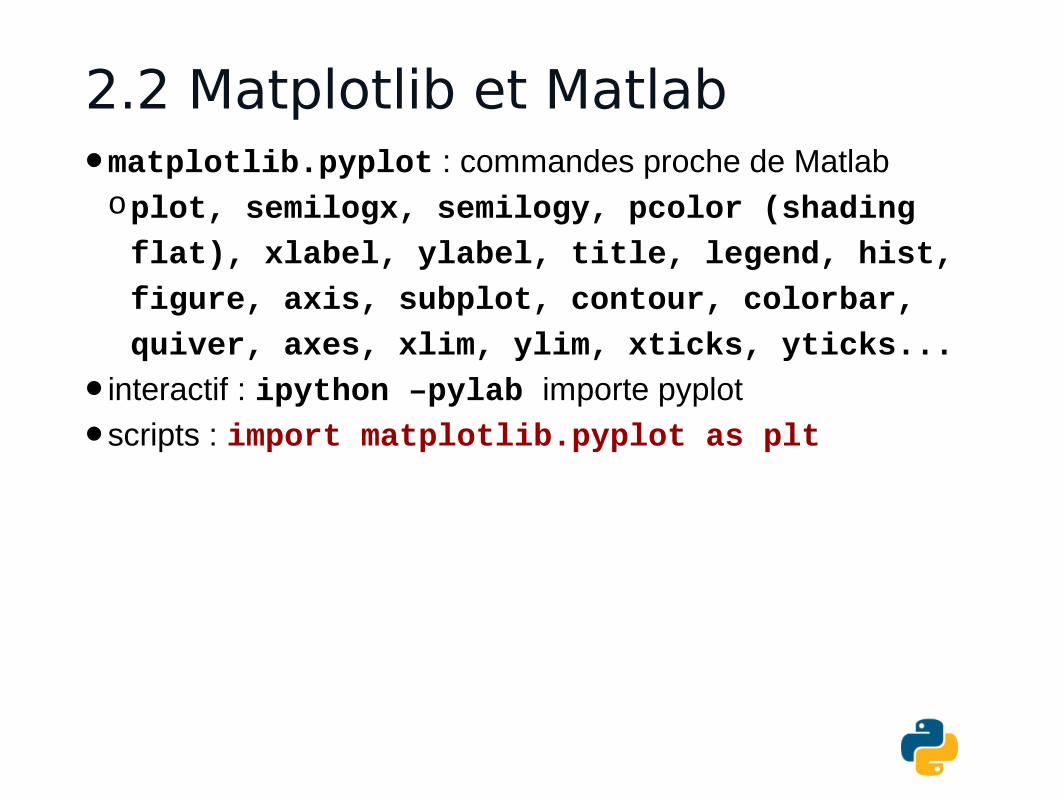
2.2 Matplotlib et Matlab•matplotlib.pyplot : commandes proche de Matlaboplot, semilogx, semilogy, pcolor (shading
flat), xlabel, ylabel, title, legend, hist,
figure, axis, subplot, contour, colorbar,
quiver, axes, xlim, ylim, xticks, yticks...
• interactif : ipython –pylab importe pyplot
•scripts : import matplotlib.pyplot as plt
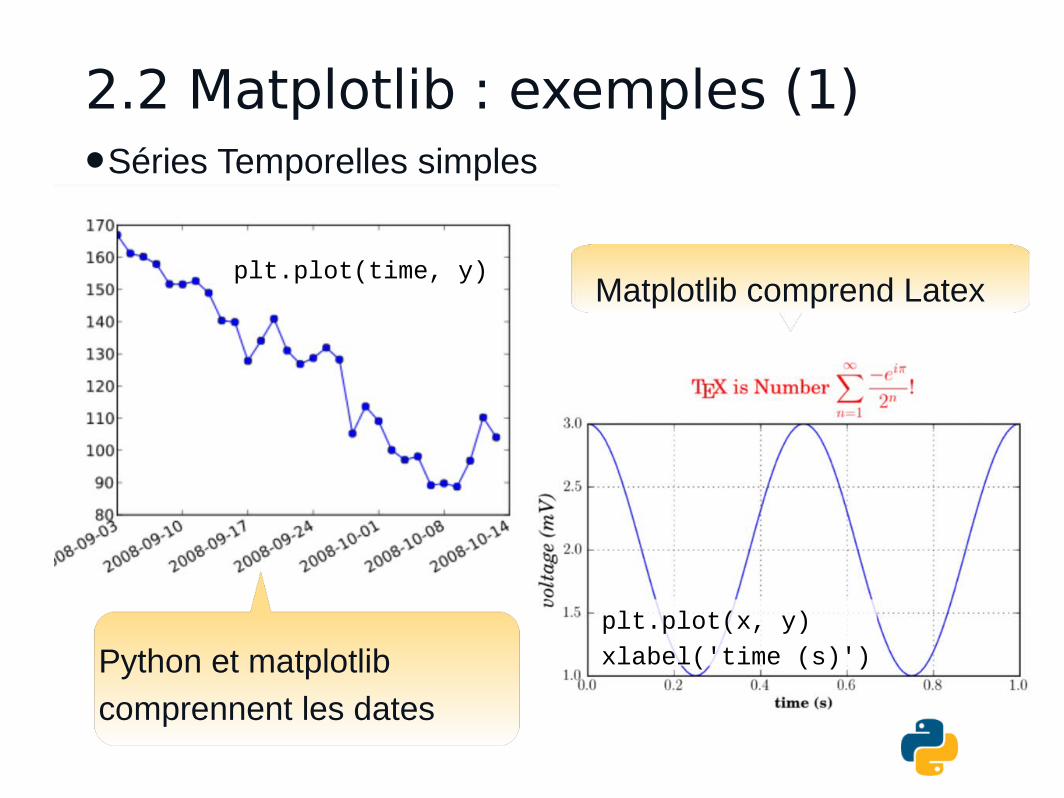
2.2 Matplotlib : exemples (1)•Séries Temporelles simples
Python et matplotlib
comprennent les dates
Matplotlib comprend Latex plt.plot(time, y)
plt.plot(x, y)
xlabel('time (s)')
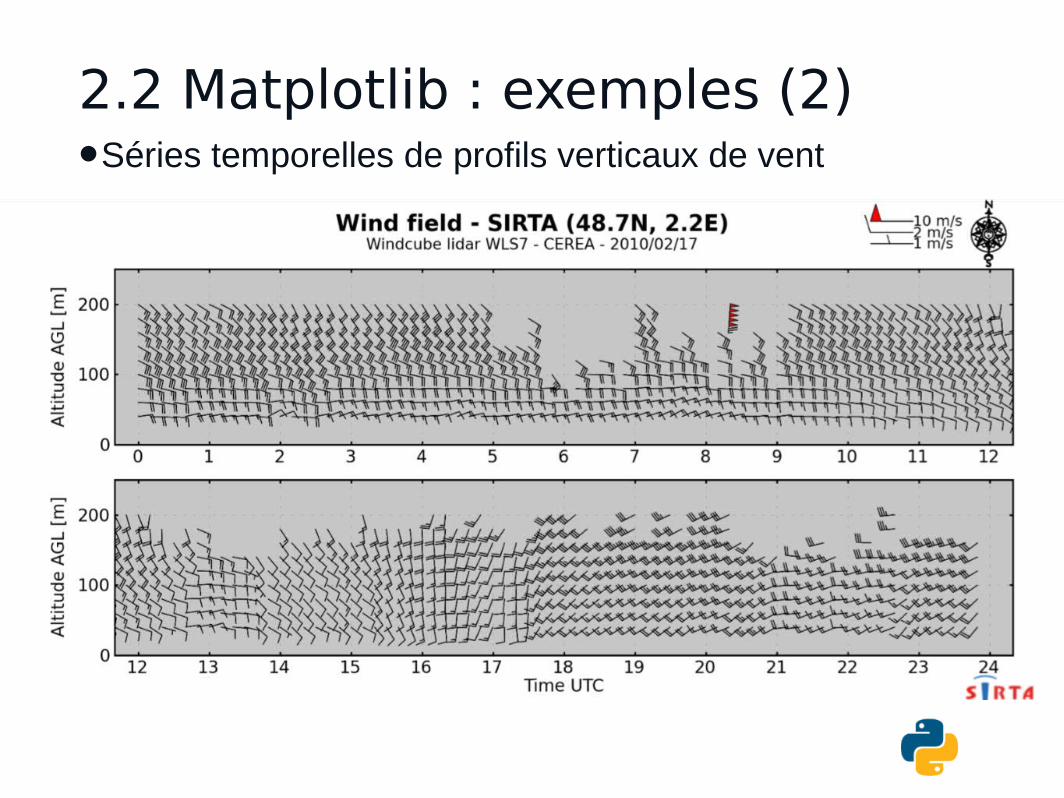
2.2 Matplotlib : exemples (2)•Séries temporelles de profils verticaux de vent

2.2 Matplotlib : exemples (3)•Contours avec labels
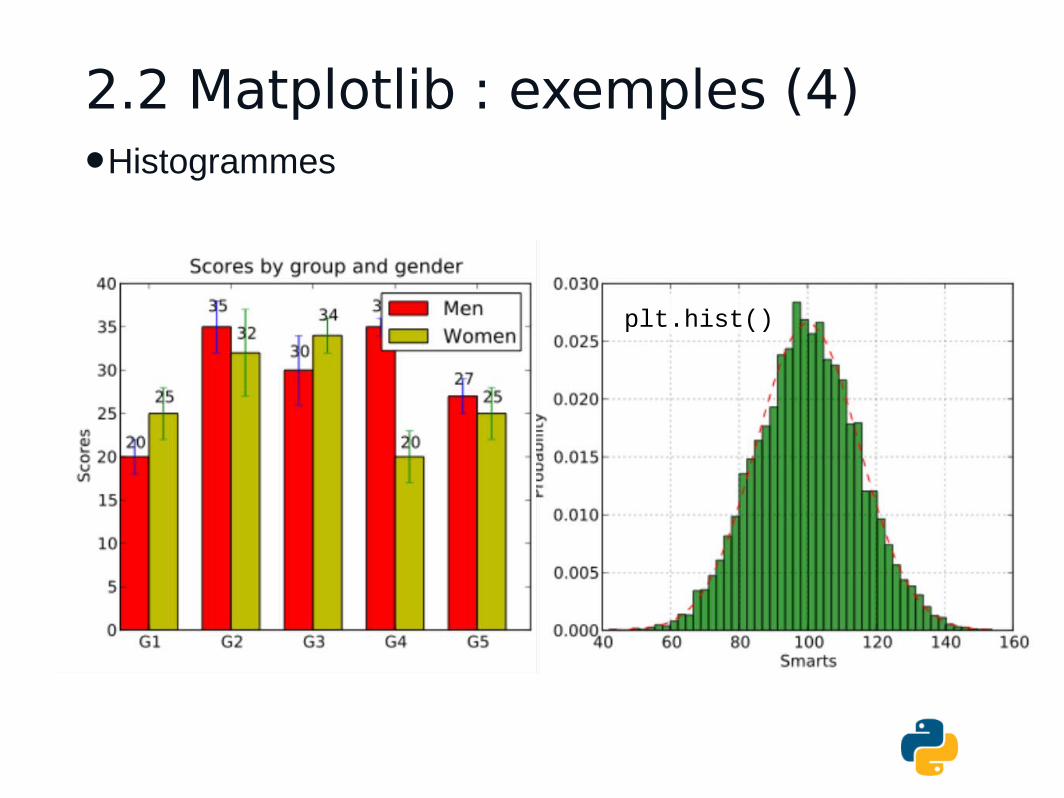
•Histogrammes
2.2 Matplotlib : exemples (4)
plt.hist()
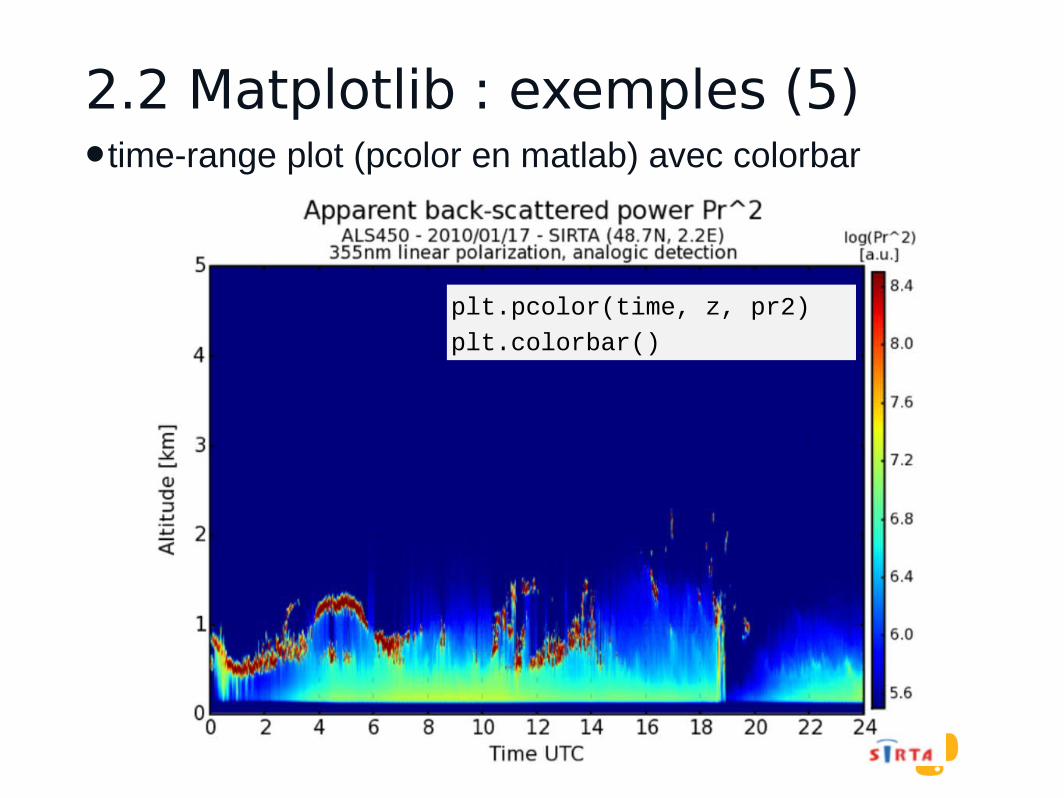
2.2 Matplotlib : exemples (5)•time-range plot (pcolor en matlab) avec colorbar
plt.pcolor(time, z, pr2)
plt.colorbar()
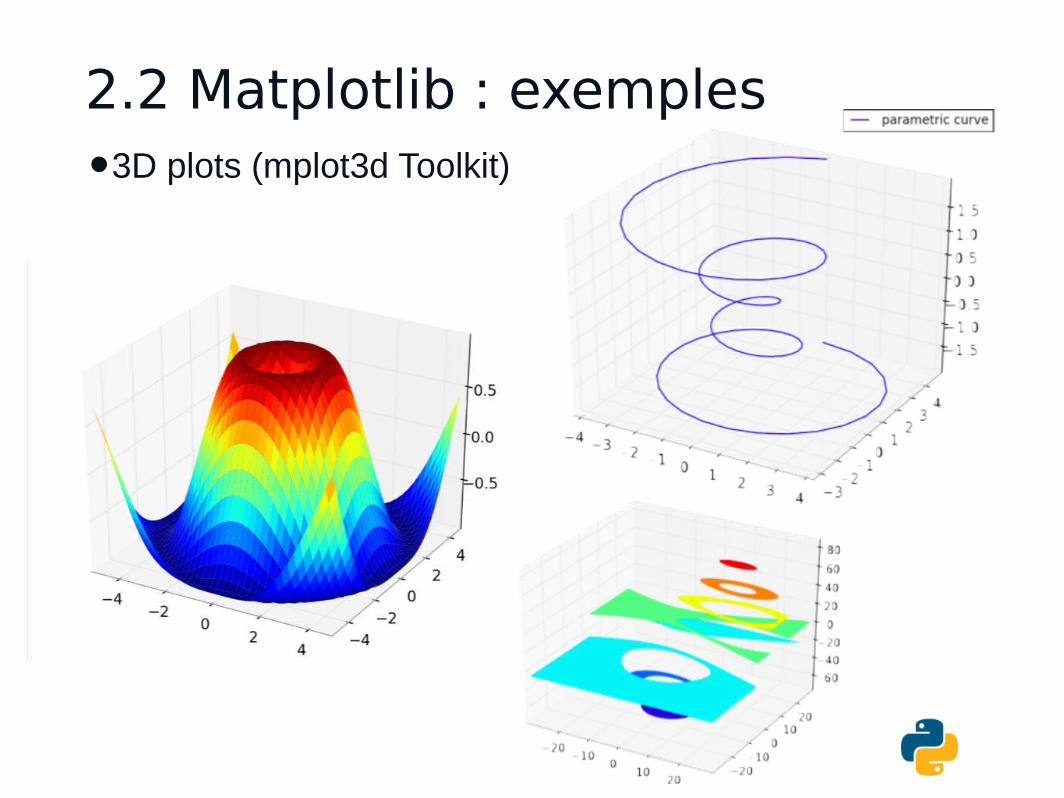
2.2 Matplotlib : exemples•3D plots (mplot3d Toolkit)

2.2 Matplotlib : etc.
http://matplotlib.org/gallery.html
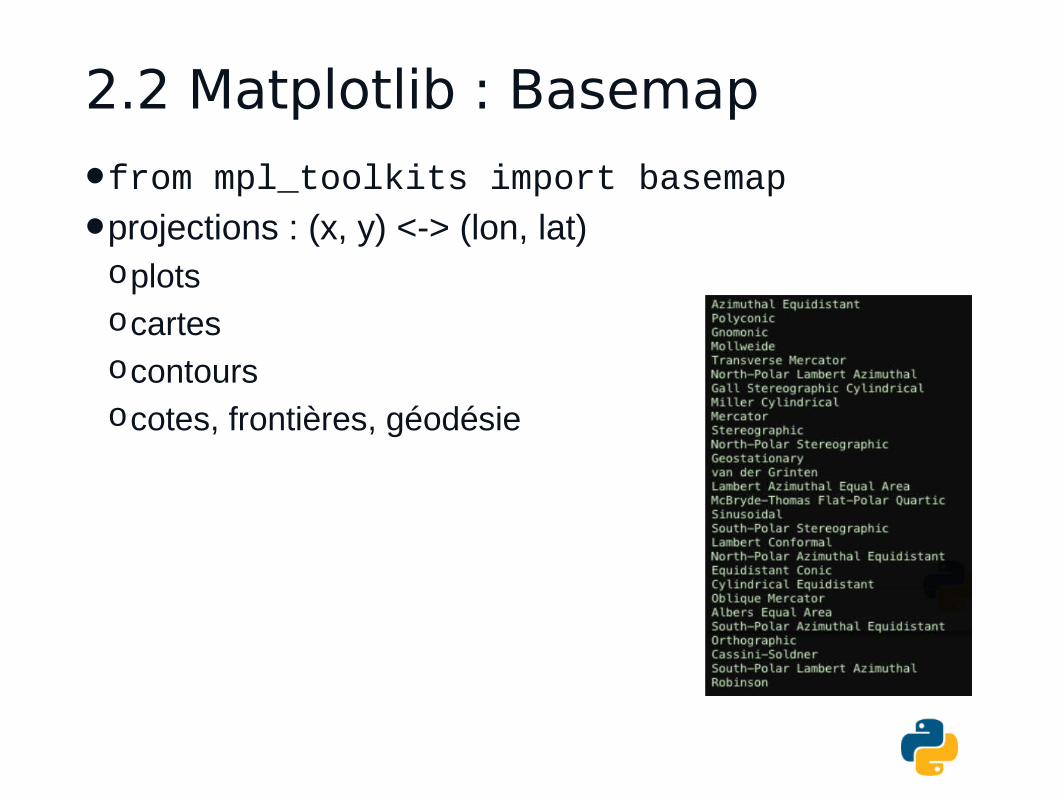
2.2 Matplotlib : Basemap
•from mpl_toolkits import basemap•projections : (x, y) <-> (lon, lat)oplotsocartesocontoursocotes, frontières, géodésie
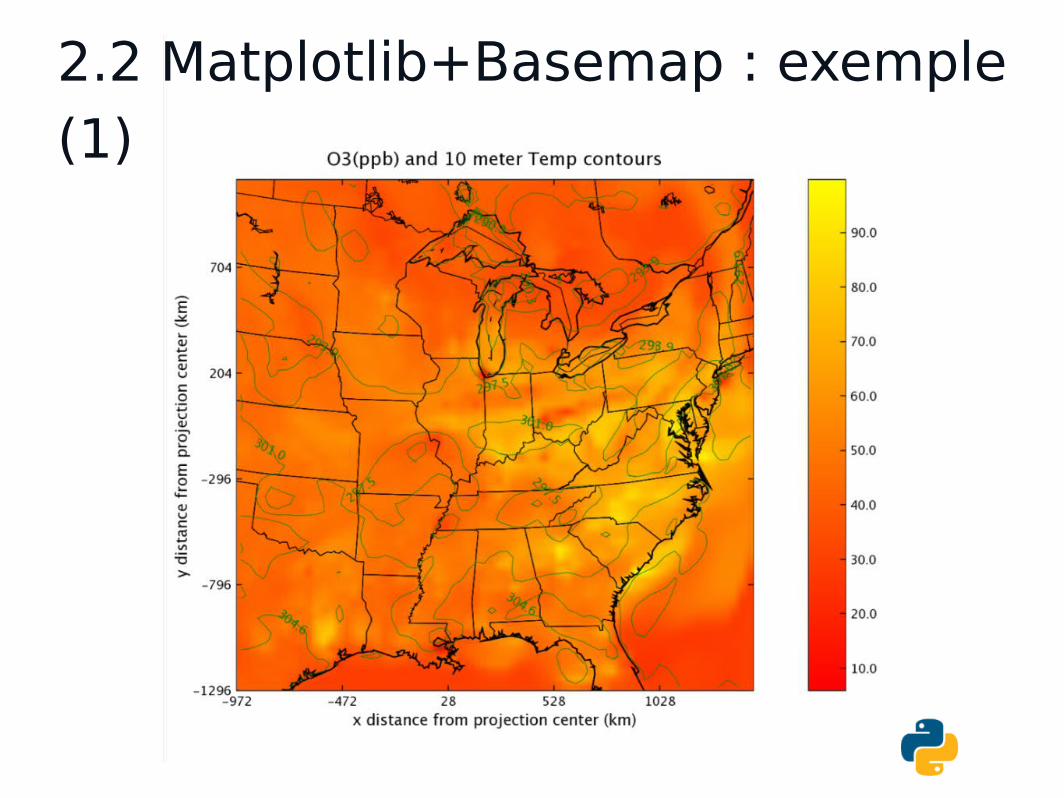
2.2 Matplotlib+Basemap : exemple (1)
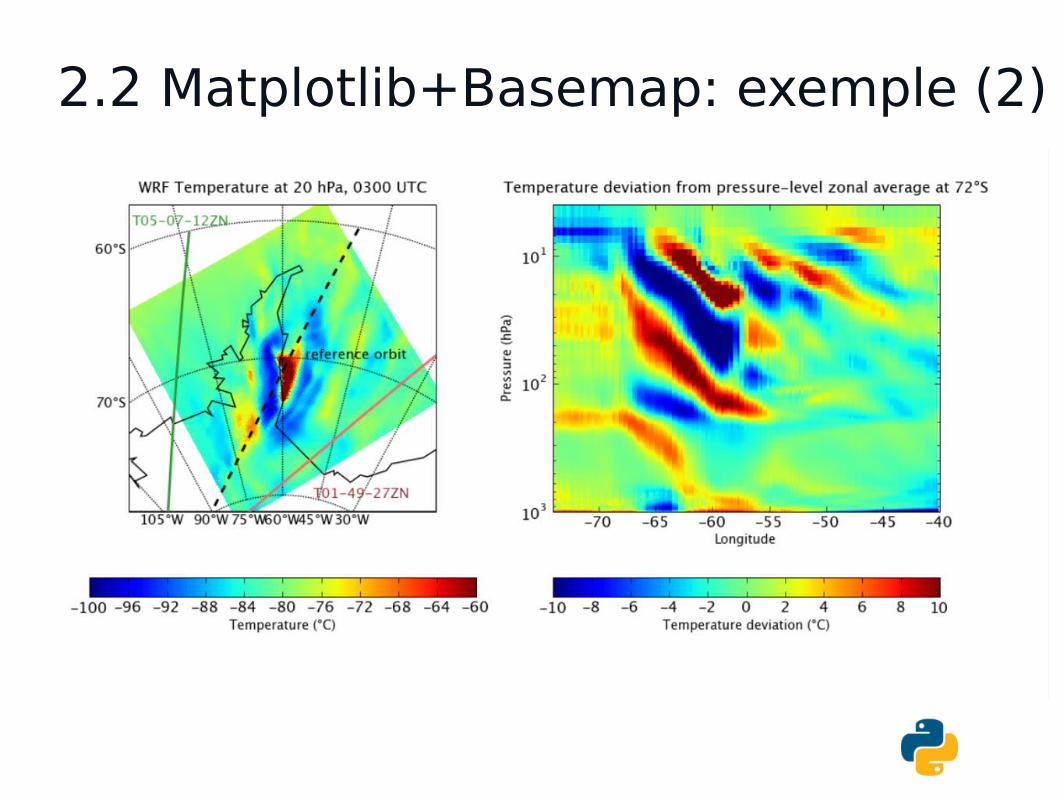
2.2 Matplotlib+Basemap: exemple (2)

2.3 scipy•fonctions mathématiques spécialisées
•regroupées par thèmes dans des sous-moduleso ndimage - multi-dimensional image processingo stats - statistiqueso io - lecture/écriture (netCDF3, ASCII, Matlab)o signal - signal processingo interpolate - interpolations n-dimensions linéaires, cubiques, quadratiques,
splines et autreso linsolve, odeint - linear equation / ordinary differential equations solverso fftpack - transformees de Fouriero integrate...
•Impossible de tout couvrir, Google is your friend
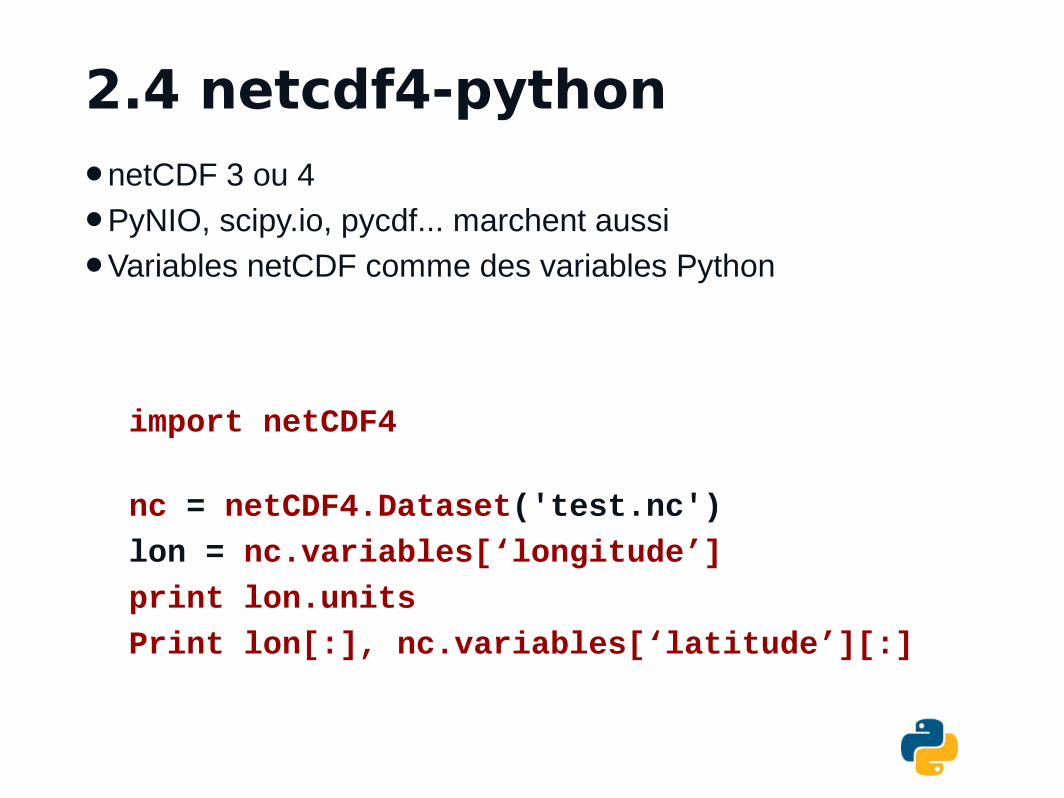
2.4 netcdf4-python
•netCDF 3 ou 4
•PyNIO, scipy.io, pycdf... marchent aussi
•Variables netCDF comme des variables Python
import netCDF4
nc = netCDF4.Dataset('test.nc')
lon = nc.variables[‘longitude’]
print lon.units
Print lon[:], nc.variables[‘latitude’][:]

All together now#!/usr/bin/env python
import numpy as np
import matplotlib.pyplot as plt
import netCDF4
from mpl_toolkits.basemap import Basemap
nc = netCDF4.Dataset('geo_em.d01.nc')
lat = nc.variables['XLAT_M'][0,:,:]
lon = nc.variables['XLONG_M'][0,:,:]
hgt = nc.variables['HGT_M'][0,:,:]
m = Basemap(projection='lcc',lat_0=-70,lon_0=-60,
width=3000*1000,height=3000*1000)
x, y = m(lon, lat)
m.pcolor(x, y, hgt)
m.drawmapboundary()
m.drawmeridians(color='grey')
m.drawparallels(color='grey')
m.drawcoastlines(color='grey')
plt.colorbar().set_label('Elevation [m]')
plt.savefig('example_basemap.png')

pour rire : essayer de faire la même chose en Fortran
18 lignes de Python

Autres modules
•pyhdf - lecture/écriture HDF4•pyh5, PyTables - lecture/écriture HDF5•PyNIO - lecture/écriture GRIB1 et 2, HDFEOS•PyWavelets - transformées en ondelettes•shapely - géométrie planaire•GIS-Python - geographic information systems•SymPy - calcul symbolique à la Mathematica/Maple•PyClimate - analyses de series climatiques• ...
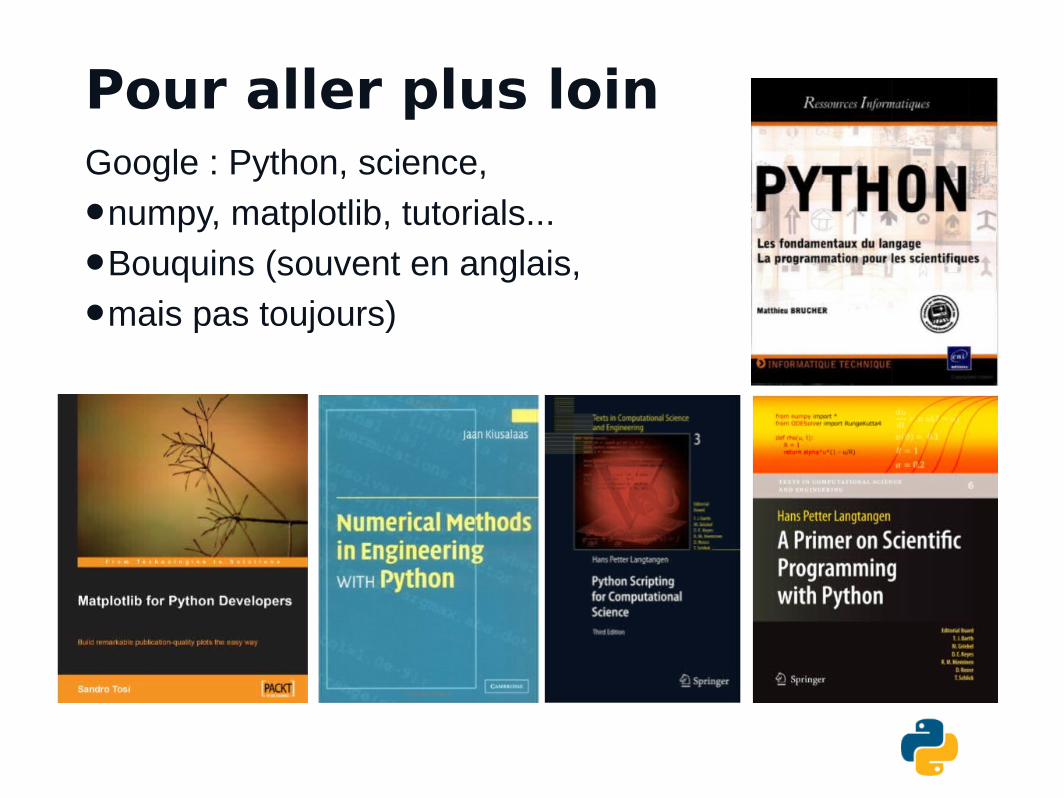
Google : Python, science,
•numpy, matplotlib, tutorials...
•Bouquins (souvent en anglais,
•mais pas toujours)
Pour aller plus loin

Merci pour votre attention
Questions ?
Top Related