


Languages
Pages
Legal

Ing. Carlos Pierro Ing. Carlos Pierro
Comité Argentino del Consejo Mundial de la Comité Argentino del Consejo Mundial de la EnergíaEnergía
Buenos Aires, 28, 29 y 30 de noviembere de 2007
SEMINARIO SEMINARIO
““ENERGIA PARA POLITICOS”ENERGIA PARA POLITICOS”

Energías Primarias
Forma Energía Secundarias
Carbón Antracita-Bituminosa-Subituminoso
Electricidad – Gas – Combustibles Líquidos (gas oil – gasolina) – calor
Petróleo Normal-Oil shale – extra pesado -
Electricidad – naftas – fuel oil – gas oil – asfaltos – parafinas – lubricantes – petroquímica – gas – calor.
Gas Electricidad – líquidos – naftas – gasoil – otros – calor – propano – butano – petroquímica.
HID
RO
CA
RB
UR
OS
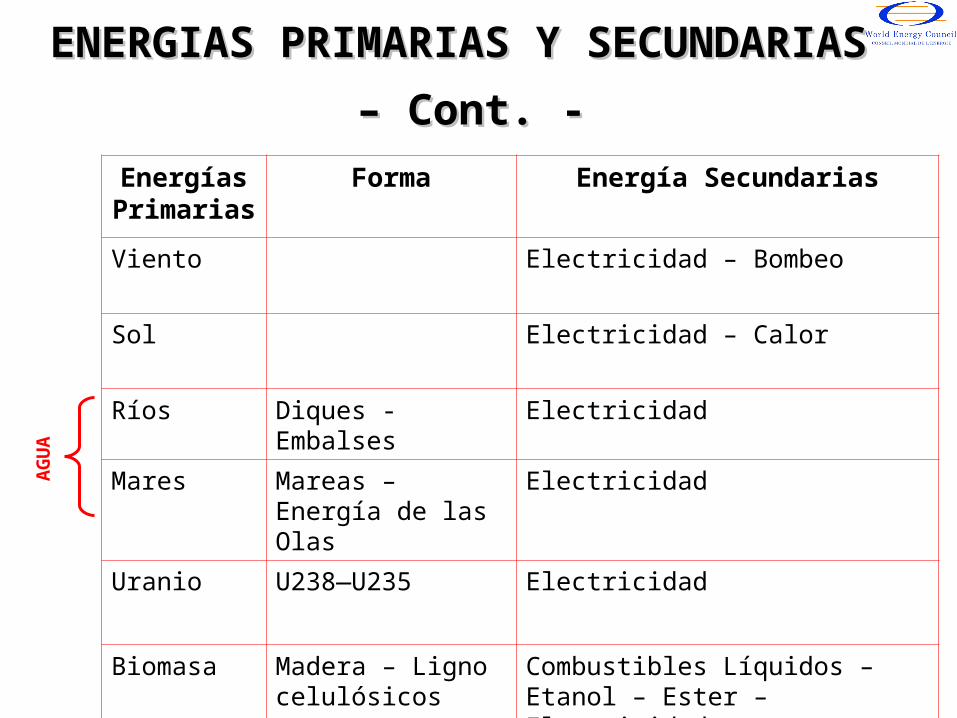
ENERGIAS PRIMARIAS Y ENERGIAS PRIMARIAS Y SECUNDARIASSECUNDARIAS
Energías Primarias
Forma Energía Secundarias
Viento Electricidad – Bombeo
Sol Electricidad – Calor
Ríos Diques - Embalses Electricidad
Mares Mareas – Energía de las Olas
Electricidad
Uranio U238—U235 Electricidad
Biomasa Madera – Ligno celulósicos
Combustibles Líquidos – Etanol – Ester – Electricidad
AG
UA
ENERGIAS PRIMARIAS Y SECUNDARIAS ENERGIAS PRIMARIAS Y SECUNDARIAS
– – Cont. -Cont. -

8573 7238
13370 1391810122 13281
8183 8208
9495 11032
RESERVAS DE PETROLEORESERVAS DE PETROLEOMillones de Toneladas
Equivalentes de Petroleo (MTEP)
Reservas 2001
Reservas 2004
Reservas Totales año 2001 143.000 x
106 Tep
Reservas Totales año 2004 148.342 x
106 Tep
Fuente: Survey of Energy Resources 1999 - 2004WEC
321 502
92242 94344

6810 6960
5400 5460
14650 14490
RESERVAS DE GASRESERVAS DE GAS Millones de Toneladas
Equivalentes de Petroleo (MTEP)
Reservas 2001
Reservas 2004
Reservas Totales 2001 131.000 x 10⁶
Tep
Reservas Totales 2004 146.200 x 10⁶
Tep
Fuente: Survey of Energy Resources 1999 – 2004 WEC
1140 16609771 11151
45590 60950
45850 46007

9 11 63 70 290 317 8 7 6 9 10 12 12 80
10
20
30
40
50
60
70
80
90
100
Año 2001 Año 2004
DISTRIBUCIÓN REGIONAL DE DISTRIBUCIÓN REGIONAL DE PETROLEO RATIO RESERVAS / PETROLEO RATIO RESERVAS /
CONSUMO 2001 - 2004CONSUMO 2001 - 2004
Añ
os
ÁFRICA AMERICA MEDIO AMERICA ASIA EUROPA OCEANIA
DEL SUR ORIENTE DEL NORTE Fuente: Survey of Energy Resources 2004 WEC

Añ
os
ÁFRICA AMERICA MEDIO AMERICA ASIA EUROPA OCEANIA
DEL SUR ORIENTE DEL NORTE
DISTRIBUCIÓN REGIONAL DE GAS NATURAL: DISTRIBUCIÓN REGIONAL DE GAS NATURAL: RATIO RESERVAS / CONSUMO 2001 -2004RATIO RESERVAS / CONSUMO 2001 -2004
203 183 94 71 296 32811 10
50 41 55 52 67 440
50
100
150
200
250
300
Año 2001 Año 2004
Fuente: Survey of Energy Resources 2004 WEC

Año 2004: 11.059,4 Millones de TEP
PETROLEO (34,3%)
EL MUNDO: EL MUNDO: MATRIZ ENERGÉTICA MATRIZ ENERGÉTICA
PRIMARIAPRIMARIA
Fuente: I.E.A. – Energy Statistics
HIDRAULICA (2,2%)
GAS NATURAL (20,8%)
NUCLEAR (6,4%)
CARBON (25,1%)
RENOVABLES (11,1%)

GENERACION MUNDIAL DE ENERGIA GENERACION MUNDIAL DE ENERGIA ELECTRICAELECTRICA
1%
15%
16%2%
19%7%
39% 1%
Carbón Petróleo Gas Nuclear
Hydro Otras renovables Eólica Geotérmica
Año 2004
Total: 17.406 Twh.Fuente: SER 2004 - World Energy Council
66%
26,2%
Carbón
Petróleo
Gas
Petróleo
Gas
71,6%Carbón
Nuclear
Hidro

ENERGY WORLDWIDE IN ENERGY WORLDWIDE IN 20042004

Los países de Medio Oriente,
tienen prácticamente el 64% de
las reservas de petróleo, pero
únicamente el 40% de la
producción.
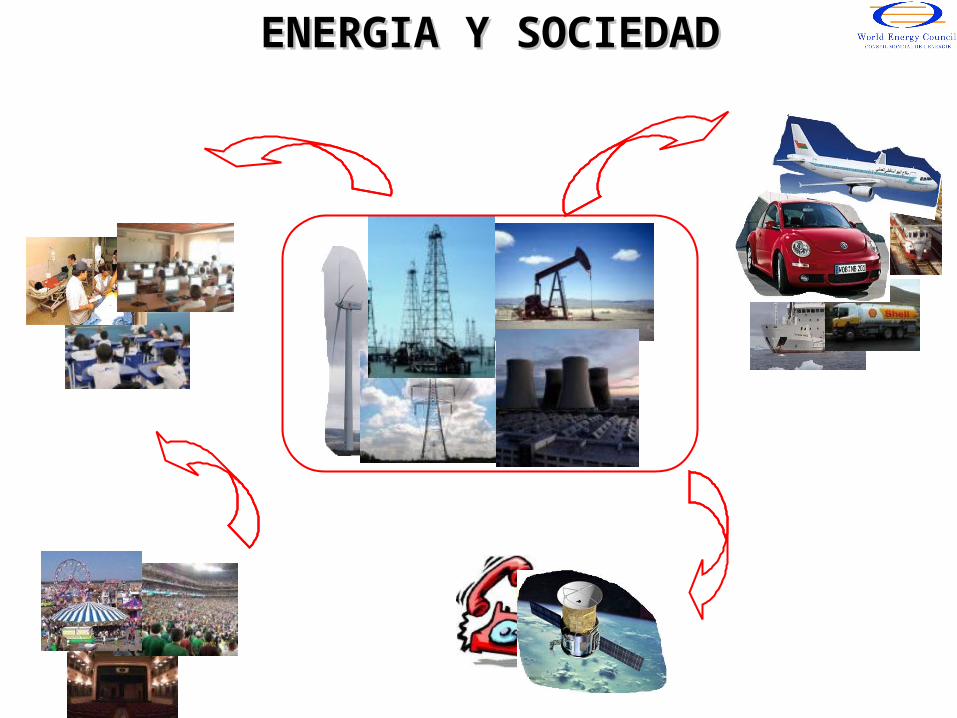
ENERGIA Y SOCIEDADENERGIA Y SOCIEDAD

El fenómeno en cifras
EL FENÓMENOEL FENÓMENO
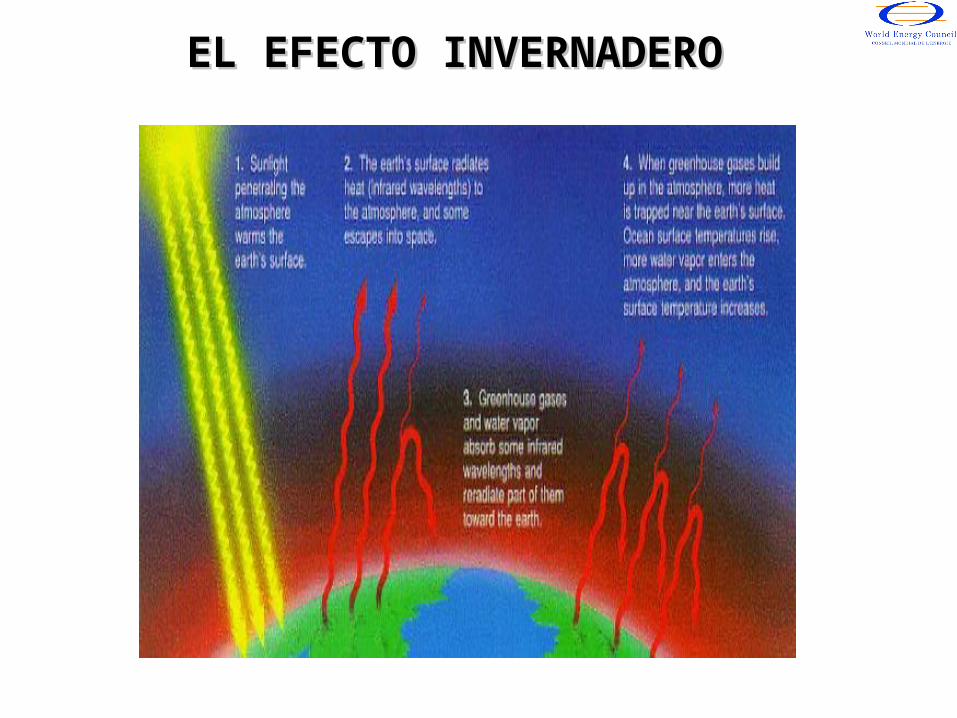
EL EFECTO INVERNADEROEL EFECTO INVERNADERO

CAMBIOS DE RÉGIMEN DE LLUVIASCAMBIOS DE RÉGIMEN DE LLUVIAS
http://www.nmw.ac.uk/tec2000/presentations/Young/sld005.htm
Cambios de régimen de lluvias que predice el modelo de cambio climático.Technical
Summary of the IPCC Working Group II Report, NINETEENTH SESSION OF THE
INTERGOVERNMENTAL PANEL ON CLIMATE CHANGE (IPCC) Geneva, 17-20 April 2002
(http://www.metoffice.com/research/hadleycentre/ipcc/index.html)

Gas Natural Petróleo Carbón
Óxidos de Nitrógeno
43 142 359
Dióxido de Azufre
0,3 430 731
Particulado 2 36 1333
EMISIONES DE COMBUSTIBLES EMISIONES DE COMBUSTIBLES FOSILESFOSILES

Gases de Efecto Invernadero Considerados
Potencial de Calentamiento Global (PCG)
Dioxido de Carbono 1
Metano 21
Oxido Nitroso 310
HFCs 140-11700
PCFs 6500-9200
Hexafluoruro de Azufre 23900
Emisiones antrópicas, representan no más del 5% de las emisiones totales
LOS SEIS GASESLOS SEIS GASES

CO2 annual emission per capita from IEA data
0
5
10
15
20
25
1970 1975 1980 1985 1990 1995 2000
year
US+Canada
FSU
W.Europe
ME
World
LatAm
China
Africa
LA RESPONSABILIDADLA RESPONSABILIDAD

LA RESPONSABILIDAD: LA RESPONSABILIDAD: EMISIONES ENERGÉTICASEMISIONES ENERGÉTICAS

TABLA DE UNIDADESTABLA DE UNIDADESTonelada 1000 kg = 7,3 barriles
Kcal. Calor para levantar 1ºC 1000 lts. agua
BTU - British Thermal Unit - = 0,252 kcal.
M3 = 35 p3
TEP - Tonelada Equivalente de Petróleo -
= 107 kcal.
106 BTU = 252.000 kcal
= 27m3 gas
= 2,5 % TEP
= 0,18 barriles petróleo
1 Tcf – Trillion Cubic Feet - = 28600 x 106 m3
1 Kw. = 1.000 watts
1 Mw. = 1.000.000 watts
1 Gw. = 1.000 millones watts
1 Tw. = 1 billón watts
Unidades

Ing. Carlos Pierro Ing. Carlos Pierro
Comité Argentino del Consejo Mundial de la Comité Argentino del Consejo Mundial de la EnergíaEnergía
Buenos Aires, 28, 29 y 30 de noviembere de 2007
SEMINARIO SEMINARIO
““ENERGIA PARA POLITICOS”ENERGIA PARA POLITICOS”
Top Related