


Languages
Pages
Legal

Holger Hohrein
Frankfurt/Main, 27 January 2015
Figures unaudited
> Analysts’ conference
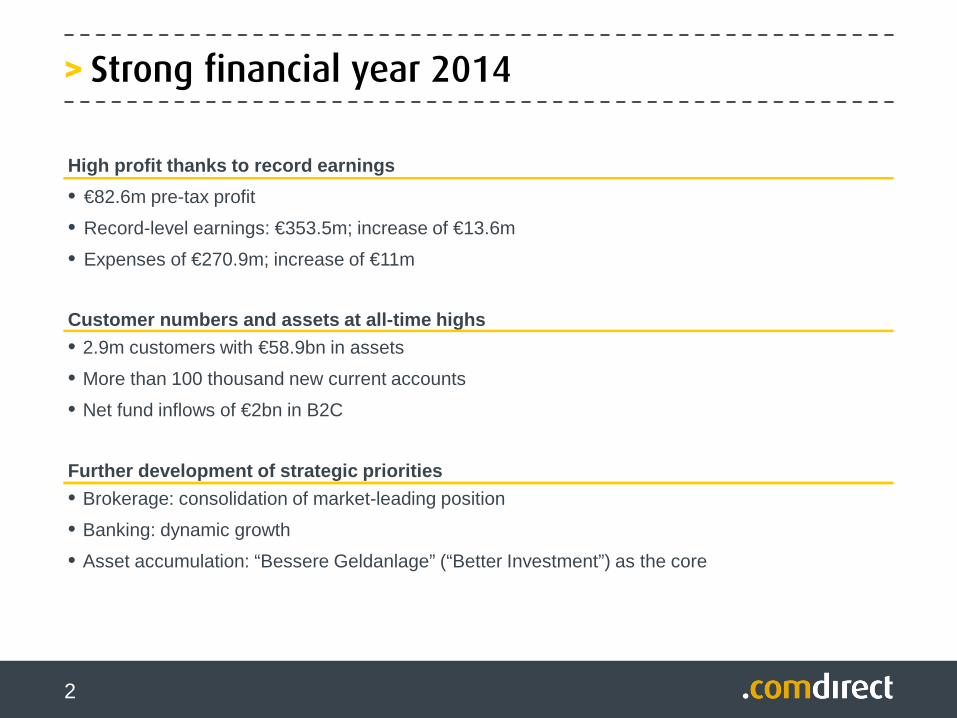
Further development of strategic priorities• Brokerage: consolidation of market-leading position
• Banking: dynamic growth
• Asset accumulation: “Bessere Geldanlage” (“Better Investment”) as the core
2
> Strong financial year 2014
2
High profit thanks to record earnings
• €82.6m pre-tax profit
• Record-level earnings: €353.5m; increase of €13.6m
• Expenses of €270.9m; increase of €11m
Customer numbers and assets at all-time highs• 2.9m customers with €58.9bn in assets
• More than 100 thousand new current accounts
• Net fund inflows of €2bn in B2C
3
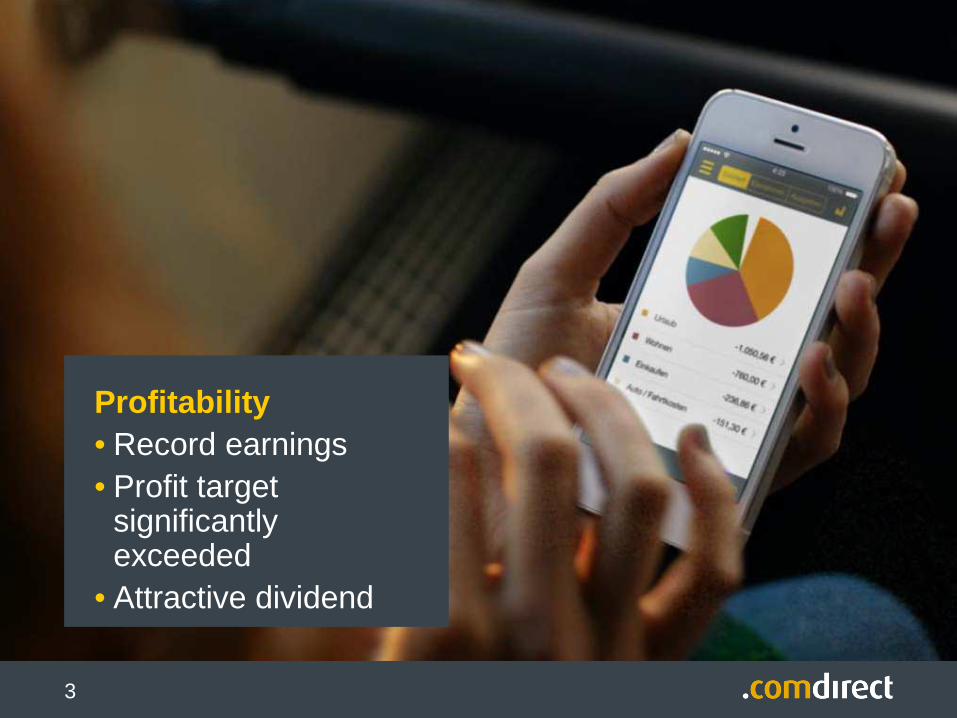
Profitability• Record earnings• Profit target
significantlyexceeded
• Attractive dividend
3
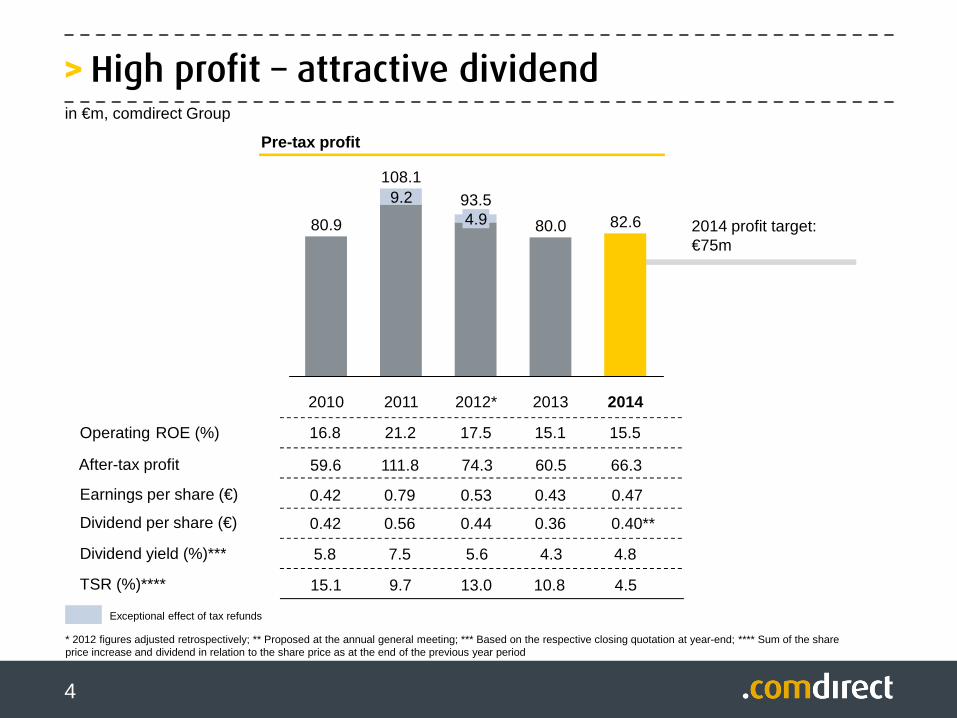
>High profit – attractive dividend
4
After-tax profit
Dividend per share (€)
Dividend yield (%)***
Operating ROE (%) 16.8
59.6
0.42
5.8
21.2
111.8
0.56
7.5
TSR (%)**** 15.1 9.7
17.5
74.3
0.44
Pre-tax profit
in €m, comdirect Group
5.6
13.0
15.1
60.5
0.36
4.3
10.8
2014 profit target:€75m
* 2012 figures adjusted retrospectively; ** Proposed at the annual general meeting; *** Based on the respective closing quotation at year-end; **** Sum of the share price increase and dividend in relation to the share price as at the end of the previous year period
2014
82.6
2013
80.0
2012*
93.54.9
2011
108.19.2
2010
80.9
15.5
66.3
0.40**
4.8
4.5
Exceptional effect of tax refunds
Earnings per share (€) 0.42 0.79 0.53 0.43 0.47
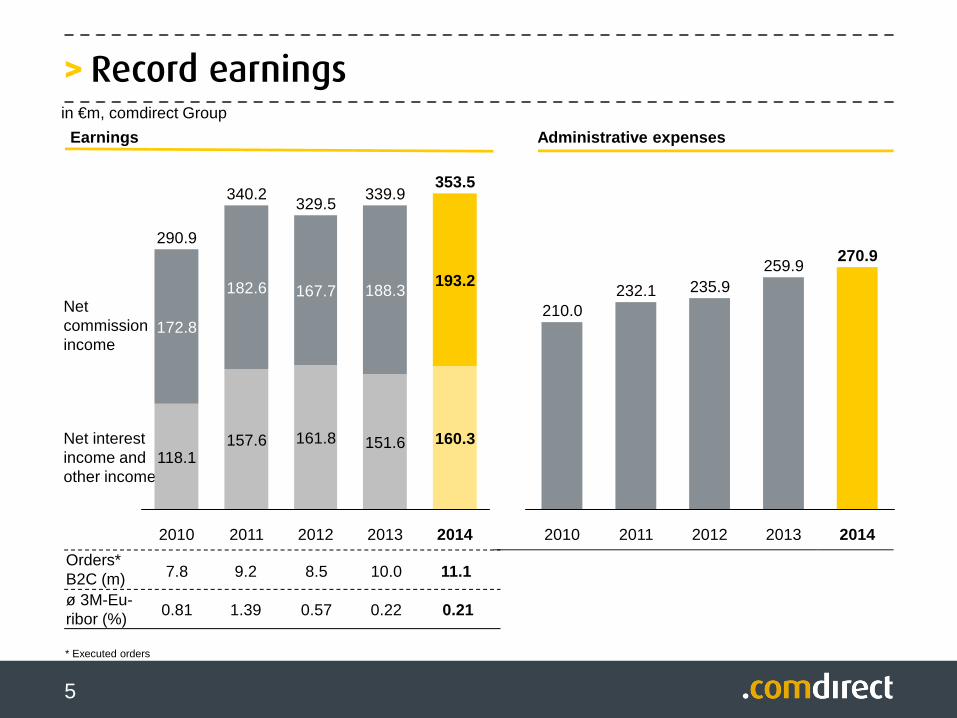
>Record earnings
5
7.8 9.2 8.5
Administrative expensesEarnings
Net commission income
in €m, comdirect Group
Net interest income and other income
Orders*B2C (m) 10.0
0.81 1.39 0.57ø 3M-Eu-ribor (%) 0.22
* Executed orders
2014
353.5
160.3
193.2
2013
339.9
151.6
188.3
2012
329.5
161.8
167.7
2011
340.2
157.6
182.6
2010
290.9
118.1
172.8
270.9
20142013
259.9
2012
235.9
2011
232.1
2010
210.0
11.1
0.21
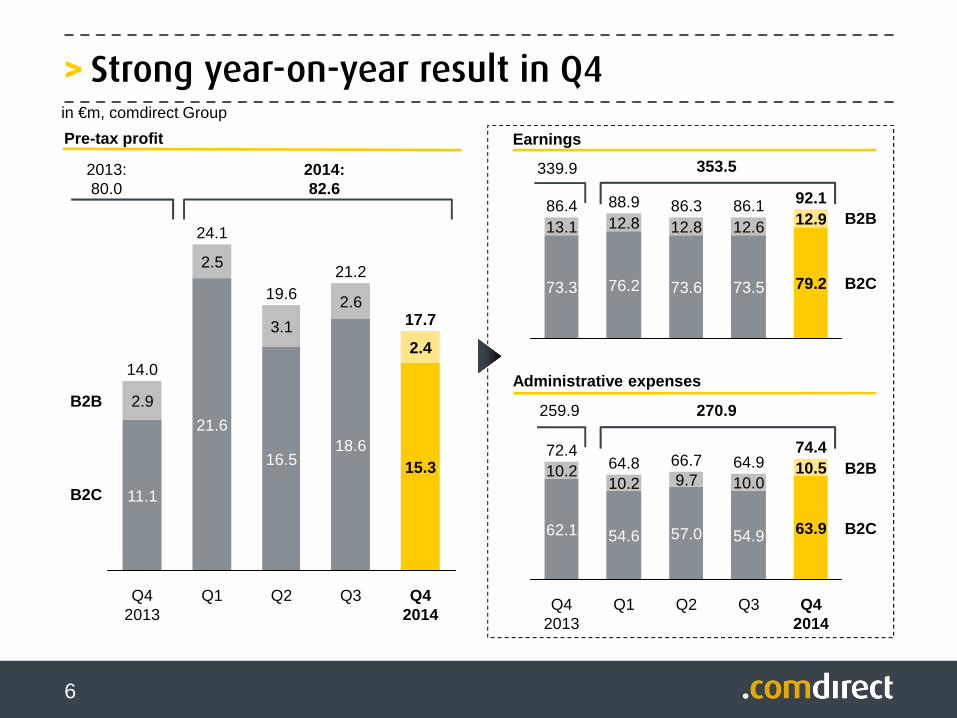
> Strong year-on-year result in Q4
6
10.2
Q42013
72.4
62.1
10.2
Q42014
74.4
63.9
10.5
Q3
64.9
54.9
10.0
Q2
66.7
57.0
9.7
Q1
64.8
54.6
92.1
79.2
12.986.1
73.5
12.686.3
73.6
12.8
88.9
76.2
12.886.4
73.3
13.1
Q42014
17.7
15.3
2.4
Q3
21.2
18.6
2.6
Q2
19.6
16.5
3.1
Q1
24.1
21.6
2.5
Q42013
14.0
11.1
2.9
Pre-tax profit Earnings
Administrative expenses
B2C
B2B
B2C
B2B
B2C
B2B
in €m, comdirect Group
2014:82.6
2013:80.0
353.5339.9
270.9259.9
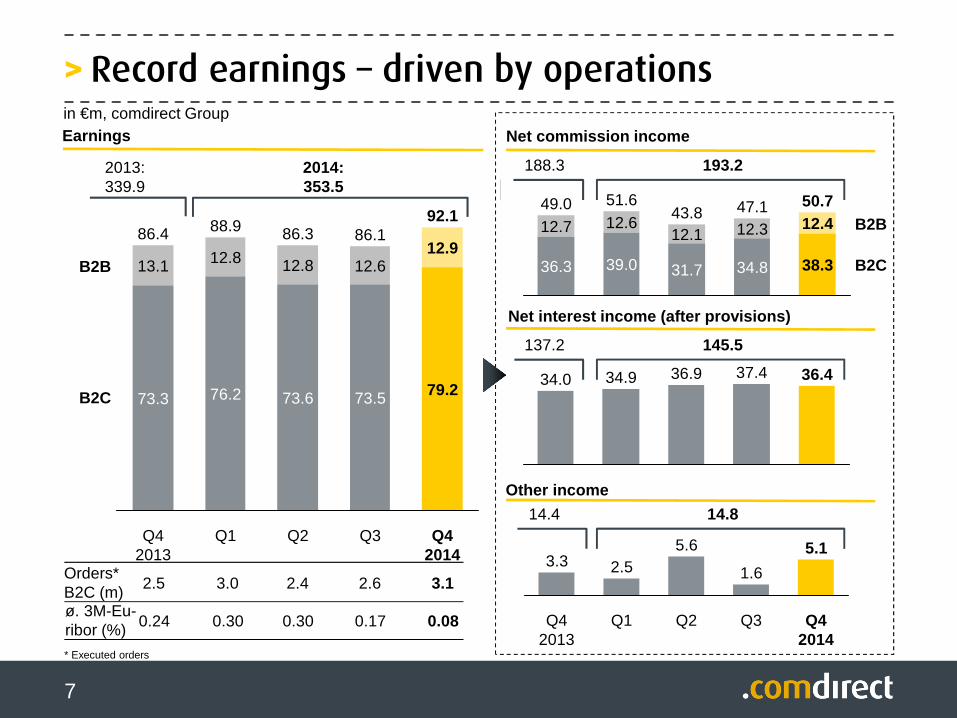
>Record earnings – driven by operations
7
Q42014
92.1
79.2
12.9
Q3
86.1
73.5
12.6
Q2
86.3
73.6
12.8
Q1
88.9
76.2
12.8
Q42013
86.4
73.3
13.1
Earnings
Other income
Net interest income (after provisions)
Net commission income
50.7
38.3
12.447.1
34.8
12.343.8
31.7
12.1
51.6
39.0
12.649.0
36.3
12.7
36.437.436.934.934.0
Q42014
5.1
Q3
1.6
Q2
5.6
Q1
2.5
Q42013
3.3
B2B
B2C
B2C
Orders*B2C (m)ø. 3M-Eu-ribor (%)
B2B
in €m, comdirect Group
2.5
0.24
* Executed orders
3.0
0.30
2.4
0.30
2.6
0.17
2014:353.5
2013:339.9
193.2188.3
145.5137.2
14.814.4
3.1
0.08
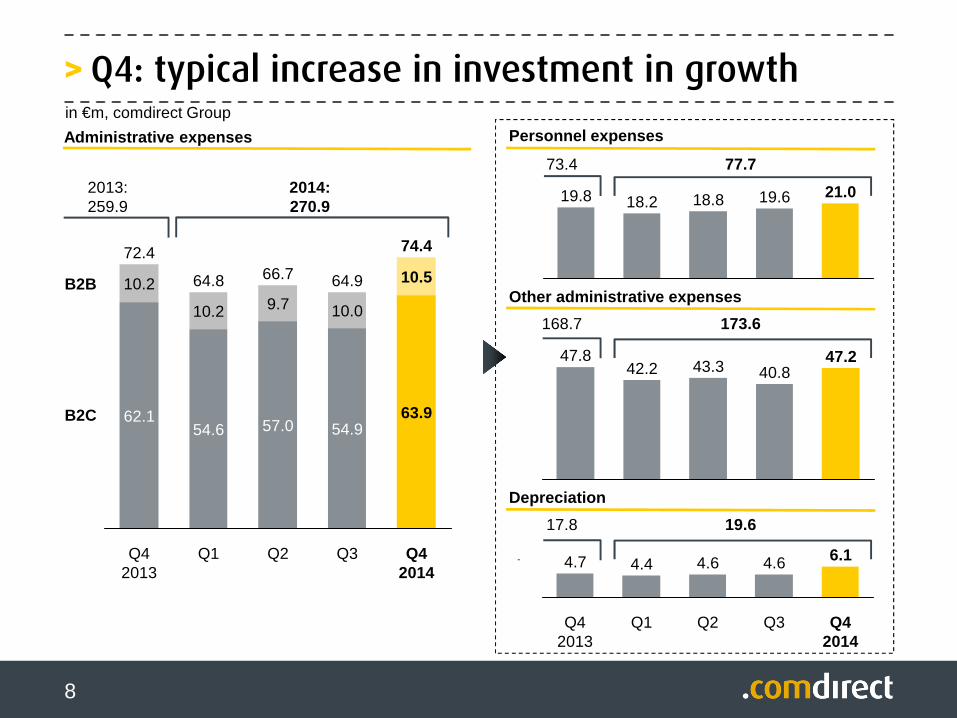
>Q4: typical increase in investment in growth
8
Q42014
6.1
Q3
4.6
Q2
4.6
Q1
4.4
Q42013
4.7
Depreciation
Other administrative expenses
Personnel expenses
47.240.843.342.2
47.8
21.019.618.818.219.8
74.4
Q42014
63.9
10.5
Q3
64.9
54.9
10.0
Q2
66.7
57.0
9.7
Q1
64.8
54.6
10.2
Q42013
72.4
62.1
10.2
Administrative expenses
B2B
B2C
in €m, comdirect Group
2014:270.9
2013:259.9
77.773.4
173.6168.7
19.617.8
9
Growth• Customer and asset
numbers at new all-time highs
• More than 100 thousandnew current accounts
• B2C net fund inflows of€2bn
9
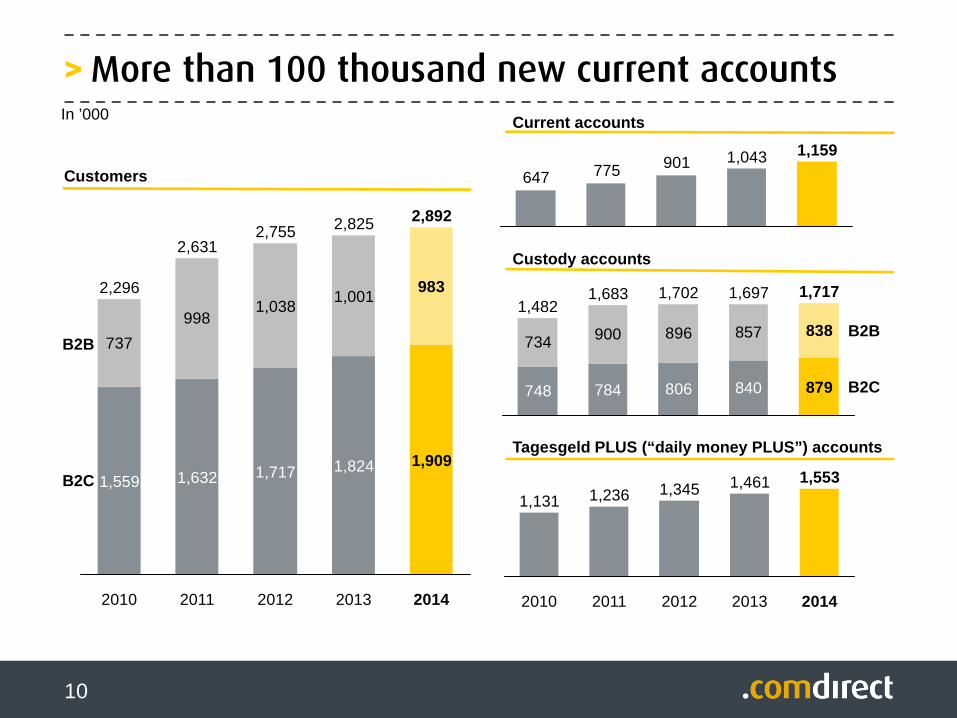
>More than 100 thousand new current accounts
10
737
998
983
2014
2,892
1,909
2013
2,825
1,824
1,001
2012
2,755
1,717
1,038
2011
2,631
1,632
2010
2,296
1,559
Customers
B2C
B2B
2014
1,553
2013
1,461
2012
1,345
2011
1,236
2010
1,131
901775647
1,1591,043
B2C
B2B
Tagesgeld PLUS (“daily money PLUS”) accounts
Custody accounts
748 784 806 840
734 900 896 857
879
838
1,7171,6971,7021,6831,482
In ’000 Current accounts
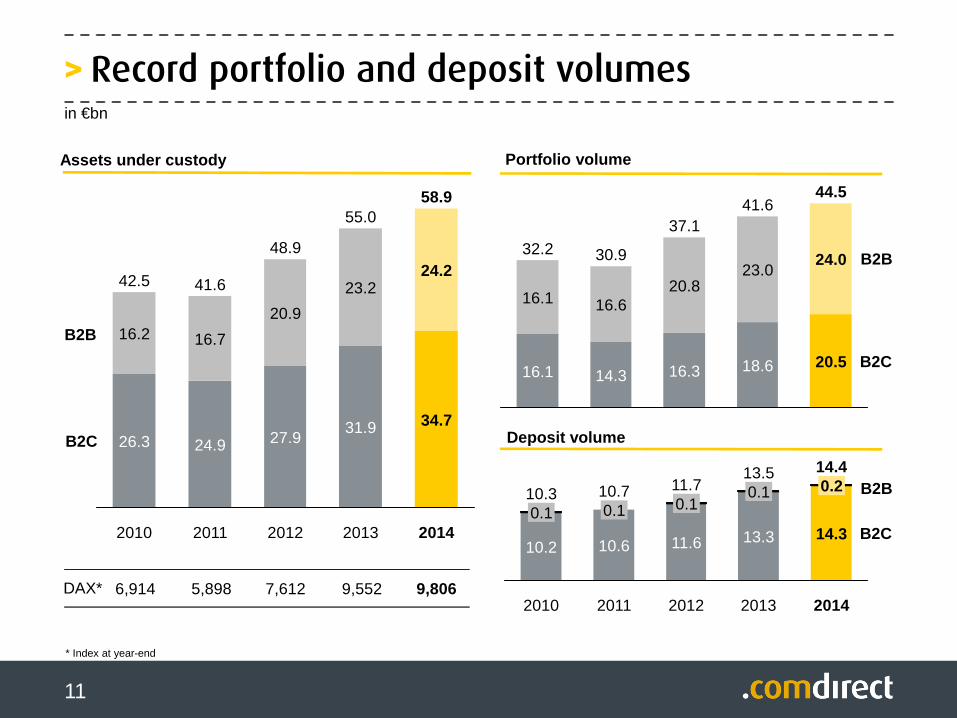
>Record portfolio and deposit volumes
11
* Index at year-end
31.9
23.2
2012
48.9
27.9
20.9
2011
41.6
24.9
16.7
2010
42.5
26.3
16.2
2014
58.9
34.7
24.2
2013
55.0
B2C
B2B
44.5
20.5
24.0
41.6
18.6
23.0
37.1
16.3
20.8
30.9
14.3
16.6
32.2
16.1
16.1
Portfolio volume
Deposit volume
B2B
B2C
Assets under custody
DAX* 5,8986,914 7,612
10.7
10.6
0.1
2010
10.3
10.2
0.1
2014
14.4
14.3
0.2
2013
13.5
13.3
0.1
2012
11.7
11.6
0.1
2011
in €bn
B2B
B2C
9,552 9,806
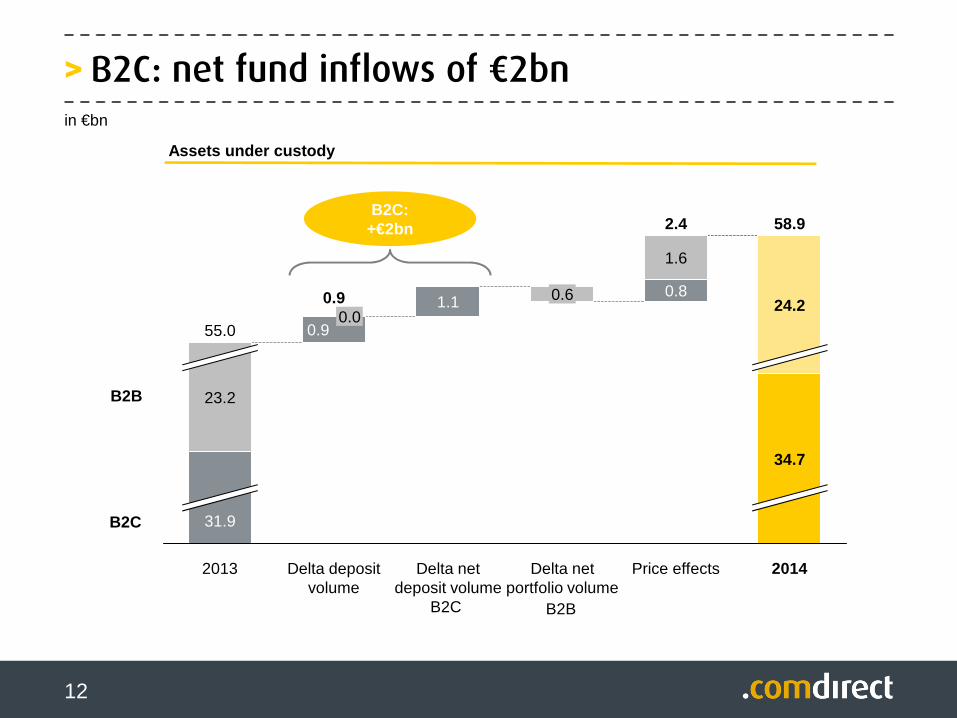
>B2C: net fund inflows of €2bn
12
Assets under custody
in €bn
58.9
2014
2.4
Price effects
24.2
34.7
0.8
1.6
Delta net portfolio volume
0.6
Delta net deposit volume
1.1
Delta deposit volume
0.9
0.90.0
2013
55.0
31.9
23.2
B2C
B2B
B2BB2C
B2C:+€2bn

1313
Strategy and Outlook• Strategic priorities• New brand image• Bank. Neu gedacht.
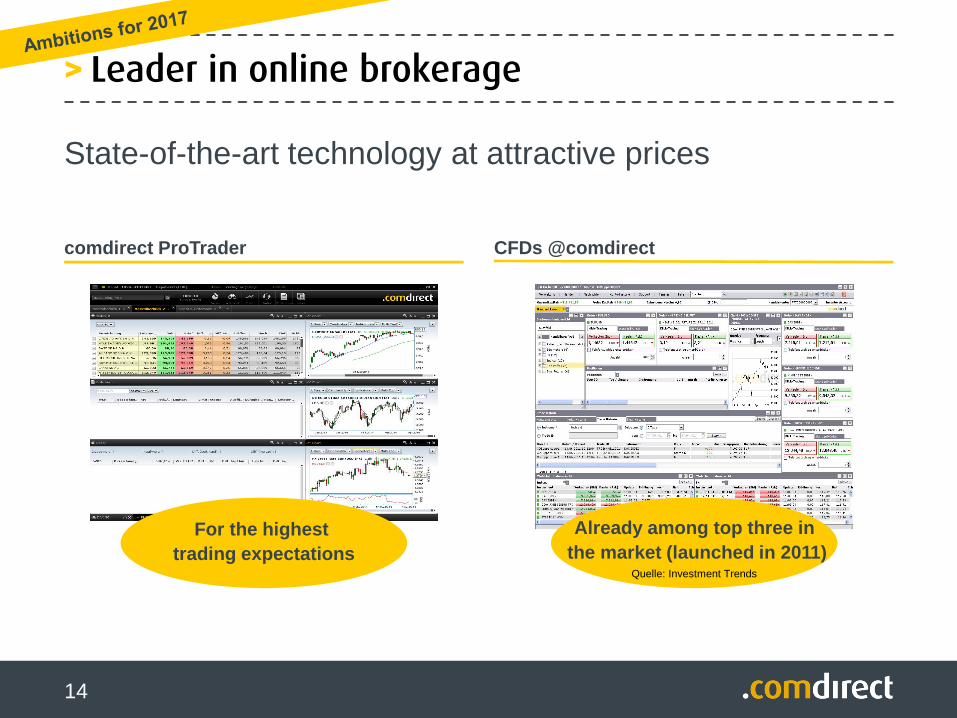
> Leader in online brokerage
14
State-of-the-art technology at attractive prices
For the highest trading expectations
Already among top three inthe market (launched in 2011)
Quelle: Investment Trends
comdirect ProTrader CFDs @comdirect
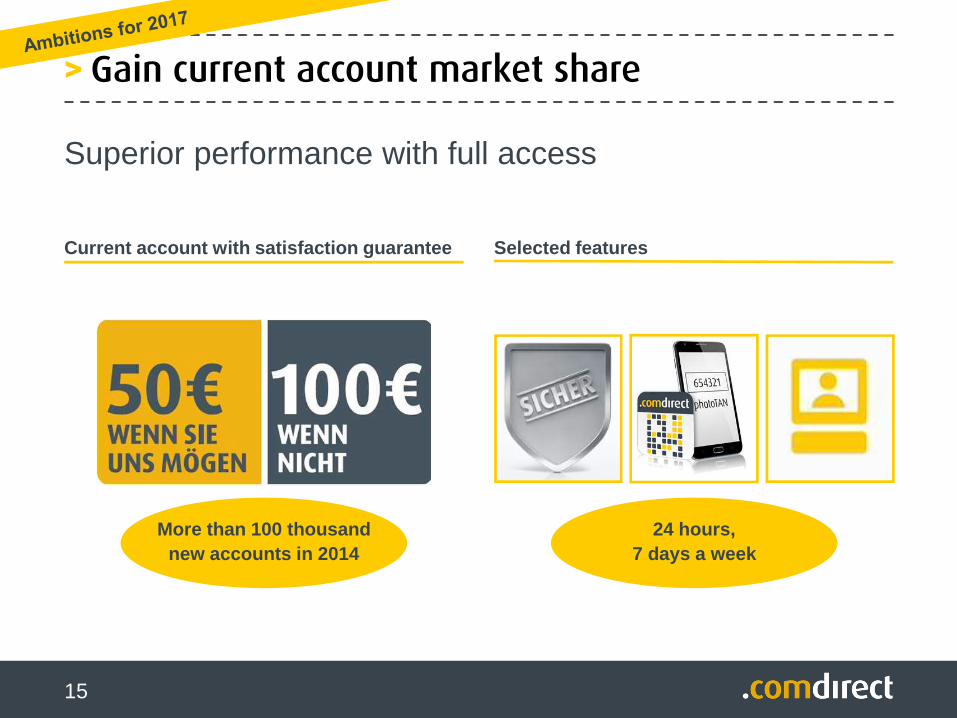
>Gain current account market share
15
Superior performance with full access
Current account with satisfaction guarantee Selected f eatures
More than 100 thousandnew accounts in 2014
24 hours,7 days a week
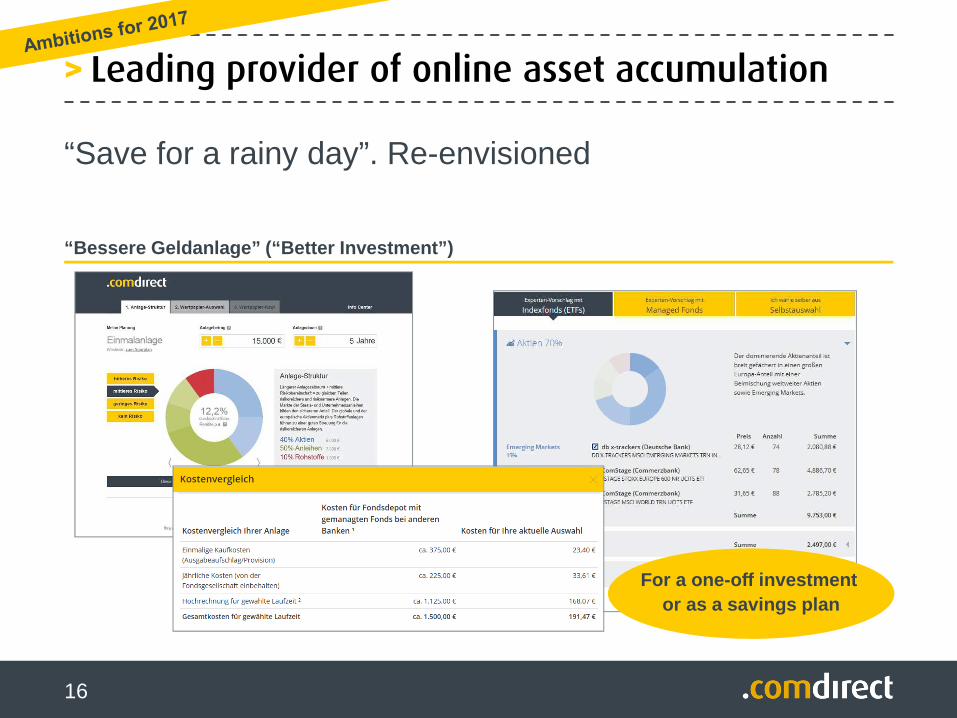
> Leading provider of online asset accumulation
16
“Save for a rainy day”. Re-envisioned
“Bessere Geldanlage” (“Better Investment”)
For a one-off investment or as a savings plan

17
>Anything. Anytime. Anywhere.
> Focus on innovations
>Bank. Neu gedacht.
> 2014 a very successful year for comdirect
18
• High pre-tax profit of €82.6m; 2014 profit target significantly
exceeded
• Attractive dividend yield anticipated for shareholders
• Customer and asset numbers increased to all-time highs:
2.9m customers with €58.9bn in assets
• Bank. Neu gedacht.

19
> The best decisions are not made in the bank,but with the bank.

20
NOTES
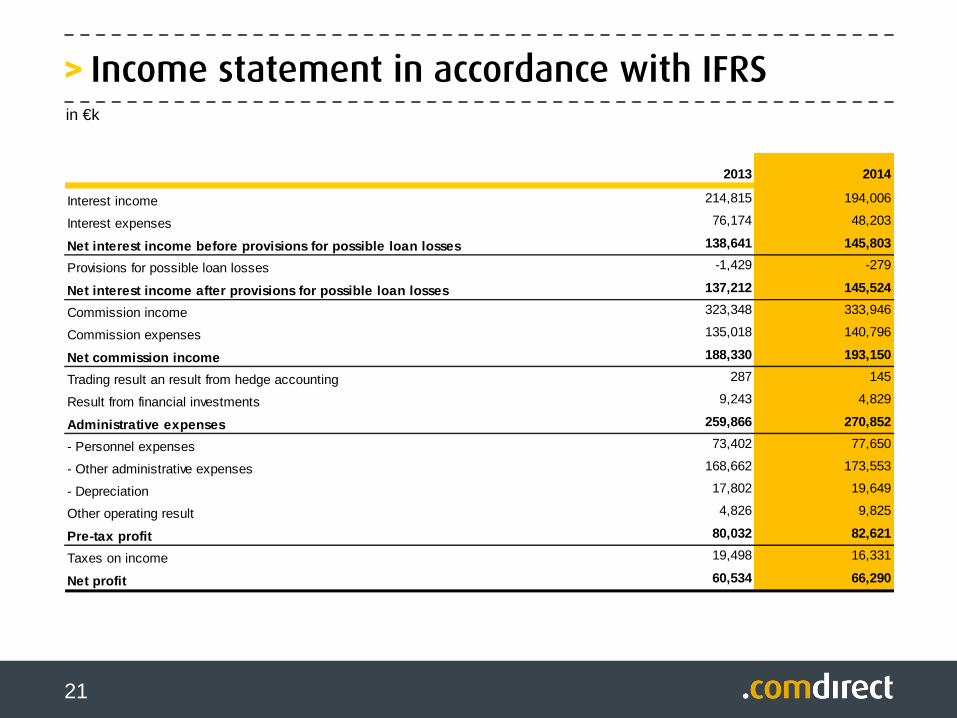
> Income statement in accordance with IFRS
21
in €k
2013 2014
Interest income 214,815 194,006
Interest expenses 76,174 48,203
Net interest income before provisions for possible loan losses 138,641 145,803
Provisions for possible loan losses -1,429 -279
Net interest income after provisions for possible l oan losses 137,212 145,524
Commission income 323,348 333,946
Commission expenses 135,018 140,796
Net commission income 188,330 193,150
Trading result an result from hedge accounting 287 145
Result from financial investments 9,243 4,829
Administrative expenses 259,866 270,852
- Personnel expenses 73,402 77,650
- Other administrative expenses 168,662 173,553
- Depreciation 17,802 19,649
Other operating result 4,826 9,825
Pre-tax profit 80,032 82,621
Taxes on income 19,498 16,331
Net profit 60,534 66,290
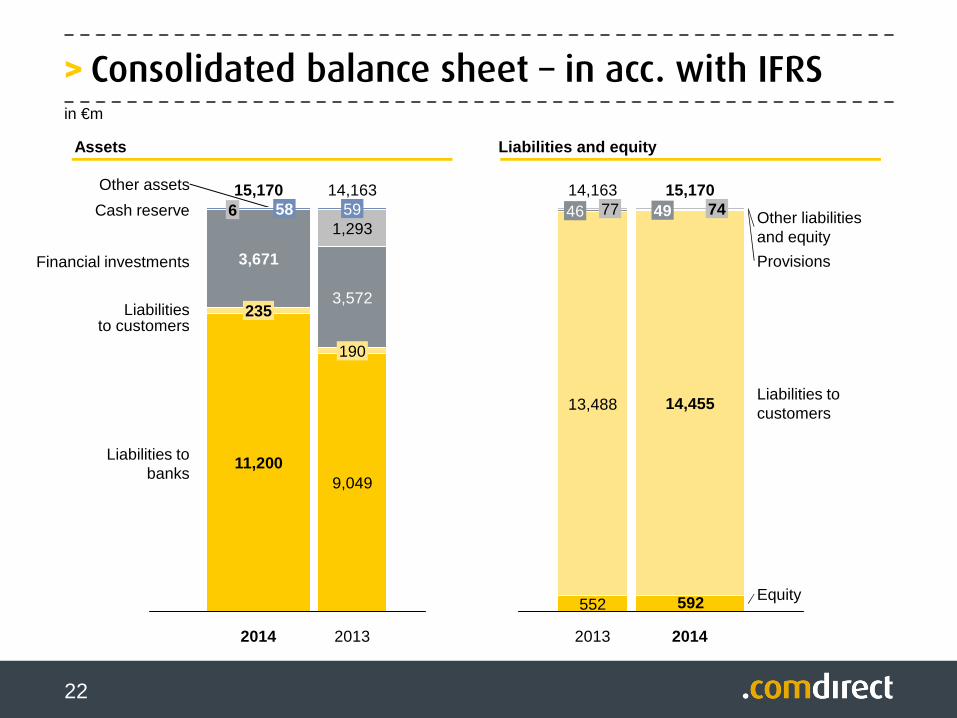
> Consolidated balance sheet – in acc. with IFRS
22
in €m
2013
14,163
9,049
190
3,572
1,29359
Assets Liabilities and equity
2013
14,163
552
13,488
46 77
Liabilities tobanks
Financial investments
Liabilitiesto customers
Cash reserve
Other assets
2014
15,170
11,200
235
3,671
6 58
592 Equity
2014
Liabilities to customers
Provisions
Other liabilitiesand equity
15,170
14,455
49 74
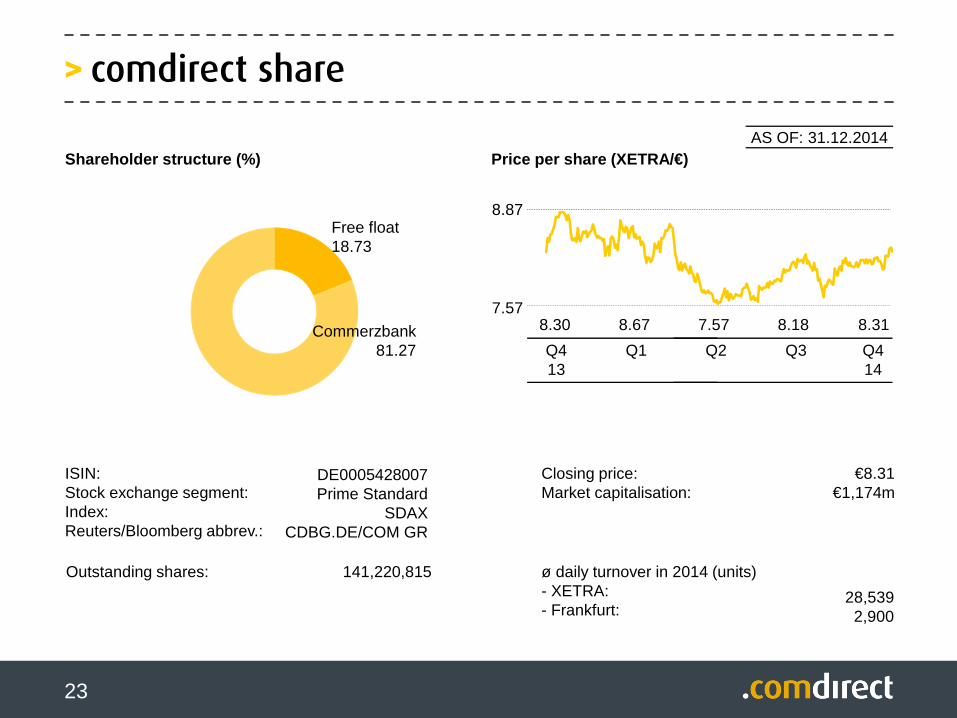
> comdirect share
23
AS OF: 31.12.2014
ISIN:Stock exchange segment:Index:Reuters/Bloomberg abbrev.:
141,220,815Outstanding shares:
Commerzbank81.27
Shareholder structure (%) Price per share (XETRA/€)
€8.31€1,174m
28,5392,900
Closing price:Market capitalisation:
ø daily turnover in 2014 (units)- XETRA:- Frankfurt:
8.87
7.57
Q413
DE0005428007Prime Standard
SDAXCDBG.DE/COM GR
Free float18.73
Q1
8.30 8.67 7.57
Q3Q2
8.18 8.31
Q414
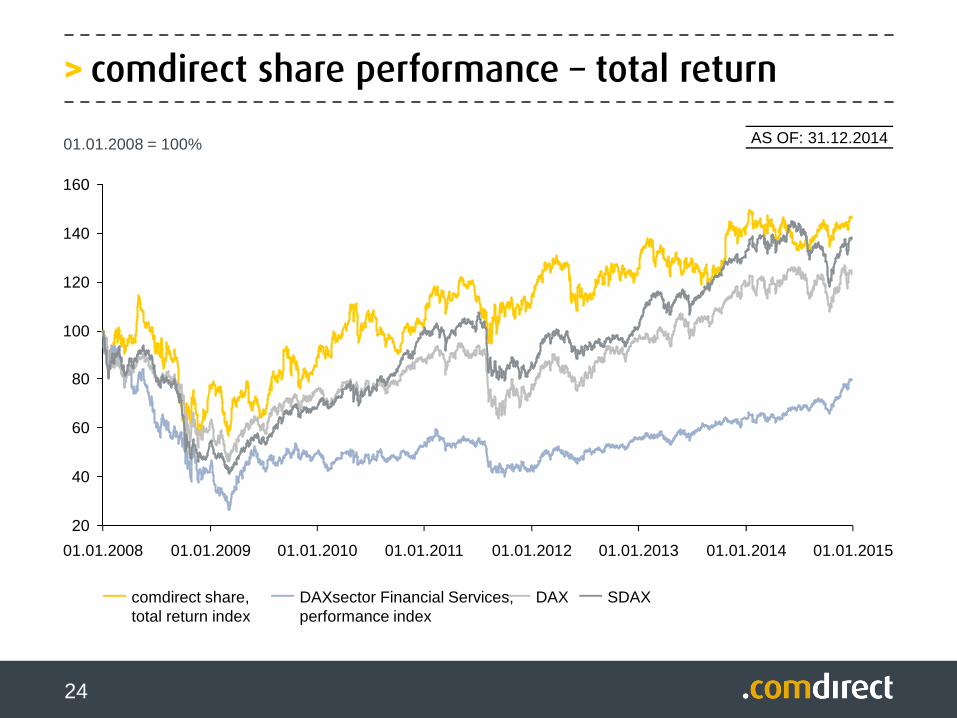
> comdirect share performance – total return
24
20
40
60
80
100
120
140
160
01.01.200901.01.2008 01.01.2010 01.01.2011 01.01.2012 01.01.2013 01.01.2014 01.01.2015
SDAXDAXDAXsector Financial Services, performance index
comdirect share, total return index
01.01.2008 = 100% AS OF: 31.12.2014
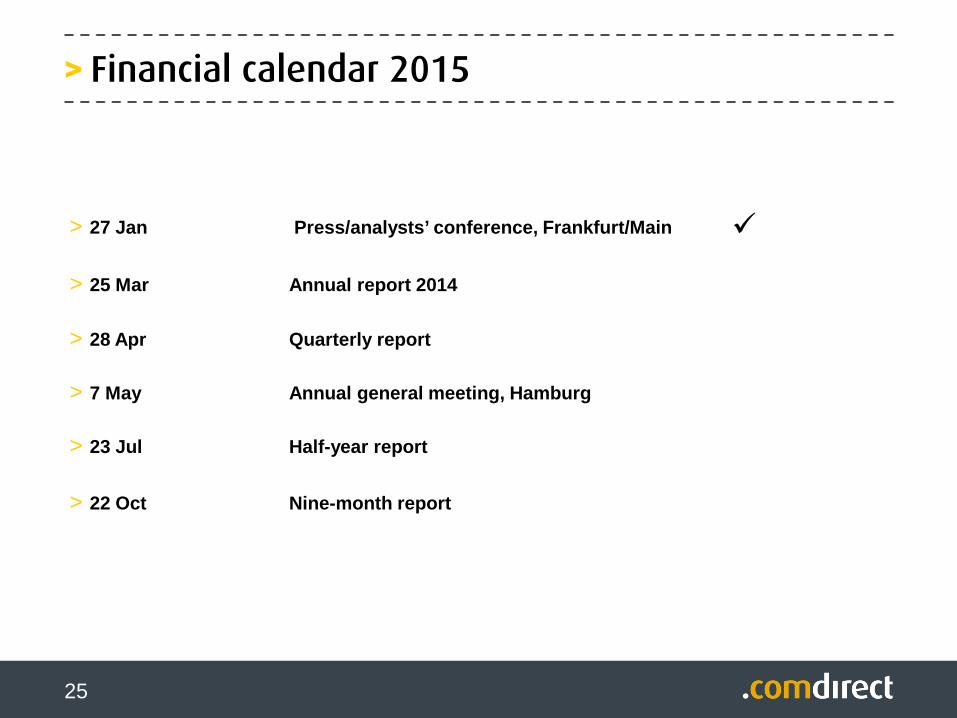
> Financial calendar 2015
25
> 27 Jan Press/analysts’ conference, Frankfurt/Main
> 25 Mar Annual report 2014
> 28 Apr Quarterly report
> 7 May Annual general meeting, Hamburg
> 23 Jul Half-year report
> 22 Oct Nine-month report
> Investor Relations
26
For further information, please contact:
Dr André Martens
Tel +49 (0) 4106 / 704 1966
e-mail [email protected]
Tobias Vossberg
Tel +49 (0) 4106 / 704 1980
e-mail [email protected]
Stefanie Wallis
Tel +49 (0) 4106 / 704 1383
e-mail [email protected]
Top Related