


Languages
Pages
Legal

Q1 Q2
Q18
Q3
Gastroenterology 2015;-:1–12
All studies published in Gastroenterology are embargoed until 3PM ET of the day they are published as corrected proofs on-line.Studies cannot be publicized as accepted manuscripts or uncorrected proofs.
1
2
3
4
5
6
7
8
9
10
11
12
13
14
15
16
17
18
19
20
21
22
23
24
25
26
27
28
29
30
31
32
33
34
35
36
37
38
39
40
41
42
43
44
45
46
47
48
49
50
51
52
53
54
55
56
57
58
59
60
61
62
63
64
65
66
Interactions Between Nuclear Receptor SHP and FOXA1 MaintainOscillatory Homocysteine Homeostasis in Mice
67
68
69
70
71
72
73
74
75
76
77
78
79
80
Hiroyuki Tsuchiya,1 Kerry-Ann da Costa,2 Sangmin Lee,3 Barbara Renga,4 Hartmut Jaeschke,5
Zhihong Yang,3,6 Stephen J. Orena,2 Michael J. Goedken,7 Yuxia Zhang,5 Kong B,6
Margitta Lebofsky,5 Swetha Rudraiah,3 Rana Smalling,1 Grace Guo,6 Stefano Fiorucci,4
Steven H. Zeisel,2 and Li Wang3,8,9
1Department of Medicine, University of Utah School of Medicine, Salt Lake City, Utah; 2Nutrition Research Institute,Department of Nutrition, University of North Carolina at Chapel Hill, North Carolina; 3Department of Physiology andNeurobiology and The Institute for Systems Genomics, University of Connecticut, Storrs, Connecticut; 4Dipartimento diScienze Chirurgiche e Biomediche, University of Perugia, Perugia, Italy; 5Department of Pharmacology, Toxicology &Therapeutics, University of Kansas Medical Center, Kansas City, Kansas; 6Department of Pharmacology and Toxicology ofSchool of Pharmacy and 7Translational Sciences, Rutgers University, Piscataway, New Jersey; 8Veterans Affairs ConnecticutHealthcare System, West Haven, Connecticut; and 9Department of Internal Medicine, Section of Digestive Diseases, YaleUniversity, New Haven, Connecticut
8
Abbreviations used in this paper: BHMT, betaine-homocysteine S-meth-yltransferase; CTH, cystathionine g-lyase; CTRL, control; EtOH, ethanol;FOXA1, forkhead box A1; Hcy, homocysteine; HHcy, hyper-homocysteinemia; LD, lightLdark; Met, methionine; mRNA, messengerRNA; SAM, S-adenosylmethionine; SAH, S-adenosylhomocysteine; SHP,small heterodimer partner; TF, transcription factor; WT, wild-type; ZT,Zeitgeber time.
© 2015 by the AGA Institute0016-5085/$36.00
http://dx.doi.org/10.1053/j.gastro.2015.01.045
81
82
83
84
85
86
87
88
89
90
91
92
93
94
95
96
97
98
99
100
101
102
103
104
105
106
107
108
109
110
111
112
113
114
115
116
117
118
119
120
BASICAN
DTR
ANSLAT
IONA
LLIVE
R
BACKGROUND & AIMS: Hyperhomocysteinemia is often asso-ciated with liver and metabolic diseases. We studied nuclear re-ceptors that mediate oscillatory control of homocysteinehomeostasis in mice. METHODS: We studied mice with dis-ruptions in Nr0b2 (called small heterodimer partner [SHP]-nullmice), betaine-homocysteine S-methyltransferase (Bhmt), or bothgenes (BHMT-null/SHP-null mice), along with mice with wild-type copies of these genes (controls). Hyperhomocysteinemiawas induced by feeding mice alcohol (National Institute onAlcohol Abuse and Alcoholism binge model) or chow diets alongwith water containing 0.18% DL-homocysteine. Some micewere placed on diets containing cholic acid (1%) or cholestyr-amine (2%) or high-fat diets (60%). Serum and livers werecollected during a 24-hour light�dark cycle and analyzed byRNA-seq, metabolomic, and quantitative polymerase chain re-action, immunoblot, and chromatin immunoprecipitation assays.RESULTS: SHP-null mice had altered timing in expression ofgenes that regulate homocysteine metabolism compared withcontrol mice. Oscillatory production of S-adenosylmethionine,betaine, choline, phosphocholine, glyceophosphocholine, cys-tathionine, cysteine, hydrogen sulfide, glutathione disulfide, andglutathione, differed between SHP-null mice and control mice.SHP inhibited transcriptional activation of Bhmt and cys-tathionine g-lyase by FOXA1. Expression of Bhmt and cys-tathionine g-lyase was decreased when mice were fed cholicacid but increased when they were placed on diets containingcholestyramine or high-fat content. Diets containing ethanol orhomocysteine induced hyperhomocysteinemia and glucoseintolerance in control, but not SHP-null, mice. In BHMT-null andBHMT-null/SHP-null mice fed a control liquid, lipid vacuoleswere observed in livers. Ethanol feeding induced accumulationof macrovesicular lipid vacuoles to the greatest extent in BHMT-null and BHMT-null/SHP-null mice. CONCLUSIONS: Disruptionof Shp in mice alters timing of expression of genes that regulatehomocysteine metabolism and the liver responses to ethanoland homocysteine. SHP inhibits the transcriptional activation ofBhmt and cystathionine g-lyase by FOXA1.
Keywords: Nuclear Receptor; Circadian Regulation; Metabolism;Liver Disease Model.
FLA 5.2.0 DTD � YGAST59598_proof
ethionine (Met) metabolism involves the sequen-
Mtial formation of S-adenosylmethionine (SAM, themain biological methyl donor), S-adenosylhomocysteine(SAH), and homocysteine (Hcy).1 Hcy is a nonprotein, sulfur-containing amino acid that can be remethylated to Met orcatabolized through the trans-sulfuration pathway. Metmetabolism and transmethylation reactions occur mainly inthe liver, which underscores the central role of liver in thismetabolic cycle. Betaine-homocysteine S-methyltransferase(BHMT) and cystathionine g-lyase Q(CTH) are enzymesresponsible for the remethylation and trans-sulfurationpathways, respectively.2,3 BHMT converts Hcy to Met withthe aid of betaine. Cystathionine, which is produced fromHcy by cystathionine b-synthase, is degraded to cysteine byCTH. Disruptions of Met homeostasis that result in hyper-homocysteinemia (HHcy) increase risk for cardiovascularand cerebrovascular diseases and metabolic disorders.4,5The small heterodimer partner (SHP, NR0B2) serves asan important regulator of lipid and bile acid metabolism,and of circadian rhythms in the liver.6,7 SHP is an orphanmember of the nuclear receptor superfamily, but has adistinct structure due to the lack of DNA binding domain.6 Ingeneral, SHP binds to a number of transcription factors andnuclear receptors and inhibits their transcriptional activ-ities, for example, as seen in the negative regulation ofCYP7A1 gene expression.8
Numerous studies suggest that SHP has pleiotropic rolesin the pathology of chronic liver diseases. In lipid meta-bolism, SHP facilitates hepatic lipid accumulation since liver
� 18 March 2015 � 5:37 pm � ce

Q9
2 Tsuchiya et al Gastroenterology Vol. -, No. -
121
122
123
124
125
126
127
128
129
130
131
132
133
134
135
136
137
138
139
140
141
142
143
144
145
146
147
148
149
150
151
152
153
154
155
156
157
158
159
160
161
162
163
164
165
166
167
168
169
170
171
172
173
174
175
176
177
178
179
180
181
182
183
184
185
186
187
188
189
190
191
192
193
194
195
196
197
198
199
200
201
202
203
204
205
206
207
208
209
210
211
212
213
214
215
216
217
218
219
220
221
222
223
224
225
226
227
228
229
230
231
232
233
234
235
236
237
238
239
BASICAND
TRANSLATIONALLIVER
steatosis in leptin-deficient ob/ob mice was abrogated bythe deletion of SHP.9 In addition, SHP modulates the tran-scriptional activity of lipogenic transcription factors,peroxisome proliferator�activated receptor g and sterolregulatory element-binding protein-1c.10 On the other hand,Shp�/� mice were more sensitive to bile duct ligation�in-duced cholestatic liver fibrosis.11,12 SHP also has anti-oncogenic properties in the liver, via actions on bothtranscription factors and microRNAs.13�15 Consistently, SHPwas significantly down-regulated in human hepatocellularcarcinoma.16
Despite intensive studies of Hcy metabolism, limitedinformation is available regarding transcriptional control ofthis important physiological process at the molecular level.Such an understanding would facilitate progress towardnew therapeutic approaches to treat HHcy caused by alco-holic liver disease and metabolic dysregulation. In the pre-sent study, we demonstrate that nuclear receptor SHP is anew modulator of oscillatory metabolism of homocysteineby suppressing forkhead box A1 (FoxA1)�induced Bhmtand Cth expression. Shp deficiency results in up-regulationof Bhmt and Cth, which in turn facilitates Hcy catabolism,diminishes alcohol-induced HHcy, and prevents Hcy-induced endoplasmic reticulum stress response andglucose intolerance. Our results establish a new molecularmechanism that controls Hcy homeostasis in the context ofcircadian regulation.
Materials and MethodsIn vivo and in vitro Studies
Wild-type (WT), Shp-/-, and Bhmt�/� mice were reported onpreviously.3,17 Bhmt-/-Shp�/� mice were generated by inter-crossing heterozygous Bhmtþ/� with Shpþ/� mice and offspringwere used for subsequent experiments. The mice were main-tained in a 12-hour/12-hour light�dark (LD) cycle (light on 6AM to 6 PM) with free access to food and water. Experimentswere performed using male mice at the age of 8 to 12 weeks(n ¼ 5/group, unless otherwise indicated). Serum and livertissues were harvested at Zeitgeber time (ZT) 2, ZT6, ZT10,ZT14, ZT18, and ZT22 (the time of lights on is ZT0). A dim redlight at intensity of 1 mmol/m2s was used to collect tissues indark condition. For alcohol-induced HHcy, the National Insti-tute on Alcohol Abuse and Alcoholism binge model18 was used,with slight modification. In brief, after acclimatization of controlliquid diet for 5 days, the mice were given control liquid diet(Bio-Serv, Flemington, NJ; product #F1259SP) or 5% Lieber-DeCarli ethanol liquid diet (Bio-Serv; product #F1258SP) for10 days, followed by oral gavage of a single dose of maltose(control [CTRL], 9 g maltose dextrin/kg body weight) orethanol (EtOH, 5 g ethanol/kg body weight) solutions at 9 AM onday 10. Nine hours after the binge, blood samples and livertissues were collected every 6 hours over a 24-hour LD cycle atZT12, ZT18, ZT0, and ZT6. For the induction of HHcy with Hcywater, the mice were fed a normal pellet diet, but supplied withdrinking water containing 0.18% of DL-Hcy (TCI America,Portland, OR) for 4 weeks.19 Cholic acid (1%), cholestyramine(2%), or high-fat diet (60%) feeding were performed asdescribed previously.14,20 Glucose tolerance test was per-formed at 10 AM by oral administration of glucose solution
FLA 5.2.0 DTD � YGAST59598_proof
(2 mg/g body weight) to mice fasted for 16 hours.21 Bloodglucose levels were measured by a blood glucose meter (Ger-maine Laboratories, San Antonio, TX). Protocols for the animalstudies were approved by the Institutional Animal Care and UseCommittee at the University of Utah. Standard methods wereused for Western blotting, quantitative polymerase chain re-action, luciferase reporter assays, mutagenesis, and chromatinimmunoprecipitation assays. Bhmt and Cth activity wereassessed as described previously.3,22 Detailed methods areincluded in the Supplementary Material.
Metabolomics AnalysisGas chromatography mass/spectrometry analysis was per-
formed with a Waters GCT Premier mass spectrometer fittedwith an Agilent 6890 gas chromatograph and a Gerstel MPS2autosampler. Metabolite identity was established using a com-bination of an in-house metabolite library developed using purepurchased standards and the commercially available NISTlibrary. The data were normalized by mean centering to theinternal standard D4-succinate.
Statistical AnalysisAll statistical comparisons were made using Student t test,
and P values < .05 were considered to be statistically signifi-cant. All data are shown as mean ± SEM from independentexperiments.
Results and DiscussionShp-Deficiency Had a Global Impact onHomocysteine Metabolism
In addition to the established role of SHP in bile acid17,23
and lipid metabolism,9,21 new gene signatures implicated inliver fibrosis and cirrhosis in humans were identified byRNA-sequencing (RNA-seq) in the Shp�/� mice.24 Ofparticular interest, the expression of Hcy metabolism genes,including Bhmt and Cth, was highly up-regulated in Shp�/�
mice (Figure 1A, top left), indicating a role of SHP in thetranscriptional control of Hcy metabolism. SHP was recentlyshown to be part of the liver circadian clock network7,25 andShp messenger RNA (mRNA) exhibits a circadian expressionpattern (top right). This prompted us to examine therhythmic expression of hepatic Bhmt and Cth mRNA andprotein over a 24-hour LD (12 hours/12 hours) cycle. Asexpected, the mRNA (Figure 1A, middle) and protein(Figure 1A, bottom) expression of Bhmt and Cth were bothhighly induced in Shp�/� liver compared with WT liver. Theexpression of both genes did not show strong rhythmicity inWT mice, however, it became more evident in Shp�/� liver,particularly at the mRNA levels. In contrast, FoxA1 expres-sion was not markedly altered by Shp deficiency.
In addition, the enzymatic activities of Bhmt and Cth weresignificantly higher in Shp�/� liver than in WT mice at ZT2(Figure 1B). Cystathionine, the CTH substrate in the trans-sulfuration pathway, was significantly decreased in theliver of Shp�/� mice, whereas its products cysteine andhydrogen sulfide were increased,2,4 the latter provides areductive atmosphere in cells, in part, by preserving reduced
� 18 March 2015 � 5:37 pm � ce
240

Figure 1. Shp-deficiency disrupts the oscillatory homocysteine metabolic program. (A) Top: RNA-seq revealed up-regulationof Hcy metabolic genes in the liver of Shp�/� mice relative to WT mice. Middle: Quantitative polymerase chain reaction (qPCR)of hepatic Bhmt and Cth mRNA in Shp�/� (red) and WT (black) mice collected over a 12-hour/12-hour LD cycle. Data areshown as mean ± SEM. Each time point represents a pooled sample (equal amount of RNA) from 5 individual mice withtriplicate assays. *P < .01, Shp�/� vs WT at each time point. Hprt1, internal control. Bottom: Western blot (WB) of hepaticBhmt, Cth, and FoxA1 protein expression in Shp�/� and WT mice collected over a 12-hour/12-hour LD cycle. b-Tublin (b Tub),loading control. Each band represents a pooled sample (equal amount of protein) from 5 individual mice. Ahcyl2,adenosylhomocysteinase-like 2; Gnmt, glycine N-methyltransferase. (B, C) Enzymatic activities of Bhmt and Cth (B) and liquidchromatography/mass spectrometry (LC/MS) analysis of liver metabolites and serum H2S production, as well as high-performance liquid chromatography analysis of liver reduced glutathione (GSH) and oxidized glutathione (GSSG) (C) in WT(black) and Shp�/� (red) mice at ZT2. Data are shown in mean ± SEM (n ¼ 5 mice/group with triplicate assays). *P < .01, Shp�/�
vs WT. (D) qPCR analysis of the expression of additional genes in the Hcy metabolic pathway. Data are shown in mean ± SEM.*P < .01, Shp�/� vs WT. The same condition as in (A) middle. (E) LC/MS analysis of liver metabolites in WT (black) and Shp�/�
(red) mice. Data are shown in mean ± SEM (n ¼ 5 mice/group with triplicate assays). *P < .01, Shp�/� vs WT. Q14
print&
web4C=FPO
- 2015 Shp in Homocysteine Metabolism 3
241
242
243
244
245
246
247
248
249
250
251
252
253
254
255
256
257
258
259
260
261
262
263
264
265
266
267
268
269
270
271
272
273
274
275
276
277
278
279
280
281
282
283
284
285
286
287
288
289
290
291
292
293
294
295
296
297
298
299
300
301
302
303
304
305
306
307
308
309
310
311
312
313
314
315
316
317
318
319
320
321
322
323
324
325
326
327
328
329
330
331
332
333
334
335
336
337
338
339
340
341
342
343
344
345
346
347
348
349
350
351
352
353
354
355
356
357
358
359
BASICAN
DTR
ANSLAT
IONA
LLIVE
R
glutathione levels (Figure 1C).26 In addition, glutathioneconsists of glutamine and glycine, as well as cysteine, all ofwhich are endoproducts in the CTH reactions. Consideringthese changes, it is not surprising that the oxidized gluta-thione was decreased in the liver of Shp�/� mice.
FLA 5.2.0 DTD � YGAST59598_proof
To better understand the overall impact of Shp-defi-ciency on Hcy metabolism, additional genes were analyzed.Most genes showed strong (methylenetetrahydrofolatereductaser, cystathionine b-synthase, choline dehydrogenase)to modest (phosphatidylethanolamine N-methyltransferase,
� 18 March 2015 � 5:37 pm � ce
360

10
4 Tsuchiya et al Gastroenterology Vol. -, No. -
361
362
363
364
365
366
367
368
369
370
371
372
373
374
375
376
377
378
379
380
381
382
383
384
385
386
387
388
389
390
391
392
393
394
395
396
397
398
399
400
401
402
403
404
405
406
407
408
409
410
411
412
413
414
415
416
417
418
419
420
421
422
423
424
425
426
427
428
429
430
431
432
433
434
435
436
437
438
439
440
441
442
443
444
445
446
447
448
449
450
451
452
453
454
455
456
457
458
459
460
461
462
463
464
465
466
467
468
469
470
471
472
473
474
475
476
477
478
479
BASICAND
TRANSLATIONALLIVER
adenosylhomocysteinase-like 2) circadian rhythm in expres-sion (Figure 1D). In contrast to the overinduction of Bhmtand Cth in Shp�/� mice, the rhythmicity of methylenete-trahydrofolate reductase and adenosylhomocysteinase-like 2remained similar in WT and Shp�/� mice. The expression ofcystathionine b-synthase and choline dehydrogenase showeda shift in circadian phase; expression was increased duringthe light cycle but decreased during the dark cycle in Shp�/�
vs WT mice. Glycine N-methyltransferase and phosphatidyl-ethanolamine N-methyltransferase, on the other hand,exhibited increased expression in Shp�/� mice only duringthe light cycle. Based on these observations, it is presumedthat the up-regulation of Bhmt and Cth in Shp�/� mice is adirect consequence of the loss of Shp inhibition, and changesin other genes are likely secondary phenomenon driven bychanges of intermediate metabolites.
In the liver, betaine, a methyl donor in BHMT-dependentHcy remethylation pathway (Supplementary Figure 1),3 wassignificantly decreased in Shp�/� mice, although total Hcywas not altered (Figure 1E and Supplementary Figure 2A).This might reflect adaptions in the Met cycle that compen-sated for the increased SAM-dependent methylation.Decreased SAM and increased SAH concentrations wereobserved in Shp�/� mice during the light cycle. The rhyth-mic levels of choline resembled the expression pattern ofcholine dehydrogenase. Phosphatidylcholine, a maincomponent of cellular membranes and very-low-density li-poprotein, is produced from choline via phosphocholine asan intermediate and is degraded to glycerophosphocholineby phospholipases. Interestingly, distinct changes in pat-terns were observed for these metabolites. Overall, most ofthe metabolites showed strong rhythmicity in WT mice andtheir oscillations were noticeably altered in Shp�/� liver.
To further determine a direct regulation of Bhmt and Cthby SHP, we re-expressed Shp in Shp�/� liver usingadenovirus-mediated gene delivery.25 Hepatic Bhmt and CthmRNA and protein expression, as well enzymatic activity,were largely suppressed by Shp re-expression in AdShpmice compared with AdGFP mice (Figure 2A), demon-strating a direct inhibition of both genes by Shp in vivo.
To gain more insights into the alterations of oscillatorymetabolites regulated by SHP in Hcy metabolic pathway, weanalyzed hepatic one-carbon metabolites in AdShp Shp�/�
vs AdGFP Shp�/� mice. In agreement with the suppressedBhmt activity, betaine accumulated in AdShp Shp�/� mice(Figure 2B and Supplementary Figure 2B). However, thepeak levels of total Hcy at ZT18 and ZT22 during the darkcycle was decreased in AdShp Shp�/� mice, and SAM andSAH showed no or only moderate changes. In addition, theoscillatory levels of choline, phosphocholine, glycer-ophosphocholine, and oxidized glutathione were notreversed by Shp re-expression in AdShp Shp�/� mice, ascompared with AdGFP Shp�/� mice. The results suggest thata temporal re-expression of SHP mainly in hepatocytescould not fully rescue the metabolic changes caused bydeletion of Shp in the entire liver that is composed of bothnonparenchymal and parenchymal cells.
To link Shp-mediated regulation of Bhmt and Cthexpression under a physiological condition, WT mice were
FLA 5.2.0 DTD � YGAST59598_proof
fed a 1% cholic acid diet, which is known to induceendogenous Shp expression or 2% cholestyramine diet tointerrupt the enterohepatic circulation of bile acids.17,20 Asexpected, Bhmt and Cth proteins were decreased by cholicacid feeding, but increased by cholestyramine feeding(Figure 2D). The effect of cholestyramine was more striking,consistent with its efficacy to block bile acid Qreabsorption. Inaddition, a high-fat diet feeding induced Cth and Bhmtexpression (Figure 2E), the latter was also observed byanother group.27 The induction could be a compensatoryresponse to the fat load in the liver, as Bhmt�/� micedeveloped fatty liver.3 We further examined the effects offasting and refeeding, but did not observe major changes inBhmt and Cth expression under these conditions(Supplementary Figure 3). Therefore, it is postulated thatthe expression of Bhmt and Cth is primarily regulated byShp rather than by the liver clock machinery. Theirenhanced rhythmicity in Shp�/� mice may represent aconsequence resulting from the role of SHP in modulatingthe circadian clock genes.25
Expression of Bhmt and Cth Was Controlled bySHP and FoxA1 Crosstalk
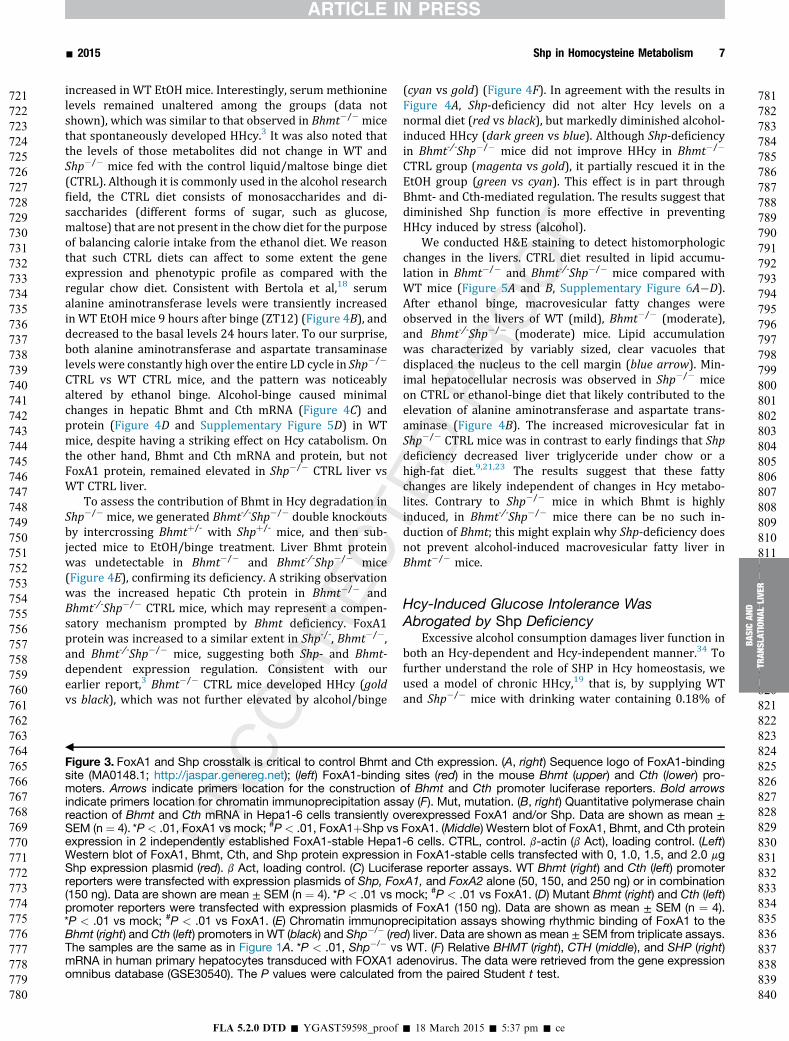
SHP is a unique member of the nuclear receptor super-family in that it exerts its repressive function by suppressingthe transactivation of other transcription factors (TFs).6 Toelucidate the molecular basis by which SHP inhibits Bhmtand Cth expression, we predicted TF response elements andidentified conserved binding sites for FoxA1 in the mouseBhmt and Cth promoters (Figure 3A and SupplementaryFigure 4A). FoxA1 markedly induced Bhmt and Cth mRNA(Figure 3B, left) and protein (right) expression in mouseHepa1-6 cells, which was suppressed by Shp co-expression(right). Luciferase reporter assays demonstrated thatFoxA1, but not FoxA2, activated Bhmt (Figure 3C, left), aswell as Cth (right) promoter, and FoxA1 activation wascompletely blocked by Shp co-transfection. This is likelymediated by a physical interaction between SHP and FOXA1proteins.28 In addition, mutation of the binding site in Bhmtpromoter attenuated FoxA1 activity (Figure 3D, left), sug-gesting that the predicted site is at least in part responsiblefor FoxA1 activation of Bhmt. In a similar fashion, deletion ofa putative binding site within �742 to �731 bp relative tothe transcriptional start site prevented FoxA1 from acti-vating the Cth promoter (right), suggesting that this is afunctional site for FoxA1. Importantly, the recruitment ofFoxA1 to the Bhmt and Cth promoters in vivo was rhythmicand overly augmented in Shp�/� liver (Figure 3E), and thisresembled, to a large extent, the circadian expressionpattern of Bhmt and Cth (Figure 1A). FoxA1 was shown toserve as a pioneer factor to recruit other TFs in the pro-moter and enable rapid response of chromosome to sub-sequent stimuli.29,30 The slight differences between thepattern of FoxA1 binding and Bhmt/Cth expression could beattributed to a combinational effect of FoxA1 and additionalTFs recruited to the Bhmt and Cth promoters. Nonetheless,it is evident that SHP functions as a transcriptionalrepressor of Bhmt and Cth expression through inhibiting
� 18 March 2015 � 5:37 pm � ce
480

Figure 2. Shp re-expression partially res-cuesoscillatoryone-carbonmetabolism. (A) Quantita-tive polymerase chain re-action (qPCR) for mRNA(top), Western blot for pro-tein (middle) and enzymaticactivities (bottom) of he-patic Bhmt and Cth inShp�/� mice that were re-expressed with GFP (red)or Shp-adenovirus (blue).*P< .01, AdShp vs AdGFP.Each ZT time point re-presents pooled samplesfrom 5 individual mice. Cth,cystathionine g-lyase;Gaphd, glyceraldehyde-3-phosphate dehydroge-nase; (B, C) Liquid chroma-tography/mass spectrom-etry analysis of livermetabolites (B) and high-performance liquid chro-matography analysis of liverreduced glutathione (GSH)and oxidized glutathione(GSSG) (C) in AdGFP andAdShp Shp�/� mice. Dataare shown in mean ± SEM(n ¼ 5 mice/group withtriplicate assays). *P < .01,AdShp vs AdGFP. (D, E)Western blot (left) andquantitative analysis (right)of hepatic Bhmt and Cthprotein in WT mice fed with1% cholic acid and 2%cholestyramine (D) or 60%high-fat diet (E). Each linerepresents one singlemouse sample in the indi-cated genotype group.
print&web4C=FPO
- 2015 Shp in Homocysteine Metabolism 5
481
482
483
484
485
486
487
488
489
490
491
492
493
494
495
496
497
498
499
500
501
502
503
504
505
506
507
508
509
510
511
512
513
514
515
516
517
518
519
520
521
522
523
524
525
526
527
528
529
530
531
532
533
534
535
536
537
538
539
540
541
542
543
544
545
546
547
548
549
550
551
552
553
554
555
556
557
558
559
560
561
562
563
564
565
566
567
568
569
570
571
572
573
574
575
576
577
578
579
580
581
582
583
584
585
586
587
588
589
590
591
592
593
BASICAN
DTR
ANSLAT
IONA
LLIVE
R
FoxA1 transactivity, but not FoxA1 gene expression(Supplementary Figure 4B and C). Interestingly, Moya et al31reported that FOXA1 is involved in lipid metabolism inhuman liver. Based on their gene expression database(GSE30450), overexpression of FOXA1 in primary humanhepatocytes correlated with the induction of BHMT (P ¼.05) and CTH (P ¼ .02), but the reduction of SHP (Figure 3F),suggesting a direct regulation. Taken together, our resultsidentified a crosstalk between FoxA1 and SHP to controlBhmt and Cth expression.
594
595
596
597
598
599
Alcohol-Induced Hyperhomocysteinemia WasPrevented by Shp Deficiency
Chronic alcohol consumption is a major public healthproblem that can lead to the development of liver steatosis,
FLA 5.2.0 DTD � YGAST59598_proof
fibrosis, and eventually cirrhosis and hepatocellular carci-noma.32 HHcy is a pathological consequence of alcoholic liverdisease.33 We adopted a simple chronic and binge ethanol(EtOH) feeding model18 in WT and Shp�/� mice to betterunderstand the effect of SHP on alcohol-induced HHcy. Wecollected samples during a 24-hour LD cycle in order toassess the oscillatory profile of metabolites (SupplementaryFigure 5A). Diet consumption as well as changes in bodyweight appeared compatible between WT and Shp�/� mice(Supplementary Figure 5B and C). Metabolomic (gas chro-matography/mass spectrometry) analysis of mouse serumrevealed that the WT EtOH mice (blue) developed HHcy thatlasted over the entire LD cycle, and Shp�/� EtOH mice (darkgreen) were protected against HHcy (Figure 4A). Metabolitesin the trans-sulfuration pathway, including cystathionine,cysteine, and a-hydroxybutylate, were all significantly
� 18 March 2015 � 5:37 pm � ce
600

print&web4C/FPO
6 Tsuchiya et al Gastroenterology Vol. -, No. -
FLA 5.2.0 DTD � YGAST59598_proof � 18 March 2015 � 5:37 pm � ce
601
602
603
604
605
606
607
608
609
610
611
612
613
614
615
616
617
618
619
620
621
622
623
624
625
626
627
628
629
630
631
632
633
634
635
636
637
638
639
640
641
642
643
644
645
646
647
648
649
650
651
652
653
654
655
656
657
658
659
660
661
662
663
664
665
666
667
668
669
670
671
672
673
674
675
676
677
678
679
680
681
682
683
684
685
686
687
688
689
690
691
692
693
694
695
696
697
698
699
700
701
702
703
704
705
706
707
708
709
710
711
712
713
714
715
716
717
718
719
720
BASICAND
TRANSLATIONALLIVER
- 2015 Shp in Homocysteine Metabolism 7
721
722
723
724
725
726
727
728
729
730
731
732
733
734
735
736
737
738
739
740
741
742
743
744
745
746
747
748
749
750
751
752
753
754
755
756
757
758
759
760
761
762
763
764
765
766
767
768
769
770
771
772
773
774
775
776
777
778
779
780
781
782
783
784
785
786
787
788
789
790
791
792
793
794
795
796
797
798
799
800
801
802
803
804
805
806
807
808
809
810
811
812
813
814
815
816
817
818
819
820
821
BASICAN
DTR
ANSLAT
IONA
LLIVE
R
increased in WT EtOH mice. Interestingly, serum methioninelevels remained unaltered among the groups (data notshown), which was similar to that observed in Bhmt�/� micethat spontaneously developed HHcy.3 It was also noted thatthe levels of those metabolites did not change in WT andShp�/� mice fed with the control liquid/maltose binge diet(CTRL). Although it is commonly used in the alcohol researchfield, the CTRL diet consists of monosaccharides and di-saccharides (different forms of sugar, such as glucose,maltose) that are not present in the chow diet for the purposeof balancing calorie intake from the ethanol diet. We reasonthat such CTRL diets can affect to some extent the geneexpression and phenotypic profile as compared with theregular chow diet. Consistent with Bertola et al,18 serumalanine aminotransferase levels were transiently increasedin WT EtOHmice 9 hours after binge (ZT12) (Figure 4B), anddecreased to the basal levels 24 hours later. To our surprise,both alanine aminotransferase and aspartate transaminaselevels were constantly high over the entire LD cycle in Shp�/�
CTRL vs WT CTRL mice, and the pattern was noticeablyaltered by ethanol binge. Alcohol-binge caused minimalchanges in hepatic Bhmt and Cth mRNA (Figure 4C) andprotein (Figure 4D and Supplementary Figure 5D) in WTmice, despite having a striking effect on Hcy catabolism. Onthe other hand, Bhmt and Cth mRNA and protein, but notFoxA1 protein, remained elevated in Shp�/� CTRL liver vsWT CTRL liver.
To assess the contribution of Bhmt in Hcy degradation inShp�/� mice, we generated Bhmt-/-Shp�/� double knockoutsby intercrossing Bhmtþ/- with Shpþ/- mice, and then sub-jected mice to EtOH/binge treatment. Liver Bhmt proteinwas undetectable in Bhmt�/� and Bhmt-/-Shp�/� mice(Figure 4E), confirming its deficiency. A striking observationwas the increased hepatic Cth protein in Bhmt�/� andBhmt-/-Shp�/� CTRL mice, which may represent a compen-satory mechanism prompted by Bhmt deficiency. FoxA1protein was increased to a similar extent in Shp-/-, Bhmt�/�,and Bhmt-/-Shp�/� mice, suggesting both Shp- and Bhmt-dependent expression regulation. Consistent with ourearlier report,3 Bhmt�/� CTRL mice developed HHcy (goldvs black), which was not further elevated by alcohol/binge
=Figure 3. FoxA1 and Shp crosstalk is critical to control Bhmt ansite (MA0148.1; http://jaspar.genereg.net); (left) FoxA1-bindingmoters. Arrows indicate primers location for the constructionindicate primers location for chromatin immunoprecipitation assreaction of Bhmt and Cth mRNA in Hepa1-6 cells transiently oSEM (n ¼ 4). *P < .01, FoxA1 vs mock; #P < .01, FoxA1þShp vsexpression in 2 independently established FoxA1-stable Hepa1Western blot of FoxA1, Bhmt, Cth, and Shp protein expressionShp expression plasmid (red). b Act, loading control. (C) Lucifereporters were transfected with expression plasmids of Shp, Fo(150 ng). Data are shown are mean ± SEM (n ¼ 4). *P < .01 vs mpromoter reporters were transfected with expression plasmids*P < .01 vs mock; #P < .01 vs FoxA1. (E) Chromatin immunoprBhmt (right) and Cth (left) promoters in WT (black) and Shp�/� (reThe samples are the same as in Figure 1A. *P < .01, Shp�/� vsmRNA in human primary hepatocytes transduced with FOXA1 aomnibus database (GSE30540). The P values were calculated f
FLA 5.2.0 DTD � YGAST59598_proof
(cyan vs gold) (Figure 4F). In agreement with the results inFigure 4A, Shp-deficiency did not alter Hcy levels on anormal diet (red vs black), but markedly diminished alcohol-induced HHcy (dark green vs blue). Although Shp-deficiencyin Bhmt-/-Shp�/� mice did not improve HHcy in Bhmt�/�
CTRL group (magenta vs gold), it partially rescued it in theEtOH group (green vs cyan). This effect is in part throughBhmt- and Cth-mediated regulation. The results suggest thatdiminished Shp function is more effective in preventingHHcy induced by stress (alcohol).
We conducted H&E staining to detect histomorphologicchanges in the livers. CTRL diet resulted in lipid accumu-lation in Bhmt�/� and Bhmt-/-Shp�/� mice compared withWT mice (Figure 5A and B, Supplementary Figure 6A�D).After ethanol binge, macrovesicular fatty changes wereobserved in the livers of WT (mild), Bhmt�/� (moderate),and Bhmt-/-Shp�/� (moderate) mice. Lipid accumulationwas characterized by variably sized, clear vacuoles thatdisplaced the nucleus to the cell margin (blue arrow). Min-imal hepatocellular necrosis was observed in Shp�/� miceon CTRL or ethanol-binge diet that likely contributed to theelevation of alanine aminotransferase and aspartate trans-aminase (Figure 4B). The increased microvesicular fat inShp�/� CTRL mice was in contrast to early findings that Shpdeficiency decreased liver triglyceride under chow or ahigh-fat diet.9,21,23 The results suggest that these fattychanges are likely independent of changes in Hcy metabo-lites. Contrary to Shp�/� mice in which Bhmt is highlyinduced, in Bhmt-/-Shp�/� mice there can be no such in-duction of Bhmt; this might explain why Shp-deficiency doesnot prevent alcohol-induced macrovesicular fatty liver inBhmt�/� mice.
Hcy-Induced Glucose Intolerance WasAbrogated by Shp Deficiency
Excessive alcohol consumption damages liver function inboth an Hcy-dependent and Hcy-independent manner.34 Tofurther understand the role of SHP in Hcy homeostasis, weused a model of chronic HHcy,19 that is, by supplying WTand Shp�/� mice with drinking water containing 0.18% of
d Cth expression. (A, right) Sequence logo of FoxA1-bindingsites (red) in the mouse Bhmt (upper) and Cth (lower) pro-of Bhmt and Cth promoter luciferase reporters. Bold arrowsay (F). Mut, mutation. (B, right) Quantitative polymerase chainverexpressed FoxA1 and/or Shp. Data are shown as mean ±FoxA1. (Middle) Western blot of FoxA1, Bhmt, and Cth protein-6 cells. CTRL, control. b-actin (b Act), loading control. (Left)in FoxA1-stable cells transfected with 0, 1.0, 1.5, and 2.0 mgrase reporter assays. WT Bhmt (right) and Cth (left) promoterxA1, and FoxA2 alone (50, 150, and 250 ng) or in combinationock; #P < .01 vs FoxA1. (D) Mutant Bhmt (right) and Cth (left)of FoxA1 (150 ng). Data are shown as mean ± SEM (n ¼ 4).ecipitation assays showing rhythmic binding of FoxA1 to thed) liver. Data are shown as mean ± SEM from triplicate assays.WT. (F) Relative BHMT (right), CTH (middle), and SHP (right)denovirus. The data were retrieved from the gene expressionrom the paired Student t test.
� 18 March 2015 � 5:37 pm � ce
822
823
824
825
826
827
828
829
830
831
832
833
834
835
836
837
838
839
840

Q11
Figure 4. Shp�/� mice are resistant to alcohol-induced hyperhomocysteinemia. (A) Gas chromatography/mass spectrometry(GC/MS) analysis of Hcy metabolites. Sera were collected from WT CTRL (black), WT EtOH (blue), Shp�/� CTRL (red), andShp�/� EtOH (dark green) mice over a 12-hour/12-hour LD cycle using the National Institute on Alcohol Abuse and Alcoholism(NIAAA) binge model. Five individual mice were analyzed in each group. Data are shown as mean ± SEM (n ¼ 5). *P < .01,Shp�/� vs WT; #P < .01, EtOH vs CTRL. (B) Serum alanine aminotransferase (ALT) and aspartate transaminase (AST) levels inWT CTRL (black), WT EtOH (blue), Shp�/� CTRL (red), and Shp�/� EtOH (dark green) mice over a 12-hour/12-hour LD cycleusing the NIAAA binge model. *P < .01, Shp�/� vs WT; #P < 0.01, EtOH vs CTRL. (C) Quantitative polymerase chain reaction ofhepatic Bhmt and CthmRNA in WT CTRL (black), WT EtOH (blue), Shp�/� CTRL (red), and Shp�/� EtOH (dark green) mice overa 12-hour/12-hour LD cycle using the NIAAA binge model. *P < .01, Shp�/� vs WT; #P < .01, EtOH vs CTRL. (D) Western blotof hepatic Bhmt, Cth, and FoxA1 protein expression in WT CTRL, WT EtOH, Shp�/� CTRL, and Shp�/� EtOH mice over a12-hour/12-hour LD cycle using the NIAAA binge model. b-Tublin (b Tub), loading control. (E) Western blot of hepatic Bhmt,Cth, and FoxA1 protein expression at ZT0 in WT (W), Shp�/� (S), Bhmt�/� (B), and Bhmt-/-Shp�/� (D) mice using the NIAAA-binge model. b Tub, loading control. (F) GC/MS analysis of serum homocysteine levels at ZT0 in WT (W), Shp�/� (S), Bhmt�/�
(B), and Bhmt-/-Shp�/� (D) mice using the NIAAA binge model. Data are shown as mean ± SEM (n ¼5). Different charactersindicate significant differences (P < .05).
print&web4C=FPO
8 Tsuchiya et al Gastroenterology Vol. -, No. -
841
842
843
844
845
846
847
848
849
850
851
852
853
854
855
856
857
858
859
860
861
862
863
864
865
866
867
868
869
870
871
872
873
874
875
876
877
878
879
880
881
882
883
884
885
886
887
888
889
890
891
892
893
894
895
896
897
898
899
900
901
902
903
904
905
906
907
908
909
910
911
912
913
914
915
916
917
918
919
920
921
922
923
924
925
926
927
928
929
930
931
932
933
934
935
936
937
938
939
940
941
942
943
944
945
946
947
948
949
950
951
952
953
954
955
956
957
958
959
BASICAND
TRANSLATIONALLIVER
DL-Hcy for 4 weeks (Figure 6A). Bhmt mRNA and protein(Figure 6B) were induced by Hcy feeding in WT mice. Theexpression of Bhmt, Cth, and FoxA1 was elevated in Shp�/�
liver, regardless of Hcy feeding. Hcy feeding stimulatedHHcy (Figure 6C) and glucose intolerance19 (Figure 6D) inWT mice (blue vs black), which was prevented in Shp�/�
mice (dark green vs blue). Hcy is an inducer of endoplasmicreticulum stress in the liver.35 The expression ofendoplasmic reticulum stress target genes, includingDNA-damage�inducible transcript 3, cysteine-rich withepidermal growth factor�like domains 2, Der1-like domainfamily, member 1, and Hcy-inducible, endoplasmic
FLA 5.2.0 DTD � YGAST59598_proof
reticulum stress-inducible, ubiquitin-like domain member 1,were up-regulated in WT Hcy compared with the Shp�/�
groups (Figure 6E). Therefore, Shp deficiency appears toconfer resistance to Hcy-induced glucose intolerance, whichis associated with increased Bhmt and Cth expression. Thisstudy suggests a new underlying mechanism that explainsthe improved insulin sensitivity in Shp�/� mice.9,21
In summary, we identified SHP and FOXA1 as newcomponents in hepatic Hcy metabolism by reciprocallyregulating BHMT and CTH expression (Figure 6F). Intrigu-ingly, Shp deficiency protects against alcohol- and Hcy-induced HHcy. Additional studies are necessary to explore
� 18 March 2015 � 5:37 pm � ce
960

Figure 5. Alcohol stimu-lates lipid accumulation toa greater extent in Bhmt�/�
mice than Shp�/� mice. (A)H&E staining of liver sec-tions from WT, Shp-/-,Bhmt-/-, and Bhmt-/-
Shp�/� mice fed with EtOHbinge or pair-fed with con-trol liquid/maltose binge(CTRL) diet following theNational Institute onAlcohol Abuse and Alco-holism (NIAAA) bingemodel (n ¼ 6�8). Macro-vesicular lipid accumula-tion is characterized byround, clear droplet(s)within liver cells (blue ar-rows). Magnification: 10�.Insert: 40�. (B) Lipid accu-mulation (macrovesicular)was assessed using thefollowing grading scale: 0,none; 1, minimal; 2, mild; 3,moderate; 4, marked; 5,severe. Data are presentedas raw scores and me-dians. Scores were rank-ordered before 1-wayanalysis of variance and aNewman�Keuls post-hoctest (GraphPad Prism soft-ware, version 6.0, Graph-Pad, La Jolla, CA).
print&
web4C=FPO
- 2015 Shp in Homocysteine Metabolism 9
961
962
963
964
965
966
967
968
969
970
971
972
973
974
975
976
977
978
979
980
981
982
983
984
985
986
987
988
989
990
991
992
993
994
995
996
997
998
999
1000
1001
1002
1003
1004
1005
1006
1007
1008
1009
1010
1011
1012
1013
1014
1015
1016
1017
1018
1019
1020
1021
1022
1023
1024
1025
1026
1027
1028
1029
1030
1031
1032
1033
1034
1035
1036
1037
1038
1039
1040
1041
1042
1043
1044
1045
1046
1047
1048
1049
1050
1051
1052
1053
1054
1055
1056
1057
1058
1059
1060
1061
1062
1063
1064
1065
1066
1067
1068
1069
1070
1071
1072
1073
1074
1075
1076
1077
1078
BASICAN
DTR
ANSLAT
IONA
LLIVE
R
the role of SHP, as well as FOXA1, in human disease con-ditions associated with HHcy. Although folate and vitamin B-12 supplementation are used to lower Hcy levels, suchtreatment can potentially have harmful effects, especially in
FLA 5.2.0 DTD � YGAST59598_proof
patients with HHcy.36,37 In light of our findings, therapeuticapproaches to modulate SHP activity could be envisionedfor the treatment of HHcy caused by Hcy metabolicdysregulation.
� 18 March 2015 � 5:37 pm � ce
1079
1080

Figure 6. Homocysteine-induced glucose intolerance is diminished in Shp�/� mice. (A, upper) Mouse model of chronic HHcy.WT and Shp�/� mice fed with a chow diet were supplied with drinking water containing 0.18% of DL-Hcy for 4 weeks. (Lower)Quantitative polymerase chain reaction of hepatic Bhmt and CthmRNA in WT CTRL (black), WT Hcy (blue), Shp�/� CTRL (red),and Shp�/� Hcy (dark green) mice. Data are shown in mean ± SEM (n ¼ 5). *P < .01 vs WT CTRL; #P < .01, Shp�/� Hcy vs WTHcy. (B) Western blot of hepatic Bhmt, Cth, and FoxA1 protein expression in WT CTRL, WT Hcy, Shp�/� CTRL and Shp�/� Hcymice. b-Tublin (b Tub), loading control. (C) Serum Hcy levels in WT CTRL (black), WT Hcy (blue), Shp�/� CTRL (red), and Shp�/�
Hcy (dark green) mice. Data are shown as mean ± SEM (n ¼ 5). *P < .01 vs WT CTRL; #P < .01, Shp�/� Hcy vs WT Hcy. (D) Oralglucose tolerance test in WT CTRL (black), WT Hcy (blue), Shp�/� CTRL (red), and Shp�/� Hcy (dark green) mice. Data areshown as mean ± SEM (n ¼ 5). *P < .01 WT Hcy vs WT CTRL; #P < .01, Shp�/� Hcy vs WT Hcy. (E) Quantitative polymerasechain reaction of mRNA for endoplasmic reticulum stress target genes in the liver of WT CTRL (black), WT Hcy (blue), Shp�/�
CTRL (red), and Shp�/� Hcy (dark green) mice. Data are shown as mean ± SEM (n ¼ 5). *P < .01 vs WT CTRL; #P < .01, Shp�/�
Hcy vs WT Hcy. (F) Schematics of findings in the present study. SHP is a new modulator of Hcy metabolism by suppressingFoxA1-induced Bhmt and Cth expression. Shp deficiency results in up-regulation of Bhmt and Cth, which in turn facilitates Hcycatabolism, diminishes alcohol-induced HHcy, and prevents HHcy-induced glucose intolerance.
print&web4C=FPO
10 Tsuchiya et al Gastroenterology Vol. -, No. -
FLA 5.2.0 DTD � YGAST59598_proof � 18 March 2015 � 5:37 pm � ce
1081
1082
1083
1084
1085
1086
1087
1088
1089
1090
1091
1092
1093
1094
1095
1096
1097
1098
1099
1100
1101
1102
1103
1104
1105
1106
1107
1108
1109
1110
1111
1112
1113
1114
1115
1116
1117
1118
1119
1120
1121
1122
1123
1124
1125
1126
1127
1128
1129
1130
1131
1132
1133
1134
1135
1136
1137
1138
1139
1140
1141
1142
1143
1144
1145
1146
1147
1148
1149
1150
1151
1152
1153
1154
1155
1156
1157
1158
1159
1160
1161
1162
1163
1164
1165
1166
1167
1168
1169
1170
1171
1172
1173
1174
1175
1176
1177
1178
1179
1180
1181
1182
1183
1184
1185
1186
1187
1188
1189
1190
1191
1192
1193
1194
1195
1196
1197
1198
1199
1200
BASICAND
TRANSLATIONALLIVER

Q12
- 2015 Shp in Homocysteine Metabolism 11
1201
1202
1203
1204
1205
1206
1207
1208
1209
1210
1211
1212
1213
1214
1215
1216
1217
1218
1219
1220
1221
1222
1223
1224
1225
1226
1227
1228
1229
1230
1231
1232
1233
1234
1235
1236
1237
1238
1239
1240
1241
1242
1243
1244
1245
1246
1247
1248
1249
1250
1251
1252
1253
1254
1255
1256
1257
1258
1259
1260
1261
1262
1263
1264
1265
Supplementary MaterialNote: To access the supplementary material accompanyingthis article, visit the online version of Gastroenterology atwww.gastrojournal.org, and at http://dx.doi.org/10.1053/j.gastro.2015.01.045.
1266
1267
References13
1268
1269
1270
1271
1272
1273
1274
1275
1276
1277
1278
1279
1280
1281
1282
1283
1284
1285
1286
1287
1288
1289
1290
1291
1292
1293
1294
1295
1296
1297
1298
1299
1300
1301
1302
1303
1304
1305
1306
1307
1308
1309
1310
1311
1312
1313
1314
1315
1316
1317
1318
BASICAN
DTR
ANSLAT
IONA
LLIVE
R
1. Avila MA, Berasain C, Prieto J, et al. Influence of impairedliver methionine metabolism on the development ofvascular disease and inflammation. Curr Med ChemCardiovasc Hematol Agents 2005;3:267–281.
2. Shirozu K, Tokuda K, Marutani E, et al. Cystathioninegamma-lyase deficiency protects mice fromgalactosamine/lipopolysaccharide-induced acute liverfailure. Antioxid Redox Signal 2014;20:204–216.
3. Teng YW, Mehedint MG, Garrow TA, et al. Deletion ofbetaine-homocysteine S-methyltransferase in mice per-turbs choline and 1-carbon metabolism, resulting in fattyliver and hepatocellular carcinomas. J Biol Chem 2011;286:36258–36267.
4. Tehlivets O. Homocysteine as a risk factor for athero-sclerosis: is its conversion to s-adenosyl-L-homocyste-ine the key to deregulated lipid metabolism? J Lipids2011;2011:702853.
5. Schalinske KL, Smazal AL. Homocysteine imbalance: apathological metabolic marker. Adv Nutr 2012;3:755–762.
6. Zhang Y, Hagedorn CH, Wang L. Role of nuclear re-ceptor SHP in metabolism and cancer. Biochim BiophysActa 2011;1812:893–908.
7. Pan X, Zhang Y, Wang L, et al. Diurnal regulation of MTPand plasma triglyceride by CLOCK is mediated by SHP.Cell Metab 2010;12:174–186.
8. Goodwin B, Jones SA, Price RR, et al. A regulatorycascade of the nuclear receptors FXR, SHP-1, andLRH-1 represses bile acid biosynthesis. Mol Cell 2000;6:517–526.
9. Huang J, Iqbal J, Saha PK, et al. Molecular character-ization of the role of orphan receptor small heterodimerpartner in development of fatty liver. Hepatology 2007;46:147–157.
10. Boulias K, Katrakili N, Bamberg K, et al. Regulation ofhepatic metabolic pathways by the orphan nuclear re-ceptor SHP. EMBO J 2005;24:2624–2633.
11. Park YJ, Qatanani M, Chua SS, et al. Loss of orphanreceptor small heterodimer partner sensitizes mice toliver injury from obstructive cholestasis. Hepatology2008;47:1578–1586.
12. Zhang Y, Xu N, Xu J, et al. E2F1 is a novel fibrogenicgene that regulates cholestatic liver fibrosis through theEgr-1/SHP/EID1 network. Hepatology 2014;60:919–930.
13. Song G, Wang L. Nuclear receptor SHP activates miR-206 expression via a cascade dual inhibitory mecha-nism. PLoS One 2009;4:e6880.
14. Li G, Zhu Y, Tawfik O, et al. Mechanisms of STAT3activation in the liver of FXR knockout mice. Am J PhysiolGastrointest Liver Physiol 2013;305:G829–G837.
15. Yang Z, Zhang Y, Wang L. A feedback inhibition betweenmiRNA-127 and TGFbeta/c-Jun cascade in HCC cellmigration via MMP13. PLoS One 2013;8:e65256.
FLA 5.2.0 DTD � YGAST59598_proof
16. He N, Park K, Zhang Y, et al. Epigenetic inhibition ofnuclear receptor small heterodimer partner is associatedwith and regulates hepatocellular carcinoma growth.Gastroenterology 2008;134:793–802.
17. Wang L, Lee YK, Bundman D, et al. Redundant pathwaysfor negative feedback regulation of bile acid production.Dev Cell 2002;2:721–731.
18. Bertola A, Mathews S, Ki SH, et al. Mouse model ofchronic and binge ethanol feeding (the NIAAA model).Nat Protoc 2013;8:627–637.
19. Li Y, Zhang H, Jiang C, et al. Hyperhomocysteinemiapromotes insulin resistance by inducing endoplasmicreticulum stress in adipose tissue. J Biol Chem 2013;288:9583–9592.
20. Kong B, Wang L, Chiang JY, et al. Mechanism of tissue-specific farnesoid X receptor in suppressing theexpression of genes in bile-acid synthesis in mice.Hepatology 2012;56:1034–1043.
21. Wang L, Liu J, Saha P, et al. The orphan nuclear receptorSHP regulates PGC-1alpha expression and energy pro-duction in brown adipocytes. Cell Metab 2005;2:227–238.
22. Renga B, Mencarelli A, Migliorati M, et al. Bile-acid-activated farnesoid X receptor regulates hydrogen sulfideproduction and hepatic microcirculation. World J Gas-troenterol 2009;15:2097–2108.
23. Wang L, Han Y, Kim CS, et al. Resistance of SHP-nullmice to bile acid-induced liver damage. J Biol Chem2003;278:44475–44481.
24. Smalling RL, Delker DA, Zhang Y, et al. Genome-widetranscriptome analysis identifies novel gene signaturesimplicated in human chronic liver disease. Am JPhysiol Gastrointest Liver Physiol 2013;305:G364–G374.
25. Lee SM, Zhang Y, Tsuchiya H, et al. Shp/Npas2 axis inregulating the oscillation of liver lipid metabolism. Hep-atology 2015;61:497–505. Q
26. Calvert JW, Coetzee WA, Lefer DJ. Novel insights intohydrogen sulfide-mediated cytoprotection. AntioxidRedox Signal 2010;12:1203–1217.
27. Dahlhoff C, Desmarchelier C, Sailer M, et al. Hepaticmethionine homeostasis is conserved in C57BL/6Nmice on high-fat diet despite major changes in he-patic one-carbon metabolism. PLoS One 2013;8:e57387.
28. Kim JY, Kim HJ, Kim KT, et al. Orphan nuclear receptorsmall heterodimer partner represses hepatocyte nuclearfactor 3/Foxa transactivation via inhibition of its DNAbinding. Mol Endocrinol 2004;18:2880–2894.
29. Cirillo LA, Lin FR, Cuesta I, et al. Opening of com-pacted chromatin by early developmental transcriptionfactors HNF3 (FoxA) and GATA-4. Mol Cell 2002;9:279–289.
30. Lupien M, Eeckhoute J, Meyer CA, et al. FoxA1 trans-lates epigenetic signatures into enhancer-driven lineage-specific transcription. Cell 2008;132:958–970.
31. Moya M, Benet M, Guzman C, et al. Foxa1 reduces lipidaccumulation in human hepatocytes and is down-regulated in nonalcoholic fatty liver. PLoS One 2012;7:e30014.
� 18 March 2015 � 5:37 pm � ce
1319
1320

4
5
6 Q7
12 Tsuchiya et al Gastroenterology Vol. -, No. -
1321
1322
1323
1324
1325
1326
1327
1328
1329
1330
1331
1332
1333
1334
1335
1336
1337
1338
1339
1340
1341
1342
1343
1344
1345
1346
1347
1348
1349
1350
1351
1352
1353
1354
1355
1356
1357
1358
1359
1360
1361
1362
1363
1364
1365
1366
1367
1368
1369
1370
1371
1372
1373
1374
1375
1376
1377
1378
1379
1380
1381
1382
1383
1384
1385
1386
1387
1388
1389
1390
1391
1392
1393
1394
1395
1396
1397
1398
1399
1400
1401
BASICAND
TRANSLATIONALLIVER
32. Jaurigue MM, Cappell MS. Therapy for alcoholic liverdisease. World J Gastroenterol 2014;20:2143–2158.
33. Hultberg B, Berglund M, Andersson A, et al. Elevatedplasma homocysteine in alcoholics. Alcohol Clin Exp Res1993;17:687–689.
34. Ji C. Mechanisms of alcohol-induced endoplasmic re-ticulum stress and organ injuries. Biochem Res Int 2012;2012:216450.
35. Werstuck GH, Lentz SR, Dayal S, et al. Homocyste-ine-induced endoplasmic reticulum stress causesdysregulation of the cholesterol and triglyceridebiosynthetic pathways. J Clin Invest 2001;107:1263–1273.
36. Bonaa KH, Njolstad I, Ueland PM, et al. Homocysteinelowering and cardiovascular events after acutemyocardial infarction. N Engl J Med 2006;354:1578–1588.
37. Loland KH, Bleie O, Blix AJ, et al. Effect of homocysteine-lowering B vitamin treatment on angiographic progressionof coronary artery disease: a Western Norway B VitaminIntervention Trial (WENBIT) substudy. Am J Cardiol 2010;105:1577–1584.
FLA 5.2.0 DTD � YGAST59598_proof
Author names in bold designate shared co-first authorship.
Received August 29, 2014. Accepted January 30, 2015.
Reprint requestsAddress requests for reprints to: Li Wang, PhD, Department of Physiology andNeurobiology and The Institute for Systems Genomics, University ofConnecticut, 75 North Eagleville Road, U3156, Storrs, Connecticut 06269.e-mail: [email protected]; fax: 860-486-3303. Q
AcknowledgmentsThe authors thank the Metabolomics Core at the University of Utah for gaschromatography/mass spectrometry analysis and Microarray and GenomicAnalysis Core for RNA-seq analysis.
Conflicts of interestThe authors disclose no conflicts. Q
FundingLi Wang is supported by National Institutes of Health (NIH) DK080440, AmericanHeart Association (AHA) 13GRNT14700043, VA Merit Award 1I01BX002634,DK104656, 5 P30 DK020579 by the Diabetes Research Center at WashingtonUniversity, and P30 CA042014 from Huntsman Cancer Institute. HiroyukiTsuchiya is supported by Manpei Suzuki Diabetes Foundation and MochidaMemorial Foundation for Medical and Pharmaceutical Research. Sangmin Leeis supported by AHA Postdoctoral fellowship 13POST14630070. RanaSmalling is supported by AHA Predoctoral fellowship 14PRE17930013. YuxiaZhang is supported by National Cancer Institute K22 Transition CareerDevelopment Award K22CA184146. Steven H. Zeisel and Stephen J. Orenaare supported by NIH DK056350. Q
� 18 March 2015 � 5:37 pm � ce
1402
1403
1404
1405
1406
1407
1408
1409
1410
1411
1412
1413
1414
1415
1416
1417
1418
1419
1420
1421
1422
1423
1424
1425
1426
1427
1428
1429
1430
1431
1432
1433
1434
1435
1436
1437
1438
1439
1440

Supplementary Material
Animal StudyWT, Shp�/�, and Bhmt�/� mice have been reported on
previously.1,2 Bhmt�/�Shp�/� double knockouts weregenerated by intercrossing heterozygous Bhmtþ/� withShpþ/� mice, and siblings were used for subsequent exper-iments. All mice used in this study had the genetic back-ground of C57BL/6. Themice were maintained in a 12-hour/12-hour LD cycle (light on 6 AM to 6 PM) with free access tofood and water. Experiments were performed on male miceat the age of 8 to 12 weeks. Serum and liver tissues wereharvested at ZT2, ZT6, ZT10, ZT14, ZT18, and ZT22. A dimred light at intensity of 1 mmol/m2s was used to collect tis-sues in dark condition. For alcohol-induced hyper-homocysteinemia, the National Institute on Alcohol Abuseand Alcoholism binge model3 was used, with slight modifi-cation. In brief, after acclimatization of control liquid diet for5 days, the mice were given control liquid diet (Bio-Serv;product #F1259SP) or 5% Lieber-DeCarli ethanol liquid diet(Bio-Serv; product #F1258SP) for 10 days, followed by oralgavage of a single dose of maltose (CTRL, 9 g maltosedextrin/kg body weight) or EtOH (5 g EtOH/kg body weight)solutions at 9 AM on day 10. Nine hours after the binge, livertissues and blood samples were collected every 6 hours overa 24-hour LD cycle at ZT12, ZT18, ZT0, and ZT6. For the in-duction of hyperhomocysteinemia with Hcy water, the micewere fed a normal pellet diet, but supplied with drinkingwater containing 0.18% of DL-Hcy (TCI America, Portland,OR) for 4weeks.4 Glucose tolerance test was performed at 10AM by oral administration of glucose solution (2 mg/g bodyweight) to mice fasted for 16 hours. Blood glucose levelswere measured by a blood glucose meter (Germaine Labo-ratories, San Antonio, TX). Protocols for the animal experi-ments were approved by the Institutional Animal Care andUse Committee at the University of Utah.
Cell CultureMouse hepatoma cell line Hepa1-6 (CRL-1830; American
Type Culture Collection [ATCC], Manassas, VA) and humancervix adenocarcinoma cell line HeLa (CCL-2; ATCC) weremaintained in Dulbecco’s modified Eagle’s medium (Invi-trogen, Carlsbad, CA) with 10% heat-inactivated fetalbovine serum (Invitrogen). All transfection experimentswere performed with X-tremeGENE HP reagent (Roche,Indianapolis, IN). Hepa1-6 cells stably expressing FoxA1was established by transfection with a FoxA1-expressingplasmid (described xxxQ15 ), and selected and maintained inDulbecco’s modified Eagle’s medium containing 600 mg/mLG418 (Invitrogen), along with mock-transfected controlcells (p3�FLAG-CMV-10; Sigma-Aldrich, St Louis, MO).
Plasmid ConstructionAll primers used for the plasmid construction and site-
directed mutagenesis were summarized in SupplementaryTable 1. Mouse Bhmt and Cth promoters were amplifiedby Takara LA Taq Polymerase (TaKaRa Bio USA, Madison,WI) using C57BL/6 genomic DNA as a template. After
restriction enzyme digestion, the polymerase chain reaction(PCR) products were ligated into pGL3-basic (Promega,Madison, WI) and sequence was confirmed. Site-directedmutagenesis of the mouse Bhmt promoter in pGL3 vectorwas performed by QuikChange Site-Directed MutagenesisKit (Stratagene, La Jolla, CA). Mouse FoxA1 and FoxA2coding regions were amplified from pGCDNsam-Foxa1-IRES-GFP and pGCDNsam-Foxa2-IRES-GFP (Addgene, Cam-bridge, MA),5 respectively, and were subcloned intop3�FLAG-CMV-10. The mouse Shp-expressing plasmid andadenovirus vector were described previously.6
RNA Isolation, Next-Generation RNASequencing, and Quantitative PolymeraseChain Reaction
Total and50 cappedRNApurification frommouse liver andthe PCR libraries used for RNA sequencing were as describedpreviously.7 Single 36-bp reads were obtained using theIlluminaRNA sequencing protocol. After complementaryDNAsynthesis with High-Capacity cDNA Reverse Transcription Kit(Applied Biosystems, Foster City, CA), quantitative PCR wascarried out using the SYBR Green PCR master mix (AppliedBiosystems) with primers shown in Supplementary Table 1.Theamount ofPCRproductswasmeasuredby threshold cycle(Ct) values, and the relative ratio of specific genes to Hprt1 foreach sample was then calculated.
Western BlotThe following antibodies were used: b-actin (Sigma-
Aldrich; A1978), Bhmt (Abcam, Cambridge, MA; ab52144),Cth (Abcam, Danvers, MA; ab80643), FoxA1 (Abcam;ab40868), Grp78 (Cell Signaling Technology, Danvers, MA;#3177), Ire1a (Cell Signaling Technology; #3294), phospho-Ire1 (Abcam; ab104157), Perk (Cell Signaling Technology;#3192), phospho-Perk (Cell Signaling Technology; #3179),Shp (Santa Cruz Biotechnology, Santa Cruz, CA; sc-30169), b-tubulin (Cell Signaling Technology; #2128). Cells and livertissues were lysed in RIPA buffer (50 mM Tri-HCl [pH 8.0],150mMNaCl, 1%Nonidet P-40, 0.1% sodium dodecylsulfate[SDS], 0.5% sodium deoxycholate) with protease inhibitors(PIs; Sigma-Aldrich). The lysates were separated by SDS-polyacrylamide gel electrophoresis and transferred tonitrocellulose membranes (Bio-Rad, Hercules, CA). Themembranes were blocked with TBS-T (20 mM Tris, 150 mMNaCl, 0.1% Tween-20) containing 5% blocking reagent (Bio-Rad), and incubated with primary antibodies, followed byincubation with horseradish peroxidase�conjugated corre-sponding secondary antibody. Antibody binding was visual-izedwith SuperSignalWest Pico Chemiluminescent Substrate(Fisher Scientific, Logan, UT) according to themanufacturer’sprotocol. Equal loading of proteinwas verifiedwithb-actin orb-tubulin.
Chromatin Immunoprecipitation AssayLiver tissues were fixed in 1% formaldehyde in
phosphate-buffered saline for 15 minutes, and glycine so-lution was added at the final concentration of 125 mM. Thefixed tissues were lysed with cell lysis buffer (50 mM
- 2015 Shp in Homocysteine Metabolism 12.e1
FLA 5.2.0 DTD � YGAST59598_proof � 18 March 2015 � 5:37 pm � ce
1441
1442
1443
1444
1445
1446
1447
1448
1449
1450
1451
1452
1453
1454
1455
1456
1457
1458
1459
1460
1461
1462
1463
1464
1465
1466
1467
1468
1469
1470
1471
1472
1473
1474
1475
1476
1477
1478
1479
1480
1481
1482
1483
1484
1485
1486
1487
1488
1489
1490
1491
1492
1493
1494
1495
1496
1497
1498
1499
1500
1501
1502
1503
1504
1505
1506
1507
1508
1509
1510
1511
1512
1513
1514
1515
1516
1517
1518
1519
1520
1521
1522
1523
1524
1525
1526
1527
1528
1529
1530
1531
1532
1533
1534
1535
1536
1537
1538
1539
1540
1541
1542
1543
1544
1545
1546
1547
1548
1549
1550
1551
1552
1553
1554
1555
1556
1557
1558
1559
1560

Hepes-KOH [pH 8.0], 1 mM EDTA, 0.5 mM ethyl-eneglycoltetraacetate, 140 mM NaCl, 10% glycerol, 0.5%Nonidet P-40, 0.25% Triton X-100, plus PIs) to isolatenuclei. The nuclei were washed with nuclei wash buffer (10mM Tris-HCl [pH 8.0], 1 mM EDTA, 0.5 mM EGTA, 200 mMNaCl, plus PIs), followed by lysis in nuclei lysis buffer (50mM Tris-HCl [pH 8.0], 10 mM EDTA, 1% SDS, plus PIs).Chromatin fragments were prepared by MicrosonTM XL-2000 Ultrasonic Cell Disruptor (Misonic Inc., Farmingdale,NY). After preclear with Dynabeads-protein G (Invitrogen),sheared chromatin was mixed with anti-FoxA1 antibody(Abcam; ab5089), and incubated at 4�C overnight, alongwith no-antibody control. The chromatin-antibody com-plexes were precipitated with Dynabeads-protein G. Theprecipitates were washed once with RIPA-150 (50 mM Tri-HCl [pH 8.0], 150 mM NaCl, 1 mM EDTA, 0.1% SDS, 1%Triton X-100, 0.1% sodium deoxycholate), twice with RIPA-500 (50 mM Tri-HCl [pH 8.0], 500 mM NaCl, 1 mM EDTA,0.1% SDS, 1% Triton X-100, 0.1% sodium deoxycholate),twice with RIPA-LiCl (50 mM Tri-HCl [pH 8.0], 500 mM LiCl,1 mM EDTA, 1% Nonidet P-40, 1% Triton X-100, 0.7% so-dium deoxycholate), and twice with TE buffer (10 mM Tris-HCl [pH 8.0], 1 mM EDTA). The beads were resuspended indirect elution buffer (10 mM Tri-HCl [pH 8.0], 300 mM NaCl,5 mM EDTA, 0.5% SDS) and incubated with RNase A(Sigma-Aldrich) at 65�C for overnight, followed by digestionwith proteinase K (Invitrogen; 55�C, 2 hours). ChromatinDNA fragments were purified with QIAGEN PCR purificationkit (Qiagen, Valencia, CA), and subjected to quantitative PCRusing primers listed in the Supplementary Table 1. Therelative FoxA1 binding (chromatin immunoprecipitationenrichment) was calculated as: 2^[-Ct(FoxA1) þCt(input)] � 2^[-Ct(no antibody) � Ct(input)] � 100. It wasconfirmed that nonspecific binding was negligible, as thevalues obtained by primers about 3 kb away from theFoxA1 binding sites in the Bhmt or Cth promoters were100-fold less than those of primers for the FoxA1 bindingsites (data not shown).
Metabolomics AnalysisTo prepare serum samples for gas chromatography/mass
spectrometery, 360 mL�20�C 90%methanol (aq) was addedto 40mL serum to give a final concentration of 80%methanol.The sampleswere incubated for 1 hour at�20�C, followed bycentrifugation at 30,000g for 10minutes using a rotor chilledto �20�C. The supernatant containing the extracted metab-olites was then transferred to fresh disposable tubes andcompletely dried en vacuo. All gas chromatography/massspectrometery analysis was performed with a Waters GCTPremier mass spectrometer fitted with an Agilent 6890 gaschromatograph and a Gerstel MPS2 autosampler. Driedsamples were suspended in 40 mL of a 40 mg/mLO-methoxylamine hydrochloride in pyridine and incubatedfor 1 hour at 30�C. Twenty-five microliters of this solutionwas added to autosampler vials. Forty microliters ofN-methyl-N-trimethylsilyltrifluoracetamide was addedautomatically via the autosampler and incubated for 60 mi-nutes at 37�C with shaking. After incubation, 3 mL of a fattyacid methyl ester standard solution was added via the
autosampler, then 1 mL of the prepared sample was injectedto the gas chromatograph inlet in the splitmodewith the inlettemperature held at 250�C. A 10:1 split ratio was used foranalysis. The gas chromatograph had an initial temperatureof 95�C for 1 minute followed by a 40�C/min ramp to 110�Cand a hold time of 2 minutes. This was followed by a second5�C/min ramp to 250�C, a third ramp to 350�C, then a finalhold time of 3 minutes. A 30-m Phenomex ZB5-5 MSi columnwith a 5-m long guard column was employed for chromato-graphic separation. Helium was used as the carrier gas at 1mL/min. Due to the dynamic concentration range of metab-olites, each sample was analyzed a second time at a moredilute 100:1 split ratio. Data were collected using MassLynx4.1 software (Waters). The targeted approach for knownmetabolites was used for first-pass data analysis. Metaboliteswere identified and their peak area was recorded usingQuanLynx. Metabolite identity was established using acombination of an in house metabolite library developedusing pure purchased standards and the commerciallyavailable NIST library. The data were normalized by meancentering to the internal standard D4-succinate.
Determination of Liver Enzymatic ActivitiesFor Bhmt enzymatic activity, liver pulverized in liquid
nitrogen were homogenized in Tris buffer using a motorizedtissue homogenizer (Talboys Engineering Corporation,Montrose, PA). Bhmt activitywasmeasured as the conversionof [14C]betaine to [14C]methionine and [14C]dimethylglycineas described previously.1 The Cth activity was assessed asdescribed previously.8 Measurement of H2S concentration inplasma was performed as reported previously.9
Quantification of Liver MetabolitesPlasma was spiked with stable labeled internal stan-
dards of all the analytes, and extracted using the methodmodified from Bligh and Dyer. Samples were extracted withmethanol/chloroform (2:1, v/v), vortexed, and incubatedat �20�C overnight. Samples were centrifuged and the su-pernatants re-extracted with methanol/chloroform/water(2:1:0.8, v/v/v). After vortexing and centrifugation, super-natants were combined with the first extract. Water andchloroform were added into the resulting solutions toallow the phase separation. After centrifugation, theaqueous phase containing choline, phosphocholine, glycer-ophosphocholine, betaine, trimethylamine N-oxide, Q16creati-nine, and methionine is ready for analysis. The organicphase (containing phosphatidylcholine and sphingomyelin)was diluted 1:10 diluted with methanol before analysis.Quantification of the analytes was performed using liquidchromatography stable isotope dilution multiple reactionmonitoring mass spectrometry. Chromatographic separa-tions were performed on an Atlantis Silica HILIC 3 mm 4.6 �50 mm column (Waters Corp) using a Waters ACQUITYUPLC system. Column temperature was 40�C, and the flowrate 1 mL/min. The mobile phases were: A: 10% acetoni-trile/90% water with 10 mM ammonium formate, 0.125%formic acid, and B: 90% acetonitrile/10% water, 10 mMammonium formate, 0.125% formic acid. For aqueousanalytes, the gradient was 5% A for 0.05 minutes, to 15% A
12.e2 Tsuchiya et al Gastroenterology Vol. -, No. -
FLA 5.2.0 DTD � YGAST59598_proof � 18 March 2015 � 5:37 pm � ce
1561
1562
1563
1564
1565
1566
1567
1568
1569
1570
1571
1572
1573
1574
1575
1576
1577
1578
1579
1580
1581
1582
1583
1584
1585
1586
1587
1588
1589
1590
1591
1592
1593
1594
1595
1596
1597
1598
1599
1600
1601
1602
1603
1604
1605
1606
1607
1608
1609
1610
1611
1612
1613
1614
1615
1616
1617
1618
1619
1620
1621
1622
1623
1624
1625
1626
1627
1628
1629
1630
1631
1632
1633
1634
1635
1636
1637
1638
1639
1640
1641
1642
1643
1644
1645
1646
1647
1648
1649
1650
1651
1652
1653
1654
1655
1656
1657
1658
1659
1660
1661
1662
1663
1664
1665
1666
1667
1668
1669
1670
1671
1672
1673
1674
1675
1676
1677
1678
1679
1680

in 0.35 minutes, to 20% A in 0.6 minutes, to 30% A in 1minute, to 45% A in 0.55 minute, to 55% A in 0.05 minute,at 55% A for 0.9 minute, to 5% A in 0.05 minute, at 5% A for1.45 minute. For the organic analytes, the gradient was 5%A for 0.05 minute, to 20% A in 2.95 minutes, to 55% A in0.05 minute, at 55% A for 0.95 minute, to 5% A in 0.05minute, and at 5% A for 2.95 minutes. The analytes andtheir corresponding isotopes were monitored on a WatersTQ detector using characteristic precursor-product iontransitions. Concentrations of each analyte in samples weredetermined using the peak area ratio of the analyte to itsisotope. Cystathionine and cysteine measurements weredone by Dr Sally Stabler at the University of Colorado.Briefly, these compounds were extracted from pulverizedliver, isolated with the use of an anion-exchange column,derivatized with N-methyl-N-(tertbutyldimethylsilyl)-tri-fluoroacetamide, and analyzed by capillary gas chromatog-raphy/mass spectrometry. Deuterated standards were usedto correct for recovery.
Histology AnalysisH&E staining was done at UConn histology core. The
histo score was analyzed by pathologist Dr MichaelGoedken, who is a co-author. The total mouse numbers usedfor histology analysis were: WT CTRL (n ¼ 6), WT EtOH(n¼ 6), Shp�/� CTRL (n¼ 6), Shp�/� EtOH (n¼ 6), Bhmt�/�
CTRL (n ¼ 6), Bhmt�/� EtOH (n ¼ 8), Bhmt�/�Shp�/� CTRL(n ¼ 6), and Bhmt�/�Shp�/� EtOH (n ¼ 6).
Statistical AnalysisAll statistical comparisons were made using Student t
test, and P < .05 were considered to be statistically signif-icant. All data are shown as mean ± SEM from independentexperiments.
Supplementary References1. Teng YW, Mehedint MG, Garrow TA, et al. Deletion of
betaine-homocysteine S-methyltransferase in mice per-turbs choline and 1-carbon metabolism, resulting in fattyliver and hepatocellular carcinomas. J Biol Chem 2011;286:36258–36267.
2. Wang L, Lee YK, Bundman D, et al. Redundant pathwaysfor negative feedback regulation of bile acid production.Dev Cell 2002;2:721–731.
3. Bertola A, Mathews S, Ki SH, et al. Mouse model ofchronic and binge ethanol feeding (the NIAAA model).Nat Protoc 2013;8:627–637.
4. Li Y, Zhang H, Jiang C, et al. Hyperhomocysteinemiapromotes insulin resistance by inducing endoplasmicreticulum stress in adipose tissue. J Biol Chem 2013;288:9583–9592.
5. Sekiya S, Suzuki A. Direct conversion of mouse fibro-blasts to hepatocyte-like cells by defined factors. Nature2011;475:390–393.
6. Zhang Y, Soto J, Park K, et al. Nuclear receptor SHP, adeath receptor that targets mitochondria, inducesapoptosis and inhibits tumor growth. Mol Cell Biol 2010;30:1341–1356.
7. Smalling RL, Delker DA, Zhang Y, et al. Genome-widetranscriptome analysis identifies novel gene signaturesimplicated in human chronic liver disease. Am J PhysiolGastrointest Liver Physiol 2013;305:G364–G374.
8. Renga B, Mencarelli A, Migliorati M, et al. Bile-acid-activated farnesoid X receptor regulates hydrogen sulfideproduction and hepatic microcirculation. World J Gas-troenterol 2009;15:2097–2108.
9. Fiorucci S, Antonelli E, Mencarelli A, et al. The third gas:H2S regulates perfusion pressure in both the isolatedand perfused normal rat liver and in cirrhosis. Hepatology2005;42:539–548.
- 2015 Shp in Homocysteine Metabolism 12.e3
FLA 5.2.0 DTD � YGAST59598_proof � 18 March 2015 � 5:37 pm � ce
1681
1682
1683
1684
1685
1686
1687
1688
1689
1690
1691
1692
1693
1694
1695
1696
1697
1698
1699
1700
1701
1702
1703
1704
1705
1706
1707
1708
1709
1710
1711
1712
1713
1714
1715
1716
1717
1718
1719
1720
1721
1722
1723
1724
1725
1726
1727
1728
1729
1730
1731
1732
1733
1734
1735
1736
1737
1738
1739
1740
1741
1742
1743
1744
1745
1746
1747
1748
1749
1750
1751
1752
1753
1754
1755
1756
1757
1758
1759
1760
1761
1762
1763
1764
1765
1766
1767
1768
1769
1770
1771
1772
1773
1774
1775
1776
1777
1778
1779
1780
1781
1782
1783
1784
1785
1786
1787
1788
1789
1790
1791
1792
1793
1794
1795
1796
1797
1798
1799
1800

web4C=FPO
12.e4 Tsuchiya et al Gastroenterology Vol. -, No. -
FLA 5.2.0 DTD � YGAST59598_proof � 18 March 2015 � 5:37 pm � ce
1801
1802
1803
1804
1805
1806
1807
1808
1809
1810
1811
1812
1813
1814
1815
1816
1817
1818
1819
1820
1821
1822
1823
1824
1825
1826
1827
1828
1829
1830
1831
1832
1833
1834
1835
1836
1837
1838
1839
1840
1841
1842
1843
1844
1845
1846
1847
1848
1849
1850
1851
1852
1853
1854
1855
1856
1857
1858
1859
1860
1861
1862
1863
1864
1865
1866
1867
1868
1869
1870
1871
1872
1873
1874
1875
1876
1877
1878
1879
1880
1881
1882
1883
1884
1885
1886
1887
1888
1889
1890
1891
1892
1893
1894
1895
1896
1897
1898
1899
1900
1901
1902
1903
1904
1905
1906
1907
1908
1909
1910
1911
1912
1913
1914
1915
1916
1917
1918
1919
1920
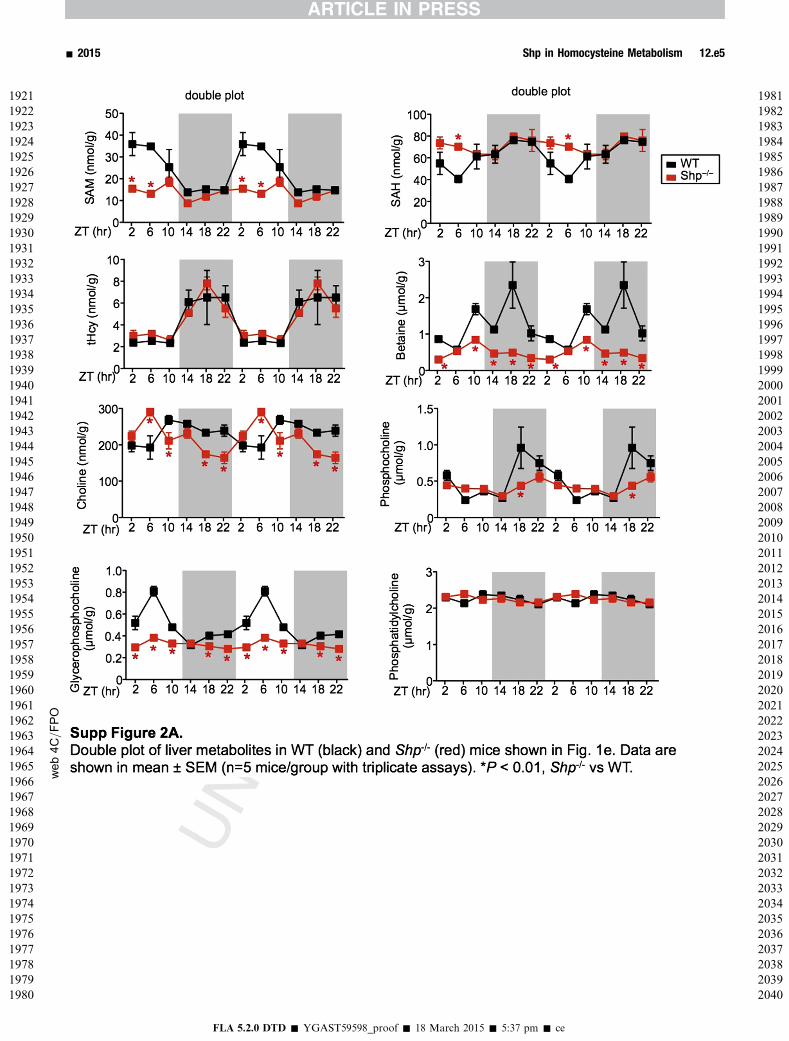
web4C=FPO
- 2015 Shp in Homocysteine Metabolism 12.e5
FLA 5.2.0 DTD � YGAST59598_proof � 18 March 2015 � 5:37 pm � ce
1921
1922
1923
1924
1925
1926
1927
1928
1929
1930
1931
1932
1933
1934
1935
1936
1937
1938
1939
1940
1941
1942
1943
1944
1945
1946
1947
1948
1949
1950
1951
1952
1953
1954
1955
1956
1957
1958
1959
1960
1961
1962
1963
1964
1965
1966
1967
1968
1969
1970
1971
1972
1973
1974
1975
1976
1977
1978
1979
1980
1981
1982
1983
1984
1985
1986
1987
1988
1989
1990
1991
1992
1993
1994
1995
1996
1997
1998
1999
2000
2001
2002
2003
2004
2005
2006
2007
2008
2009
2010
2011
2012
2013
2014
2015
2016
2017
2018
2019
2020
2021
2022
2023
2024
2025
2026
2027
2028
2029
2030
2031
2032
2033
2034
2035
2036
2037
2038
2039
2040
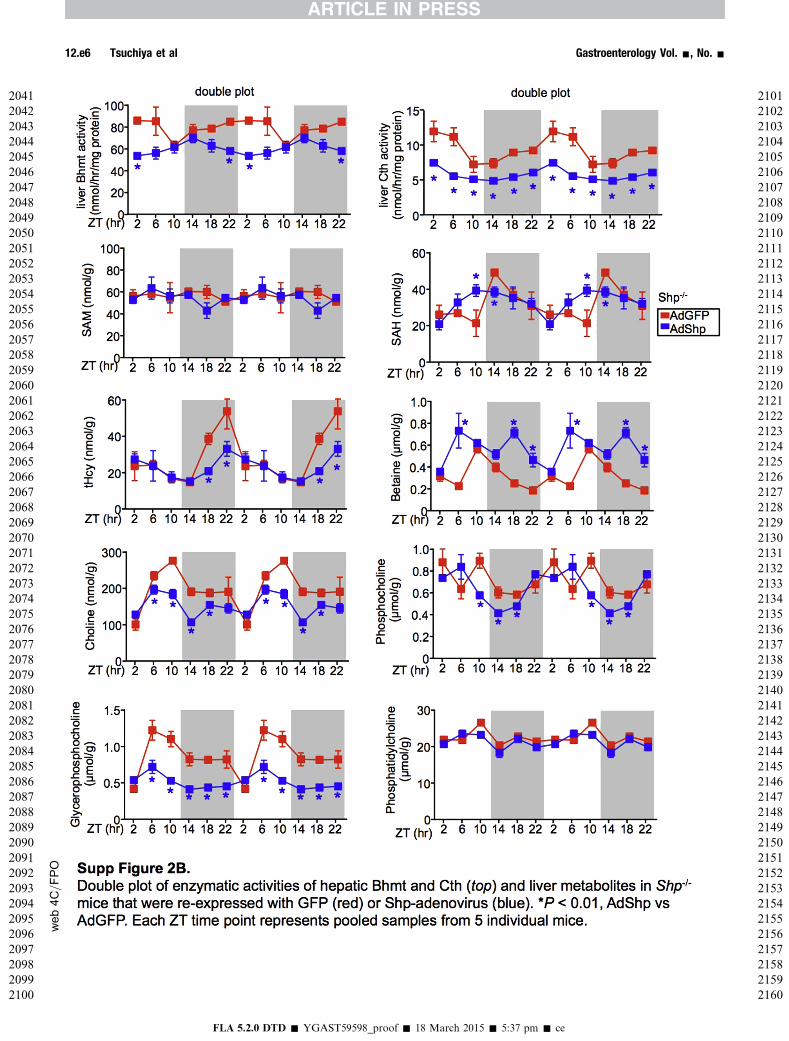
web4C=FPO
12.e6 Tsuchiya et al Gastroenterology Vol. -, No. -
FLA 5.2.0 DTD � YGAST59598_proof � 18 March 2015 � 5:37 pm � ce
2041
2042
2043
2044
2045
2046
2047
2048
2049
2050
2051
2052
2053
2054
2055
2056
2057
2058
2059
2060
2061
2062
2063
2064
2065
2066
2067
2068
2069
2070
2071
2072
2073
2074
2075
2076
2077
2078
2079
2080
2081
2082
2083
2084
2085
2086
2087
2088
2089
2090
2091
2092
2093
2094
2095
2096
2097
2098
2099
2100
2101
2102
2103
2104
2105
2106
2107
2108
2109
2110
2111
2112
2113
2114
2115
2116
2117
2118
2119
2120
2121
2122
2123
2124
2125
2126
2127
2128
2129
2130
2131
2132
2133
2134
2135
2136
2137
2138
2139
2140
2141
2142
2143
2144
2145
2146
2147
2148
2149
2150
2151
2152
2153
2154
2155
2156
2157
2158
2159
2160

- 2015 Shp in Homocysteine Metabolism 12.e7
FLA 5.2.0 DTD � YGAST59598_proof � 18 March 2015 � 5:37 pm � ce
2161
2162
2163
2164
2165
2166
2167
2168
2169
2170
2171
2172
2173
2174
2175
2176
2177
2178
2179
2180
2181
2182
2183
2184
2185
2186
2187
2188
2189
2190
2191
2192
2193
2194
2195
2196
2197
2198
2199
2200
2201
2202
2203
2204
2205
2206
2207
2208
2209
2210
2211
2212
2213
2214
2215
2216
2217
2218
2219
2220
2221
2222
2223
2224
2225
2226
2227
2228
2229
2230
2231
2232
2233
2234
2235
2236
2237
2238
2239
2240
2241
2242
2243
2244
2245
2246
2247
2248
2249
2250
2251
2252
2253
2254
2255
2256
2257
2258
2259
2260
2261
2262
2263
2264
2265
2266
2267
2268
2269
2270
2271
2272
2273
2274
2275
2276
2277
2278
2279
2280

web4C/FPO
12.e8 Tsuchiya et al Gastroenterology Vol. -, No. -
FLA 5.2.0 DTD � YGAST59598_proof � 18 March 2015 � 5:37 pm � ce
2281
2282
2283
2284
2285
2286
2287
2288
2289
2290
2291
2292
2293
2294
2295
2296
2297
2298
2299
2300
2301
2302
2303
2304
2305
2306
2307
2308
2309
2310
2311
2312
2313
2314
2315
2316
2317
2318
2319
2320
2321
2322
2323
2324
2325
2326
2327
2328
2329
2330
2331
2332
2333
2334
2335
2336
2337
2338
2339
2340
2341
2342
2343
2344
2345
2346
2347
2348
2349
2350
2351
2352
2353
2354
2355
2356
2357
2358
2359
2360
2361
2362
2363
2364
2365
2366
2367
2368
2369
2370
2371
2372
2373
2374
2375
2376
2377
2378
2379
2380
2381
2382
2383
2384
2385
2386
2387
2388
2389
2390
2391
2392
2393
2394
2395
2396
2397
2398
2399
2400

web4C=FPO
- 2015 Shp in Homocysteine Metabolism 12.e9
FLA 5.2.0 DTD � YGAST59598_proof � 18 March 2015 � 5:37 pm � ce
2401
2402
2403
2404
2405
2406
2407
2408
2409
2410
2411
2412
2413
2414
2415
2416
2417
2418
2419
2420
2421
2422
2423
2424
2425
2426
2427
2428
2429
2430
2431
2432
2433
2434
2435
2436
2437
2438
2439
2440
2441
2442
2443
2444
2445
2446
2447
2448
2449
2450
2451
2452
2453
2454
2455
2456
2457
2458
2459
2460
2461
2462
2463
2464
2465
2466
2467
2468
2469
2470
2471
2472
2473
2474
2475
2476
2477
2478
2479
2480
2481
2482
2483
2484
2485
2486
2487
2488
2489
2490
2491
2492
2493
2494
2495
2496
2497
2498
2499
2500
2501
2502
2503
2504
2505
2506
2507
2508
2509
2510
2511
2512
2513
2514
2515
2516
2517
2518
2519
2520

web4C=FPO
12.e10 Tsuchiya et al Gastroenterology Vol. -, No. -
FLA 5.2.0 DTD � YGAST59598_proof � 18 March 2015 � 5:37 pm � ce
2521
2522
2523
2524
2525
2526
2527
2528
2529
2530
2531
2532
2533
2534
2535
2536
2537
2538
2539
2540
2541
2542
2543
2544
2545
2546
2547
2548
2549
2550
2551
2552
2553
2554
2555
2556
2557
2558
2559
2560
2561
2562
2563
2564
2565
2566
2567
2568
2569
2570
2571
2572
2573
2574
2575
2576
2577
2578
2579
2580
2581
2582
2583
2584
2585
2586
2587
2588
2589
2590
2591
2592
2593
2594
2595
2596
2597
2598
2599
2600
2601
2602
2603
2604
2605
2606
2607
2608
2609
2610
2611
2612
2613
2614
2615
2616
2617
2618
2619
2620
2621
2622
2623
2624
2625
2626
2627
2628
2629
2630
2631
2632
2633
2634
2635
2636
2637
2638
2639
2640

web4C=FPO
- 2015 Shp in Homocysteine Metabolism 12.e11
FLA 5.2.0 DTD � YGAST59598_proof � 18 March 2015 � 5:37 pm � ce
2641
2642
2643
2644
2645
2646
2647
2648
2649
2650
2651
2652
2653
2654
2655
2656
2657
2658
2659
2660
2661
2662
2663
2664
2665
2666
2667
2668
2669
2670
2671
2672
2673
2674
2675
2676
2677
2678
2679
2680
2681
2682
2683
2684
2685
2686
2687
2688
2689
2690
2691
2692
2693
2694
2695
2696
2697
2698
2699
2700
2701
2702
2703
2704
2705
2706
2707
2708
2709
2710
2711
2712
2713
2714
2715
2716
2717
2718
2719
2720
2721
2722
2723
2724
2725
2726
2727
2728
2729
2730
2731
2732
2733
2734
2735
2736
2737
2738
2739
2740
2741
2742
2743
2744
2745
2746
2747
2748
2749
2750
2751
2752
2753
2754
2755
2756
2757
2758
2759
2760

web4C=FPO
12.e12 Tsuchiya et al Gastroenterology Vol. -, No. -
FLA 5.2.0 DTD � YGAST59598_proof � 18 March 2015 � 5:37 pm � ce
2761
2762
2763
2764
2765
2766
2767
2768
2769
2770
2771
2772
2773
2774
2775
2776
2777
2778
2779
2780
2781
2782
2783
2784
2785
2786
2787
2788
2789
2790
2791
2792
2793
2794
2795
2796
2797
2798
2799
2800
2801
2802
2803
2804
2805
2806
2807
2808
2809
2810
2811
2812
2813
2814
2815
2816
2817
2818
2819
2820
2821
2822
2823
2824
2825
2826
2827
2828
2829
2830
2831
2832
2833
2834
2835
2836
2837
2838
2839
2840
2841
2842
2843
2844
2845
2846
2847
2848
2849
2850
2851
2852
2853
2854
2855
2856
2857
2858
2859
2860
2861
2862
2863
2864
2865
2866
2867
2868
2869
2870
2871
2872
2873
2874
2875
2876
2877
2878
2879
2880

web4C=FPO
- 2015 Shp in Homocysteine Metabolism 12.e13
FLA 5.2.0 DTD � YGAST59598_proof � 18 March 2015 � 5:37 pm � ce
2881
2882
2883
2884
2885
2886
2887
2888
2889
2890
2891
2892
2893
2894
2895
2896
2897
2898
2899
2900
2901
2902
2903
2904
2905
2906
2907
2908
2909
2910
2911
2912
2913
2914
2915
2916
2917
2918
2919
2920
2921
2922
2923
2924
2925
2926
2927
2928
2929
2930
2931
2932
2933
2934
2935
2936
2937
2938
2939
2940
2941
2942
2943
2944
2945
2946
2947
2948
2949
2950
2951
2952
2953
2954
2955
2956
2957
2958
2959
2960
2961
2962
2963
2964
2965
2966
2967
2968
2969
2970
2971
2972
2973
2974
2975
2976
2977
2978
2979
2980
2981
2982
2983
2984
2985
2986
2987
2988
2989
2990
2991
2992
2993
2994
2995
2996
2997
2998
2999
3000

Supplementary Table 1.--- Q17
qPCR primers Sequences (50 to 30) Chromosomal location (GRCm38)
Bhmt Sense GCTTAAATGCCGGAGAAGTTG chr13:93,627,343-93,633,355Anti-sense GAACTCCCGATGAAGCTGAC
Creld2 Sense CTGGTCCAAGCAACAAAGAC chr15:88,823,094-88,823,816Anti-sense TGTACGAGCCGTTGACATTC
Cth Sense AGGGTGGCATCTGAATTTGG chr3:157,913,700-157,918,515Anti-sense GTTGGGTTTGTGGGTGTTTC
Derl1 Sense CGCGATTTAAGGCCTGTTAC chr15:57,875,529-57,878,495Anti-sense TCCCAAGTCCATTGGGTATC
Ddit3 Sense GCACCTATATCTCATCCCCAG chr10:127,295,447-127,295,807Anti-sense TGCGTGTGACCTCTGTTG
Herpud1 Sense ATTCTGGGAAGCTGCTGTTG chr8:94,389,381-94,390,720Anti-sense ACCCTTTGTGCTGGTTTCTG
Hprt1 Sense CGTCGTGATTAGCGATGATGA chrX:52,988,244-53,002,154Anti-sense CACACAGAGGGCCACAATGT
ChIP primersBhmt Forward GTTCCGCAGGAGGAAAATAG chr13:93,638,286-93,638,435
Reverse TGGCGATTCATGATAATTCCBhmt 4kbp Forward AAGGGACAGAAGAACAGAGCAG chr13:93,641,820-93,641,978
Reverse GTTGGCATGAAAGCACACACCth Forward TGGAAGGTGATTGTGTCTGG chr3:157,925,743-157,925,897
Reverse CAGCCCGAACCTAAAACTTTGCth 4kbp Forward AAGAACCAGGACATGCCATC chr3:157,928,925-157,929,044
Reverse TGTGCATGTAGTGTGCCAAGCloning primers
Bhmt-Pro WT Forward CGTCACGCGTTCTTCCCATCTGCCTGa chr13:93,637,716-93,639,773Reverse GCTCCTCGAGATTGGTCTCCTAGATGa
Cth-Pro -2k Forward CTCGACGCGTCAAACATAAAAGGCATGCAGa chr3:157,925,046-157,927,074Cth-Pro -.8k Forward CTCGACGCGTGAAGGTGATTGTGTCTGGAGCa chr3:157,925,046-157,925,895Cth-Pro -.7k Forward CTCGACGCGTAGCTTTTCCAAACCGTAGa chr3:157,925,046-157,925,840Cth-Pro -.5k Forward CTCGACGCGTCTGACTCCCTCTTCTGGTGTGa chr3:157,925,046-157,925,641
Reverse GGAGCTCGAGGTGTTGCTTTGGCa
FoxA1 Forward GTCGAAGCTTATGTTAGGGACTGTGAAGATGGa chr12:57,542,027-57,545,735Reverse GTGCGAATTCTAGGAAGTATTTAGCACGGGTCa
FoxA2 Forward GTCGAAGCTTATGCTGGGAGCCGTGAAG a chr2:148,043,514-148,045,895Reverse GTGCGAATTCTTAGGATGAGTTCATAATAGGCCTGa
MutagenesisBhmt-Pro Mut Forward CCTCCAGTGCTTATTTGTTGTCTTTAAG
CCCTTACTAATATGTTGGGCAGTTTTTGTAGb
Reverse CTACAAAAACTGCCCAACATATTAGTAAGGGCTTAAAGACAACAAATAAGCACTGGAGGb
ChIP, chromatin immunoprecipitation; qPCR, quantitative polymerase chain reaction.aUnderline indicates restriction enzyme site.bUnderline indicates mutation site.
12.e14 Tsuchiya et al Gastroenterology Vol. -, No. -
FLA 5.2.0 DTD � YGAST59598_proof � 18 March 2015 � 5:37 pm � ce
3001
3002
3003
3004
3005
3006
3007
3008
3009
3010
3011
3012
3013
3014
3015
3016
3017
3018
3019
3020
3021
3022
3023
3024
3025
3026
3027
3028
3029
3030
3031
3032
3033
3034
3035
3036
3037
3038
3039
3040
3041
3042
3043
3044
3045
3046
3047
3048
3049
3050
3051
3052
3053
3054
3055
3056
3057
3058
3059
3060
3061
3062
3063
3064
3065
3066
3067
3068
3069
3070
3071
3072
3073
3074
3075
3076
3077
3078
3079
3080
3081
3082
3083
3084
3085
3086
3087
3088
3089
3090
3091
3092
3093
3094
3095
3096
3097
3098
3099
3100
3101
3102
3103
3104
3105
3106
3107
3108
3109
3110
3111
3112
3113
3114
3115
3116
3117
3118
3119
3120
Top Related