


Languages
Pages
Legal


ENROLLMENT MANAGEMENT REPORT
COLLEGE PROFILE
BUSINESS ADMINISTRATION
FALL 2017

INTRODUCTION – COLLEGE PROFILE
The following college profile has been developed to tailor our annual enrollment report to your college’s data.
The college profile report tracks students, not enrollments. This means that students with dual enrollments are reported only once – under their first program.
Kevin Monahan Director of Graduate Program Review and Information Systems Graduate College, University of Illinois at Chicago Voice: 312.413.0410 Email: [email protected]
TABLE OF CONTENTS
MATRICULATION Diversity Pipeline
1
APPLICATIONS by Race/Ethnicity
2 – 5
ENROLLMENT by Race/Ethnicity by Type, Time, & Gender
6 – 9
10 – 13
DEGREES by Race/Ethnicity by Gender
14 – 15 16 – 17
List of academic programs included in this report Appendix A
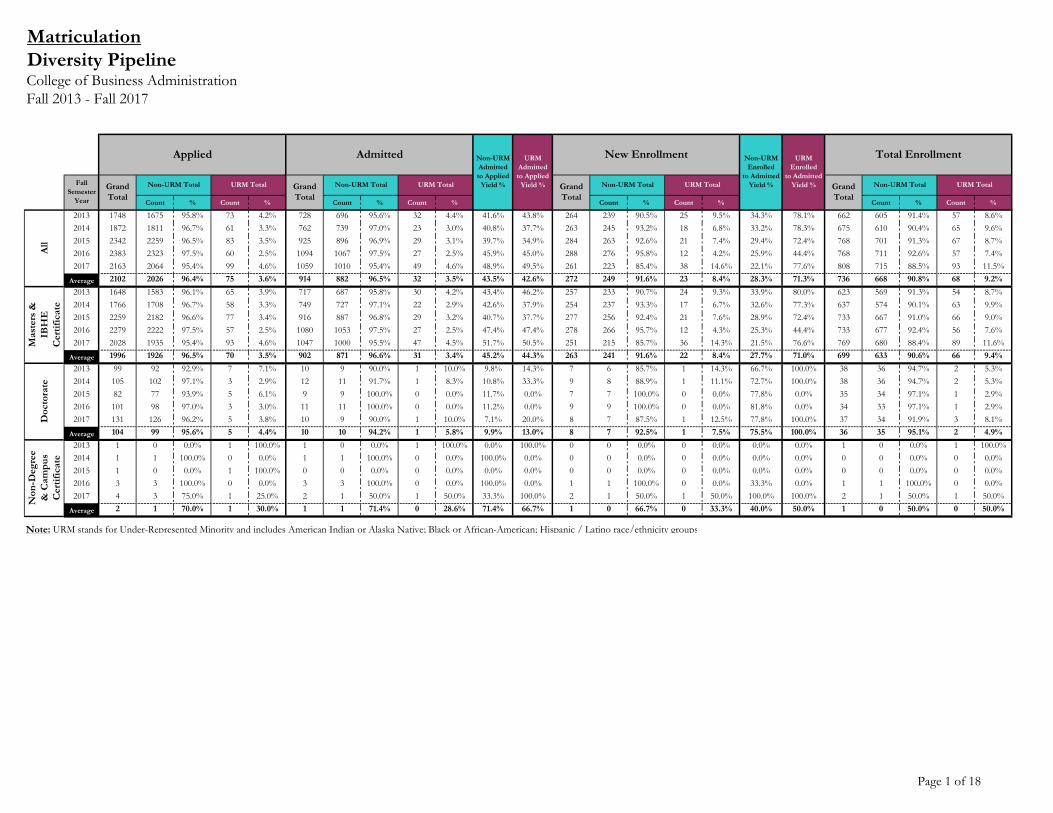
MatriculationDiversity PipelineCollege of Business AdministrationFall 2013 - Fall 2017
Count % Count % Count % Count % Count % Count % Count % Count %
2013 1748 1675 95.8% 73 4.2% 728 696 95.6% 32 4.4% 41.6% 43.8% 264 239 90.5% 25 9.5% 34.3% 78.1% 662 605 91.4% 57 8.6%2014 1872 1811 96.7% 61 3.3% 762 739 97.0% 23 3.0% 40.8% 37.7% 263 245 93.2% 18 6.8% 33.2% 78.3% 675 610 90.4% 65 9.6%2015 2342 2259 96.5% 83 3.5% 925 896 96.9% 29 3.1% 39.7% 34.9% 284 263 92.6% 21 7.4% 29.4% 72.4% 768 701 91.3% 67 8.7%2016 2383 2323 97.5% 60 2.5% 1094 1067 97.5% 27 2.5% 45.9% 45.0% 288 276 95.8% 12 4.2% 25.9% 44.4% 768 711 92.6% 57 7.4%2017 2163 2064 95.4% 99 4.6% 1059 1010 95.4% 49 4.6% 48.9% 49.5% 261 223 85.4% 38 14.6% 22.1% 77.6% 808 715 88.5% 93 11.5%
Average 2102 2026 96.4% 75 3.6% 914 882 96.5% 32 3.5% 43.5% 42.6% 272 249 91.6% 23 8.4% 28.3% 71.3% 736 668 90.8% 68 9.2%2013 1648 1583 96.1% 65 3.9% 717 687 95.8% 30 4.2% 43.4% 46.2% 257 233 90.7% 24 9.3% 33.9% 80.0% 623 569 91.3% 54 8.7%2014 1766 1708 96.7% 58 3.3% 749 727 97.1% 22 2.9% 42.6% 37.9% 254 237 93.3% 17 6.7% 32.6% 77.3% 637 574 90.1% 63 9.9%2015 2259 2182 96.6% 77 3.4% 916 887 96.8% 29 3.2% 40.7% 37.7% 277 256 92.4% 21 7.6% 28.9% 72.4% 733 667 91.0% 66 9.0%2016 2279 2222 97.5% 57 2.5% 1080 1053 97.5% 27 2.5% 47.4% 47.4% 278 266 95.7% 12 4.3% 25.3% 44.4% 733 677 92.4% 56 7.6%2017 2028 1935 95.4% 93 4.6% 1047 1000 95.5% 47 4.5% 51.7% 50.5% 251 215 85.7% 36 14.3% 21.5% 76.6% 769 680 88.4% 89 11.6%
Average 1996 1926 96.5% 70 3.5% 902 871 96.6% 31 3.4% 45.2% 44.3% 263 241 91.6% 22 8.4% 27.7% 71.0% 699 633 90.6% 66 9.4%2013 99 92 92.9% 7 7.1% 10 9 90.0% 1 10.0% 9.8% 14.3% 7 6 85.7% 1 14.3% 66.7% 100.0% 38 36 94.7% 2 5.3%2014 105 102 97.1% 3 2.9% 12 11 91.7% 1 8.3% 10.8% 33.3% 9 8 88.9% 1 11.1% 72.7% 100.0% 38 36 94.7% 2 5.3%2015 82 77 93.9% 5 6.1% 9 9 100.0% 0 0.0% 11.7% 0.0% 7 7 100.0% 0 0.0% 77.8% 0.0% 35 34 97.1% 1 2.9%2016 101 98 97.0% 3 3.0% 11 11 100.0% 0 0.0% 11.2% 0.0% 9 9 100.0% 0 0.0% 81.8% 0.0% 34 33 97.1% 1 2.9%2017 131 126 96.2% 5 3.8% 10 9 90.0% 1 10.0% 7.1% 20.0% 8 7 87.5% 1 12.5% 77.8% 100.0% 37 34 91.9% 3 8.1%
Average 104 99 95.6% 5 4.4% 10 10 94.2% 1 5.8% 9.9% 13.0% 8 7 92.5% 1 7.5% 75.5% 100.0% 36 35 95.1% 2 4.9%2013 1 0 0.0% 1 100.0% 1 0 0.0% 1 100.0% 0.0% 100.0% 0 0 0.0% 0 0.0% 0.0% 0.0% 1 0 0.0% 1 100.0%2014 1 1 100.0% 0 0.0% 1 1 100.0% 0 0.0% 100.0% 0.0% 0 0 0.0% 0 0.0% 0.0% 0.0% 0 0 0.0% 0 0.0%2015 1 0 0.0% 1 100.0% 0 0 0.0% 0 0.0% 0.0% 0.0% 0 0 0.0% 0 0.0% 0.0% 0.0% 0 0 0.0% 0 0.0%2016 3 3 100.0% 0 0.0% 3 3 100.0% 0 0.0% 100.0% 0.0% 1 1 100.0% 0 0.0% 33.3% 0.0% 1 1 100.0% 0 0.0%2017 4 3 75.0% 1 25.0% 2 1 50.0% 1 50.0% 33.3% 100.0% 2 1 50.0% 1 50.0% 100.0% 100.0% 2 1 50.0% 1 50.0%
Average 2 1 70.0% 1 30.0% 1 1 71.4% 0 28.6% 71.4% 66.7% 1 0 66.7% 0 33.3% 40.0% 50.0% 1 0 50.0% 0 50.0%
Note: URM stands for Under-Represented Minority and includes American Indian or Alaska Native; Black or African-American; Hispanic / Latino race/ethnicity groups
Applied Non-URM Admittedto Applied
Yield %
URM Enrolled
to Admitted Yield %
Total Enrollment
Grand Total
Non-URM Total URM TotalFall Semester
Year
Grand Total
Non-URM Total URM TotalURM Total Grand Total
Non-URM Total URM Total
Non
-Deg
ree
& C
ampu
s C
ertif
icat
e
Non-URM Enrolled
to Admitted Yield %
All
Mas
ters
&IB
HE
C
ertif
icat
eD
octo
rate
Admitted URM Admittedto Applied
Yield %
New Enrollment
Grand Total
Non-URM Total
Page 1 of 18

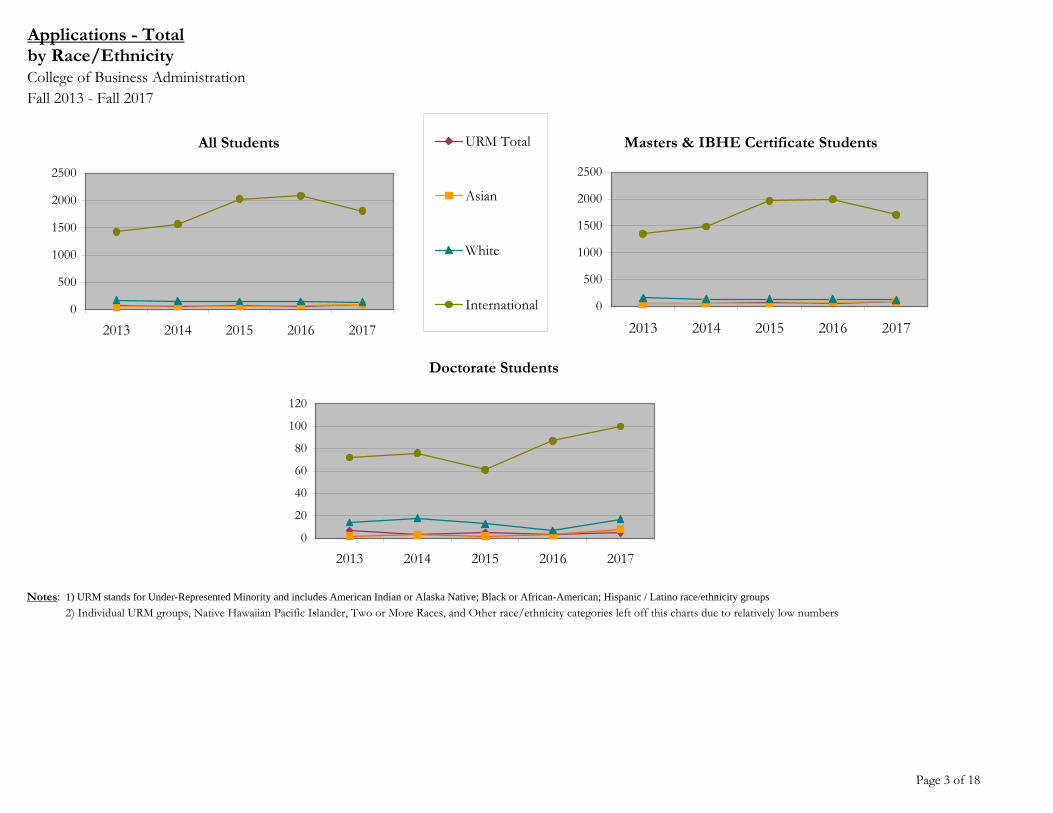
Applications - Totalby Race/EthnicityCollege of Business AdministrationFall 2013 - Fall 2017
Not Reported
Count % Count % Count % Count % Count % Count % Count % Count % Count % Count2013 1748 0 0.0 39 2.2 34 1.9 73 4.2 54 3.1 0 0.0 174 10.0 8 0.5 1426 81.6 132014 1872 1 0.1 31 1.7 29 1.5 61 3.3 70 3.7 0 0.0 155 8.3 6 0.3 1566 83.7 142015 2342 0 0.0 48 2.0 35 1.5 83 3.5 65 2.8 0 0.0 153 6.5 7 0.3 2030 86.7 42016 2383 0 0.0 26 1.1 34 1.4 60 2.5 78 3.3 0 0.0 149 6.3 4 0.2 2086 87.5 62017 2163 1 0.0 42 1.9 56 2.6 99 4.6 95 4.4 1 0.0 142 6.6 7 0.3 1809 83.6 102013 1648 0 0.0 34 2.1 31 1.9 65 3.9 52 3.2 0 0.0 160 9.7 7 0.4 1354 82.2 102014 1767 1 0.1 29 1.6 28 1.6 58 3.3 67 3.8 0 0.0 136 7.7 4 0.2 1490 84.3 122015 2259 0 0.0 43 1.9 34 1.5 77 3.4 63 2.8 0 0.0 140 6.2 7 0.3 1969 87.2 32016 2279 0 0.0 26 1.1 31 1.4 57 2.5 75 3.3 0 0.0 141 6.2 3 0.1 1998 87.7 52017 2028 0 0.0 37 1.8 56 2.8 93 4.6 87 4.3 1 0.0 125 6.2 6 0.3 1707 84.2 92013 99 0 0.0 5 5.1 2 2.0 7 7.1 2 2.0 0 0.0 14 14.1 1 1.0 72 72.7 32014 104 0 0.0 2 1.9 1 1.0 3 2.9 3 2.9 0 0.0 18 17.3 2 1.9 76 73.1 22015 82 0 0.0 4 4.9 1 1.2 5 6.1 2 2.4 0 0.0 13 15.9 0 0.0 61 74.4 12016 101 0 0.0 0 0.0 3 3.0 3 3.0 3 3.0 0 0.0 7 6.9 0 0.0 87 86.1 12017 131 1 0.8 4 3.1 0 0.0 5 3.8 8 6.1 0 0.0 17 13.0 0 0.0 100 76.3 12013 1 0 0.0 0 0.0 1 100.0 1 100.0 0 0.0 0 0.0 0 0.0 0 0.0 0 0.0 02014 1 0 0.0 0 0.0 0 0.0 0 0.0 0 0.0 0 0.0 1 100.0 0 0.0 0 0.0 02015 1 0 0.0 1 100.0 0 0.0 1 100.0 0 0.0 0 0.0 0 0.0 0 0.0 0 0.0 02016 3 0 0.0 0 0.0 0 0.0 0 0.0 0 0.0 0 0.0 1 33.3 1 33.3 1 33.3 02017 4 0 0.0 1 25.0 0 0.0 1 25.0 0 0.0 0 0.0 0 0.0 1 25.0 2 50.0 0
Note: URM stands for Under-Represented Minority and includes American Indian or Alaska Native; Black or African-American; Hispanic / Latino race/ethnicity groups
Mas
ters
&IB
HE
C
ertif
icat
eD
octo
rate
Non
-Deg
ree
& C
ampu
s C
ertif
icat
e
Under Represented Minorities (URM)
TotalAmerican Indian or
Alaska Native
Black or African
American
Hispanic / Latino
All
URM Total Asian Two or More RacesWhite International
Native Hawaiian or
Pacific Islander
Page 2 of 18
Applications - Totalby Race/Ethnicity College of Business AdministrationFall 2013 - Fall 2017
Notes: 1) URM stands for Under-Represented Minority and includes American Indian or Alaska Native; Black or African-American; Hispanic / Latino race/ethnicity groups 2) Individual URM groups, Native Hawaiian Pacific Islander, Two or More Races, and Other race/ethnicity categories left off this charts due to relatively low numbers
All Students
0
500
1000
1500
2000
2500
2013 2014 2015 2016 2017
URM Total
Asian
White
International
Masters & IBHE Certificate Students
0
500
1000
1500
2000
2500
2013 2014 2015 2016 2017
Doctorate Students
0
20
40
60
80
100
120
2013 2014 2015 2016 2017
Page 3 of 18

Applications - Admittedby Race/EthnicityCollege of Business AdministrationFall 2013 - Fall 2017
Not Reported
Count % Count % Count % Count % Count % Count % Count % Count % Count % Count2013 728 0 0.0 17 2.3 15 2.1 32 4.4 36 4.9 0 0.0 122 16.8 4 0.5 525 72.1 92014 762 1 0.1 9 1.2 13 1.7 23 3.0 37 4.9 0 0.0 96 12.6 1 0.1 601 78.9 42015 925 0 0.0 12 1.3 17 1.8 29 3.1 41 4.4 0 0.0 86 9.3 5 0.5 764 82.6 02016 1094 0 0.0 12 1.1 15 1.4 27 2.5 44 4.0 0 0.0 103 9.4 2 0.2 915 83.6 32017 1059 0 0.0 19 1.8 30 2.8 49 4.6 46 4.3 1 0.1 82 7.7 4 0.4 874 82.5 32013 717 0 0.0 16 2.2 14 2.0 30 4.2 36 5.0 0 0.0 120 16.7 4 0.6 518 72.2 92014 749 1 0.1 9 1.2 12 1.6 22 2.9 36 4.8 0 0.0 95 12.7 1 0.1 591 78.9 42015 916 0 0.0 12 1.3 17 1.9 29 3.2 41 4.5 0 0.0 85 9.3 5 0.5 756 82.5 02016 1080 0 0.0 12 1.1 15 1.4 27 2.5 43 4.0 0 0.0 101 9.4 1 0.1 905 83.8 32017 1047 0 0.0 17 1.6 30 2.9 47 4.5 45 4.3 1 0.1 82 7.8 4 0.4 865 82.6 32013 10 0 0.0 1 10.0 0 0.0 1 10.0 0 0.0 0 0.0 2 20.0 0 0.0 7 70.0 02014 12 0 0.0 0 0.0 1 8.3 1 8.3 1 8.3 0 0.0 0 0.0 0 0.0 10 83.3 02015 9 0 0.0 0 0.0 0 0.0 0 0.0 0 0.0 0 0.0 1 11.1 0 0.0 8 88.9 02016 11 0 0.0 0 0.0 0 0.0 0 0.0 1 9.1 0 0.0 1 9.1 0 0.0 9 81.8 02017 10 0 0.0 1 10.0 0 0.0 1 10.0 1 10.0 0 0.0 0 0.0 0 0.0 8 80.0 02013 1 0 0.0 0 0.0 1 100.0 1 100.0 0 0.0 0 0.0 0 0.0 0 0.0 0 0.0 02014 1 0 0.0 0 0.0 0 0.0 0 0.0 0 0.0 0 0.0 1 100.0 0 0.0 0 0.0 02015 0 0 0.0 0 0.0 0 0.0 0 0.0 0 0.0 0 0.0 0 0.0 0 0.0 0 0.0 02016 3 0 0.0 0 0.0 0 0.0 0 0.0 0 0.0 0 0.0 1 33.3 1 33.3 1 33.3 02017 2 0 0.0 1 50.0 0 0.0 1 50.0 0 0.0 0 0.0 0 0.0 0 0.0 1 50.0 0
Note: URM stands for Under-Represented Minority and includes American Indian or Alaska Native; Black or African-American; Hispanic / Latino race/ethnicity groups
Asian
Non
-Deg
ree
& C
ampu
s C
ertif
icat
e
International
Native Hawaiian or
Pacific Islander
Two or More RacesWhite
All
Mas
ters
&IB
HE
C
ertif
icat
eD
octo
rate
Under Represented Minorities (URM)
TotalAmerican Indian or
Alaska Native
Black or African
American
Hispanic / Latino URM Total
Page 4 of 18
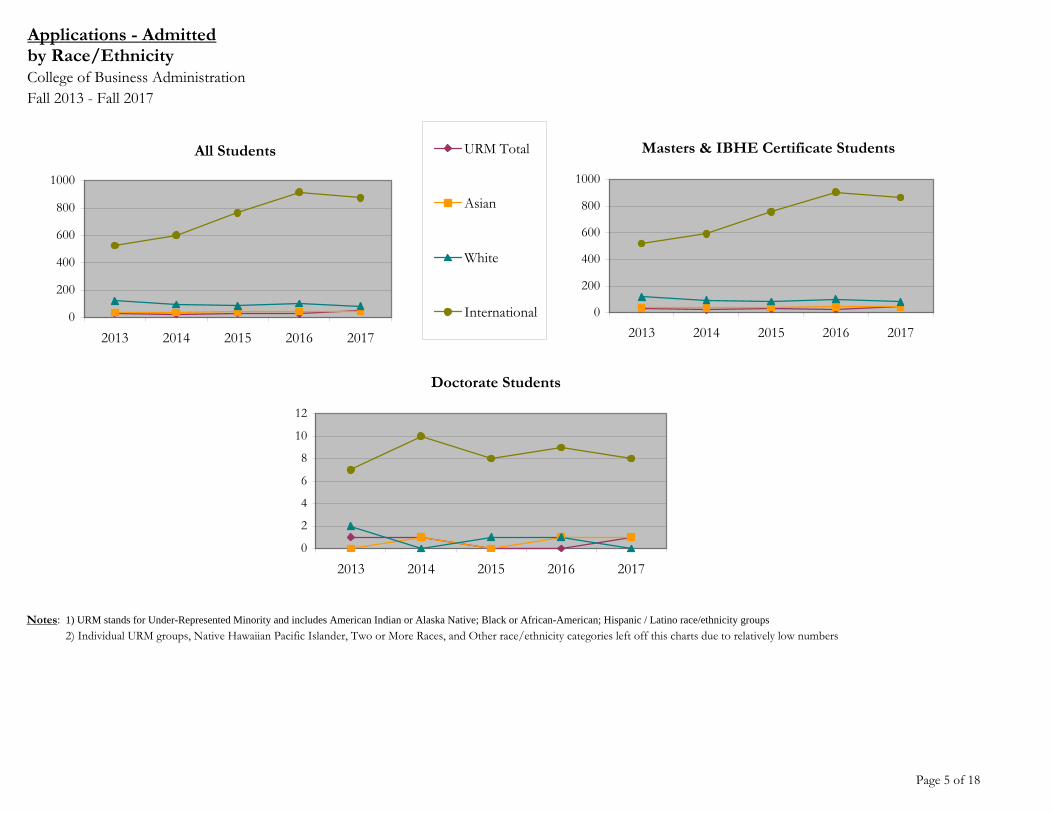
Applications - Admittedby Race/EthnicityCollege of Business AdministrationFall 2013 - Fall 2017
Notes: 1) URM stands for Under-Represented Minority and includes American Indian or Alaska Native; Black or African-American; Hispanic / Latino race/ethnicity groups 2) Individual URM groups, Native Hawaiian Pacific Islander, Two or More Races, and Other race/ethnicity categories left off this charts due to relatively low numbers
All Students
0
200
400
600
800
1000
2013 2014 2015 2016 2017
URM Total
Asian
White
International
Masters & IBHE Certificate Students
0
200
400
600
800
1000
2013 2014 2015 2016 2017
Doctorate Students
0
2
4
6
8
10
12
2013 2014 2015 2016 2017
Page 5 of 18
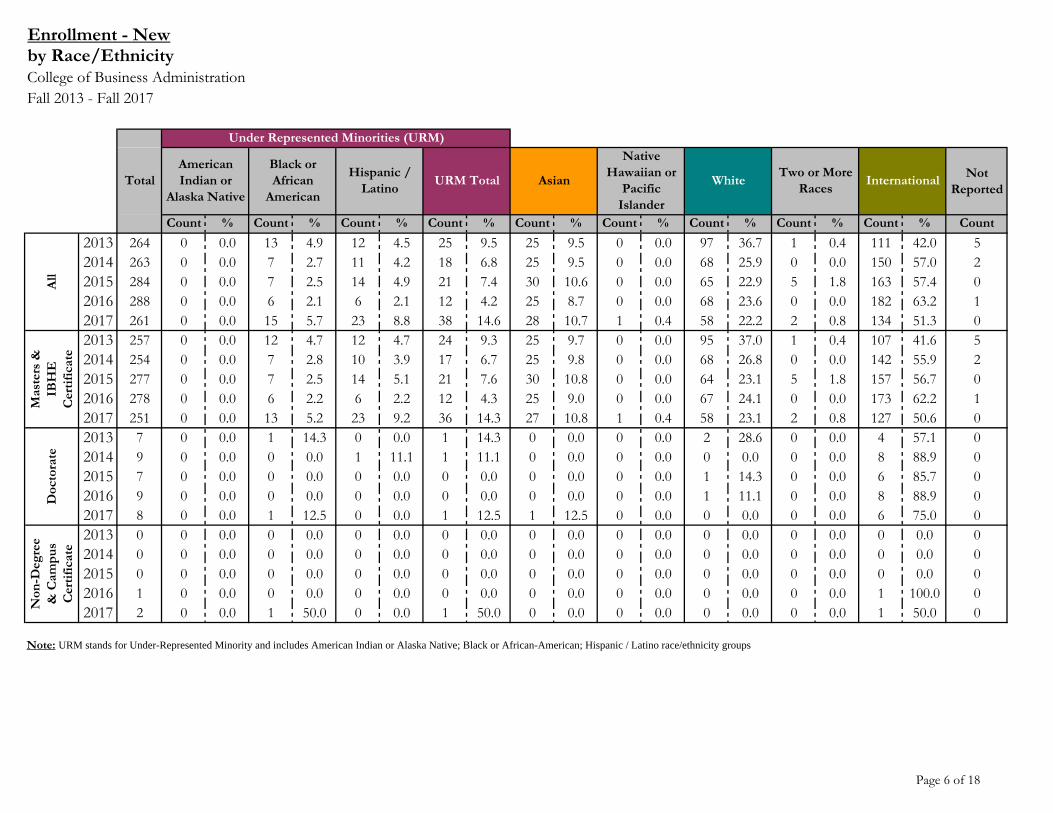
Enrollment - Newby Race/EthnicityCollege of Business AdministrationFall 2013 - Fall 2017
Not Reported
Count % Count % Count % Count % Count % Count % Count % Count % Count % Count2013 264 0 0.0 13 4.9 12 4.5 25 9.5 25 9.5 0 0.0 97 36.7 1 0.4 111 42.0 52014 263 0 0.0 7 2.7 11 4.2 18 6.8 25 9.5 0 0.0 68 25.9 0 0.0 150 57.0 22015 284 0 0.0 7 2.5 14 4.9 21 7.4 30 10.6 0 0.0 65 22.9 5 1.8 163 57.4 02016 288 0 0.0 6 2.1 6 2.1 12 4.2 25 8.7 0 0.0 68 23.6 0 0.0 182 63.2 12017 261 0 0.0 15 5.7 23 8.8 38 14.6 28 10.7 1 0.4 58 22.2 2 0.8 134 51.3 02013 257 0 0.0 12 4.7 12 4.7 24 9.3 25 9.7 0 0.0 95 37.0 1 0.4 107 41.6 52014 254 0 0.0 7 2.8 10 3.9 17 6.7 25 9.8 0 0.0 68 26.8 0 0.0 142 55.9 22015 277 0 0.0 7 2.5 14 5.1 21 7.6 30 10.8 0 0.0 64 23.1 5 1.8 157 56.7 02016 278 0 0.0 6 2.2 6 2.2 12 4.3 25 9.0 0 0.0 67 24.1 0 0.0 173 62.2 12017 251 0 0.0 13 5.2 23 9.2 36 14.3 27 10.8 1 0.4 58 23.1 2 0.8 127 50.6 02013 7 0 0.0 1 14.3 0 0.0 1 14.3 0 0.0 0 0.0 2 28.6 0 0.0 4 57.1 02014 9 0 0.0 0 0.0 1 11.1 1 11.1 0 0.0 0 0.0 0 0.0 0 0.0 8 88.9 02015 7 0 0.0 0 0.0 0 0.0 0 0.0 0 0.0 0 0.0 1 14.3 0 0.0 6 85.7 02016 9 0 0.0 0 0.0 0 0.0 0 0.0 0 0.0 0 0.0 1 11.1 0 0.0 8 88.9 02017 8 0 0.0 1 12.5 0 0.0 1 12.5 1 12.5 0 0.0 0 0.0 0 0.0 6 75.0 02013 0 0 0.0 0 0.0 0 0.0 0 0.0 0 0.0 0 0.0 0 0.0 0 0.0 0 0.0 02014 0 0 0.0 0 0.0 0 0.0 0 0.0 0 0.0 0 0.0 0 0.0 0 0.0 0 0.0 02015 0 0 0.0 0 0.0 0 0.0 0 0.0 0 0.0 0 0.0 0 0.0 0 0.0 0 0.0 02016 1 0 0.0 0 0.0 0 0.0 0 0.0 0 0.0 0 0.0 0 0.0 0 0.0 1 100.0 02017 2 0 0.0 1 50.0 0 0.0 1 50.0 0 0.0 0 0.0 0 0.0 0 0.0 1 50.0 0
Note: URM stands for Under-Represented Minority and includes American Indian or Alaska Native; Black or African-American; Hispanic / Latino race/ethnicity groups
Under Represented Minorities (URM)
American Indian or
Alaska Native
Black or African
American
Hispanic / Latino URM Total
Non
-Deg
ree
& C
ampu
s C
ertif
icat
e
International
All
Mas
ters
&IB
HE
C
ertif
icat
eD
octo
rate
Asian
Native Hawaiian or
Pacific Islander
White Two or More RacesTotal
Page 6 of 18

Enrollment - Newby Race/EthnicityCollege of Business AdministrationFall 2013 - Fall 2017
Notes: 1) URM stands for Under-Represented Minority and includes American Indian or Alaska Native; Black or African-American; Hispanic / Latino race/ethnicity groups 2) Individual URM groups, Native Hawaiian Pacific Islander, Two or More Races, and Other race/ethnicity categories left off this charts due to relatively low numbers
All Students
0
50
100
150
200
2013 2014 2015 2016 2017
URM Total
Asian
White
International
Masters & IBHE Certificate Students
0
50
100
150
200
2013 2014 2015 2016 2017
Doctorate Students
0123456789
2013 2014 2015 2016 2017
Page 7 of 18
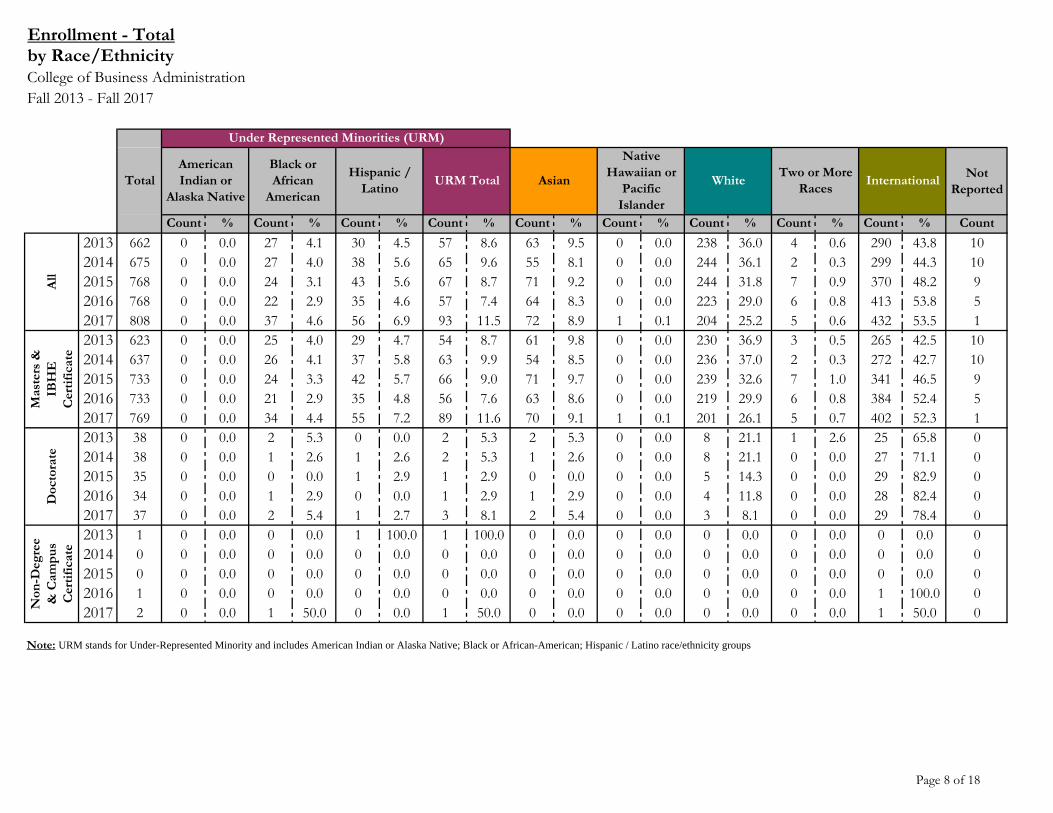
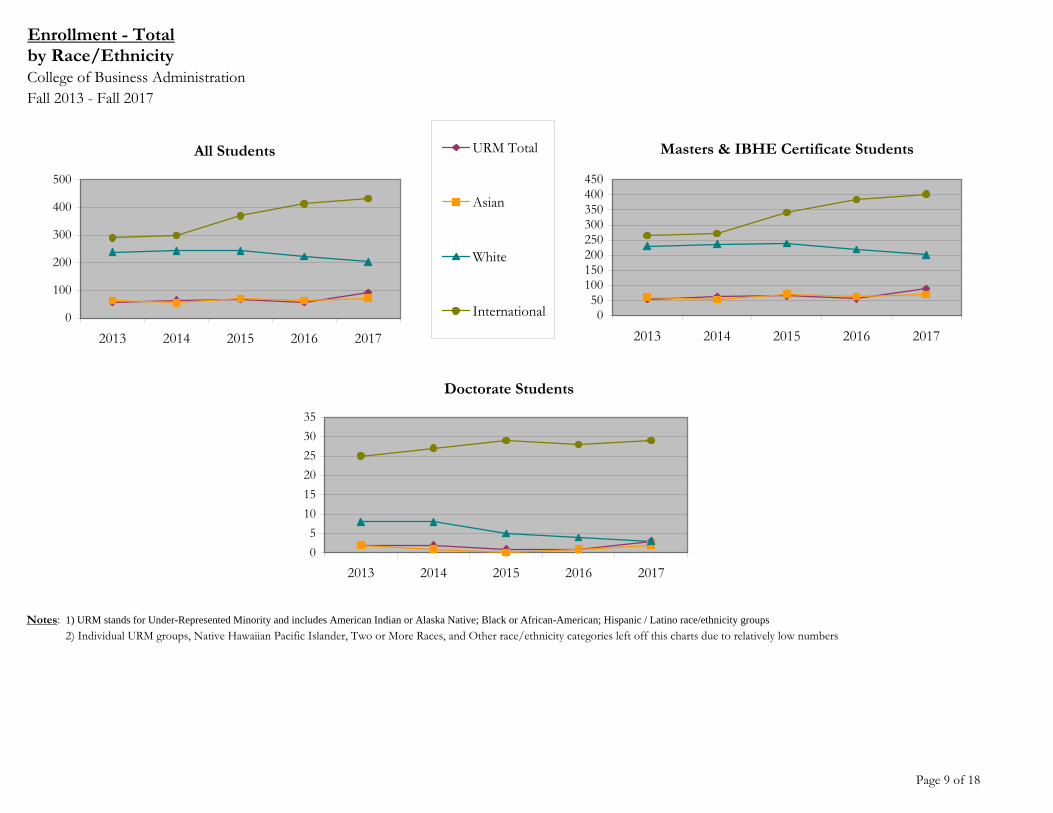
Enrollment - Totalby Race/EthnicityCollege of Business AdministrationFall 2013 - Fall 2017
Not Reported
Count % Count % Count % Count % Count % Count % Count % Count % Count % Count2013 662 0 0.0 27 4.1 30 4.5 57 8.6 63 9.5 0 0.0 238 36.0 4 0.6 290 43.8 102014 675 0 0.0 27 4.0 38 5.6 65 9.6 55 8.1 0 0.0 244 36.1 2 0.3 299 44.3 102015 768 0 0.0 24 3.1 43 5.6 67 8.7 71 9.2 0 0.0 244 31.8 7 0.9 370 48.2 92016 768 0 0.0 22 2.9 35 4.6 57 7.4 64 8.3 0 0.0 223 29.0 6 0.8 413 53.8 52017 808 0 0.0 37 4.6 56 6.9 93 11.5 72 8.9 1 0.1 204 25.2 5 0.6 432 53.5 12013 623 0 0.0 25 4.0 29 4.7 54 8.7 61 9.8 0 0.0 230 36.9 3 0.5 265 42.5 102014 637 0 0.0 26 4.1 37 5.8 63 9.9 54 8.5 0 0.0 236 37.0 2 0.3 272 42.7 102015 733 0 0.0 24 3.3 42 5.7 66 9.0 71 9.7 0 0.0 239 32.6 7 1.0 341 46.5 92016 733 0 0.0 21 2.9 35 4.8 56 7.6 63 8.6 0 0.0 219 29.9 6 0.8 384 52.4 52017 769 0 0.0 34 4.4 55 7.2 89 11.6 70 9.1 1 0.1 201 26.1 5 0.7 402 52.3 12013 38 0 0.0 2 5.3 0 0.0 2 5.3 2 5.3 0 0.0 8 21.1 1 2.6 25 65.8 02014 38 0 0.0 1 2.6 1 2.6 2 5.3 1 2.6 0 0.0 8 21.1 0 0.0 27 71.1 02015 35 0 0.0 0 0.0 1 2.9 1 2.9 0 0.0 0 0.0 5 14.3 0 0.0 29 82.9 02016 34 0 0.0 1 2.9 0 0.0 1 2.9 1 2.9 0 0.0 4 11.8 0 0.0 28 82.4 02017 37 0 0.0 2 5.4 1 2.7 3 8.1 2 5.4 0 0.0 3 8.1 0 0.0 29 78.4 02013 1 0 0.0 0 0.0 1 100.0 1 100.0 0 0.0 0 0.0 0 0.0 0 0.0 0 0.0 02014 0 0 0.0 0 0.0 0 0.0 0 0.0 0 0.0 0 0.0 0 0.0 0 0.0 0 0.0 02015 0 0 0.0 0 0.0 0 0.0 0 0.0 0 0.0 0 0.0 0 0.0 0 0.0 0 0.0 02016 1 0 0.0 0 0.0 0 0.0 0 0.0 0 0.0 0 0.0 0 0.0 0 0.0 1 100.0 02017 2 0 0.0 1 50.0 0 0.0 1 50.0 0 0.0 0 0.0 0 0.0 0 0.0 1 50.0 0
Note: URM stands for Under-Represented Minority and includes American Indian or Alaska Native; Black or African-American; Hispanic / Latino race/ethnicity groups
Mas
ters
&IB
HE
C
ertif
icat
eD
octo
rate
Non
-Deg
ree
& C
ampu
s C
ertif
icat
e
White
All
URM TotalTotalAmerican Indian or
Alaska Native
Black or African
American
Hispanic / Latino
Under Represented Minorities (URM)
InternationalAsian
Native Hawaiian or
Pacific Islander
Two or More Races
Page 8 of 18
Enrollment - Totalby Race/EthnicityCollege of Business AdministrationFall 2013 - Fall 2017
Notes: 1) URM stands for Under-Represented Minority and includes American Indian or Alaska Native; Black or African-American; Hispanic / Latino race/ethnicity groups 2) Individual URM groups, Native Hawaiian Pacific Islander, Two or More Races, and Other race/ethnicity categories left off this charts due to relatively low numbers
All Students
0
100
200
300
400
500
2013 2014 2015 2016 2017
URM Total
Asian
White
International
Masters & IBHE Certificate Students
050
100150200250300350400450
2013 2014 2015 2016 2017
Doctorate Students
05
101520253035
2013 2014 2015 2016 2017
Page 9 of 18
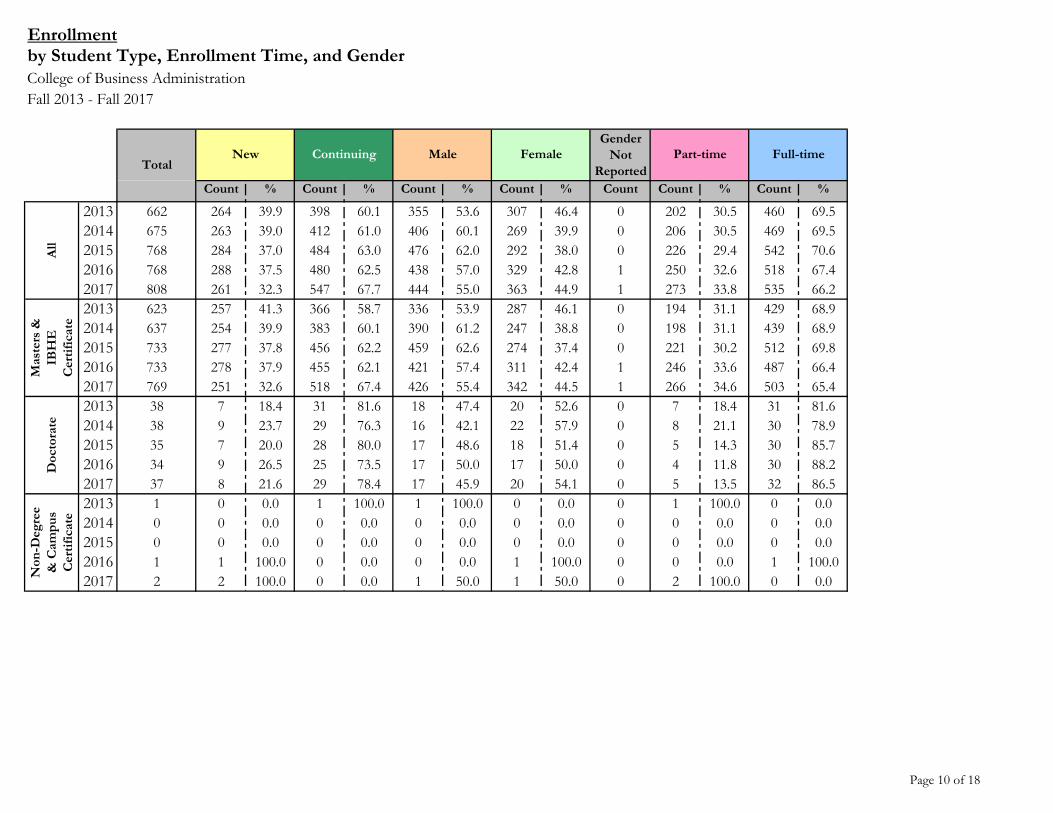
Enrollmentby Student Type, Enrollment Time, and GenderCollege of Business AdministrationFall 2013 - Fall 2017
Gender Not
ReportedCount % Count % Count % Count % Count Count % Count %
2013 662 264 39.9 398 60.1 355 53.6 307 46.4 0 202 30.5 460 69.52014 675 263 39.0 412 61.0 406 60.1 269 39.9 0 206 30.5 469 69.52015 768 284 37.0 484 63.0 476 62.0 292 38.0 0 226 29.4 542 70.62016 768 288 37.5 480 62.5 438 57.0 329 42.8 1 250 32.6 518 67.42017 808 261 32.3 547 67.7 444 55.0 363 44.9 1 273 33.8 535 66.22013 623 257 41.3 366 58.7 336 53.9 287 46.1 0 194 31.1 429 68.92014 637 254 39.9 383 60.1 390 61.2 247 38.8 0 198 31.1 439 68.92015 733 277 37.8 456 62.2 459 62.6 274 37.4 0 221 30.2 512 69.82016 733 278 37.9 455 62.1 421 57.4 311 42.4 1 246 33.6 487 66.42017 769 251 32.6 518 67.4 426 55.4 342 44.5 1 266 34.6 503 65.42013 38 7 18.4 31 81.6 18 47.4 20 52.6 0 7 18.4 31 81.62014 38 9 23.7 29 76.3 16 42.1 22 57.9 0 8 21.1 30 78.92015 35 7 20.0 28 80.0 17 48.6 18 51.4 0 5 14.3 30 85.72016 34 9 26.5 25 73.5 17 50.0 17 50.0 0 4 11.8 30 88.22017 37 8 21.6 29 78.4 17 45.9 20 54.1 0 5 13.5 32 86.52013 1 0 0.0 1 100.0 1 100.0 0 0.0 0 1 100.0 0 0.02014 0 0 0.0 0 0.0 0 0.0 0 0.0 0 0 0.0 0 0.02015 0 0 0.0 0 0.0 0 0.0 0 0.0 0 0 0.0 0 0.02016 1 1 100.0 0 0.0 0 0.0 1 100.0 0 0 0.0 1 100.02017 2 2 100.0 0 0.0 1 50.0 1 50.0 0 2 100.0 0 0.0
All
Mas
ters
&IB
HE
C
ertif
icat
eD
octo
rate
Non
-Deg
ree
& C
ampu
s C
ertif
icat
e
Full-timeNew Continuing Male FemaleTotal
Part-time
Page 10 of 18
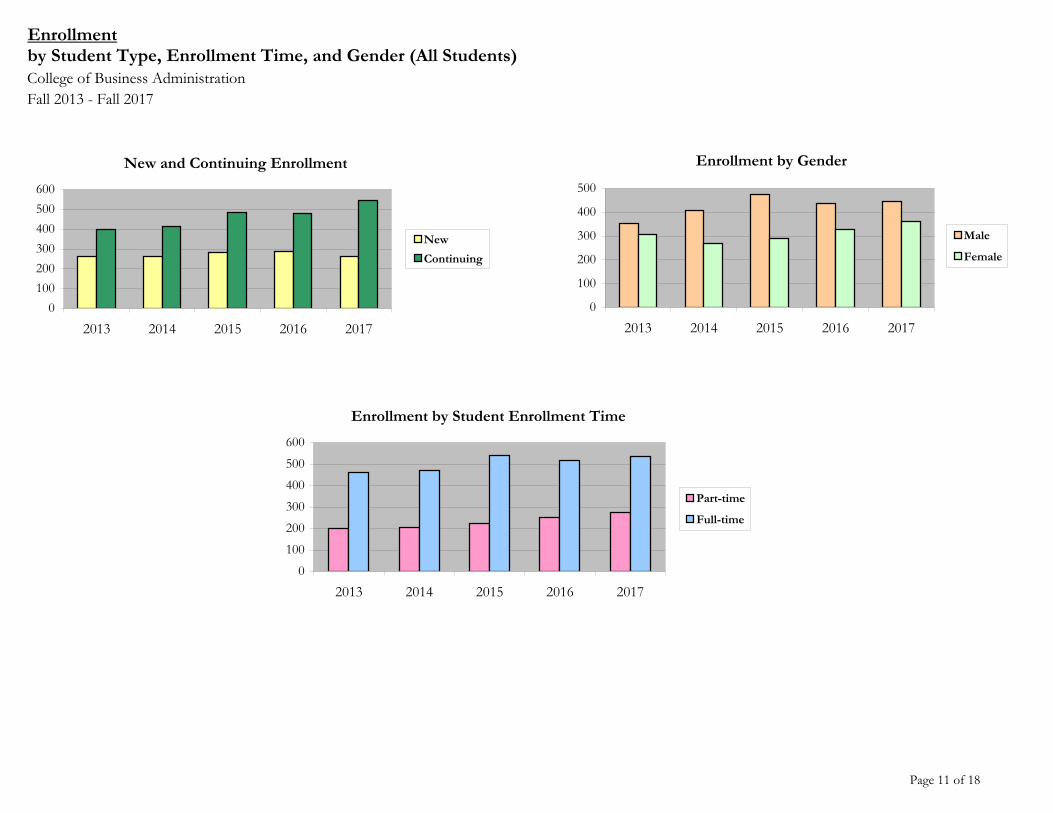
Enrollmentby Student Type, Enrollment Time, and Gender (All Students)College of Business AdministrationFall 2013 - Fall 2017
New and Continuing Enrollment
0100200300400500600
2013 2014 2015 2016 2017
NewContinuing
Enrollment by Gender
0
100
200
300
400
500
2013 2014 2015 2016 2017
Male
Female
Enrollment by Student Enrollment Time
0100200300400500600
2013 2014 2015 2016 2017
Part-time
Full-time
Page 11 of 18

Enrollmentby Student Type, Enrollment Time, and Gender (Master's Students)College of Business AdministrationFall 2013 - Fall 2017
New and Continuing Enrollment
0100200300400500600
2013 2014 2015 2016 2017
NewContinuing
Enrollment by Gender
0
100
200
300
400
500
2013 2014 2015 2016 2017
Male
Female
Enrollment by Student Enrollment Time
0
100
200
300
400
500
600
2013 2014 2015 2016 2017
Part-time
Full-time
Page 12 of 18

Enrollmentby Student Type, Enrollment Time, and Gender (Doctorate Students)College of Business AdministrationFall 2013 - Fall 2017
New and Continuing Enrollment
05
101520253035
2013 2014 2015 2016 2017
NewContinuing
Enrollment by Gender
0
5
10
15
20
25
2013 2014 2015 2016 2017
Male
Female
Enrollment by Student Enrollment Time
05
101520253035
2013 2014 2015 2016 2017
Part-time
Full-time
Page 13 of 18

Degrees Conferred by Race/EthnicityCollege of Business AdministrationFall 2013 - Fall 2017
Not Reported
Count % Count % Count % Count % Count % Count % Count % Count % Count % Count2012 - 13 284 0 0.0 13 4.6 12 4.2 25 8.8 27 9.5 0 0.0 109 38.4 3 1.1 116 40.8 42013 - 14 302 0 0.0 8 2.6 9 3.0 17 5.6 31 10.3 0 0.0 97 32.1 2 0.7 153 50.7 22014 - 15 272 0 0.0 13 4.8 12 4.4 25 9.2 17 6.3 0 0.0 90 33.1 0 0.0 136 50.0 42015 - 16 340 0 0.0 9 2.6 16 4.7 25 7.4 36 10.6 0 0.0 102 30.0 1 0.3 170 50.0 62016 - 17 358 0 0.0 7 2.0 17 4.7 24 6.7 32 8.9 0 0.0 104 29.1 3 0.8 193 53.9 22012 - 13 276 0 0.0 12 4.3 12 4.3 24 8.7 27 9.8 0 0.0 106 38.4 3 1.1 112 40.6 42013 - 14 296 0 0.0 6 2.0 9 3.0 15 5.1 31 10.5 0 0.0 95 32.1 2 0.7 151 51.0 22014 - 15 266 0 0.0 13 4.9 12 4.5 25 9.4 17 6.4 0 0.0 89 33.5 0 0.0 131 49.2 42015 - 16 335 0 0.0 9 2.7 16 4.8 25 7.5 36 10.7 0 0.0 99 29.6 1 0.3 168 50.1 62016 - 17 351 0 0.0 7 2.0 17 4.8 24 6.8 32 9.1 0 0.0 103 29.3 3 0.9 187 53.3 22012 - 13 8 0 0.0 1 12.5 0 0.0 1 12.5 0 0.0 0 0.0 3 37.5 0 0.0 4 50.0 02013 - 14 6 0 0.0 2 33.3 0 0.0 2 33.3 0 0.0 0 0.0 2 33.3 0 0.0 2 33.3 02014 - 15 6 0 0.0 0 0.0 0 0.0 0 0.0 0 0.0 0 0.0 1 16.7 0 0.0 5 83.3 02015 - 16 5 0 0.0 0 0.0 0 0.0 0 0.0 0 0.0 0 0.0 3 60.0 0 0.0 2 40.0 02016 - 17 7 0 0.0 0 0.0 0 0.0 0 0.0 0 0.0 0 0.0 1 14.3 0 0.0 6 85.7 02012 - 13 0 0 0.0 0 0.0 0 0.0 0 0.0 0 0.0 0 0.0 0 0.0 0 0.0 0 0.0 02013 - 14 0 0 0.0 0 0.0 0 0.0 0 0.0 0 0.0 0 0.0 0 0.0 0 0.0 0 0.0 02014 - 15 0 0 0.0 0 0.0 0 0.0 0 0.0 0 0.0 0 0.0 0 0.0 0 0.0 0 0.0 02015 - 16 0 0 0.0 0 0.0 0 0.0 0 0.0 0 0.0 0 0.0 0 0.0 0 0.0 0 0.0 02016 - 17 0 0 0.0 0 0.0 0 0.0 0 0.0 0 0.0 0 0.0 0 0.0 0 0.0 0 0.0 0
Note: Each row represents a fiscal year, begining with Summer term and ending with Spring.
Under Represented Minorities (URM)
TotalAmerican Indian or
Alaska Native
Black or African
American
Hispanic / Latino URM Total InternationalAsian
Native Hawaiian or
Pacific Islander
Two or More RacesWhite
Non
-Deg
ree
& C
ampu
s C
ertif
icat
e
Mas
ters
&IB
HE
C
ertif
icat
eD
octo
rate
All
Page 14 of 18

Degrees Conferred by Race/EthnicityCollege of Business AdministrationFall 2013 - Fall 2017
Notes: 1) URM stands for Under-Represented Minority and includes American Indian or Alaska Native; Black or African-American; Hispanic / Latino race/ethnicity groups 2) Individual URM groups, Native Hawaiian Pacific Islander, Two or More Races, and Other race/ethnicity categories left off this charts due to relatively low numbers
All Students
0
50
100
150
200
250
2011-12 2012-13 2013-14 2014-15 2015-16
URM Total
Asian
White
International
Masters & IBHE Certificate Students
0
50
100
150
200
2011-12 2012-13 2013-14 2014-15 2015-16
Doctorate Students
01234567
2011-12 2012-13 2013-14 2014-15 2015-16
Page 15 of 18
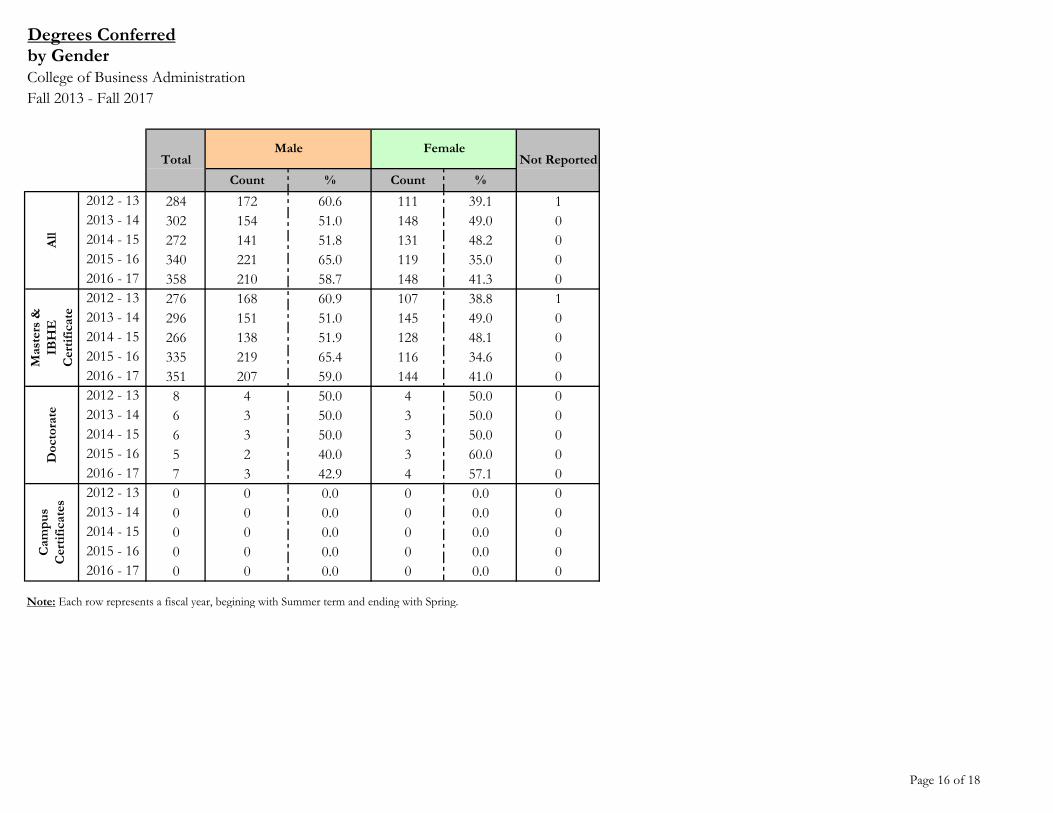
Degrees Conferredby GenderCollege of Business AdministrationFall 2013 - Fall 2017
Count % Count %2012 - 13 284 172 60.6 111 39.1 12013 - 14 302 154 51.0 148 49.0 02014 - 15 272 141 51.8 131 48.2 02015 - 16 340 221 65.0 119 35.0 02016 - 17 358 210 58.7 148 41.3 02012 - 13 276 168 60.9 107 38.8 12013 - 14 296 151 51.0 145 49.0 02014 - 15 266 138 51.9 128 48.1 02015 - 16 335 219 65.4 116 34.6 02016 - 17 351 207 59.0 144 41.0 02012 - 13 8 4 50.0 4 50.0 02013 - 14 6 3 50.0 3 50.0 02014 - 15 6 3 50.0 3 50.0 02015 - 16 5 2 40.0 3 60.0 02016 - 17 7 3 42.9 4 57.1 02012 - 13 0 0 0.0 0 0.0 02013 - 14 0 0 0.0 0 0.0 02014 - 15 0 0 0.0 0 0.0 02015 - 16 0 0 0.0 0 0.0 02016 - 17 0 0 0.0 0 0.0 0
Note: Each row represents a fiscal year, begining with Summer term and ending with Spring.
Cam
pus
Cer
tific
ates
Not Reported
All
Mas
ters
&IB
HE
C
ertif
icat
eD
octo
rate
TotalMale Female
Page 16 of 18

Degrees Conferredby GenderCollege of Business AdministrationFall 2013 - Fall 2017
All Students
0
50
100
150
200
250
2011-12 2012-13 2013-14 2014-15 2015-16
Male
Female
Masters & IBHE Certificate Students
0
50
100
150
200
250
2011-12 2012-13 2013-14 2014-15 2015-16
Doctorate Students
0
1
2
3
4
5
2011-12 2012-13 2013-14 2014-15 2015-16
Page 17 of 18

Appendix ACollege of Business AdministrationFall 2013 - Fall 2017
List of program codes included in this document20FL5482NDEG20FL9875MBA20FL9875NDEG20FS0075MS20FS0079PHD20FS1000MS20FS1432MS20FS1657MA20FS5395MS20FS9875MBA20FS9875NDEG20FS9890MS20FS9890NDEG20FS9890PHD
Notes: 1) Program codes are sorted by alphabetical order in column-wise fashion 2) Program codes highlighted in yellow did not have applications, enrollment, nor degrees conferred in the covered period
Page 18 of 18
Top Related