


Languages
Pages
Legal


Economic Shocks and Crime: Evidence from the
Crash of Ponzi Schemes
Darwin Cortés Julieth Santamaría Juan F. Vargas
SERIE DOCUMENTOS DE TRABAJO
No. 185
Marzo de 2016
Economic Shocks and Crime: Evidence from theCrash of Ponzi Schemes∗
Darwin Cortes† Julieth Santamarıa‡ Juan F. Vargas§
March 14, 2016
Abstract
In November 2008, Colombian authorities dismantled a network of Ponzi schemes,making hundreds of thousands of investors lose tens of millions of dollars throughoutthe country. Using original data on the geographical incidence of the Ponzi schemes,this paper estimates the impact of their break down on crime. We find that the crashof Ponzi schemes differentially exacerbated crime in affected districts. Confirmingthe intuition of the standard economic model of crime, this effect is only present inplaces with relatively weak judicial and law enforcement institutions, and with littleaccess to consumption smoothing mechanisms such as microcredit. In addition, weshow that, with the exception of economically-motivated felonies such as robbery,violent crime is not affected by the negative shock.
Keywords: Ponzi schemes, Economic shocks, Property crime, ColombiaJEL: G01, N26, P46.
∗We thank David Bardey, Paolo Buonanno, Leopoldo Fergusson, Juan M. Gallego, Giulia La Mattina,Darıo Maldonado, Daniel Mejıa, Sarah Pearlman, Rodrigo Soares and seminar participants at Al Capone,IZA-AMERB, Universidad del Rosario and Universidad Nacional de Colombia for helpful comments anddiscussion. We also thank Karen Chavez, Sofıa del Risco and Jorge Perez for their research assistance.†Economics Department, Universidad del Rosario, Cl 12c No. 4 - 69, Bogota. E-mail:
[email protected].‡Department of Applied Economics, University of Minnesota, 231 Ruttan Hall, 1994 Buford Avenue,
St. Paul, MN 55108. E-mail: [email protected].§CAF-Development Bank of Latin America and Universidad del Rosario, Department of Economics.
Cra 9 No. 76-49, Bogota. E-mails: [email protected] and [email protected].

1 Introduction
This paper exploits the crash of Ponzi schemes to estimate the causal effect of negative
economic shocks on criminal outcomes at the municipal level in Colombia. At the end
of 2008 the Financial Oversight Bureau (FOB) of Colombia with the support of the
Attorney General and the National Police dismantled a dozen Ponzi schemes operating
as a network of facade firms throughout the country, illegally raising money from people
with the offer of unusually high short-term returns. Tens of millions of dollars invested
in these firms by hundreds of thousands of individuals were lost, leaving investors broke.
Using data on the geographical presence of the Ponzi schemes and their crash date,
we estimate the causal effect of the negative economic shock on crime rates at the mu-
nicipal level. Consistent with the standard economic model of crime in which criminal
behavior depends on the expected gain vis-a-vis the probability of capture and likely pun-
ishment (Becker, 1968), we find that the shock differentially increased both shoplifting
and robbery in affected municipalities, but had no effect on either non-robbery violent
crime or grand larceny. We also find no effect of the shock, even on petty theft, in mu-
nicipalities with either relatively more policing and better law enforcement and judicial
institutions, or with relatively more access to consumption smoothing mechanisms such
as poverty-alleviation credits.
There is a large body of literature on the effects of negative economic shocks on
people’s economic behavior. In the face of credit rationing, negative economic shocks
may lead to large consumption drops that harm people’s welfare (Flavin, 1981; Zeldes,
1989). Coping strategies range from selling productive assets (Rosenzweig and Wolpin,
1993) to crop diversification in the case of rural households (Larson and Plessmann, 2009;
Dercon, 1998) to using child labor (Beegle and Weerdt, 2006; Guarcello, Mealli, and
Rosati, 2010). In environments with weak law enforcement, negative economic shocks
can increase the incentives for individuals to illegally appropriate someone else’s riches
(Becker, 1968; Ehrlich, 1973).
There is indeed mounting evidence that negative economic shocks can lead to crime
as a way to offset them. This is the case, for instance, of weather shocks. For example,
Miguel (2005) finds that economic downturns driven by negative rainfall shocks increase
the probability that elderly women (accused of witchcraft) are killed in rural Tanzania
as a way of easing the consumption burden of households. In a similar vein, Sekhri and
Storeygard (2014) show that droughts in India increase dowry deaths perpetrated by men
seeking to re-marry in order to obtain the dowry of their new brides. Mehlum, Miguel,
and Torvik (2006) show that cereal price surges driven by climate shocks in 19th century
Bavaria increase the incidence of property crime. Finally, Hidalgo, Naidu, Nichter, and
1
Richardson (2010) show that rain-driven negative economic shocks in Brazil make land
invasions by landless rural workers more likely.
Similar insights are produced by the empirical literature that exploits the variation
given by non climate-related negative shocks. For instance, Bignon, Caroli, and Galbiati
(2015) exploit the variation in the timing in which different wine districts had their
vineyard harvests ruined by the phylloxera parasite in the second half of the 19th century
in France, to find that the negative shock increased property crime. Arnio, Baumer, and
Wolff (2012) exploit cross-state variation in the US and show that the increase in mortgage
prices has a positive effect on the incidence of robbery. Dube and Vargas (2013) show
that negative exogenous changes in the price of coffee (and in general to labor-intensive
agricultural commodities) exacerbate appropriative conflict in the Colombian districts in
which farmers’ income depends more heavily on the coffee harvest.
Common to all these papers is the idea that appropriative crime can substitute the
material lost generated by negative shocks. This suggests that the type of criminal
behavior in the aftermath of shocks is unlikely to include major violent offenses such as
murder, unless the cultural set up is one in which murder leads to increase consumption or
income and the expected punishment is very low [such as in Tanzania –Miguel (2005)- or
India –Sekhri and Storeygard (2014)]. This is not the case of the crash of Ponzi schemes
in Colombia, where the portfolio of redistributive crimes usually excludes murder.
In spite of this large body of literature, to the best of our knowledge, there is no paper
that systematically studies the effects of shocks induced by the crash of risky financial
businesses. This paper takes advantage of the quasi-natural experiment given by the fall
of a dozen Ponzi schemes that affected over 10 percent of the Colombian territory as
well hundreds of thousands of investors, to assess the effect of an aggregate economic
shock on crime rates. Using difference-in-differences and controlling for municipality and
time fixed effects, as well as for potential time-varying confounders; our findings suggest
that redistributive crimes such as shoplifting and robbery increased disproportionally in
affected areas compared to places that had no Ponzi schemes operating before the crisis.
In contrast, other violent crimes as well as grand larceny do not present a systematic
differential pattern across treatment and control municipalities. Another contribution of
the paper is that we document heterogeneous effects in the extensive margin related to
the quality of local law enforcement and judicial institutions, and related to access to
poverty-alleviation credit. We show that the effect of the shock on crime is only present
in municipalities with a relatively weak law enforcement apparatus and little access to
credit.
All these findings can be rationalized using the standard economic model of crime.
Becker (1968)’s canonic economic model of crime predicts that the higher the probability
2

of apprehension (and the expected punishment) the lower the probability of engaging in
crime for a given payoff. Moreover, the criminalization incentive of negative economic
shocks is exacerbated by the lack of alternative (legal) consumption smoothing strategies
such as credit access.
The rest of the paper is organized as follows. Section 2 provides brief context on Ponzi
schemes and their recent development in Colombia. Section 3 describes the empirical
strategy and the data used to estimate the effect of the crash in Ponzi schemes on criminal
outcomes. Section 4 presents the results and section 5 concludes.
2 Ponzi schemes
Ponzi schemes were named in the US after Charles Ponzi, who created in 1920 a financial
scheme that offered extraordinarily high returns to costumers under the motto: “Double
the money within three months”. In practice Ponzi could sustain such rates by rewarding
early investors with the money of later participants (Zuckoff, 2005). Indeed, the reason
Ponzi schemes can offer rates of return that are considerably higher than market rates
is because they operate under a pyramidal structure in which the deposits from a larger
number of investors at the base are used to pay high returns to a smaller number of
investors at the peak. Thus, returns to investors come from deposits from subsequent
investors rather than from the profit of the firm’s business. This is only sustainable as the
pyramid becomes larger and larger, which can only happen by ensuring that the business
expands at high rates. Investors are encouraged to bring new clients and the return
offered can vary according to one’s success in recruiting new investors. This structure
makes such schemes especially unstable in the long run, and hence Ponzi schemes are
considered illegal.1
Charles Ponzi was not the creator of Ponzi schemes. According to MacKay (1841),
the first such fraud was recorded in 18th century France, where the Scottish economist
John Law engineered a scheme that triggered high levels of speculation and ended up
in a financial collapse called the “Mississippi bubble”.2 Although there is historical
anecdotal evidence that the consequences of this fraud were very large, it is not possible
to quantitatively assess its impact due to the lack of data for the period (Garber, 1990).
In the 20th century similar cases of Ponzi schemes that crashed with large negative
consequences have been reported in Portugal (1970s), the US state of Michigan (1987)
1There are similar fraudulent practices like “pyramids” and “financial chains”. These practices sharethe essential pyramidal structure with Ponzi schemes, which makes them as unsustainable. In fact, inthe Colombian context the schemes analyzed were called “pyramids” by the local press.
2The name comes from the fact that Law was granted privileges to develop the French colonies of theMississippi valley.
3

and Rumania (1990s). Perhaps the two most famous cases of recent history are Albania
(1997) and Haiti (2001). In Albania, the burst in 1997 of a number of Ponzi schemes
generated social disorder against the Albanian government (accused of lack of regulation
and having led the businesses grow considerably) that ended up in what Jarvis (1999)
calls a true civil war, resulting in over 2,000 fatalities and the oust of the incumbent
Albanian president. In Haiti, the crash in 2001 of several “cooperatives” endorsed both
by the government and, through TV commercials, by local celebrities, costed the country
about 60% of its GDP.
Ponzi schemes have recently been brought back to the public attention in the US
by the Madoff case. Bernard Madoff, a US businessman and former chairman of the
NASDQ stock market, managed what Drew and Drew (2010) call “the most successful
Ponzi scheme in history”. Madoff’s US$ 50 billion fund operated for over two decades and
its nature was only uncovered in 2008, at the peak of the global financial crisis, after a
massive withdrawal of resources from fund investors. However, Gregoriou and L’habitant
(2009) argue that there were various alerts that something abnormal was going on with
Madoff’s fund before the crisis, and that the US regulatory entities were negligent not
to act then. In 2009, Madoff was sentenced to 150 years in prison for the creation and
management of a Ponzi scheme that affected thousands of investors.
In Colombia several Ponzi schemes were established throughout the country starting
in the mid 2000s. Their existence became salient in late 2008, when the largest scheme (a
facade firm called DFRE) became illiquid and stopped paying its debts.3 This generated
angry demonstrations by affected clients and subsequent media investigations pointed to
the existence of several such business throughout the country. Costumers of other Ponzi
schemes soon started demanding their investments back and the crises expanded within
a few weeks. In mid-November the government issued Decree 4333, declaring a “social
state of emergency” and the FOB, together with the Attorney General and the National
Police intervened the tainted companies and seized their assets. Firm managers were
charged of massive and frequent fundraising, fraud and money laundering, three grand
felonies according to Colombia’s Criminal Code (art. 316, 246 and 323 respectively).4
The crash of the Ponzi schemes affected hundreds of thousands of investors who lost
billions of dollars. While individual investment are not verifiable, the available figures
are compelling. According to the judicial sentence against David Murcia Guzman, the
founder of a Ponzi scheme, the funds raised by its facade firm (DMG), from about 200,000
3The acronym DRFE stands for “Dinero Facil, Rapido y Efectivo”, Spanish for “easy and fast cash”.4Table 1 reports in chronological order the day that each Ponzi scheme was intervened by the author-
ities and hence crashed. The entire operation lasted just over a month, from Novermebr 12 to December16 2008.
4
investors, surpassed $2 billion.5 This implies a per capita investment of over $10,000,
roughly double the 2008 GDP per capita of Colombia, and four times the annual income
of a minimum wage earner in the same year. In addition, the National Unit of Money
Laundering of the Attorney General Office estimates a similar amount of over $2 billion
raised from almost 400,000 investors by DRFE.6 The average per capita investment in
this case was about $5,000. Consistent with these magnitudes, after the collapse of the
Ponzi schemes the press published chronicles about Ponzi scheme “victims”, who invested
all their savings, sold their assets and took large loans, just to eventually lose it all.
According to these reports, affected individuals ranged from peasants and sharecroppers
to landowners, public servants, politicians, priests, military personnel and celebrities.
Our sense from reading these accounts is that the schemes affected people from a wide
range of the socioeconomic spectrum.
3 Empirical Strategy
Our identification strategy exploits the longitudinal variation given by the fact that Ponzi
schemes were present in some municipalities but no in others, and that all the schemes
crashed within a one month period (see Table 1). We use difference-in-differences to
estimate the differential increase in crime rates experienced in municipalities that hosted
Ponzi schemes after the financial burst, relative to places with no such businesses. This
strategy takes into account any pre-treatment difference in crime levels across treated
and control districts. Our specification is:
Crimei,t = αi + δt + θ(Ponzii × Postt) + φ′Xi,t + εi,t (1)
where Crimei,t is the crime rate, normalized by 100 thousand inhabitants, in munici-
pality i and month t. We look at various types of crimes as typified by the Colombian
Criminal Code: property crimes including shoplifting, vehicle theft and burglary, and
violent crimes including murder, injuries, terrorism, and robbery. Ponzii is an indicator
of the municipalities affected by Ponzi schemes and Postt is a time-dummy that captures
the period after the crash of the Ponzi schemes and hence equals 1 from January 2009
onwards, and 0 from the start of the sample period (July 2007) up to October 2008.7 The
coefficient of interest, θ, captures the differential change in crime rates after the schemes
5Sentence 9, Process No. 11001 60 000 2008 0790, Criminal Court 4 of Bogota.6Source: “Jefe de la ‘piramide’ DRFE pagara solo 7 anos de carcel”, published in the 8/20/2011edition
of newspaper El Tiempo.7The months during which the Ponzi schemes were intervened and dismantled, November and De-
cember 2008, are excluded from the analysis.
5

crashed, in treated municipalities relative to those where no schemes were present. We
add municipality and month fixed effects (respectively αi and δt) to control for any time-
invariant municipal-specific heterogeneity that may be correlated with crime changes,
and for aggregate shocks that may affect all municipalities at a specific time. In addition
Xit, is a vector of time-varying observable controls that are not affected by the financial
burst.8
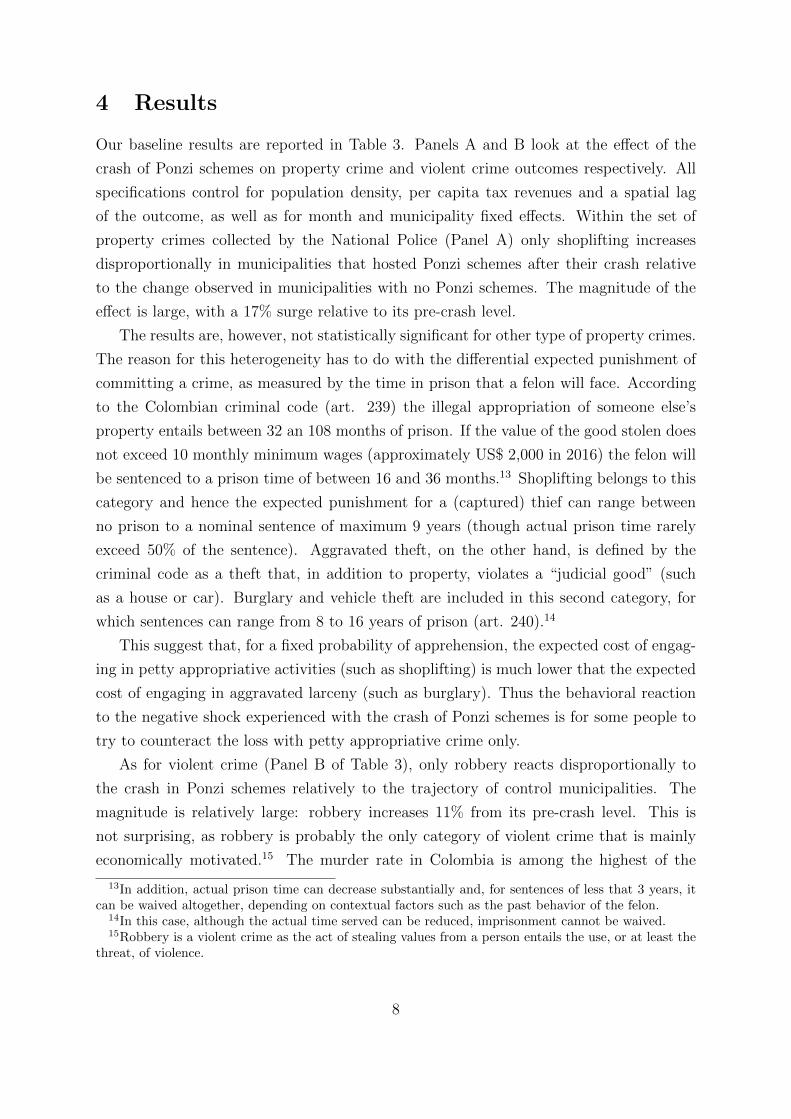
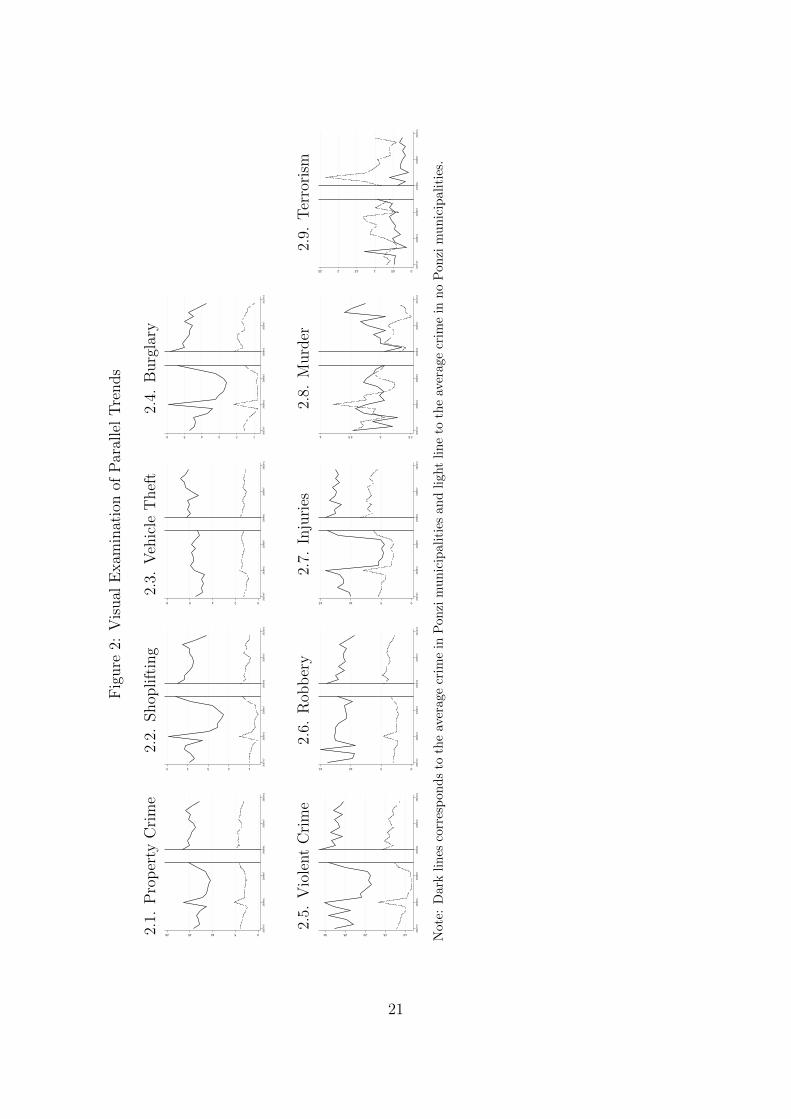
Our main identifying assumption is that, in absence of the financial collapse, crime
rates would have followed a similar trend in municipalities with and without Ponzi
schemes. This might not be the case if, for instance, the unobserved selection process
that defines the settlement of Ponzi schemes (which is not random) is correlated with
characteristics that make some places more prone to crime surges or more generally to
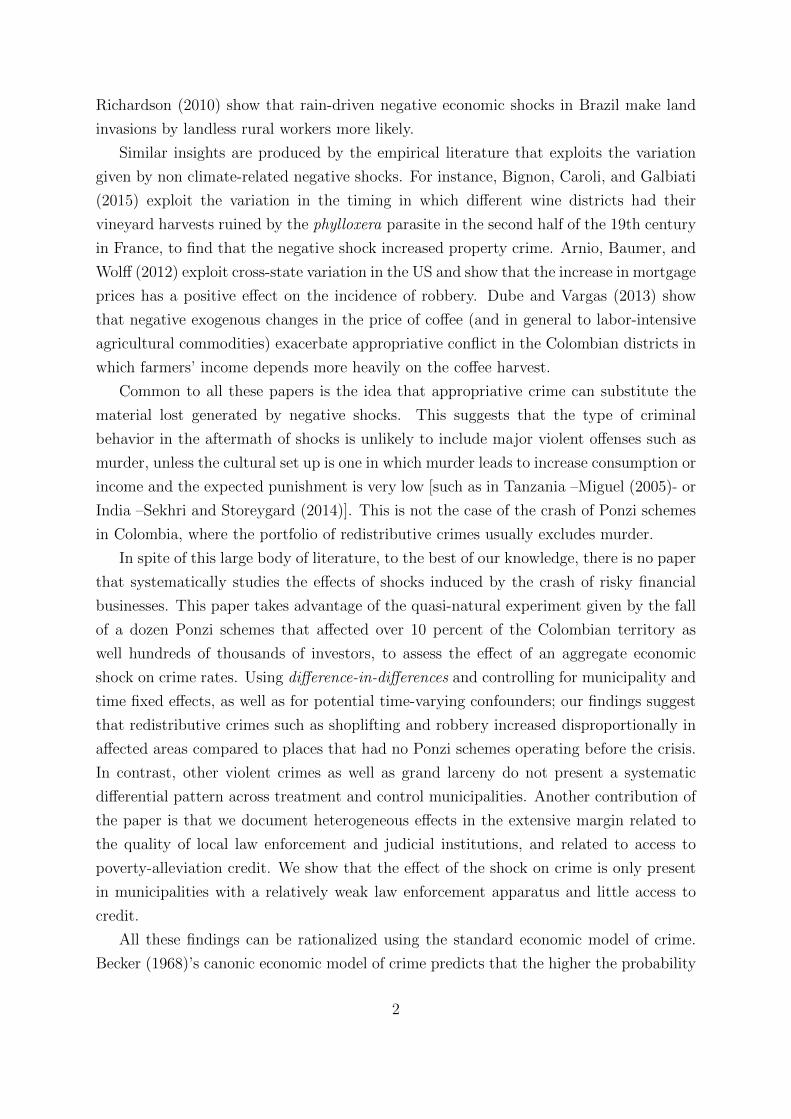
differential crime changes over time. Figure 2 allows for visual inspection of this parallel
trends assumption. While not every outcome displays pre-treatment co-movement over
time (notably the murder rate and the rate of terrorism-related crimes), most do seem to
meet this criterion in spite of the differences in levels.
3.1 Data
Our database merges monthly data on the municipal incidence of the different types of
crimes with information on the location and crashing date of each one of the 12 Ponzi
schemes that operated in Colombia since the mid 2000s. The Ponzi dataset was built
from primary sources specifically for this project. We gathered Ponzi-related stories
from national and regional papers and publicly available judicial sentences on Ponzi
investigations, and coded what municipalities hosted which of the firms that later on
were revealed as effectively being facade Ponzi schemes. We identify 12 different Ponzi-
like firms with presence in 110 municipalities. Even if this represents only about 10%
of Colombian smallest administrative districts, the treated areas account for 55% of the
country’s population and 80% of the country’s total tax revenue. This suggests that the
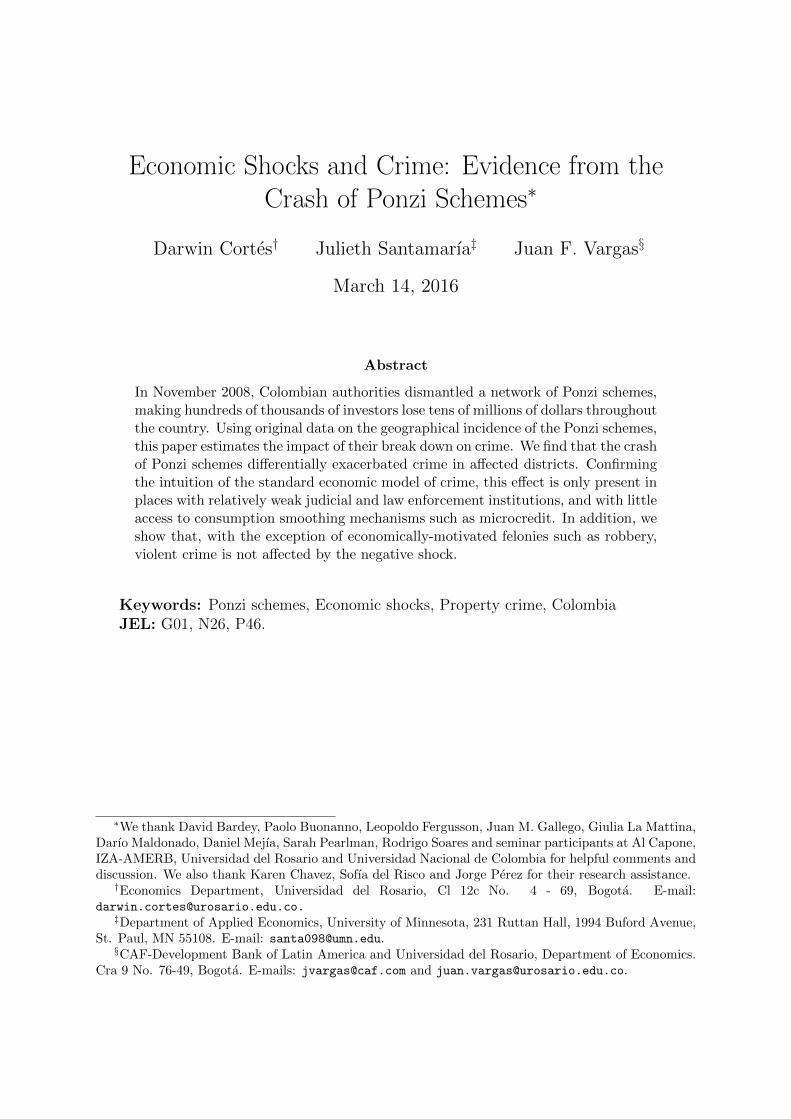
magnitude of the shock we study in this paper is economically large.9 As illustrated
by Figure 1, most such municipalities are located in Southwestern Colombia.10 We also
identify the exact date in which each scheme was intervened by the authorities and
8These include the municipal population density to account for the differential potential return tocriminal activities (Glaeser and Sacerdote, 1999), a spatial lag of the outcome that accounts for potentialgeographical spillovers of crime from i’s neighboring municipalities, and the per capita total tax revenueto account for the economic performance of the municipality (in the absence of GDP or unemploymentfigures at the municipal level in Colombia).
9For comparability purposes, throughout our analysis we exclude the four largest cities in the country,each with over one million inhabitants. Our results are however robust to including them.
10The department of Putumayo in the border with Ecuador is a special case in which there was atleast one scheme in almost every municipality.
6
effectively crashed down.11 Table 1 summarizes these data.
The crime data comes from the Colombian National Police and includes all cate-
gories typified by the Colombian Criminal Code, distinguishing between property crime
(shoplifting, burglary and vehicle theft) and violent crime (murder, robbery, injuries and
terrorism). Crime rates are constructed by normalizing the monthly crime counts by
100 thousand people, using the municipal population figures produced by DANE, the
Colombian Statistical Bureau (see Panel A of Table 2).
Time-varying controls include the municipal population density, the total per capita
tax revenue and a spatial lag of the outcome. Controlling for population density is impor-
tant as it is well documented that the incidence of crime is higher in densely populated
areas than in sparsely populated areas (Glaeser and Sacerdote, 1999). Several reasons
may explain this fact: in a dense area the pool of potential victims is larger, criminal
networks are more developed and criminal activities may experience economies of scale
due, for example, to lower search costs. Hence we expect larger population density to
be associated with higher crime rates. The aggregate tax revenue includes the munici-
pal sales tax revenue as well as other taxes such as the property tax. In the absence
of municipal-level GDP and unemployment figures, tax revenues proxy for the overall
economic activity of each municipality. Finally, the spatial lag takes into account the
potential criminal spillovers from neighboring municipalities (Panel B).
Additional variables are used to divide the sample in order to study heterogeneous
effects on two key dimensions: the strength of policing and law enforcement, and access
to credit (Panel C). These variables, which will described in section 4.1 are all measured
before the treatment took place.
Table 2 reports the summary statistics of all the variables used in the analysis. Places
that hosted Ponzi schemes are significantly different from places that did not in all ob-
servable characteristics.12 These level differences are not a threat for identification. In
our identification strategy, the double difference takes into account any difference in the
level of variables between treated and control units, as well as any time trend in the
outcome (as long as it is the same across treatment and control).
11Our analysis covers the period June 2007-December 2009 since not all 12 schemes were establishedbefore mid 2007.
12Treated municipalities have a higher incidence of both property and violent crime, are more denselypopulated, levy more taxes and have less law enforcement, security and financial institutions.
7
4 Results
Our baseline results are reported in Table 3. Panels A and B look at the effect of the
crash of Ponzi schemes on property crime and violent crime outcomes respectively. All
specifications control for population density, per capita tax revenues and a spatial lag
of the outcome, as well as for month and municipality fixed effects. Within the set of
property crimes collected by the National Police (Panel A) only shoplifting increases
disproportionally in municipalities that hosted Ponzi schemes after their crash relative
to the change observed in municipalities with no Ponzi schemes. The magnitude of the
effect is large, with a 17% surge relative to its pre-crash level.
The results are, however, not statistically significant for other type of property crimes.
The reason for this heterogeneity has to do with the differential expected punishment of
committing a crime, as measured by the time in prison that a felon will face. According
to the Colombian criminal code (art. 239) the illegal appropriation of someone else’s
property entails between 32 an 108 months of prison. If the value of the good stolen does
not exceed 10 monthly minimum wages (approximately US$ 2,000 in 2016) the felon will
be sentenced to a prison time of between 16 and 36 months.13 Shoplifting belongs to this
category and hence the expected punishment for a (captured) thief can range between
no prison to a nominal sentence of maximum 9 years (though actual prison time rarely
exceed 50% of the sentence). Aggravated theft, on the other hand, is defined by the
criminal code as a theft that, in addition to property, violates a “judicial good” (such
as a house or car). Burglary and vehicle theft are included in this second category, for
which sentences can range from 8 to 16 years of prison (art. 240).14
This suggest that, for a fixed probability of apprehension, the expected cost of engag-
ing in petty appropriative activities (such as shoplifting) is much lower that the expected
cost of engaging in aggravated larceny (such as burglary). Thus the behavioral reaction
to the negative shock experienced with the crash of Ponzi schemes is for some people to
try to counteract the loss with petty appropriative crime only.
As for violent crime (Panel B of Table 3), only robbery reacts disproportionally to
the crash in Ponzi schemes relatively to the trajectory of control municipalities. The
magnitude is relatively large: robbery increases 11% from its pre-crash level. This is
not surprising, as robbery is probably the only category of violent crime that is mainly
economically motivated.15 The murder rate in Colombia is among the highest of the
13In addition, actual prison time can decrease substantially and, for sentences of less that 3 years, itcan be waived altogether, depending on contextual factors such as the past behavior of the felon.
14In this case, although the actual time served can be reduced, imprisonment cannot be waived.15Robbery is a violent crime as the act of stealing values from a person entails the use, or at least the
threat, of violence.
8
world, but its dynamics respond to factors other than the behavior of individuals trying
to counteract a negative shock.16 Thus, the fact that there is no impact on these type
of violent crimes is a validation that the criminal surge after the crash on Ponzi schemes
is economically motivated. In addition, robbery is classified by the Colombian criminal
code as a form of theft, and hence as explained above actual punishments can vary from
no prison to just a couple of years.17
Bertrand, Duflo, and Mullainathan (2004) suggest that inference in difference-in-
differences models needs to take into account the serial correlation of the error term. We
deal with this concern by clustering the standard error at the municipality level in every
specification. Another solution that the authors prove effective to minimize this concern
is collapsing the time series information into a ‘pre’ and a ‘post’ periods and computing
the difference-in-differences estimate on the collapsed sample. In this case, the dependent
variable, Crimei,t is computed as the average crime rate over the entire sample periods
before and after the Ponzi crisis. Our results are robust to this practice and the estimated
coefficients on shoplifting and robbery are remarkably similar to those obtained using the
monthly data with the municipal clustering.18
The baseline results can be explained with the canonical model of crime (Becker,
1968). Negative economic shocks increase the incentive to engage in criminal behavior in
order to appropriate the property of others as a way to offset one’s losses. In turn, this
is more likely to occur for crimes that entail a lower expected punishment.
4.1 Heterogenous effects
The baseline results report the average effect of the crash of Ponzi schemes on crime
in Colombia. However, there are theoretical reasons to think that criminal surges in
response to negative financial shocks are larger in (or driven by) certain type of districts.
Indeed, the probability of being caught committing a crime and that of being sent to
jail is not constant across towns in Colombia, and the variation in the quality of law
enforcement may differentially deter criminal behavior after the Ponzi crash. Likewise,
appropriative criminal responses to negative shocks are more likely to occur in the absence
of insurance or consumption smoothing mechanisms such as credit. In this subsection we
explore heterogeneous effects of the crash of Ponzi schemes across these two dimensions:
16This contrasts with the cases of rural Tanzania and India, for which, according respectively toMiguel (2005) and Sekhri and Storeygard (2014), in specific circumstances murder can a strategy tooffset negative economic shocks.
17The only exception is when the person robbed is hurt, in which case the crime becomes aggravated,with much harder sentences.
18Results not shown but available upon request. The interaction coefficient for shoplifting is 0.33 andthat for robbery is 0.72.
9

law enforcement and access to credit.
In mid December of 2008, right after the FOB had intervened and shut down the facade
Ponzi firms, President Alvaro Uribe ordered Banca de Oportunidades, the government
entity in charge of promoting the access to financial services to poor households, to
speed up credit allocation and ease up eligibility in the municipalities where the bank
was present and were affected by the burst of the Ponzi schemes, “so that Colombians
affected by the ‘pyramids’ could start receiving government help (...) and start having a
relief through microcredits”.19
Following the relatively good experience of countries such as Bangladesh and Brasil,
microcredit was conceived in Colombia to help poor households with no access to tradi-
tional credit providers because of the lack of collateral (Banco de la Republica, 2010).
Poor households who had invested in Ponzi schemes had limited access to the regular fi-
nancial system, especially because, in some cases, they enthusiastically sold or mortgage
their home in order to invest in the schemes (see section 2). The access to microcredit of
the affected households was further boosted by the public outcry of the President after
the collapse of Ponzi schemes. But Banca de Oportunidades, who worked directly or
through local NGOs, was not present or had the same reach in all affected municipalities.
In this sense, the pre-shock differential access to microcredit may result in variation in
terms of the capacity of Ponzi victims to (at least partially) offset the negative economic
shock, and hence may result in variation in the criminal response to the crash.20 This
idea is consistent with recent research on the relationship between banking and crime.
For instance, for the case of the US, Garmaise and Moskowitz (2006) show that loan
interest rates increases due to bank mergers make more people credit rationed which in
turn increases crime. Moreover, Morse (2011) finds that the existence of payday lenders
in California offsets the increase in larceny after negative economic shocks in the form of
natural disasters.
We thus study the heterogenous effects of the crash of Ponzi schemes across munici-
palities that differ in terms of the pre-treatment access to microcredits. To that end we
divide municipalities between those above and those below the mean per capita number
of (2007) microcredits. Our hypothesis is that, everything else equal, municipalities in
19Quoted by the newspaper Portafolio: “Presidente Uribe ordena jor-nadas masivas de microcredito en zonas afectadas por ‘piramides’” (Decem-ber 13, 2008). Available at: http://www.portafolio.co/economia/finanzas/
presidente-uribe-ordena-jornadas-masivas-microcredito-zonas-afectadas-piramides-229794
(last accessed Feb. 20, 2016).20As mentioned in section 2, the financial collapse affected individuals across the board of the income
distribution. In this sense, it is the access to any type of credit and not only microcredit what canexplain the variation in the intensity of the criminal response to the economic downturn. However, asshown by Blanco, Houser, and Vargas (2016) the poor are those who are more likely to react to negativeshocks by stealing the property of others.
10
the bottom half are more vulnerable to have the negative economic shock translate into
crime.
We also study heterogenous impacts according to the differential access to law en-
forcement across districts. As discussed, well functioning judicial and law enforcement
institutions deter crime as they increase the probability of being captured and sentenced.
There is indeed a large body of literature, both in economics and criminology, that finds a
positive association between the presence of police forces and the probability that felons
are arrested. We then study whether our results differ according to two key municipal
characteristics, namely the pre-treatment per capita number of police station and the
efficiency of the local judicial system.21 For the latter measure we relay on a quality-
adjusted judicial efficiency index proposed by Fergusson, Vargas, and Vela (2013). The
index is computed as follows:
Efficiency Indexm =Cases Closedm
Total Casesm× Total Resolved Cases -Total Unresolved Casesm
Cases Closedm
=Total Resolved Cases -Total Unresolved Casesm
Total Casesm.
where the first ratio of the top line measures the share of cases entering the judicial
criminal law system that are resolved (efficiency), and the second measures the difference
between resolved and unresolved cases, normalized by total closed cases (quality). The
second term accounts for the fact that cases are often closed without resolution, meaning
that either no one is found guilty, or the investigation term expires making the judge
close a case that is left impune.
As with access to microcredit, we divide municipalities according to the mean of the
variables of police stations and judicial efficiency, and look at the differential response of
shoplifting and robbery to the crash of Ponzi schemes in places with a relatively high/low
probability to capture criminals, as well as in places with a relatively high/low probability
that the local judiciary is able to send them to jail. According to the traditional model
of crime these probabilities should shape the behavior of potential criminals who weight
the benefits of engaging in criminal ventures vis-a-vis the expected costs of doing so.
Results are reported in Table 4. Controlling for municipality and month fixed ef-
fects, as well as for time-varying municipal characteristics, both shoplifting and robbery
increase differentially after the financial shock only in places with relatively little access
to consumption-smoothing microcredit, which was the President’s proposed solution to
21Police forces in Colombia are run with budgetary and operational autonomy at the department level(departments in Colombia are the equivalent to states in the US). Municipal-level head counts of policeforces are thus unavailable but the per capita number of police stations is a good proxy of policing.
11

ease the economic burden of Ponzi investors after the collapse of the schemes. In fact,
if anything robbery seems to have differentially decreased in places with relatively high
access to microcredit. The pattern is equivalent in the case of our two law enforcement
measures: both felonies increase differentially after the shock in places with relatively
low judicial efficiency and relatively low deployment of police stations, but do not change
significantly in places with high law enforcement as measured by either proxy.
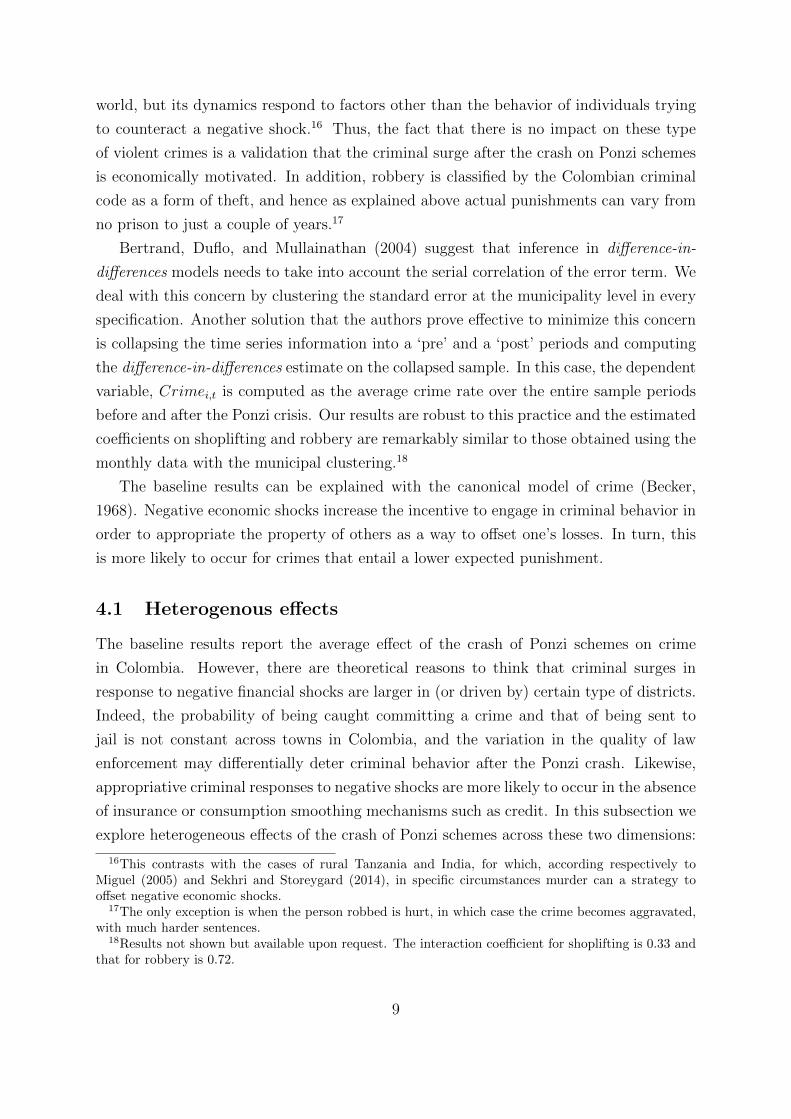
4.2 Duration of crime surges
Recall that the crash of Ponzi schemes in Colombia took place at the end of 2008, and that
our period of analysis spans until December 2009. Thus, the results presented in Tables
3 and 4 summarize the average criminal reaction over a full year-long period. However,
the collapse of the illegal financial schemes is arguably a transitory shock. While there
was heterogeneity in the size of the investments lost by the Ponzi investors, ranging from
a few hundred dollars to life-time savings, the shock did not, in principle, affect people’s
employment or their productivity. Hence, one should expect the impact of the crash
on Ponzi schemes on crime to be only temporary. We can validate this conjecture by
estimating the following variation to our baseline specification:
Crimei,t = σi + γt +4∑
j=1
θj(Ponzii × 2009Qj) + δXi,t + ξi,t (2)
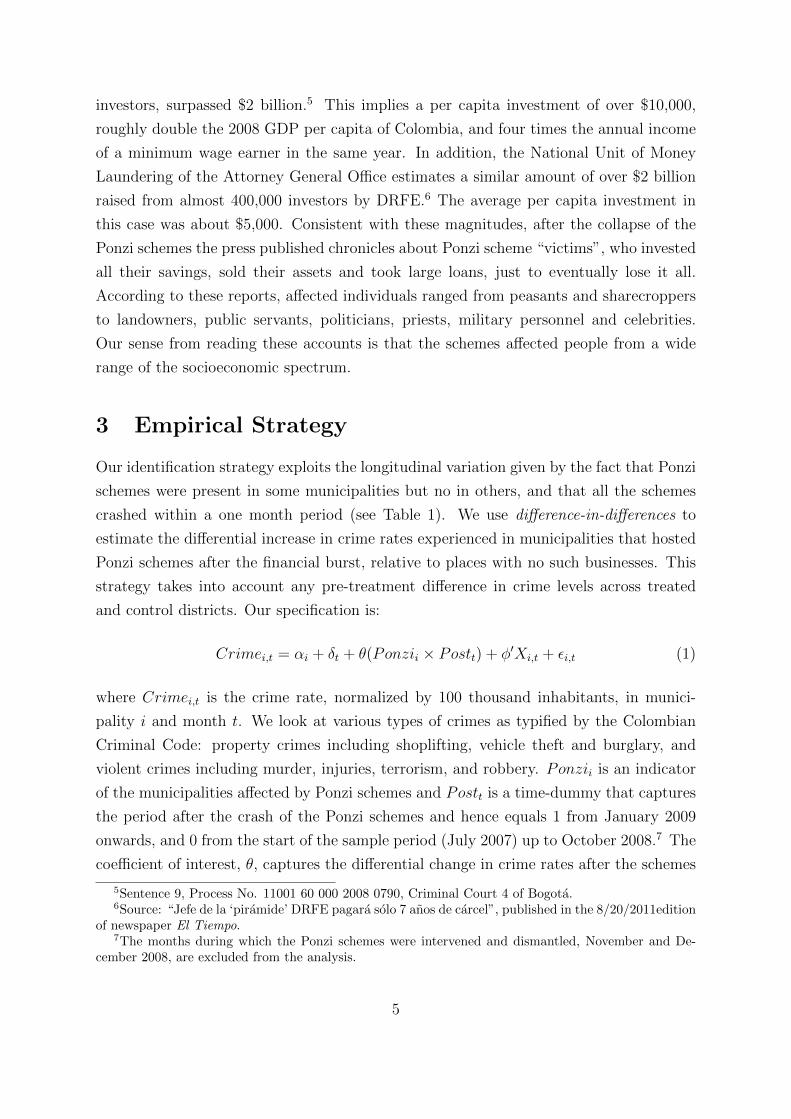
where we look at the differential incidence of crime in each of the four quarters of 2009.
Results are summarized graphically in Figure 3 and suggest that crime surges in both
shoplifting and robbery only last one quarter. This implies that the year-long average
impacts reported on Tables 3 and 4 underestimate the size of the effect of the crash of
Ponzi schemes on crime. Take for example the case of robbery. According to Figure 3,
the differential increase in the rate of robbery in the first quarter of 2009 is 1.9 cases
of robbery per 100 thousand inhabitants. This is equivalent to an increase of almost
30% relative to its pre-treatments levels, instead of the 11% increase reported for the
entire year when interpreting Table 3. The increase on subsequent quarters is both much
smaller in magnitude and not statistically significant (0.2 and 0.05 additional robberies
per 100 thousand inhabitants in the second and third quarters respectively).
5 Conclusion
This paper exploits the crash down of Ponzi schemes in 2008 in Colombia as a natural
experiment to estimate the causal effect of a financial-crisis driven economic shock on
12

subnational criminal outcomes. The collapse of the schemes affected hundreds of thou-
sands of investors who lost millions of dollars, making the episode under study one of the
largest Ponzi crises of recen history.
Our estimates control for any municipal-level time-invariant heterogeneity and for
aggregate temporal shocks, as well as for key time-varying observable municipal charac-
teristics. We show that cash grabbing crimes such as shoplifting and robbery increase
disproportionally after the shock in affected municipalities. We show that major property
crimes such as burglary or car theft, for which the expected punishment is harsh, are not
affected by the Ponzi crises. Likewise, we show that violent crimes that do not entail to
the perpetrator any material compensation to their losses (and that also generate rough
punishments) do not respond differentially in affected municipalities.
Moreover, we show that our results are driven by places with a relatively weak law
enforcement –in the form of both little policing and an ineffective judiciary dealing with
criminal cases- as well as by places with little access to credit instruments that could
help affected individual offset the drop in consumption that followed the crash of Ponzi
schemes. In this sense, our paper shows that economic incentives can be intensified or
else counterbalanced by the local institutional context.
Our results can be explained by the traditional economic model of crime (Becker,
1968) in which potential criminals outweigh the costs and benefits of criminal ventures
to decide whether or not to engage such behavior.
Our findings suggest some policy avenues that can help offset the negative conse-
quences of unexpected economic shocks. The importance of reducing credit barriers and
extending financial access has been largely emphasized in the development literature.
We provide another reason why policy efforts should target the reduction of credit con-
straints, namely that the lack of credit and insurance mechanisms push individuals who
face negative shocks to practices that are often times illegal or dangerous. In addition
strengthening the judicial apparatus at the local level is key to raise the cost to individu-
als who plan to resort to criminal enterprises. Finally this paper points to one particular
unexpected negative consequence of the state intervention of illegal financial businesses
in developing countries.
One interesting avenue for future research is to explore to what extent the criminal
surges that followed the crash down of Ponzi schemes in Colombia crowed out the judicial
system that faced excess criminal activity and this resulted in longer term increases in
other types of crimes as as results to the judicial congestion.
13
References
Arnio, A., E. Baumer, and K. Wolff (2012): “The contemporary foreclosure crisis and
US crime rates,” Social Science Research, 41(6), 1598 – 1614.
Banco de la Republica (2010): “Situacion Actual del Microcredito en Colombia: Carac-
terısticas y Experencias,” .
Becker, G. (1968): “Crime and Punishment: An Economic Approach,” Journal of Political
Economy, 76, 169–217.
Beegle, K., and J. D. Weerdt (2006): “Poverty and Wealth Dynamics in Tanzania: Evi-
dence from a Tracking Survey,” World Bank.
Bertrand, M., E. Duflo, and S. Mullainathan (2004): “How Much Should We Trust
Differences-in-Differences Estimates?,” The Quarterly Journal of Economics, MIT Press,
119(1).
Bignon, V., E. Caroli, and R. Galbiati (2015): “Stealing to Survive: Crime in XIXth
Century France,” Economic Journal, Forthcoming.
Blanco, M., D. Houser, and J. F. Vargas (2016): “On the Origins of Stealing,”
Manuscript.
Dercon, S. (1998): “Wealth, risk and activity choice: cattle in Western Tanzania,” Journal
of Development Economics, 55(1), 1–42.
Drew, J. M., and M. E. Drew (2010): “The Identification of Ponzi Schemes: Can a Picture
Tell a Thousand Frauds?,” Discussion Papers in Finance 1, Griffith University, Department
of Accounting, Finance and Economics.
Dube, O., and J. Vargas (2013): “Commodity Price Shocks and Civil Conflict: Evidence
from Colombia,” Review of Economic Studies.
Ehrlich, I. (1973): “Participation in illegitimate activities: A theoretical and empirical inves-
tigation,” Journal of Political Economy, 81(3), 521–65.
Fergusson, L., J. Vargas, and M. Vela (2013): “Sunlight Disinfects? Free Media in Weak
Democracies,” Universidad del Rosario, Documento de Trabajo, (132).
Flavin, M. A. (1981): “The Adjustment of Consumption to Changing Expectations about
Future Income,” Journal of Political Economy, 89(5), 974–1009.
Garber, P. (1990): “Famous first bubbles,” Journal of Economic Perspectives, 4, 35/54.
14
Garmaise, M., and T. J. Moskowitz (2006): “Bank Mergers and Crime: The Real and
Social Effects of Credit Market Competition,” The Journal of Finance, 61(2), 495–538.
Glaeser, E., and B. Sacerdote (1999): ““Why Is There More Crime in Cities?”,” Journal
of Political Economy, University of Chicago Press, 107(S6), S225–S258.
Gregoriou, G., and F. L’habitant (2009): “Madoff: A flock of red flags,” Journal of Wealth
Management, 12(1), 89–97.
Guarcello, L., F. Mealli, and F. Rosati (2010): “Household vulnerability and child labor:
the effect of shocks, credit rationing, and insurance,” Journal of Population Economics, 23(1),
169–198.
Hidalgo, D., S. Naidu, S. Nichter, and N. Richardson (2010): “Occupational Choices:
Economic Determinents of Land Invasions,” Review of Economics and Statistics.
Jarvis, C. (1999): “The Rise and Fall of the Pyramid Schemes in Albania,” IMF Working
Paper 99/98 (International Monetary Fund: Washington).
Larson, D. F., and F. Plessmann (2009): “Do farmers choose to be inefficient? Evidence
from Bicol,” Journal of Development Economics, 90(1), 24–32.
MacKay, C. (1841): Extraordinary Popular Delusions and the Madness of Crowds. Farrar,
Straus and Giroux.
Mehlum, H., E. Miguel, and R. Torvik (2006): “Poverty and crime in 19th century
Germany,” Journal of Urban Economics, 59, 370–388.
Miguel, E. (2005): “Poverty and Witch Killing,” Review of Economic Studies, 72, 1153–1172.
Morse, A. (2011): “Payday lenders: Heroes or villains?,” Journal of Financial Economics,
102(1), 28 – 44.
Rosenzweig, M. R., and K. I. Wolpin (1993): “Credit Market Constraints, Consumption
Smoothing, and the Accumulation of Durable Production Assets in Low-Income Countries:
Investments in Bullocks in India,” Journal of Political Economy, 101(2), 223–244.
Sekhri, S., and A. Storeygard (2014): “Dowry deaths: Response to weather variability in
India,” Journal of Development Economics, 111(C), 212–223.
Zeldes, S. P. (1989): “Optimal Consumption with Stochastic Income: Deviations from Cer-
tainty Equivalence,” The Quarterly Journal of Economics, 104(2), 275–98.
Zuckoff, M. (2005): Ponzi’s Scheme: The True Story of a Financial Legend. Random House
Digital, Inc.
15
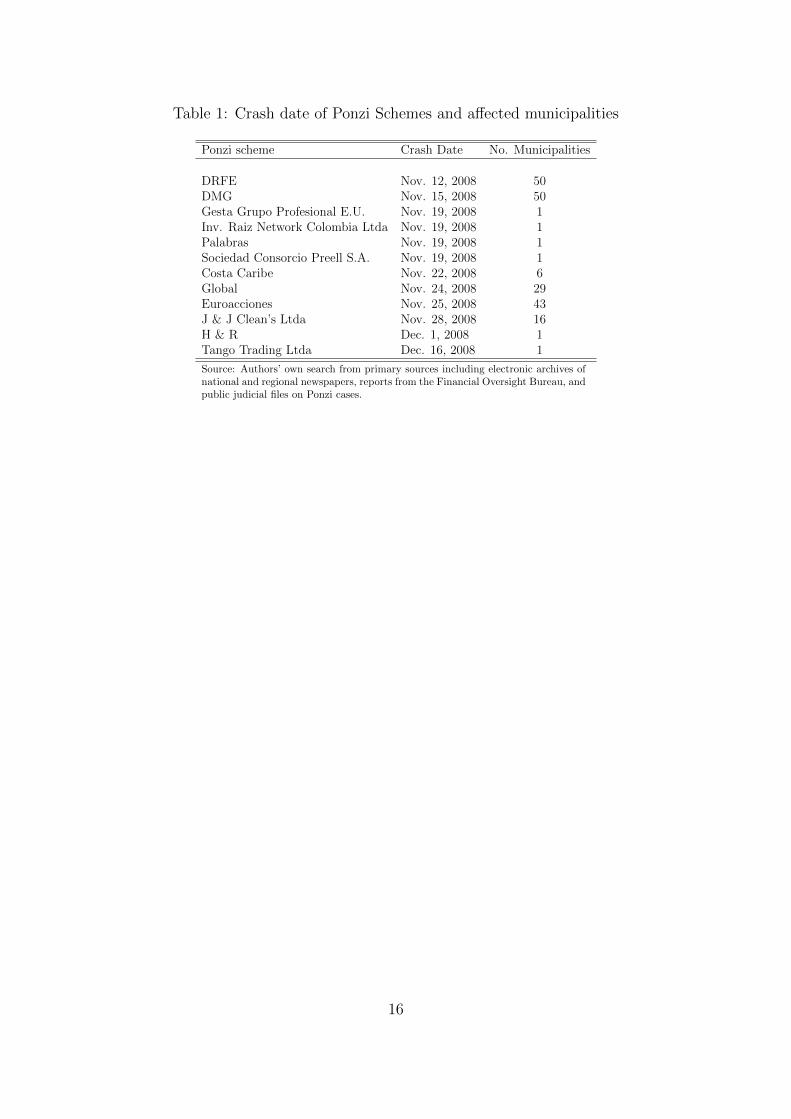
Table 1: Crash date of Ponzi Schemes and affected municipalities
Ponzi scheme Crash Date No. Municipalities
DRFE Nov. 12, 2008 50DMG Nov. 15, 2008 50Gesta Grupo Profesional E.U. Nov. 19, 2008 1Inv. Raiz Network Colombia Ltda Nov. 19, 2008 1Palabras Nov. 19, 2008 1Sociedad Consorcio Preell S.A. Nov. 19, 2008 1Costa Caribe Nov. 22, 2008 6Global Nov. 24, 2008 29Euroacciones Nov. 25, 2008 43J & J Clean’s Ltda Nov. 28, 2008 16H & R Dec. 1, 2008 1Tango Trading Ltda Dec. 16, 2008 1
Source: Authors’ own search from primary sources including electronic archives ofnational and regional newspapers, reports from the Financial Oversight Bureau, andpublic judicial files on Ponzi cases.
16
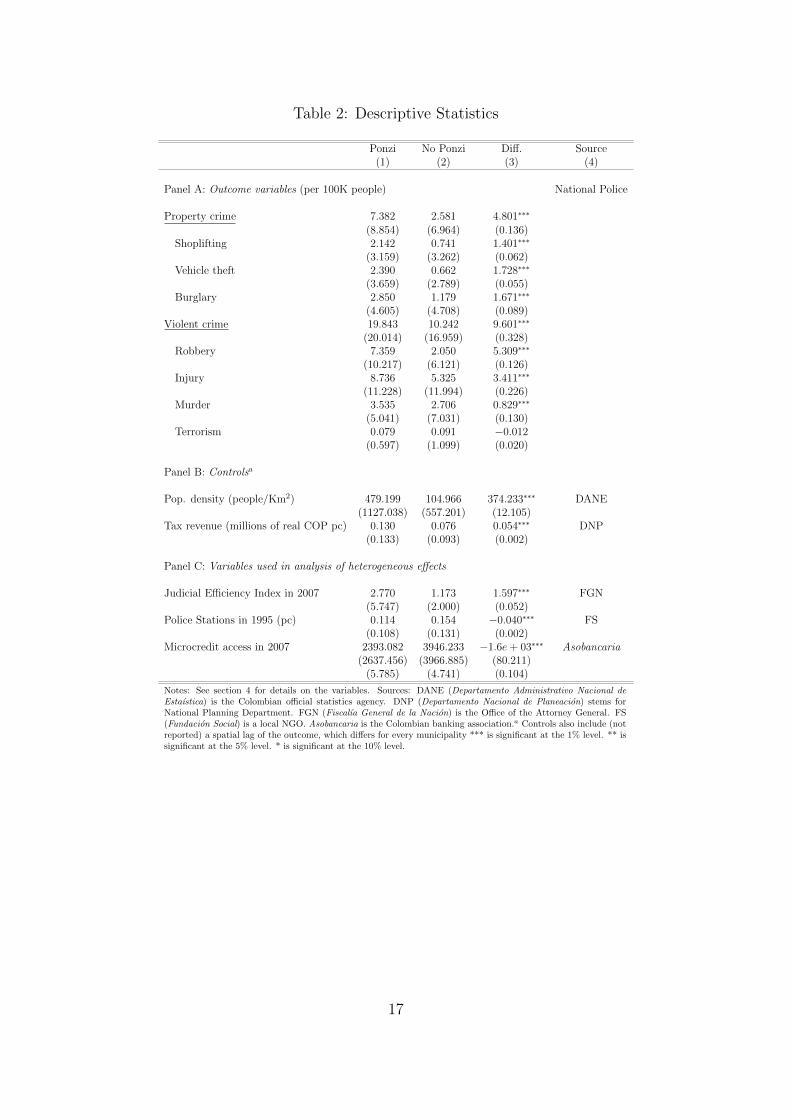
Table 2: Descriptive Statistics
Ponzi No Ponzi Diff. Source(1) (2) (3) (4)
Panel A: Outcome variables (per 100K people) National Police
Property crime 7.382 2.581 4.801∗∗∗
(8.854) (6.964) (0.136)Shoplifting 2.142 0.741 1.401∗∗∗
(3.159) (3.262) (0.062)Vehicle theft 2.390 0.662 1.728∗∗∗
(3.659) (2.789) (0.055)Burglary 2.850 1.179 1.671∗∗∗
(4.605) (4.708) (0.089)Violent crime 19.843 10.242 9.601∗∗∗
(20.014) (16.959) (0.328)Robbery 7.359 2.050 5.309∗∗∗
(10.217) (6.121) (0.126)Injury 8.736 5.325 3.411∗∗∗
(11.228) (11.994) (0.226)Murder 3.535 2.706 0.829∗∗∗
(5.041) (7.031) (0.130)Terrorism 0.079 0.091 −0.012
(0.597) (1.099) (0.020)
Panel B: Controlsa
Pop. density (people/Km2) 479.199 104.966 374.233∗∗∗ DANE(1127.038) (557.201) (12.105)
Tax revenue (millions of real COP pc) 0.130 0.076 0.054∗∗∗ DNP(0.133) (0.093) (0.002)
Panel C: Variables used in analysis of heterogeneous effects
Judicial Efficiency Index in 2007 2.770 1.173 1.597∗∗∗ FGN(5.747) (2.000) (0.052)
Police Stations in 1995 (pc) 0.114 0.154 −0.040∗∗∗ FS(0.108) (0.131) (0.002)
Microcredit access in 2007 2393.082 3946.233 −1.6e+ 03∗∗∗ Asobancaria(2637.456) (3966.885) (80.211)
(5.785) (4.741) (0.104)
Notes: See section 4 for details on the variables. Sources: DANE (Departamento Administrativo Nacional deEstaıstica) is the Colombian official statistics agency. DNP (Departamento Nacional de Planeacion) stems forNational Planning Department. FGN (Fiscalıa General de la Nacion) is the Office of the Attorney General. FS(Fundacion Social) is a local NGO. Asobancaria is the Colombian banking association.a Controls also include (notreported) a spatial lag of the outcome, which differs for every municipality *** is significant at the 1% level. ** issignificant at the 5% level. * is significant at the 10% level.
17
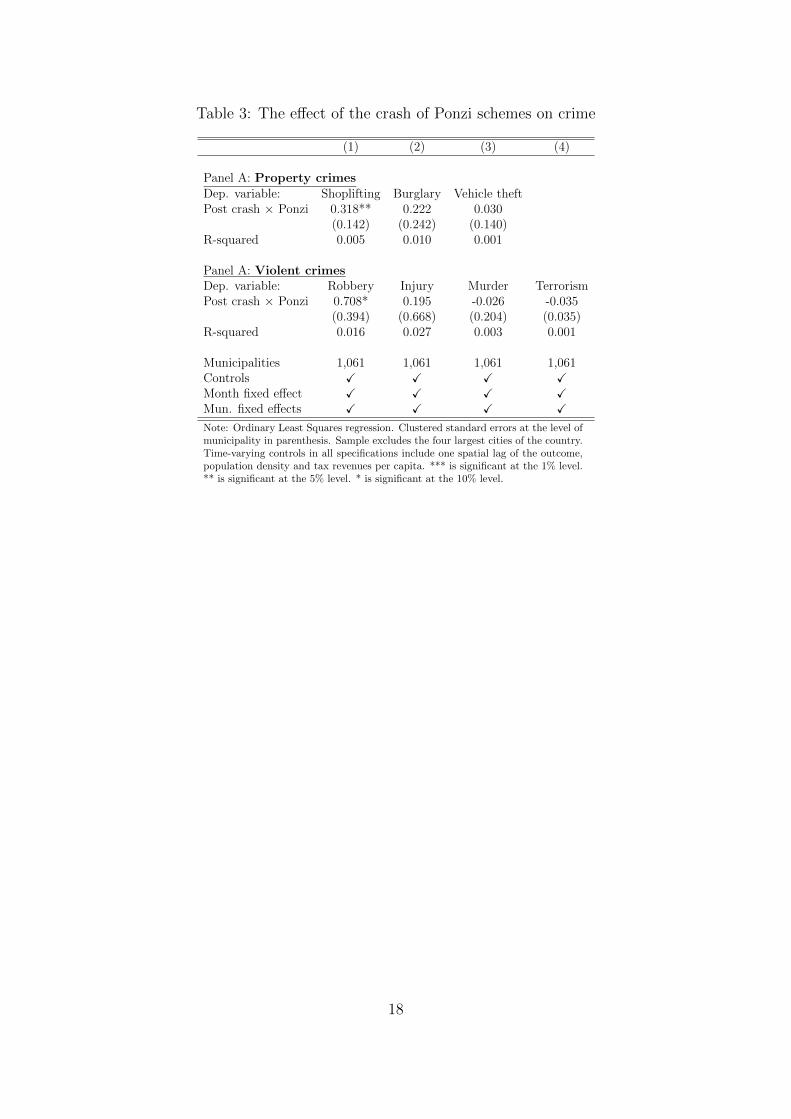
Table 3: The effect of the crash of Ponzi schemes on crime
(1) (2) (3) (4)
Panel A: Property crimesDep. variable: Shoplifting Burglary Vehicle theftPost crash × Ponzi 0.318** 0.222 0.030
(0.142) (0.242) (0.140)R-squared 0.005 0.010 0.001
Panel A: Violent crimesDep. variable: Robbery Injury Murder TerrorismPost crash × Ponzi 0.708* 0.195 -0.026 -0.035
(0.394) (0.668) (0.204) (0.035)R-squared 0.016 0.027 0.003 0.001
Municipalities 1,061 1,061 1,061 1,061Controls X X X XMonth fixed effect X X X XMun. fixed effects X X X X
Note: Ordinary Least Squares regression. Clustered standard errors at the level ofmunicipality in parenthesis. Sample excludes the four largest cities of the country.Time-varying controls in all specifications include one spatial lag of the outcome,population density and tax revenues per capita. *** is significant at the 1% level.** is significant at the 5% level. * is significant at the 10% level.
18

Table 4: Heterogeneous Effects: Microcredits and Law Enforcement
Mechanism Shoplifting Robbery(1) (2) (3) (4)Low High Low High
Access to MicrocreditsPost crash × Ponzi 0.511∗∗∗ −0.310 1.609∗∗∗ −2.514∗∗∗
(0.187) (0.219) (0.523) (0.750)
Observations 12232 7816 12232 7816Municipalities 438 280 438 280R-squared 0.015 0.006 0.041 0.021
Judicial EfficiencyPost crash × Ponzi 0.576∗∗∗ −0.057 1.472∗∗ −0.034
(0.206) (0.219) (0.597) (0.458)
Observations 21000 6664 21000 6664Municipalities 750 238 750 238R-squared 0.007 0.003 0.020 0.012
Presence of Police StationsPost crash × Ponzi 0.402∗∗ 0.077 0.914∗∗ −0.190
(0.159) (0.313) (0.463) (0.667)
Observations 18200 11508 18200 11508Municipalities 650 411 650 411R-squared 0.007 0.003 0.025 0.009
Controls X X X XMunicipality FE X X X XMonthly FE X X X X
Note: Ordinary Least Squares regression. Clustered standard errors atthe municipality level in parenthesis. Sample excludes the four largestcities of the country. Time-varying controls in all specifications includeone spatial lag of the outcome (to account for potential spillovers), andtax revenues. All columns include municipality and time fixed effects.Columns 2 and 4 run the regressions for the subsample above the meanpresence of microcredits per capita (top panel), judicial efficiency (secondpanel) and presence of police stations (bottom panel). Columns 1 and3 focus on the subsamples below the mean. *** is significant at the 1%level. ** is significant at the 5% level. * is significant at the 10% level.
19
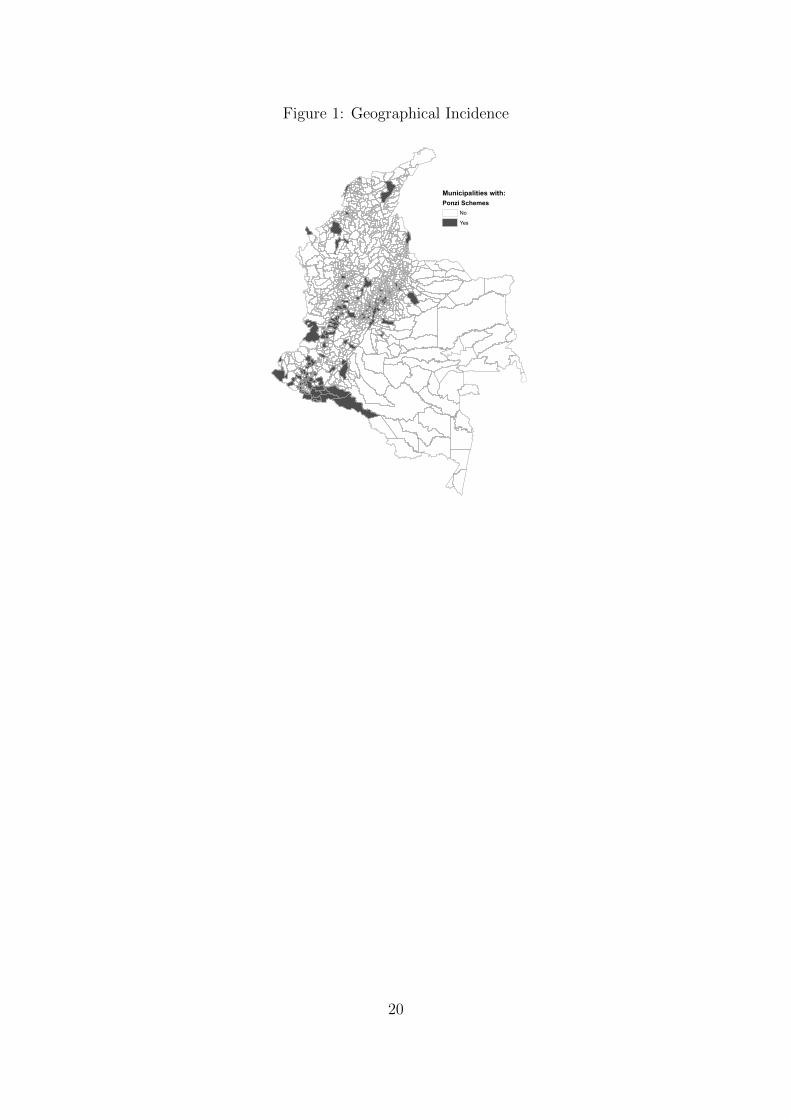
Figure 1: Geographical Incidence
Municipalities with:Ponzi Schemes
NoYes
20
Fig
ure
2:V
isual
Exam
inat
ion
ofP
aral
lel
Tre
nds
2.1.
Pro
per
tyC
rim
e2.
2.Shop
lift
ing
2.3.
Veh
icle
Thef
t2.
4.B
urg
lary
05101520 2007
m7
2008
m1
2008
m7
2009
m1
2009
m7
2010
m1
12345 2007
m7
2008
m1
2008
m7
2009
m1
2009
m7
2010
m1
02468 2007
m7
2008
m1
2008
m7
2009
m1
2009
m7
2010
m1
123456 2007
m7
2008
m1
2008
m7
2009
m1
2009
m7
2010
m1
2.5.
Vio
lent
Cri
me
2.6.
Rob
ber
y2.
7.In
juri
es2.
8.M
urd
er2.
9.T
erro
rism
1015202530 2007
m7
2008
m1
2008
m7
2009
m1
2009
m7
2010
m1
051015 2007
m7
2008
m1
2008
m7
2009
m1
2009
m7
2010
m1
051015 2007
m7
2008
m1
2008
m7
2009
m1
2009
m7
2010
m1
2.533.54 2007
m7
2008
m1
2008
m7
2009
m1
2009
m7
2010
m1
0.05.1.15.2.25 2007
m7
2008
m1
2008
m7
2009
m1
2009
m7
2010
m1
Not
e:D
ark
lin
esco
rres
pon
ds
toth
eav
erag
ecr
ime
inP
onzi
mu
nic
ipali
ties
an
dlight
lin
eto
the
aver
age
crim
ein
no
Pon
zim
un
icip
ali
ties
.
21

Figure 3: Duration of Effects in Quarters-.
50
.51
2009q1 2009q2 2009q3 2009q4Date
Shoplifting
-10
12
3
2009q1 2009q2 2009q3 2009q4Date
Robbery
Notes: Dark lines refer to the estimated difference-in-differences coefficients of equation model 2 and
dashed lines correspond to the 95% confidence interval.
22
Top Related