Languages
Pages
Legal


Developments at GFDL
Ron Stouffer
WGCM October 2011
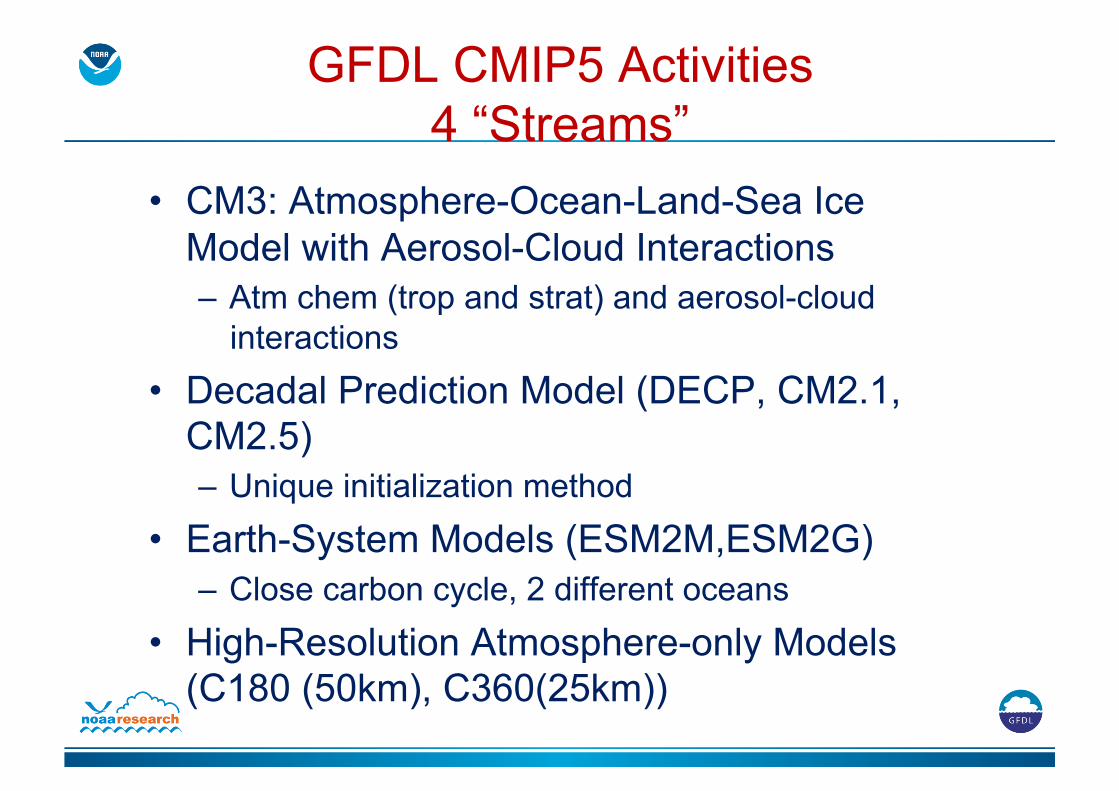
• CM3: Atmosphere-Ocean-Land-Sea Ice Model with Aerosol-Cloud Interactions – Atm chem (trop and strat) and aerosol-cloud
interactions • Decadal Prediction Model (DECP, CM2.1,
CM2.5) – Unique initialization method
• Earth-System Models (ESM2M,ESM2G) – Close carbon cycle, 2 different oceans
• High-Resolution Atmosphere-only Models (C180 (50km), C360(25km))
GFDL CMIP5 Activities 4 “Streams”

GFDL CMIP5 status (13 Oct 11)
Stream/ model
Production complete
Normal Post processing
CMOR post processing
Data on server
METAFOR questionnaire
ESM2M 12/2010 12/2010 75% 50% 9/2011 ESM2G 85% 80% 1% 0% Model done CM3 12/2010 90% 70% 5% Model done DECP 9/2011 99% 0% 0% Model done C180 Complete Complete 9/2011 50% 90% C360 Complete Complete 10/2011 0% 0%

CM3

Global SAT – CM3 vs Obs
CM3: - Relatively large climate sensitivity
- 4.3K for 2XCO2 - Large aerosol indirect effect
- Near 0 global direct effect

Decadal Prediction with Higher-Resolution Coupled Models using GFDL IPCC
AR4 Physical Parameterizations (DECP)

7 Geophysical Fluid Dynamics Laboratory 7
MODEL ATMOSPHERE OCEAN LAND Comments
CM2.1 2o lon x 2.5olat 24 levels
1o lon x 1/3-‐1o lat LM2 IPCC AR4 model
CM2.1.1 2o lon x 2.5olat 24 levels
1o lon x 1/3-‐1o lat LM2 Higher order advecOon in ocean, and low viscosity
CM2.3 1o lon x 1.25olat 24 levels
1o lon x 1/3-‐1o lat LM2 Same ocean as CM2.1, higher resoluOon atmosphere
CM2.4 1o lon x 1.25olat 24 levels
25Km in Tropics to 9 Km in polar regions Square grid.
LM2-‐LM3
Same atmosphere as CM2.3, higher resoluOon ocean
CM2.5 50 Km atmosphere, 32 levels, cubed sphere grid
Similar to CM2.4, uses z* as verOcal coord.
LM3 Uses icebergs in ocean Similar ocean to CM2.4, higher resoluOon atmosphere
CM2.6 50 Km atmosphere, 32 levels
10 Km in Tropics to 3 Km in polar regions
LM3 Same atmosphere as CM2.5, higher resoluOon ocean
Sequence of coupled models with increasing resolu6on

CM2.5: 50 Km atmosphere, 10-‐25 Km ocean
CM2.6: 50 Km atmosphere, 4-‐10 Km ocean
(a) Observa6ons
(b) CM2.1 (c) CM2.5
(d) CM2.6
Ocean Eddy KineOc Energy – Observed and Simulated
CM2.1: 200 Km atmosphere, 100 Km ocean
Delworth et al. (J. Climate, submi\ed)

Delworth et al. (J. Climate, submi\ed)

Annual precipita6on (mm/day)
Delworth et al. (J. Climate, Submi\ed)

Delworth et al. (J. Climate, submi\ed)

Earth-System Model ESM2M
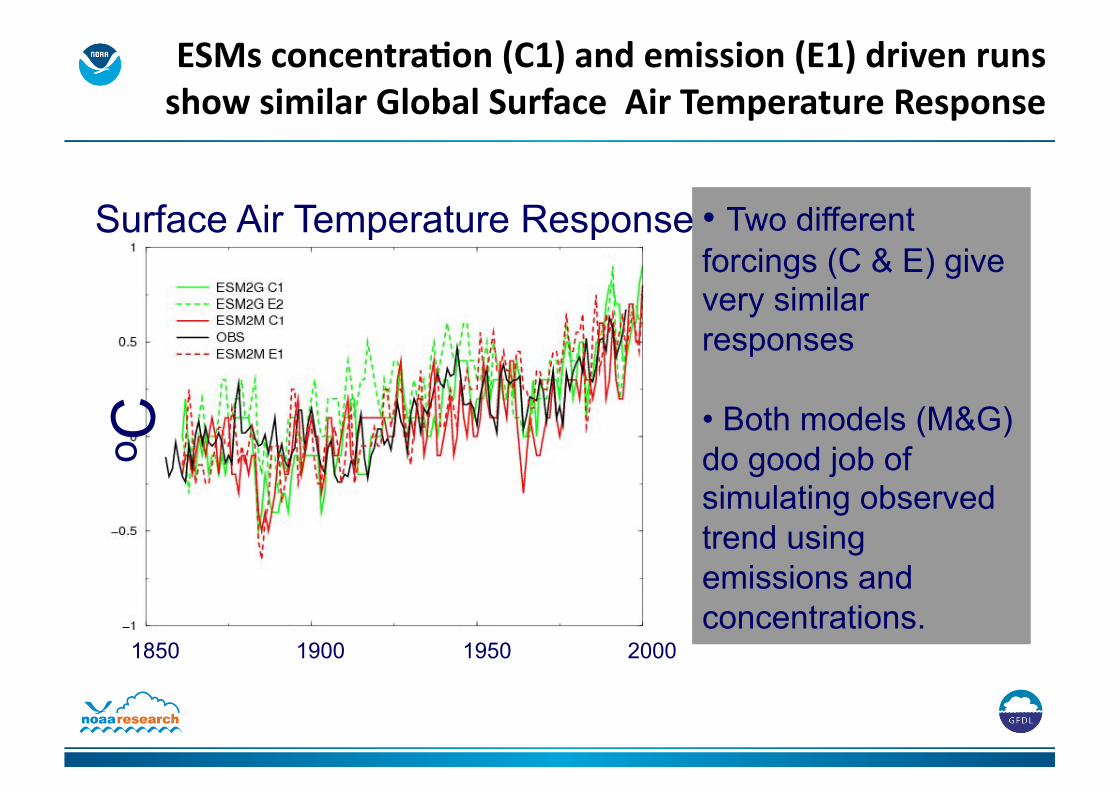
ESMs concentra6on (C1) and emission (E1) driven runs show similar Global Surface Air Temperature Response
1850 1950 2000 1900
o C
• Two different forcings (C & E) give very similar responses
• Both models (M&G) do good job of simulating observed trend using emissions and concentrations.
Surface Air Temperature Response
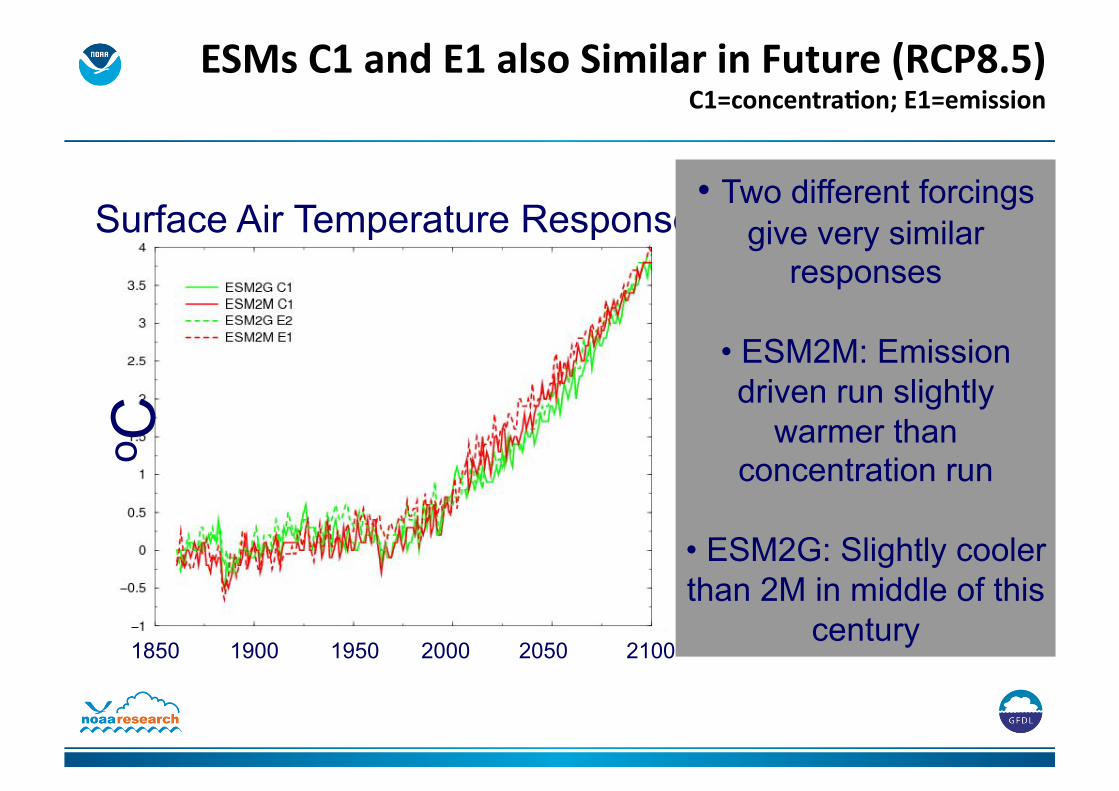
ESMs C1 and E1 also Similar in Future (RCP8.5) C1=concentra6on; E1=emission
1850 1950 2000 1900
o C
2050 2100
Surface Air Temperature Response • Two different forcings
give very similar responses
• ESM2M: Emission driven run slightly
warmer than concentration run
• ESM2G: Slightly cooler than 2M in middle of this
century

ESM emissions driven runs show similar atmospheric pCO2 response to each other and observa6ons
1850 1950 2000 1900
ppm
2050 2100
• Emission driven runs have concentrations similar to observed
• ESMs about 20ppm high in 2005 versus observations
• ESMs about 70ppm higher than RCP8.5 by 2100
Atmospheric pCO2
ESM emissions driven runs show similar atmospheric pCO2 response to each other and observa6ons

Summary
• GFDL, in support of IPCC AR5, has developed a new generation of coupled physical and earth-system models.
• Integrations for AR5 are mostly completed with results becoming available to community.
• New models have been applied to regional climate change, chemistry, and carbon cycle.


NOAA Climate Modeling and Research System (CMRS)
18

CMRS.1 260 TF FY 2010 FY 2011 FY 2012 FY 2013 FY 2014
CMRS.2 720 TF
CMRS.1 UPG 386 TF
CMRS.2 720 TF
260 TF
980 TF
1.1 PF
CMRS.1 InstallaOon
CMRS.2 InstallaOon
NegoOated OpOons for both FY2015
and FY2016
CMRS.1 OperaOonal NLT 1 Oct 2010
CMRS.2 OperaOonal NLT 1 Oct 2011
NOAA Climate Modeling and Research System (CMRS) Computing Capability Timeline at Oak Ridge National Lab
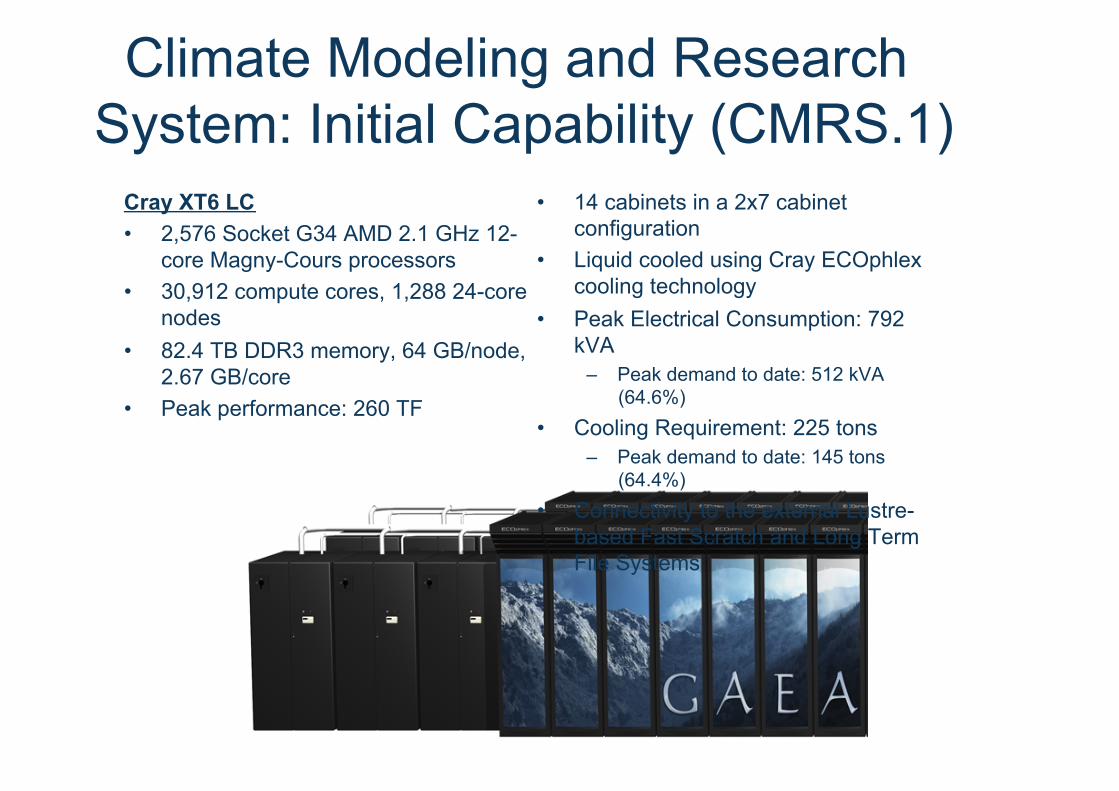
Climate Modeling and Research System: Initial Capability (CMRS.1)
Cray XT6 LC • 2,576 Socket G34 AMD 2.1 GHz 12-
core Magny-Cours processors • 30,912 compute cores, 1,288 24-core
nodes • 82.4 TB DDR3 memory, 64 GB/node,
2.67 GB/core • Peak performance: 260 TF
• 14 cabinets in a 2x7 cabinet configuration
• Liquid cooled using Cray ECOphlex cooling technology
• Peak Electrical Consumption: 792 kVA
– Peak demand to date: 512 kVA (64.6%)
• Cooling Requirement: 225 tons – Peak demand to date: 145 tons
(64.4%) • Connectivity to the external Lustre-
based Fast Scratch and Long Term File Systems

CMRS Year Two System (CMRS.2) Cray XE6 LC (Separate System Partition) • Scheduled Delivery in 2011 • 4,896 AMD Interlagos processors
– 2,448 nodes • 156.7 TB DDR3 memory, 64 GB/node • Gemini High Speed Interconnect
• Infrastructure – 26 cabinets (total of 40 compute cabinets
among CMRS.1 and CMRS.2) – Cray ECOphlex liquid cooling – Peak Electrical Consumption: 1,455 kVA – Cooling Requirement: 413 tons

CMRS.1 Upgrade Cray XE6 LC • Original Configuration
– 2,576 Socket G34 AMD 2.1 GHz 12-core Magny-Cours processors
– 30,912 compute cores, 1,288 24-core nodes
– 82.4 TB DDR3 memory, 64 GB/node, 2.67 GB/core
– Peak performance: 260 TF
• Upgraded Configuration – 2,624 AMD Interlagos processors
• 1,312 32-core nodes – 84 TB DDR3 memory, 64 GB/node – Scheduled Delivery in Q2 CY2012
After the successful introduction to operation
of the CMRS.2 Interlagos-based system, the initial
CMRS.1 system will receive an
architecturally identical upgrade

AM3/LM3: Atmosphere and Land in CM3
23
Interactive chemistry to link emissions to aerosol composition
Sub-grid vertical velocity PDFs for convective and stratiform clouds => Supersaturation at cloud scale for aerosol activation on sulfate/black
carbon, organic carbon, and sea salt
Stratospheric model for chemistry and possible links to troposphere on multi-year time scales (e.g., Southern Hemisphere Annular Mode)
More realistic land precipitation for land carbon and nitrogen models
Cubed-sphere finite-volume dy-core
Dynamic vegetation model with hydrology and land use
Parameterizations based on sub-grid PDFs of vertical velocity have been implemented in AM3
• Deep convection: Donner et al. (2001, J. Climate), Wilcox and Donner (2007, J. Climate)
• Shallow convection: Bretherton et al. (2004, Mon. Wea. Rev.) implemented by Ming Zhao
• Stratiform: modfication of Tiedtke (1993, Mon. Wea. Rev.) by Chris Golaz, to include w PDF for activation only

ESM2M concentra6on (C1) and emissions (E1) driven runs show similar atmospheric pCO2 response
1850 1950 2000 1900
ppm
2050 2100
• Emission driven run has
concentrations very similar to
observed
• ESM2M about 23ppm high in 2005 versus observations
• ESM2M about 70ppm higher
than RCP8.5 by 2100
Atmospheric pCO2 ADD ESM2G in green
CM3
• Atm chemistry and higher top (lower Mesosphere) – Focus: atm chem and aerosol-cloud
• 2 deg atm, 48 levels • New land module – LM3 • Old ocean and sea ice components
– 1 deg ocean (1/3 in tropics), 50 levels

DecP
• Uses unique initialization method – Runs multiple oceans under data atm while
ingesting ocean observations • Uses CMIP3 model – CM2.1 • 2 deg atm, 24 levels • 1 deg ocean, 50 levels (MOM4p0) • Old sea ice and land components • Much higher resolution model version
coming next spring

High Res Atm-only
• ½ and ¼ deg versions • FV cubed sphere atm dy core • LM3 with static vegetation • Minimal subgrid physics
– Convection mainly explicitly resolved • Run with different SST data sets
– Obs, CM3, ESM2M

ESM
• Two models developed using diff oceans • 2 deg atm, 24 levels – same as CM2.1 • LM3 – new hydro and veg/carbon
components • CM2.1 Sea ice with slight albedo change • Only can handle carbon emissions
– Lamarque et al. aerosol concentrations, etc
ESM Oceans
• MOM4p1 – ESM2M – 1 deg (1/3/ in tropics) 50 levels – Z* based vertical coor – Lots of changes from CM2.1 ocean
• GOLD – ESM2G – 1 deg (1/3/ in tropics) 63 layers – Isopycnal based vertical coor + bulk mixed
layer • TOPAZ – ocean bio-geochemistry
Top Related