


Languages
Pages
Legal


Electrophoresis, Standard Research Articles, Revised 1
Determination of acid dissociation constants of flavin 2
analogues by capillary zone electrophoresis 3
Yuki Tanikami,1 Takuma Tagami,1 Mayu Sakamoto,2 Yukihiro Arakawa (0000-0003-4
1000-5799),3* Hitoshi Mizuguchi (0000-0003-2396-6812),3 Yasushi Imada (0000-5
0002-4844-5418),3 and Toshio Takayanagi (0000-0002-5767-1126)3* 6
7
1 Graduate School of Advanced Technology and Science, Tokushima University, 2-1 8
Minamijyousanjima-cho, Tokushima 770-8506, Japan 9
2 Department of Chemical Science and Technology, Faculty of Engineering, 10
Tokushima University, 2-1 Minamijyousanjima-cho, Tokushima 770-8506, Japan 11
3 Graduate School of Technology, Industrial and Social Sciences, Tokushima 12
University, 2-1 Minamijyousanjima-cho, Tokushima 770-8506, Japan 13
14
*Correspondence should be addressed to the following authors:15
Toshio Takayanagi (Prof.) and Yukihiro Arakawa (Assist. Prof.) 16
Graduate School of Technology, Industrial and Social Sciences 17
Tokushima University 18
2-1 Minamijyousanjima-cho, Tokushima 770-8506, Japan19
[email protected] (T. T.); [email protected] (Y. 20
A.) 21
22
23
Keywords: Acid dissociation constant / Flavin analogues / Instable substances / 24
Capillary zone electrophoresis 25
26
Abbreviations: FL, flavin; RF, riboflavin; LC, lumichrome 27
28
This is the peer reviewed version of the following article: Tanikami, Y., Tagami, T., Sakamoto, M., Arakawa, Y., Mizuguchi, H., Imada, Y. and Takayanagi, T. (2020), Determination of acid dissociation constants of flavin analogues by capillary zone electrophoresis. ELECTROPHORESIS, 41: 1316-1325., which has been published in final form at https://doi.org/10.1002/elps.202000066. This article may be used for non-commercial purposes in accordance with Wiley Terms and Conditions for Use of Self-Archived Versions.
Abstract 29
Acid dissociation constants (pKa) of 9 kinds of flavin analogues as molecular catalyst 30
candidates were determined by CZE. Although some of the analogues are instable 31
and degradable under the light-exposure or in alkaline aqueous solutions, the effective 32
electrophoretic mobility of the flavin analogue of interest has been measured with the 33
residual substance. The pKa values of the flavin analogues were analyzed through the 34
changes in the effective electrophoretic mobility with varying pH of the separation 35
buffer. One or two steps pKa values were determined by the analysis. One of the 36
degraded species from the flavin analogues, lumichrome, was also detected in the 37
CZE analysis, and its pKa values were also determined. While coexisting impurities 38
generated over the storage conditions were found in some analogues, the pKa values 39
of the target analogues were successfully determined with the help of the CZE 40
separations. A pressure-assisted CZE was utilized for the determination or the 41
estimation of the pKa values of such analogues as possessing carboxylic acid moiety. 42
1 Introduction 43
Redox reactions are essential on organic syntheses, and molecular catalysts inducing 44
redox reactions are intensively investigated. For example, flavin analogues contain 45
heterocyclic isoalloxazine (flavin, FL) ring and they are one of the famous redox-active 46
molecular catalysts [1]. In nature, the heterocyclic isoalloxazine rings are utilized as 47
an active center of the redox enzymes, in which xenobiotic substrates are metabolized 48
through the oxidations such as dehydrogenation and monooxygenation. Thus, FL 49
analogues are expected to work as oxidative molecular catalysts without any active 50
center of metal ion [2-4]. On the activity design of the molecular catalysts, acid 51
dissociation constant (pKa) is one of the key parameters. Since pKa values and redox 52
potentials are closely related to each other, experimentally determining the pKa values 53
of the FL analogues would be highly valuable on developing their redox catalysis. 54
However, some of the FL analogues are not stable against light or alkaline base [5,6], 55
which hampers the conventional methods for the pKa determination. 56
Acid dissociation constants have classically been determined by potentiometric and 57
spectrophotometric titrations. However, the homogeneous titrations are not applicable 58
to such substances as are not pure or degradable. Spectrum shift is indispensable for 59
the pKa determination by the spectrophotometric titration. On the contrary, CZE 60
determination of acid dissociation constants is based on the changes in the effective 61
electrophoretic mobility with protonation/deprotonation reaction under varying pH [7], 62
and the CZE analysis is applicable to such substances as containing impurities or 63
degradable under the measurement conditions [8-11]. Acid dissociation constants of 64
alkaline-degradable phenolphthalein [8], labile drug compounds [9], acid-degradable 65
tetrabromophenolphthalein ethyl ester [10], and heat-degradable bupropion [11] have 66
been determined by utilizing the prominent characteristics of the CZE analysis. 67
In this study, acid dissociation constants of 9 kinds of FL analogues were determined 68
by CZE through the measurements of their effective electrophoretic mobility. Although 69
some of the FL analogues were degradable under alkaline conditions and/or light 70
exposure, the acid dissociation constants were successfully determined by CZE. Aim 71
of this study is determining the pKa values of such difficult substances, even though 72
they are conditional values. The target analogue was resolved from the degraded 73
species, and changes in the effective electrophoretic mobility of the analogue gave the 74
pKa value(s). Some analogues contained unavoidable impurities formed under the 75
storage conditions, the impurities were also resolved by CZE and the pKa value(s) of 76
the target analyte was also determined. Acid dissociation constants of the degraded 77
species, as well as those of the impurities, were determined through the mobility 78
change. 79
2 Materials and methods 80
2.1 Chemicals 81
Riboflavin and lumichrome, as well as all other reagents used for the synthesis of its 82
analogues, were purchased from commercial supplies and used without further 83
purification, besides N,3,4-trimethylaniline that was prepared according to the 84
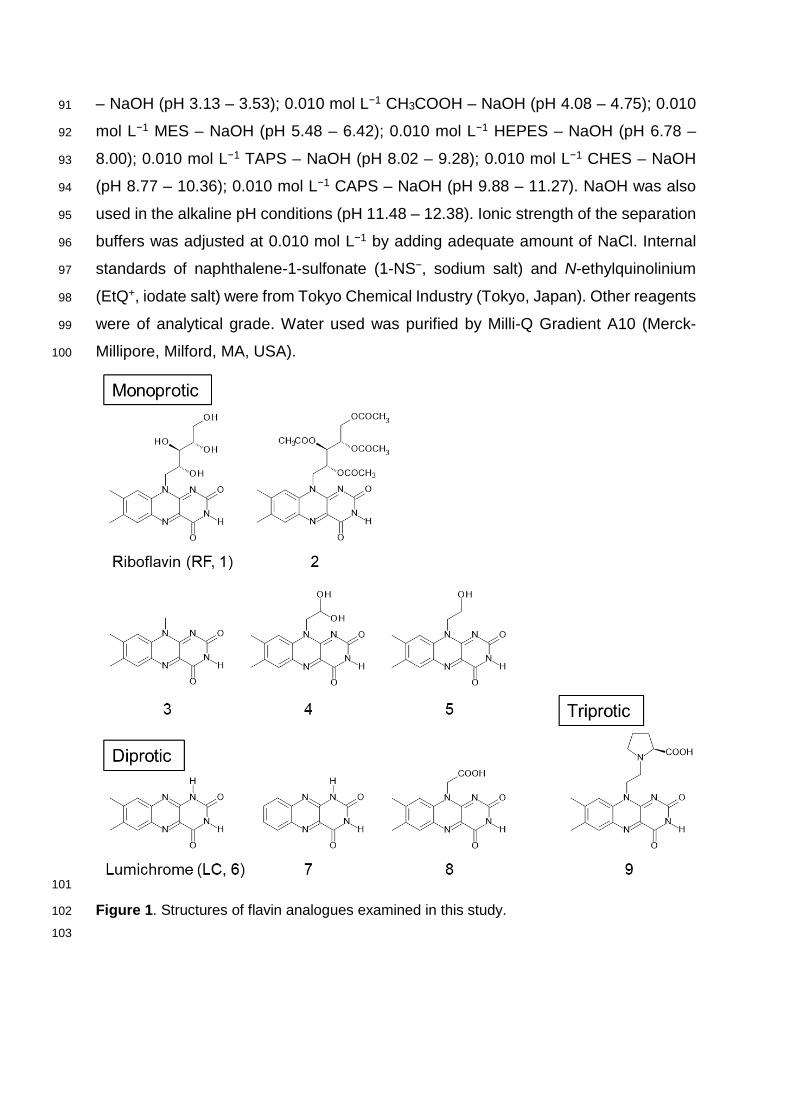
literature procedure [12]. Flavin analogues prepared and examined in this study are 85
shown in Figure 1. They are categorized as monoprotic (5 analogues), diprotic (3 86
analogues), and triprotic (1 analogue) acids. The analogues were synthesized 87
according to the literature previously reported, and the details are written in Supporting 88
Information. Separation buffers of the CZE were prepared with following buffer 89
components: 0.010 mol L−1 H3PO4 – NaOH (pH 2.38 – 3.21); 0.010 mol L−1 HCOOH 90
– NaOH (pH 3.13 – 3.53); 0.010 mol L−1 CH3COOH – NaOH (pH 4.08 – 4.75); 0.010 91
mol L−1 MES – NaOH (pH 5.48 – 6.42); 0.010 mol L−1 HEPES – NaOH (pH 6.78 – 92
8.00); 0.010 mol L−1 TAPS – NaOH (pH 8.02 – 9.28); 0.010 mol L−1 CHES – NaOH 93
(pH 8.77 – 10.36); 0.010 mol L−1 CAPS – NaOH (pH 9.88 – 11.27). NaOH was also 94
used in the alkaline pH conditions (pH 11.48 – 12.38). Ionic strength of the separation 95
buffers was adjusted at 0.010 mol L−1 by adding adequate amount of NaCl. Internal 96
standards of naphthalene-1-sulfonate (1-NS−, sodium salt) and N-ethylquinolinium 97
(EtQ+, iodate salt) were from Tokyo Chemical Industry (Tokyo, Japan). Other reagents 98
were of analytical grade. Water used was purified by Milli-Q Gradient A10 (Merck-99
Millipore, Milford, MA, USA). 100
101
Figure 1. Structures of flavin analogues examined in this study. 102
103
2.2 Apparatus 104
An Agilent Technologies (Waldbronn, Germany) 3DCE was used for the CZE 105
measurements equipped with a photodiode array detector. A fused silica capillary (GL 106
Sciences, Tokyo, Japan) was set in a cassette cartridge, and the cartridge was 107
installed in the CZE system. Dimensions of the capillary were 64.5 cm in total length, 108
56 cm in the effective length from the sample injection point to the detection point, 50 109
µm in inner diameter and 375 µm in outer diameter. A short capillary was also used in 110
the pressure-assisted CZE at the acidic pH conditions; the total length and the 111
effective length of the capillary were 48.5 cm and 40 cm, respectively. 112
A Waters (Milford, MA, USA) ACQUITY UPLC with LCT Premire XE was used as an 113
LC-MS system; a reversed phase column of BEH C18 (Waters, 50 mm × 2.1 mm i.d., 114
1.7 µm) was attached to the LC-MS system. Flow rate of the eluent was set at 1 mL 115
min−1, the MS polarity was ESI (+), and the injection volume was 20 µL. JASCO (Tokyo, 116
Japan) PU-2080 plus and UV-2075 plus were used as a conventional RP-HPLC 117
system with UV detection. An RP column of Unison UK-C18 (75 mm length × 4.6 mm 118
i.d., 3 µm particle size; Imtakt, Kyoto, Japan) was attached to the system. An eluent of 119
70/30 (v/v) water/ethanol was used. NMR spectra were recorded using JEOL (Tokyo, 120
Japan) JNM-ECZ-400S (1H, 400 MHz). Chemical shifts are reported in ppm using TMS 121
or the residual solvent peak as a reference. An HM-25G pH meter (TOA DKK, Tokyo, 122
Japan) was used for the pH measurements of the separation buffers, after being 123
calibrated daily with standard pH solutions. UV-LED light was used to expose and to 124
degrade the FL analogues by NS375LIM (Emission maximum at 375±5 nm, 1.4 W; 125
Nitride Semiconductors, Naruto, Japan). 126
127
2.3 Procedure 128
Stock solutions of FL analogues were prepared as ethanol solution at mmol L−1 level. 129
The stock solution was diluted with water, and a solution of an FL analogue was 130
prepared at the concentration of about 5×10⁻⁵ mol L−1; it was used as a sample 131
solution for the CZE measurements. Monoanionic 1-NS− or monocationic EtQ+ was 132
added in the sample solution as an internal standard of the electrophoretic mobility. 133
Ethanol at the concentration of 3 %(v/v) was also contained in the sample solution to 134
monitor the electroosmotic flow (EOF). After the separation capillary being equilibrated 135
with a separation buffer, the sample solution was introduced into the capillary from the 136
anodic end by applying a pressure of 50 mbar for 5 s. Both ends of the capillary were 137
dipped in the separation buffer vials, and a DC voltage of 25 kV was applied for the 138
CZE. During the CZE, the capillary was thermostat at 25 oC by circulating a constant-139
temperature air in the cassette cartridge. An analyte of the FL analogue and the 140
internal standard were photometrically detected at 220 nm. Effective electrophoretic 141
mobility, µeff, was calculated with the migration times of the analyte and the EOF in an 142
ordinary manner. Acid dissociation constants of FL analogues were analyzed through 143
the change in µeff, after standardized with the cationic or anionic internal standard. 144
On the measurements of the effective electrophoretic mobility at weakly acidic pH 145
conditions over 2.38 – 4.75, the velocity of electroosmotic flow was not fast enough, 146
and pressure-assisted CZE [13,14] was made. A constant pressure of 30 mbar was 147
applied to the inlet vial of the separation buffer during the electrophoresis. 148
149
2.4 Determination of acid dissociation constants of FL analogues 150
by CZE 151
Three types of the acid dissociation equilibria are included in the FL analogues of 152
monoprotic, diprotic, and triprotic acids. For monoprotic FL analogues, HA, the charge 153
changes from 0 to −1 by the one-step acid dissociation reaction of the imide moiety. 154
The equilibrium reaction and its acid dissociation constant are written as in Eqs. (1) 155
and (2), respectively. Fractions of the species are related with the effective 156
electrophoretic mobility of the analogue, µeff, and the µeff value at a particular pH 157
condition is given in Eq. (3). 158
HA H+ + A− (1) 159
Ka = �H+�[A−][HA] (2) 160
𝜇𝜇eff = [A−] × 𝜇𝜇ep,A
[HA] + [A−] = 10
−p𝐾𝐾𝑎𝑎 × 𝜇𝜇ep,A
10−pH+10−p𝐾𝐾𝑎𝑎 (3) 161
In Eq. (2), [H+] is conventionally used instead of aH+, and Ka written in Eq. (2) is exactly 162
a mixed equilibrium constant. Value of µep,A is the electrophoretic mobility of the 163
monoanionic FL species. The protonated FL species, HA, is neutral, and its 164
electrophoretic mobility can be set as zero; Eq. (3) is thus given. A series of the pairs 165
of pH and µeff value were put in Eq. (3), and the values of µep,A and pKa were optimized 166
by a non-linear least-squares analysis [8,10]. Since the measured electrophoretic 167
mobility may deviate under the variation of experimental conditions, the value of µeff 168
was standardized with the electrophoretic mobility of 1-NS−, µeff,1-NS, and the 169
standardized value of µeff / µeff,1-NS was used for the analysis. Because 1-NS− is a 170
monoanion over the wide pH range and its electrophoretic mobility is essentially 171
identical under the experimental conditions, and it was chosen as an internal standard. 172
On analyzing the pKa value, a software of R program (Ver. 3.6.2) was used on the 173
basis of nonlinear least-squares regression [15]. Higher ionic strength would bias the 174
pKa value from its thermodynamic one, pKao. However, the pKa variation is generally 175
~0.1 for monoprotic acid at ionic strength of 0.10 mol L−1. The pKa values are 176
determined at ionic strength of 0.010 mol L−1, and the values determined in this study 177
would differ little from the thermodynamic ones; less than 0.1. 178
For diprotic FL analogues, H2A, the charge changes from 0 to −2 by the two-steps acid 179
dissociation reactions as in Eq. (4). The stepwise acid dissociation constants, Ka1 and 180
Ka2, are written in Eq. (5). The effective electrophoretic mobility of an FL analogue at 181
a particular pH condition is given in Eq. (6). 182
H2A H+ + HA− , HA− H+ + A2− (4) 183
Ka1 = �H+�[HA−][H2A] , Ka2 = �H
+��A2−� [HA−] (5) 184
𝜇𝜇eff = [HA−]×μep,HA + �A2−�×2μep,HA
[H2A] + [HA−] + [A2−] = 10
−pH−𝑝𝑝𝐾𝐾𝑎𝑎1 × μep,HA + 10−p𝐾𝐾𝑎𝑎1−p𝐾𝐾𝑎𝑎2 × 2μep,HA
10−2pH + 10−pH−𝑝𝑝𝐾𝐾𝑎𝑎1 + 10−p𝐾𝐾𝑎𝑎1−p𝐾𝐾𝑎𝑎2 (6) 185
Value of µep,HA is the electrophoretic mobility of the monoanionic FL species. The 186
electrophoretic mobility of dianionic FL species is assumed to be twice to the 187
monoanionic FL species [8,16]. A series of the pairs of pH and µeff were put in Eq. (6), 188
and the values of pKa1 and pKa2, as well as µep,HA, were optimized by a non-linear 189
least-squares analysis in a similar manner to the analysis of the one-step pKa [16]. 190
3 Results and discussion 191
3.1 Determination of an acid dissociation constant of RF 192
Prior to the determination of the synthesized FL analogues, an acid dissociation 193
constant of RF was determined through the changes in the effective electrophoretic 194
mobility in CZE. Riboflavin is a monoprotic acid, and its charge changes from 0 to −1 195
by the acid dissociation reaction of the imide moiety. Electropherograms of RF at 196
several pH conditions are shown in Fig. S1 A. The migration time of RF got longer with 197
the increase in pH, suggesting that RF is more anionic at alkaline pH conditions. 198
Changes in the standardized electrophoretic mobility of RF are shown in Fig. S1 B. 199
Analysis of the results with Eq. (3) gave a pKa value of 10.29±0.06 (mean ± standard 200
error) by a least-squares analysis. The result agrees with the reported pKa value of 201
10.2 [17]. The pKa values are summarized in Table 1. 202
203
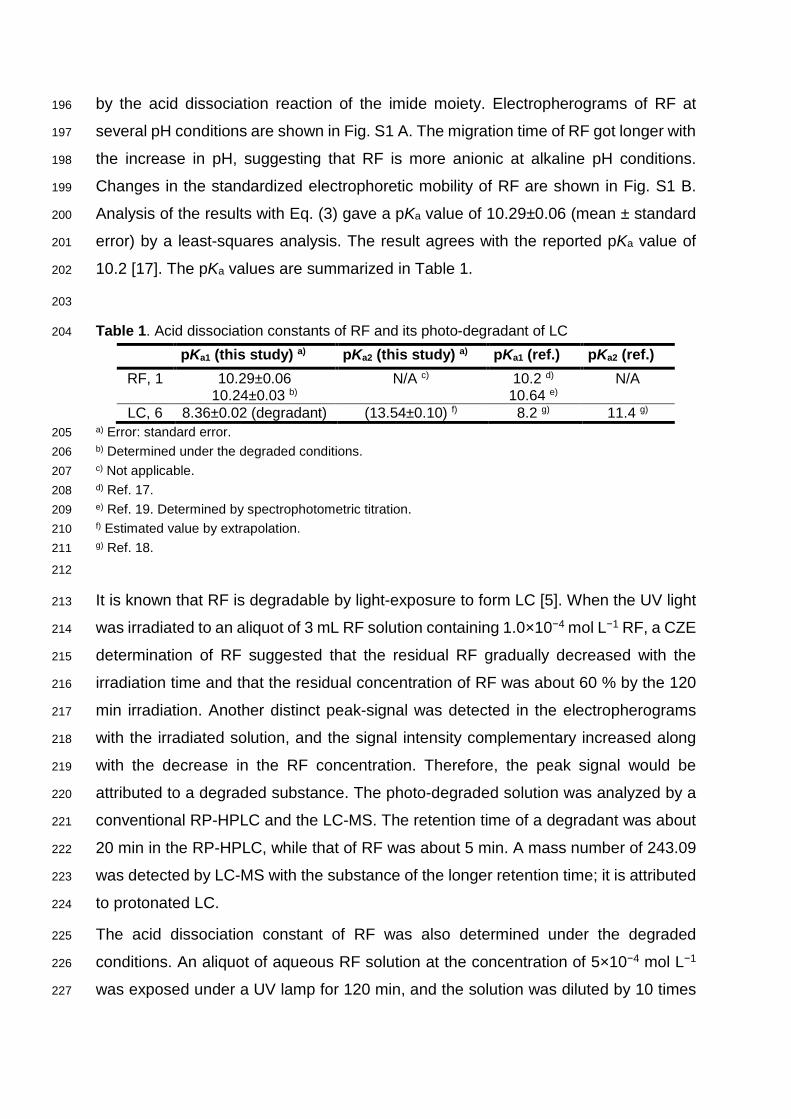
Table 1. Acid dissociation constants of RF and its photo-degradant of LC 204
pKa1 (this study) a) pKa2 (this study) a) pKa1 (ref.) pKa2 (ref.) RF, 1 10.29±0.06
10.24±0.03 b) N/A c) 10.2 d)
10.64 e) N/A
LC, 6 8.36±0.02 (degradant) (13.54±0.10) f) 8.2 g) 11.4 g) a) Error: standard error. 205 b) Determined under the degraded conditions. 206 c) Not applicable. 207 d) Ref. 17. 208 e) Ref. 19. Determined by spectrophotometric titration. 209 f) Estimated value by extrapolation. 210 g) Ref. 18. 211
212
It is known that RF is degradable by light-exposure to form LC [5]. When the UV light 213
was irradiated to an aliquot of 3 mL RF solution containing 1.0×10⁻⁴ mol L−1 RF, a CZE 214
determination of RF suggested that the residual RF gradually decreased with the 215
irradiation time and that the residual concentration of RF was about 60 % by the 120 216
min irradiation. Another distinct peak-signal was detected in the electropherograms 217
with the irradiated solution, and the signal intensity complementary increased along 218
with the decrease in the RF concentration. Therefore, the peak signal would be 219
attributed to a degraded substance. The photo-degraded solution was analyzed by a 220
conventional RP-HPLC and the LC-MS. The retention time of a degradant was about 221
20 min in the RP-HPLC, while that of RF was about 5 min. A mass number of 243.09 222
was detected by LC-MS with the substance of the longer retention time; it is attributed 223
to protonated LC. 224
The acid dissociation constant of RF was also determined under the degraded 225
conditions. An aliquot of aqueous RF solution at the concentration of 5×10⁻⁴ mol L−1 226
was exposed under a UV lamp for 120 min, and the solution was diluted by 10 times 227
and used for the pKa determination after adding 2×10⁻⁵ mol L−1 1-NS− as an internal 228
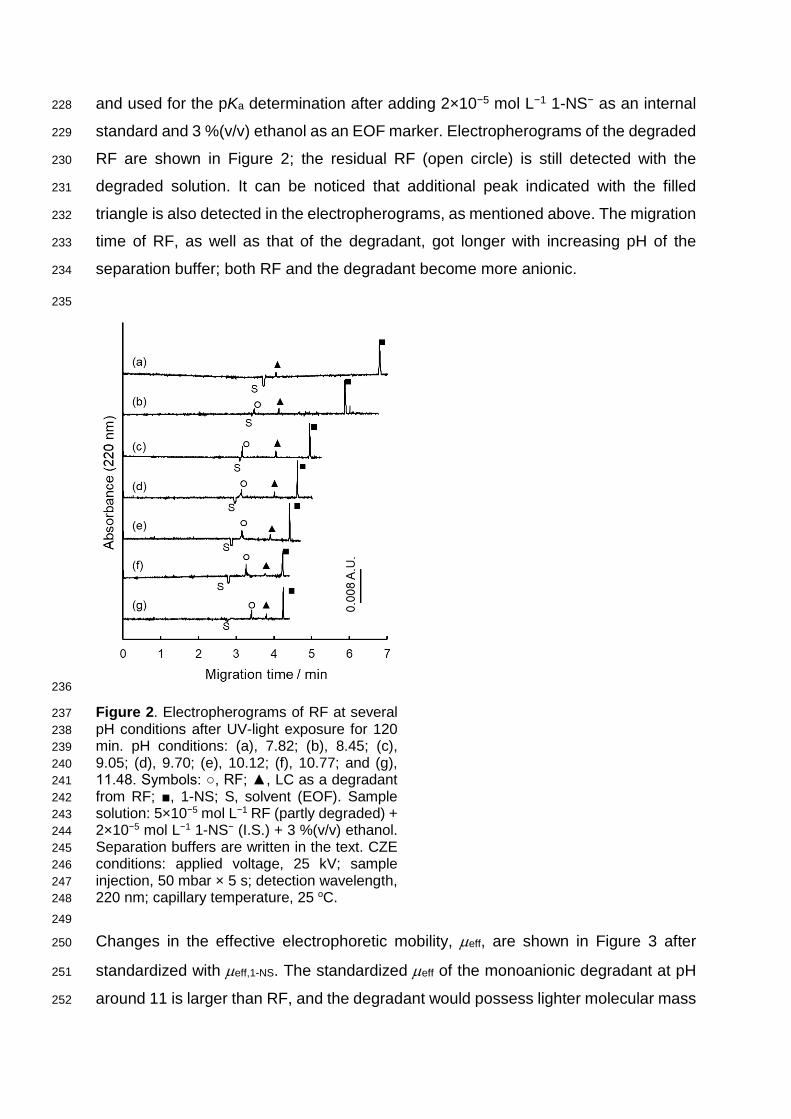
standard and 3 %(v/v) ethanol as an EOF marker. Electropherograms of the degraded 229
RF are shown in Figure 2; the residual RF (open circle) is still detected with the 230
degraded solution. It can be noticed that additional peak indicated with the filled 231
triangle is also detected in the electropherograms, as mentioned above. The migration 232
time of RF, as well as that of the degradant, got longer with increasing pH of the 233
separation buffer; both RF and the degradant become more anionic. 234
235
236
Figure 2. Electropherograms of RF at several 237 pH conditions after UV-light exposure for 120 238 min. pH conditions: (a), 7.82; (b), 8.45; (c), 239 9.05; (d), 9.70; (e), 10.12; (f), 10.77; and (g), 240 11.48. Symbols: ○, RF; ▲, LC as a degradant 241 from RF; ■, 1-NS; S, solvent (EOF). Sample 242 solution: 5×10⁻⁵ mol L−1 RF (partly degraded) + 243 2×10⁻⁵ mol L−1 1-NS− (I.S.) + 3 %(v/v) ethanol. 244 Separation buffers are written in the text. CZE 245 conditions: applied voltage, 25 kV; sample 246 injection, 50 mbar × 5 s; detection wavelength, 247 220 nm; capillary temperature, 25 oC. 248
249
Changes in the effective electrophoretic mobility, µeff, are shown in Figure 3 after 250
standardized with µeff,1-NS. The standardized µeff of the monoanionic degradant at pH 251
around 11 is larger than RF, and the degradant would possess lighter molecular mass 252
than RF. While RF showed monoprotic profile of the mobility change, the µeff of the 253
degradant tended to increase at the alkaline pH conditions over 12. The acid 254
dissociation constant of RF under the degraded conditions was also determined with 255
Eq. (3), and pKa value of 10.24±0.03 was obtained (Table 1). The pKa value agreed 256
with the freshly prepared RF solution, as well as the reference value [17]. Therefore, 257
usefulness of the CZE analysis, electrophoretic separation of the target analyte from 258
coexisting substances [8-11], was also demonstrated in this study. 259
Acid dissociation constants of the degradant were also determined through the 260
changes in the effective electrophoretic mobility. The increased µeff value at the 261
alkaline pH conditions suggested the formation of a dianionic species. The CZE 262
measurements, however, are limited under the pH conditions below ~12, because the 263
higher pH conditions accompany the high salt concentrations, yielding much Joule’s 264
heat and temperature increase. Since the dianionic species is twice in its charge from 265
the monoanionic species and its molecular mass is almost identical to the monoanionic 266
species, µeff value of the dianionic species is supposed to be twice to the monoanionic 267
species. This assumption was valid in phenolphthalein [8] and fluorescein derivatives 268
[16]. Equation (6) was thus used for the determination of the two steps of the pKa 269
values; pKa1 = 8.36±0.02 and pKa2 = 13.54±0.10 were obtained by the least-squares 270
analysis. It should be taken care of that the pKa2 value obtained in this study is the 271
results of the extrapolated analysis. The pKa1 value obtained in this study agreed well 272
with the reported value of LC (pKa1 = 8.2) [18], and the degradant detected in this study 273
would be LC. Lumichrome is diprotic acid with the imide moiety and N(1)-H [18], and 274
two steps of the mobility change would also suggest the degradant to be LC. Therefore, 275
another usefulness of the CZE analysis is also demonstrated in this study; the 276
degradant can directly be analyzed without any isolation from the reaction mixture. On 277
the other hand, the pKa2 value obtained in this study did not agree with the reported 278
value of 11.4 [18]. The µeff value of the degradant LC slightly changed at the pH 279
conditions at around 11, suggesting the lack of the acid dissociation equilibrium at this 280
pH range; the reference value determined by a spectrophotometric titration would not 281
be correct. 282
283

284
Figure 3. Changes in the effective 285 electrophoretic mobility of RF and LC as a 286 degradant from RF. The electrophoretic 287 mobility was standardized with 1-NS− as an 288 internal standard. Symbols: ○, RF; ▲, LC as a 289 degradant. The curves are drawn with the 290 optimized results. The CZE conditions are the 291 same as in Fig. 2. 292
293
3.2 Determination of acid dissociation constants of FL analogues 294
by CZE 295
3.2.1 Acid dissociation constant of FL analogue 2 296
Riboflavin tetraacetate (FL analogue 2) is a monoprotic acid, and its charge changes 297
from 0 to −1 by the acid dissociation reaction of the imide moiety. Electropherograms 298
at several pH conditions are shown in Figure S2 A, and the changes in µeff are shown 299
in Figure S2 B after standardized with µeff,1-NS. Analysis of the changes in µeff with Eq. 300
(3) gave a pKa value of 10.21±0.05. 301
An adjacent peak was detected just after the FL analogue 2. A small portion of FL 302
analogue 2 would have hydrolyzed in the alkaline separation buffer during the CZE. 303
When FL analogue 2 at its concentration of 1.0×10⁻⁴ mol L−1 was treated in an alkaline 304
solution of 5×10⁻⁴ mol L−1 NaOH for 50 min, additional peak signal was detected by 305
CZE as an adjacent peak behind to the peak signal of FL analogue 2. Thus, the newly 306
detected signal would be attributed to the hydrolyzed species of FL analogue 2; one 307
or more ester moieties are hydrolyzed to form alcohol group(s). Even under the 308
alkaline-degraded conditions, the acid dissociation constant of FL analogue 2 was 309
successfully determined as pKa = 10.24±0.04. The pKa value is close to the one 310
determined with the freshly prepared solution. 311
The alkaline-treated FL analogue 2 solution was analyzed by RP-HPLC and LC-MS. 312
A certain number (~10) of peaks were detected by a conventional RP-HPLC-UV 313
detected at 220 nm. The LC-MS chromatograms are shown in Figure S3. The mass 314
numbers detected by the LC-MS were 545.188 (FL analogue 2 +H), 503.178, 419.157, 315
and 377.146. The Each mass number corresponds to deacetylated substances from 316
FL analogue 2, and the mass number 377.146 is equivalent to RF. Therefore, the 317
newly detected peaks in Figure S2 would be attributed to the hydrolyzed substances 318
from FL analogue 2. 319
320
3.2.2 Acid dissociation constant of FL analogue 3 321
Lumiflavin (FL analogue 3) is also a monoprotic acid, and its charge similarly changes 322
from 0 to −1 by the acid dissociation reaction of the imide moiety. Electropherograms 323
are shown in Figure S4 A, and the changes in µeff are shown in Figure S4 B after 324
standardized with µeff,1-NS. An additional peak signal indicated with filled triangle was 325
detected with FL analogue 3; it would be attributed to an impurity formed under the 326
storage conditions. An additional peak was also detected with the FL analogue 3 327
solution by a conventional RP-HPLC-UV detection; LC-MS analysis gave a substance 328
of mass number of 243.09. The mass number is equivalent to LC, and the impurity 329
would be LC. The migration time of FL analogue 3, as well as the additional peak 330
signal, got longer than the EOF with the increase in pH as in the case of RF. Analysis 331
of the changes in µeff of FL analogue 3 with Eq. (3) gave a pKa value of 10.38±0.04. 332
Unfortunately, the additional peak was not detected in the alkaline separation buffer, 333
it would have been overlapped with FL analogue 3. The monoprotic behavior of the 334
additional peak was analyzed with Eq. (3), and a pKa value of 8.29±0.02 was obtained; 335
the pKa value is close to that of LC. The usefulness of the CZE analysis is also 336
demonstrated with such substance as containing impurity, as well as the pKa analysis 337
of the impurity. 338
339
3.2.3 Acid dissociation constant of FL analogue 4 340
10-(2,2-Dihydroxyethyl)-7,8-dimethylisoalloxazine (FL analogue 4) is also a 341
monoprotic acid, and its charge changes from 0 to −1 by the acid dissociation reaction 342
of the imide moiety. Electropherograms are shown in Figure S5 A, and the changes in 343
µeff are shown in Figure S5 B after standardized with µeff,1-NS. A peak signal 344
corresponding to FL analogue 4 disappeared at pH 12.05 (Figure S5 A(f)). The result 345
suggests that FL analogue 4 has decomposed at the alkaline conditions. An additional 346
peak signal indicated with filled triangle was also detected with FL analogue 4 as in 347
the case of FL analogue 3. Although the migration time of the EOF became faster at 348
alkaline pH conditions, the peak signal of FL analogue 4 much delayed from the EOF 349
at alkaline pH conditions. Analysis of the changes in µeff with Eq. (3) gave a pKa value 350
of 10.22±0.08 for FL analogue 4. An acid dissociation constant of the impurity was 351
also determined with Eq. (3), and a pKa value of 8.40±0.02 was obtained. LC-MS 352
analysis gave a mass number of 243.09, and the impurity was also found to be LC. 353
354
3.2.4 Acid dissociation constant of FL analogue 5 355
10-(2-Hydroxyethyl)-7,8-dimethylisoalloxazine (FL analogue 5) is also a monoprotic 356
acid, and its charge changes from 0 to −1 by the acid dissociation reaction of the imide 357
moiety. Electropherograms are shown in Figure S6 A, and the changes in µeff are 358
shown in Figure S6 B after standardized with µeff,1-NS. A peak signal corresponding to 359
FL analogue 5 was detected. Although a peak signal of an impurity or the degradant 360
was detected at pH around 10.5, it did not interfere with the pKa analysis of FL 361
analogue 5. The additional peak signal was not detected when FL analogue 5 was 362
freshly prepared, and therefore, it would be generated under light exposure. The 363
migration time of FL analogue 5 got longer than the EOF with the increase in pH as in 364
the case of RF. Analysis of the changes in µeff with Eq. (3) gave a pKa value of 365
10.35±0.04 for FL analogue 5. 366
367
3.2.5 Acid dissociation constants of FL analogue 7 368
Alloxazine (FL analogue 7) is a diprotic acid, and its charge changes from 0 to −2 by 369
the acid dissociation reactions of the imide moiety and N(1)-H. Electropherograms are 370
shown in Figure S7 A, and the changes in µeff are shown in Figure S7 B after 371

standardized with µeff,1-NS. The µeff value increased in the pH range from 7 to 9, and an 372
acid dissociation equilibrium is applied in this pH range. The µeff value further 373
increased in the pH range over 11. This increase would be attributed to the 2nd step 374
of the deprotonation. Two steps of the acid dissociation equilibria are analyzed with 375
Eq. (6) in a similar manner to LC, and the pKa values of pKa1 = 8.07±0.01 and pKa2 = 376
12.96±0.4 were obtained by the least-squares analysis. It should also be taken care 377
of that the pKa2 value obtained in this study is the results of the extrapolated analysis, 378
as in the case of LC. It can be noted that both pKa1 and pKa2 values of FL analogue 7 379
are smaller than those of LC. The result would be attributed to the lack of two methyl 380
groups of electron donating moiety. 381
382
3.2.6 Acid dissociation constants of FL analogue 8 at weakly alkaline pH region 383
7,8-Dimethyl-10-carboxymethylisoalloxazine (FL analogue 8) is a diprotic acid, and its 384
charge changes from 0 to −2 by the acid dissociation equilibria of a carboxylic acid 385
moiety and an imide moiety. The carboxylic acid moiety would dissociate at weakly 386
acidic pH region, and the imide moiety at weakly alkaline pH region. 387
Electropherograms in the neutral to weakly alkaline pH range are shown in Figure S8, 388
and the changes in µeff are shown in Figure 4 A after standardized with µeff,1-NS. A peak 389
signal attributed to FL analogue 8, as well as an impurity, is detected in the 390
electropherograms. According to the presence of the carboxylate moiety, FL analogue 391
8 is anionic in the pH range between 7.9 and 12.0. On the other hand, detection of FL 392
analogue 8 was difficult at acidic pH conditions below 4.5, because the electroosmotic 393
flow was too slow at the acidic pH conditions to detect the anionic species. In Figure 394
4 A, the µeff value of FL analogue 8 increased in the pH range at around 11, suggesting 395
that the charge changes from −1 to −2 in the pH range: the 2nd step of the 396
deprotonation. The acid dissociation equilibrium of Ka2 is expressed as in Eq. (7) with 397
its acid dissociation constant (8). The effective electrophoretic mobility is contributed 398
from both charged species of HA− and A2−, and it is written as in Eq. (9). 399
HA− H+ + A2− (7) 400
Ka2 = �H+��A2−�[HA−] (8) 401
𝜇𝜇eff = [HA−] × 𝜇𝜇ep,HA +[A2−]× 𝜇𝜇ep,A
[HA−] + [A2−] = 10
−pH × 𝜇𝜇ep,HA + 10−p𝐾𝐾𝑎𝑎2× 𝜇𝜇ep,A 10−pH+10−p𝐾𝐾𝑎𝑎2
(9) 402
403
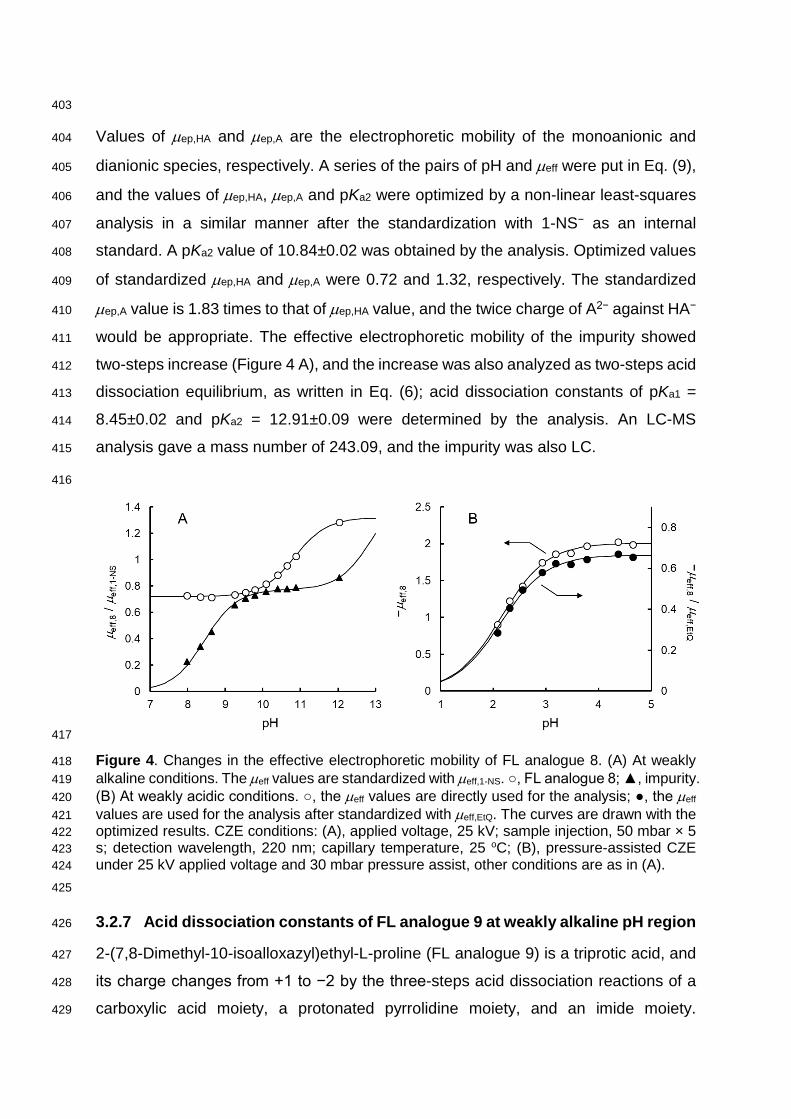
Values of µep,HA and µep,A are the electrophoretic mobility of the monoanionic and 404
dianionic species, respectively. A series of the pairs of pH and µeff were put in Eq. (9), 405
and the values of µep,HA, µep,A and pKa2 were optimized by a non-linear least-squares 406
analysis in a similar manner after the standardization with 1-NS− as an internal 407
standard. A pKa2 value of 10.84±0.02 was obtained by the analysis. Optimized values 408
of standardized µep,HA and µep,A were 0.72 and 1.32, respectively. The standardized 409
µep,A value is 1.83 times to that of µep,HA value, and the twice charge of A2− against HA− 410
would be appropriate. The effective electrophoretic mobility of the impurity showed 411
two-steps increase (Figure 4 A), and the increase was also analyzed as two-steps acid 412
dissociation equilibrium, as written in Eq. (6); acid dissociation constants of pKa1 = 413
8.45±0.02 and pKa2 = 12.91±0.09 were determined by the analysis. An LC-MS 414
analysis gave a mass number of 243.09, and the impurity was also LC. 415
416
417
Figure 4. Changes in the effective electrophoretic mobility of FL analogue 8. (A) At weakly 418 alkaline conditions. The µeff values are standardized with µeff,1-NS. ○, FL analogue 8; ▲, impurity. 419 (B) At weakly acidic conditions. ○, the µeff values are directly used for the analysis; ●, the µeff 420 values are used for the analysis after standardized with µeff,EtQ. The curves are drawn with the 421 optimized results. CZE conditions: (A), applied voltage, 25 kV; sample injection, 50 mbar × 5 422 s; detection wavelength, 220 nm; capillary temperature, 25 oC; (B), pressure-assisted CZE 423 under 25 kV applied voltage and 30 mbar pressure assist, other conditions are as in (A). 424
425
3.2.7 Acid dissociation constants of FL analogue 9 at weakly alkaline pH region 426
2-(7,8-Dimethyl-10-isoalloxazyl)ethyl-L-proline (FL analogue 9) is a triprotic acid, and 427
its charge changes from +1 to −2 by the three-steps acid dissociation reactions of a 428
carboxylic acid moiety, a protonated pyrrolidine moiety, and an imide moiety. 429
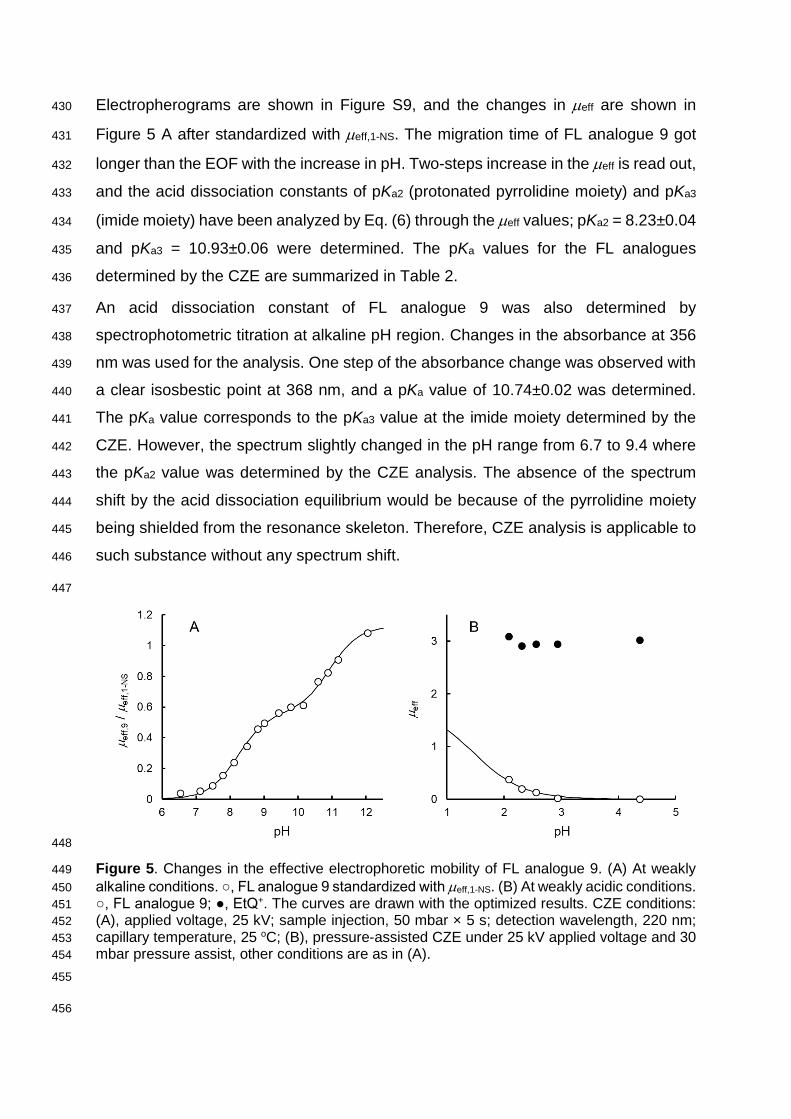
Electropherograms are shown in Figure S9, and the changes in µeff are shown in 430
Figure 5 A after standardized with µeff,1-NS. The migration time of FL analogue 9 got 431
longer than the EOF with the increase in pH. Two-steps increase in the µeff is read out, 432
and the acid dissociation constants of pKa2 (protonated pyrrolidine moiety) and pKa3 433
(imide moiety) have been analyzed by Eq. (6) through the µeff values; pKa2 = 8.23±0.04 434
and pKa3 = 10.93±0.06 were determined. The pKa values for the FL analogues 435
determined by the CZE are summarized in Table 2. 436
An acid dissociation constant of FL analogue 9 was also determined by 437
spectrophotometric titration at alkaline pH region. Changes in the absorbance at 356 438
nm was used for the analysis. One step of the absorbance change was observed with 439
a clear isosbestic point at 368 nm, and a pKa value of 10.74±0.02 was determined. 440
The pKa value corresponds to the pKa3 value at the imide moiety determined by the 441
CZE. However, the spectrum slightly changed in the pH range from 6.7 to 9.4 where 442
the pKa2 value was determined by the CZE analysis. The absence of the spectrum 443
shift by the acid dissociation equilibrium would be because of the pyrrolidine moiety 444
being shielded from the resonance skeleton. Therefore, CZE analysis is applicable to 445
such substance without any spectrum shift. 446
447
448
Figure 5. Changes in the effective electrophoretic mobility of FL analogue 9. (A) At weakly 449 alkaline conditions. ○, FL analogue 9 standardized with µeff,1-NS. (B) At weakly acidic conditions. 450 ○, FL analogue 9; ●, EtQ+. The curves are drawn with the optimized results. CZE conditions: 451 (A), applied voltage, 25 kV; sample injection, 50 mbar × 5 s; detection wavelength, 220 nm; 452 capillary temperature, 25 oC; (B), pressure-assisted CZE under 25 kV applied voltage and 30 453 mbar pressure assist, other conditions are as in (A). 454
455
456
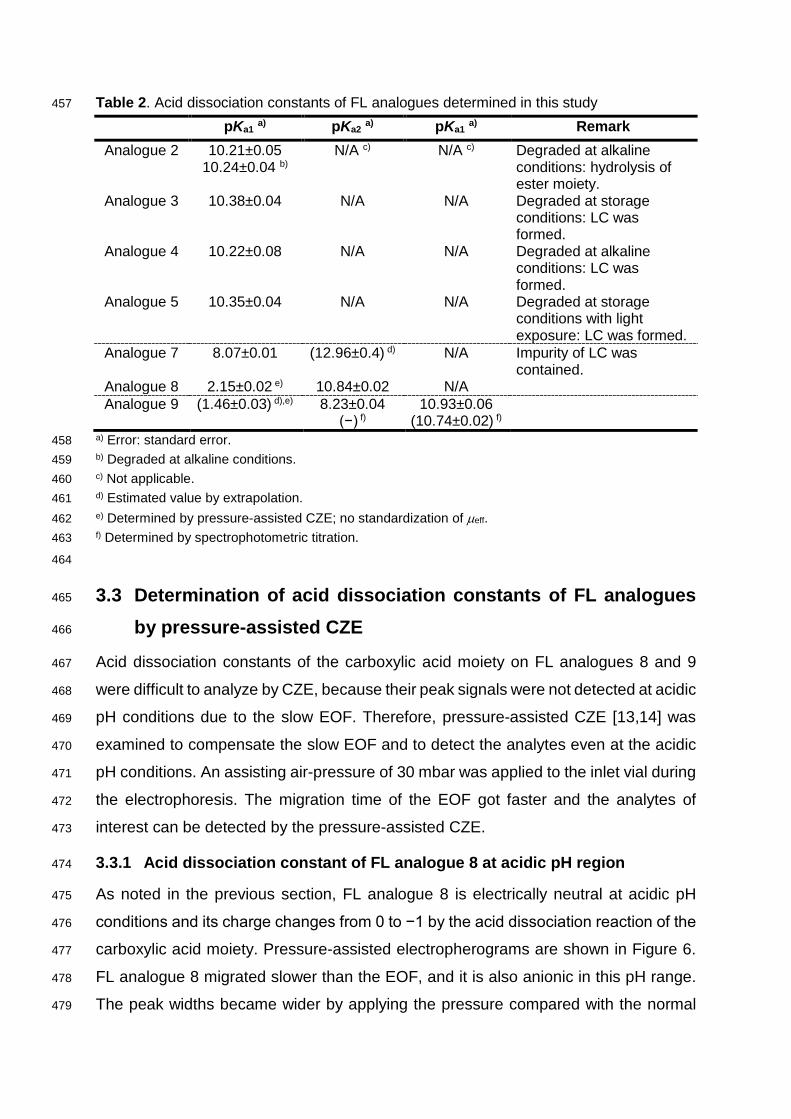
Table 2. Acid dissociation constants of FL analogues determined in this study 457
pKa1 a) pKa2 a) pKa1 a) Remark Analogue 2 10.21±0.05
10.24±0.04 b) N/A c) N/A c) Degraded at alkaline
conditions: hydrolysis of ester moiety.
Analogue 3 10.38±0.04 N/A N/A Degraded at storage conditions: LC was formed.
Analogue 4 10.22±0.08 N/A N/A Degraded at alkaline conditions: LC was formed.
Analogue 5 10.35±0.04 N/A N/A Degraded at storage conditions with light exposure: LC was formed.
Analogue 7 8.07±0.01 (12.96±0.4) d) N/A Impurity of LC was contained.
Analogue 8 2.15±0.02 e) 10.84±0.02 N/A Analogue 9 (1.46±0.03) d),e) 8.23±0.04
(−) f) 10.93±0.06
(10.74±0.02) f)
a) Error: standard error. 458 b) Degraded at alkaline conditions. 459 c) Not applicable. 460 d) Estimated value by extrapolation. 461 e) Determined by pressure-assisted CZE; no standardization of µeff. 462 f) Determined by spectrophotometric titration. 463
464
3.3 Determination of acid dissociation constants of FL analogues 465
by pressure-assisted CZE 466
Acid dissociation constants of the carboxylic acid moiety on FL analogues 8 and 9 467
were difficult to analyze by CZE, because their peak signals were not detected at acidic 468
pH conditions due to the slow EOF. Therefore, pressure-assisted CZE [13,14] was 469
examined to compensate the slow EOF and to detect the analytes even at the acidic 470
pH conditions. An assisting air-pressure of 30 mbar was applied to the inlet vial during 471
the electrophoresis. The migration time of the EOF got faster and the analytes of 472
interest can be detected by the pressure-assisted CZE. 473
3.3.1 Acid dissociation constant of FL analogue 8 at acidic pH region 474
As noted in the previous section, FL analogue 8 is electrically neutral at acidic pH 475
conditions and its charge changes from 0 to −1 by the acid dissociation reaction of the 476
carboxylic acid moiety. Pressure-assisted electropherograms are shown in Figure 6. 477
FL analogue 8 migrated slower than the EOF, and it is also anionic in this pH range. 478
The peak widths became wider by applying the pressure compared with the normal 479
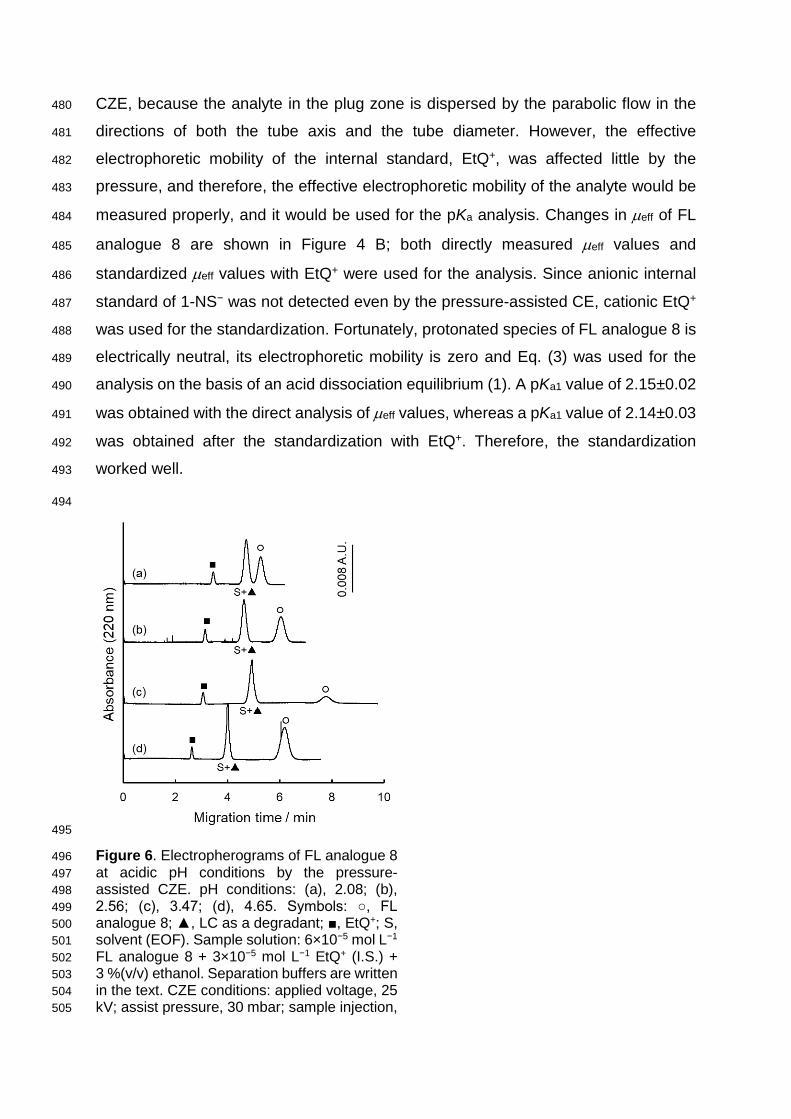
CZE, because the analyte in the plug zone is dispersed by the parabolic flow in the 480
directions of both the tube axis and the tube diameter. However, the effective 481
electrophoretic mobility of the internal standard, EtQ+, was affected little by the 482
pressure, and therefore, the effective electrophoretic mobility of the analyte would be 483
measured properly, and it would be used for the pKa analysis. Changes in µeff of FL 484
analogue 8 are shown in Figure 4 B; both directly measured µeff values and 485
standardized µeff values with EtQ+ were used for the analysis. Since anionic internal 486
standard of 1-NS− was not detected even by the pressure-assisted CE, cationic EtQ+ 487
was used for the standardization. Fortunately, protonated species of FL analogue 8 is 488
electrically neutral, its electrophoretic mobility is zero and Eq. (3) was used for the 489
analysis on the basis of an acid dissociation equilibrium (1). A pKa1 value of 2.15±0.02 490
was obtained with the direct analysis of µeff values, whereas a pKa1 value of 2.14±0.03 491
was obtained after the standardization with EtQ+. Therefore, the standardization 492
worked well. 493
494
495
Figure 6. Electropherograms of FL analogue 8 496 at acidic pH conditions by the pressure-497 assisted CZE. pH conditions: (a), 2.08; (b), 498 2.56; (c), 3.47; (d), 4.65. Symbols: ○, FL 499 analogue 8; ▲, LC as a degradant; ■, EtQ+; S, 500 solvent (EOF). Sample solution: 6×10⁻⁵ mol L−1 501 FL analogue 8 + 3×10⁻⁵ mol L−1 EtQ+ (I.S.) + 502 3 %(v/v) ethanol. Separation buffers are written 503 in the text. CZE conditions: applied voltage, 25 504 kV; assist pressure, 30 mbar; sample injection, 505
50 mbar × 5 s; detection wavelength, 220 nm; 506 capillary temperature, 25 oC. 507
508
3.3.2 Acid dissociation constants of FL analogue 9 at acidic pH region 509
An acid dissociation constant of FL analogue 9 was also examined by the pressure-510
assisted CZE. Its charge changes from +1 to 0 by the acid dissociation reaction of the 511
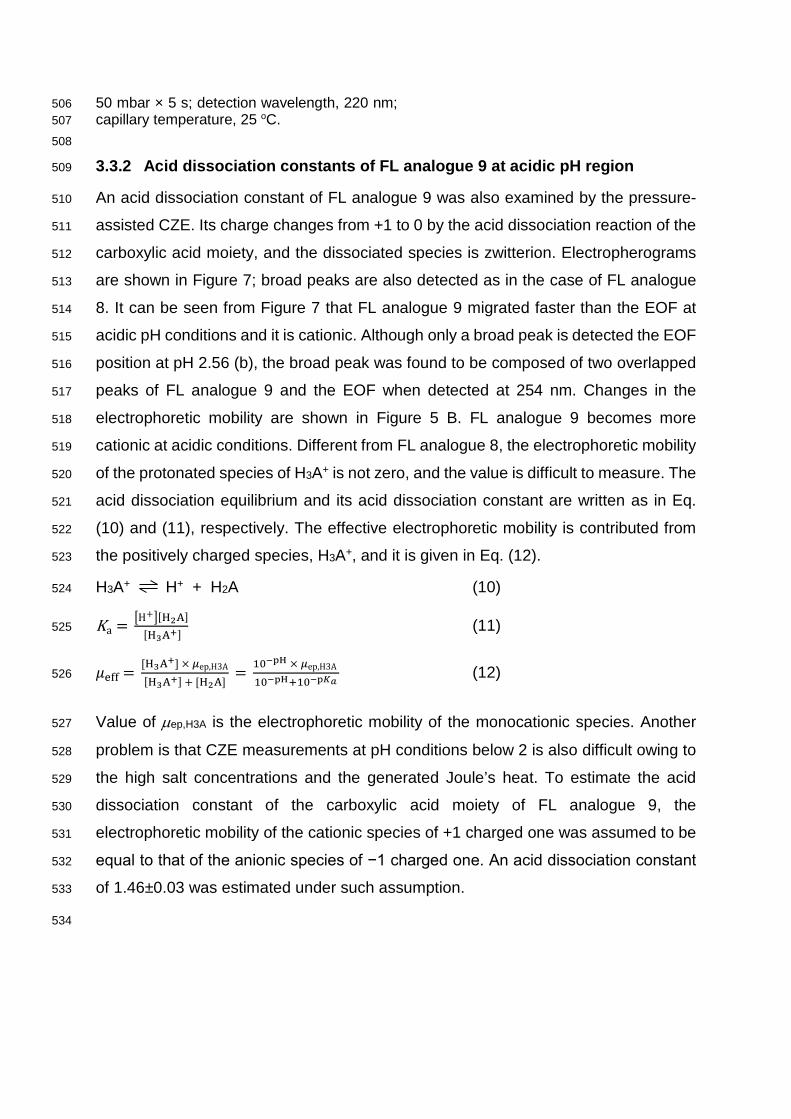
carboxylic acid moiety, and the dissociated species is zwitterion. Electropherograms 512
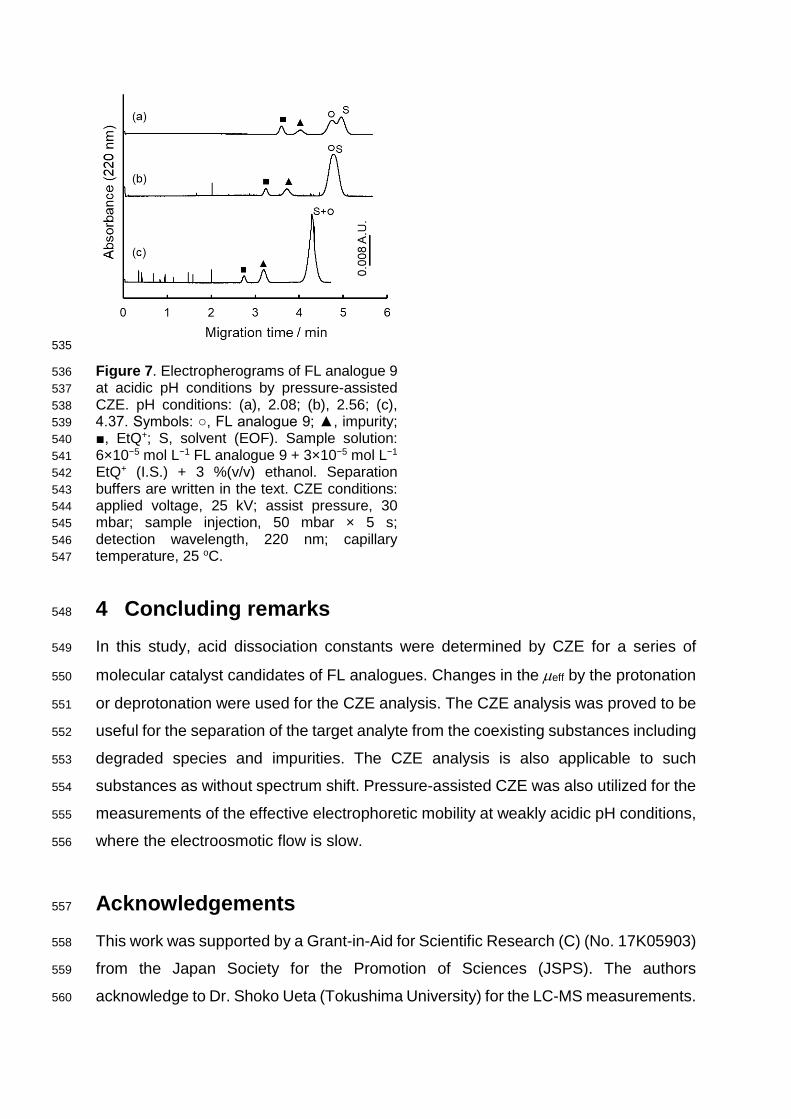
are shown in Figure 7; broad peaks are also detected as in the case of FL analogue 513
8. It can be seen from Figure 7 that FL analogue 9 migrated faster than the EOF at 514
acidic pH conditions and it is cationic. Although only a broad peak is detected the EOF 515
position at pH 2.56 (b), the broad peak was found to be composed of two overlapped 516
peaks of FL analogue 9 and the EOF when detected at 254 nm. Changes in the 517
electrophoretic mobility are shown in Figure 5 B. FL analogue 9 becomes more 518
cationic at acidic conditions. Different from FL analogue 8, the electrophoretic mobility 519
of the protonated species of H3A+ is not zero, and the value is difficult to measure. The 520
acid dissociation equilibrium and its acid dissociation constant are written as in Eq. 521
(10) and (11), respectively. The effective electrophoretic mobility is contributed from 522
the positively charged species, H3A+, and it is given in Eq. (12). 523
H3A+ H+ + H2A (10) 524
Ka = �H+�[H2A]
[H3A+] (11) 525
𝜇𝜇eff = [H3A+] × 𝜇𝜇ep,H3A
[H3A+] + [H2A] = 10
−pH × 𝜇𝜇ep,H3A
10−pH+10−p𝐾𝐾𝑎𝑎 (12) 526
Value of µep,H3A is the electrophoretic mobility of the monocationic species. Another 527
problem is that CZE measurements at pH conditions below 2 is also difficult owing to 528
the high salt concentrations and the generated Joule’s heat. To estimate the acid 529
dissociation constant of the carboxylic acid moiety of FL analogue 9, the 530
electrophoretic mobility of the cationic species of +1 charged one was assumed to be 531
equal to that of the anionic species of −1 charged one. An acid dissociation constant 532
of 1.46±0.03 was estimated under such assumption. 533
534
535
Figure 7. Electropherograms of FL analogue 9 536 at acidic pH conditions by pressure-assisted 537 CZE. pH conditions: (a), 2.08; (b), 2.56; (c), 538 4.37. Symbols: ○, FL analogue 9; ▲, impurity; 539 ■, EtQ+; S, solvent (EOF). Sample solution: 540 6×10⁻⁵ mol L−1 FL analogue 9 + 3×10⁻⁵ mol L−1 541 EtQ+ (I.S.) + 3 %(v/v) ethanol. Separation 542 buffers are written in the text. CZE conditions: 543 applied voltage, 25 kV; assist pressure, 30 544 mbar; sample injection, 50 mbar × 5 s; 545 detection wavelength, 220 nm; capillary 546 temperature, 25 oC. 547
4 Concluding remarks 548
In this study, acid dissociation constants were determined by CZE for a series of 549
molecular catalyst candidates of FL analogues. Changes in the µeff by the protonation 550
or deprotonation were used for the CZE analysis. The CZE analysis was proved to be 551
useful for the separation of the target analyte from the coexisting substances including 552
degraded species and impurities. The CZE analysis is also applicable to such 553
substances as without spectrum shift. Pressure-assisted CZE was also utilized for the 554
measurements of the effective electrophoretic mobility at weakly acidic pH conditions, 555
where the electroosmotic flow is slow. 556
Acknowledgements 557
This work was supported by a Grant-in-Aid for Scientific Research (C) (No. 17K05903) 558
from the Japan Society for the Promotion of Sciences (JSPS). The authors 559
acknowledge to Dr. Shoko Ueta (Tokushima University) for the LC-MS measurements. 560
Conflict of interest 561
The authors have declared no conflict of interest. 562
5 References 563
[1] Iida, H., Imada, Y., Murahashi, S.-I., Org. Biomol. Chem. 2015, 13, 7599-7613. 564
[2] Tagami, T., Arakawa, Y., Minagawa, K., Imada, Y., Org. Lett. 2019, 21, 6978-6982. 565
[3] Imada, Y., Kitagawa, T., Ohno, T., Iida, H., Naota, T., Org. Lett. 2010, 12, 32-35. 566
[4] Arakawa, Y., Yamanomoto, K., Kita, H., Minagawa, K., Tanaka, M., Haraguchi, N., 567
Itsuno, S., Imada, Y., Chem. Sci. 2017, 8, 5468-5475. 568
[5] Sheraz, M. A., Kazi, S. H., Ahmed, S., Anwar, Z., Ahmad, I., Beilstein J. Org. Chem. 569
2014, 10, 1999-2012. 570
[6] Stanojević, J. S., Zvezdanović, J. B., Marković, D. Z., Monatsh. Chem. 2015, 146, 571
1787-1794. 572
[7] Andrasi, M., Buglyo, P., Zekany, L., Gaspar, A., J. Pharm. Biomed. Anal. 2007, 44, 573
1040-1047. 574
[8] Takayanagi, T., Motomizu, S., Chem. Lett. 2001, 30, 14-15. 575
[9] Örnskov, E., Linusson, A., Folestad, S., J. Pharm. Biomed. Anal. 2003, 33, 379-576
391. 577
[10] Takayanagi, T., Tabara, A., Kaneta, T., Anal. Sci. 2013, 29, 547-552. 578
[11] Takayanagi, T., Itoh, D., Mizuguchi, H., Chromatography 2016, 37, 105-109. 579
[12] Imada, Y., Iida, H., Ono, S., Masui, Y., Murahashi, S.-I., Chem. Asian J. 2006, 1, 580
136-147. 581
[13] Wang, J. L., Xu, X. J., Chen, D. Y., J. Pharm. Biomed. Anal. 2014, 88, 22-26. 582
[14] Konášová, R., Dytrtová, J. J., Kašička, V., J. Chromatogr. A 2015, 1408, 243-249. 583
[15] The R Project for Statistical Computing, https://www.r-project.org/. 584
[16] Hirabayashi, K., Hanaoka, K., Takayanagi, T., Toki, Y., Egawa, T., Kamiya, M., 585
Komatsu, T., Ueno, T., Terai, T., Yoshida, K., Uchiyama, M., Nagano, T., Urano, Y., 586
Anal. Chem. 2015, 87, 9061-9069. 587
[17] O’Neil, M. J. (Ed.), The Merck Index 14th Ed., Merck Research Laboratories, 588
Whitehouse Station, NJ 2006, p. 1413. 589
[18] Prukala, D., Sikorska, E., Koput, J., Khmelinskii, I., Karolczak, J., Gierszewski, M., 590
Sikorski, M., J. Phys. Chem. A 2012, 116, 7474-7490. 591
[19] Ghasemi, J., Ghobadi, S., Abbasi, B., Kubista, M., J. Kor. Chem. Soc. 2005, 49, 592
269-277. 593
594
Supporting information 595
Supporting information file: Syntheses of FL analogues 2, 3, 4, 5, 7, 8, and 9 are 596
described. Typical electropherograms and the changes in the effective mobility are 597
shown in Figures S1, S2, S4, S5, S6, and S7 for FL analogues 1, 2, 3, 4, 5, and 7, 598
respectively. Typical electropherograms are shown in Figures S8 and S9 for FL 599
analogues 8 and 9, respectively. LC-MS chromatograms for alkaline-treated FL 600
analogues 2 are shown in Figure S3. 601
602
Top Related