


Languages
Pages
Legal


Complications of Diabetes
영양병원 내과이준엽

Take Home Messages Glucose control?
Intensive Vs Conventional BP control
<130/80 mmHg Diabetic Retinopathy :
Annually ophthalmic exam Diabetic Nephropathy :
RAAS blockades Macrovascular Cx.s :
Lipid control(Esp. Statins) & antiplatelet agents

Classifications Acute complications
1) Hypoglycemia2) comas (DKA Vs HHS)
Chronic complications1) Diabetic microvascular Cxs. (retinopathy, nephropathy, neuropathy)2) Diabetic macrovascular Cxs. (coronary, cerbral a. , foot ulcers, HTN)

Acute ComplicationsComplications Cause Early Signs Prevention
Diabetic Ketoacidosis (DKA)
- Insulin deficit causing severe metabolic alterations
Weight loss •Increased urination •Increased thirst •Vomiting •Rapid breathing
- Insulin must be given
Hyperosmolar Hyperglycemic Nonketotic
Coma (HHNK)
- Excessive blood glucose concentration
Increased urination •Increased thirst •Fatigue •Lethargy
- Maintaining blood glucose within lower range
Hypoglycaemia - Blood glucose drops significantly below healthy range and can not recover naturally because of diabetes medications.
Lightheaded •Dizzy •Shakey •Hungry •Weak, Tired
- Carbohydrate food intake is balanced with medication and activity
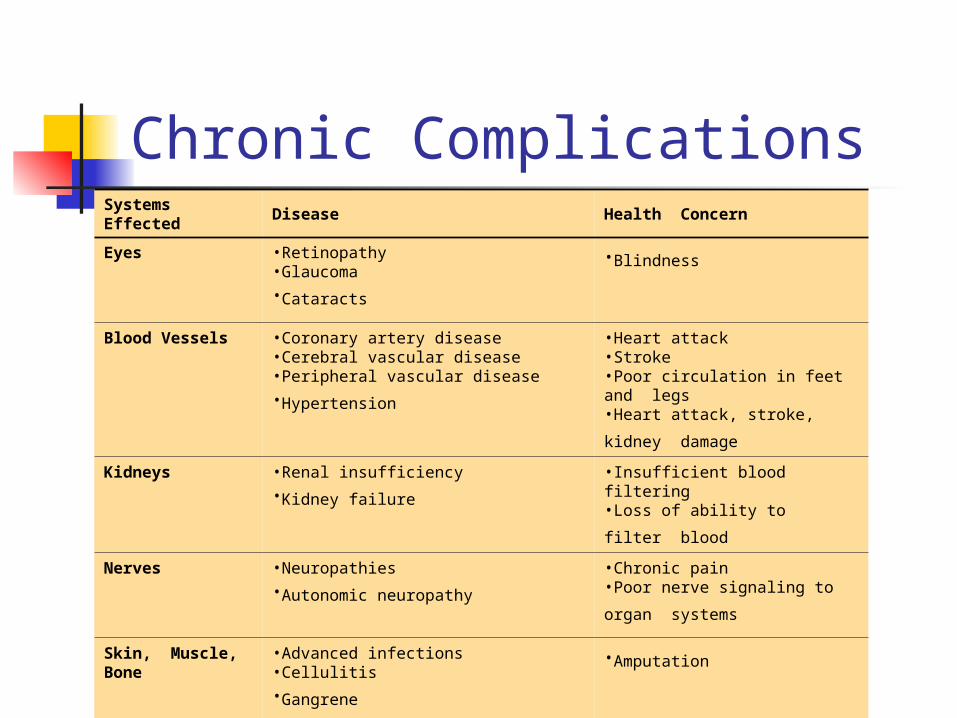
Chronic ComplicationsSystems Effected
Disease Health Concern
Eyes •Retinopathy •Glaucoma •Cataracts
•Blindness
Blood Vessels •Coronary artery disease •Cerebral vascular disease •Peripheral vascular disease •Hypertension
•Heart attack •Stroke •Poor circulation in feet and legs •Heart attack, stroke, kidney
damage Kidneys •Renal insufficiency
•Kidney failure •Insufficient blood filtering •Loss of ability to filter blood
Nerves •Neuropathies •Autonomic neuropathy
•Chronic pain •Poor nerve signaling to organ
systems
Skin, Muscle, Bone
•Advanced infections •Cellulitis •Gangrene
•Amputation

The Diabetes Control andComplications Trial (DCCT)
Multicenter, randomized study of type 1 diabetes patients
To assess effect of intensive glycemic control vs conventional therapy on: development and progression of retinopathy and other long-term complications
Results of this trial led to similar studies of type 2 diabetes patients
DCCT Research Group. N Engl J Med. 1993;329:977-986.

Overall Results of the DCCT Trial
Intensive control of blood glucose reduced risk of diabetic complications
1) retinopathy onset ↓76% in patients with no retinopathy at baseline (P≤0.002)2) retinopathy progression ↓54% in patients with mild retinopathy at baseline (P≤0.002)3) nephropathy ↓54% (P<0.04)4) neuropathy ↓60% (P≤0.002)
There was, however, a 2- to 3-fold greater incidence of severe hypoglycemia
DCCT Research Group. N Engl J Med. 1993;329:977-986.

Relative Risk of Progression of Diabetic Complications
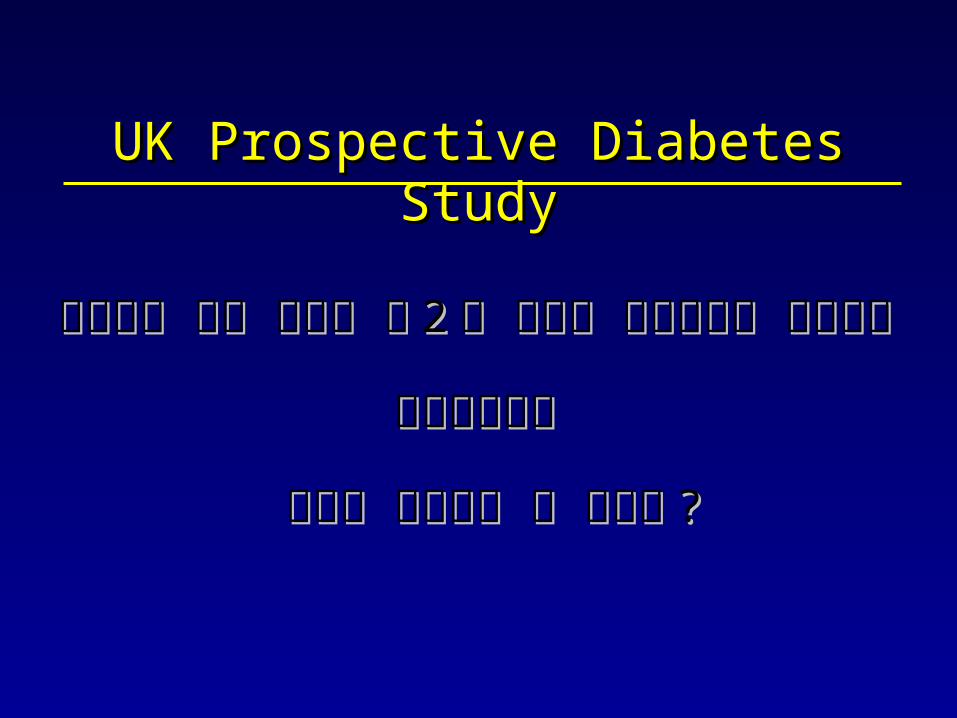
적극적인 혈당 조절로 제적극적인 혈당 조절로 제 22 형 당뇨병 형 당뇨병
환자에게서 당뇨병성 만성합병증의환자에게서 당뇨병성 만성합병증의
위험을 감소시킬 수 있는가위험을 감소시킬 수 있는가 ??
UK Prospective Diabetes StudyUK Prospective Diabetes Study

당뇨병성 망막병증의 진행당뇨병성 망막병증의 진행 ((UKPDS)UKPDS)
Two step change in Early Treatment Diabetic Retinopathy Study (ETDRS) scale
1.03
0.83
0.83
0.79
0.78
0.017
0.012
0.015
0 - 3 years
0 - 6 years
0 - 9 years
0 - 12 years
RR p 0.5 1 2
Relative Risk& 99% CI
Favoursconventional
Favoursintensive

당뇨병성 신증당뇨병성 신증 : : 미세단백뇨미세단백뇨 ((UKPDS)UKPDS)
Urine albumin >50 mg/L
0.89
0.83
0.88
0.76
0.67
0.70
0.24
0.043
0.13
0.00062
0.000054
0.033
Baseline
Three years
Six years
Nine years
Twelve years
Fifteen years
RR p 0.5 1 2
Relative Risk& 99% CI
Favoursconventional
Favoursintensive
<

미세혈관합병증 위험 감소미세혈관합병증 위험 감소 ((UKPDS)UKPDS)
p=0.0099
0%
10%
20%
30%
0 3 6 9 12 15
% o
f pa
tient
s w
ith a
n ev
ent
Years from randomisation
Intensive
Conventional
Risk reduction 25%(95% CI: 7% to 40%)
renal failure or death, vitreous haemorrhage or photocoagulation346 of 3867 patients (9%)

심근경색증 위험 감소위험 감소 ((UKPDS)UKPDS)
0%
10%
20%
30%
0 3 6 9 12 15
% o
f pa
tient
s w
ith a
n ev
ent
Years from randomisation
Intensive
Conventional
p=0.052
Risk reduction 16%(95% CI: 0% to 29%)
fatal or non fatal myocardial infarction, sudden death573 of 3867 patients (15%)

당뇨병에서 심혈관질환은 무거운 짐
당뇨병 환자의 80% 이상이 심혈관질환으로 사망한다 .
Adapted from Laakso M, Lehto S Diabetes Rev 1997;5:294-315.


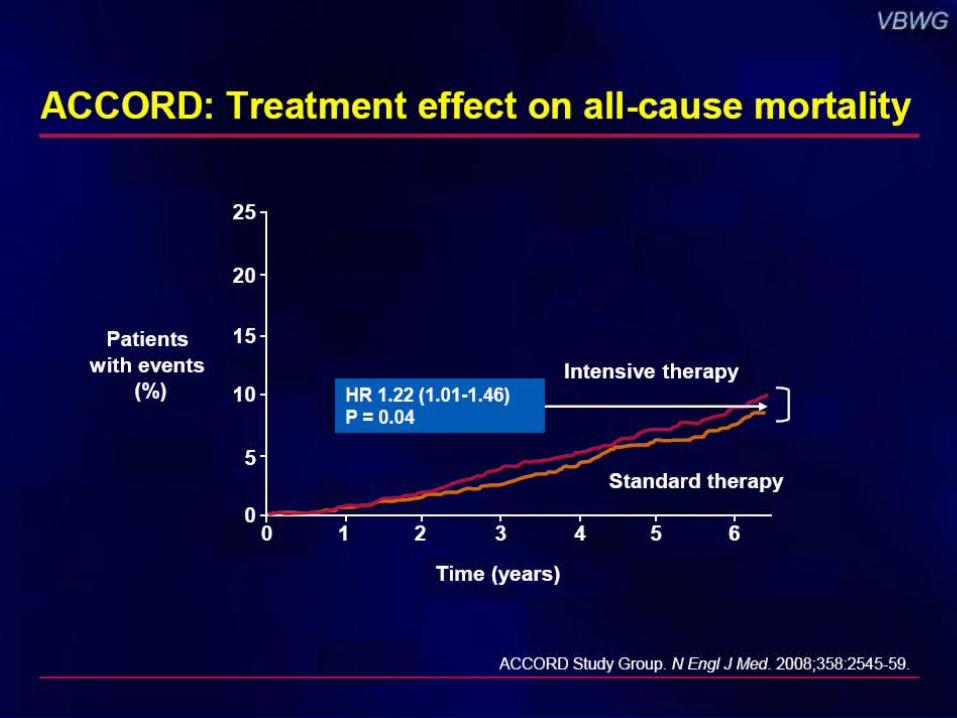


Dluhy RG and McMahon GT. N Engl J Med 2008; 358:2630-2633.
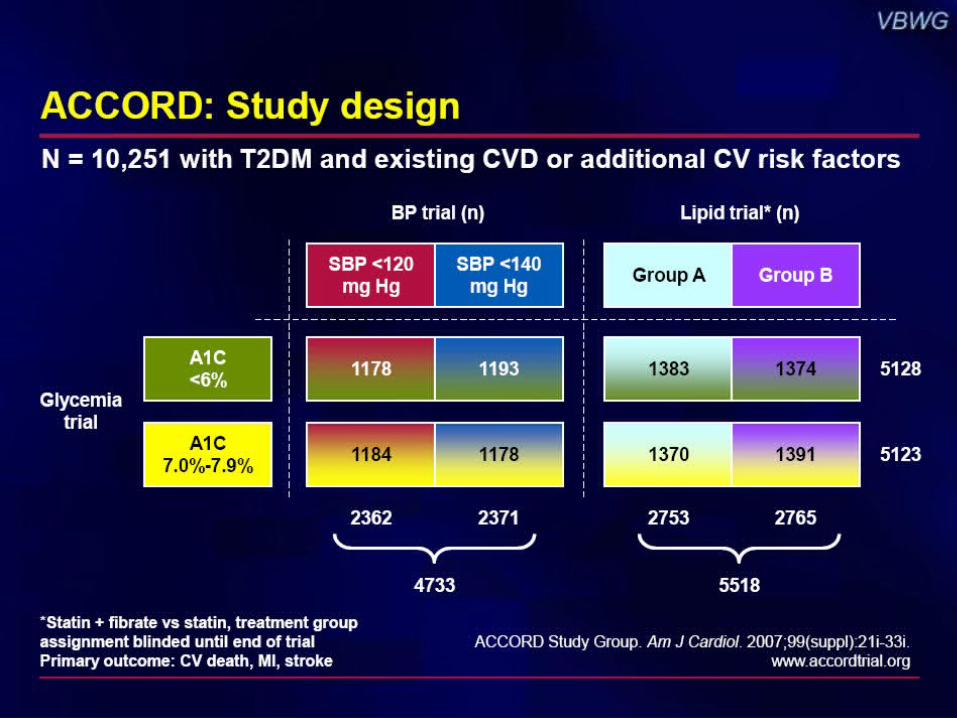
Differences between the ACCORD and ADVANCE studies Characteristic ACCORD ADVANCE
Baseline data •Participants, n 10 251 11 140
•Mean age (y) 62 66
•Duration of diabetes (median [ACCORD]/mean [ADVANCE]) (y)
10 8
•Mean HbA1C at baseline (%) 8.1 7.2
•History of macrovascular disease (%) 35 32
*The comparison between the intensive and the standard arms was significant. Adapted from the New England Journal of Medicine. ©2008 New England Journal of Medicine.
Dluhy RG and McMahon GT. N Engl J Med 2008; 358:2630-2633.
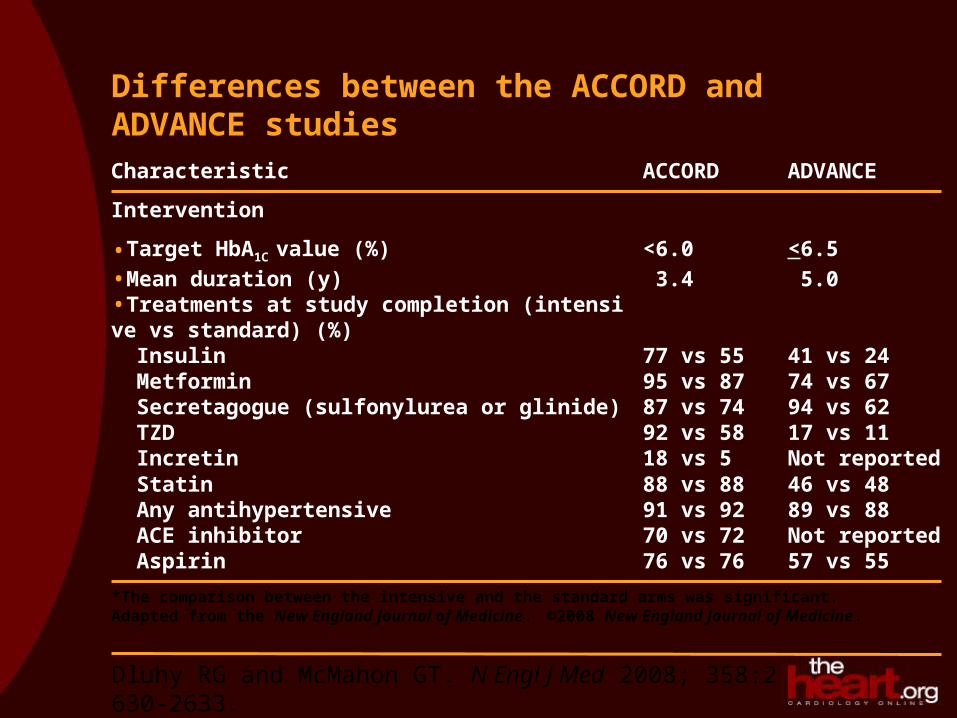
Differences between the ACCORD and ADVANCE studies Characteristic ACCORD ADVANCE
Intervention
•Target HbA1C value (%) <6.0 <6.5•Mean duration (y) 3.4 5.0•Treatments at study completion (intensive vs standard) (%) Insulin 77 vs 55 41 vs 24 Metformin 95 vs 87 74 vs 67 Secretagogue (sulfonylurea or glinide) 87 vs 74 94 vs 62 TZD 92 vs 58 17 vs 11 Incretin 18 vs 5 Not reported Statin 88 vs 88 46 vs 48 Any antihypertensive 91 vs 92 89 vs 88 ACE inhibitor 70 vs 72 Not reported Aspirin 76 vs 76 57 vs 55
*The comparison between the intensive and the standard arms was significant. Adapted from the New England Journal of Medicine. ©2008 New England Journal of Medicine.

Dluhy RG and McMahon GT. N Engl J Med 2008; 358:2630-2633.
Differences between the ACCORD and ADVANCE studies
Characteristic ACCORD ADVANCE
Outcome (intensive vs standard)
•Median HbA1C at study end (%) 6.4 vs 7.5* 6.4 vs 7.0*
•Death from any cause (%) 5.0 vs 4.0* 8.9 vs 9.6
•Death from cardiovascular cause (%) 2.6 vs 1.8* 4.5 vs 5.2
•Nonfatal MI (%) 3.6 vs 4.6* 2.7 vs 2.8
•Nonfatal stroke (%) 1.3 vs 1.2 3.8 vs 3.8
•Major/severe hypoglycemia (%/y) 3.1 vs 1.0* 0.7 vs 0.4
•Weight gain (kg) 3.5 vs 0.4 0.0 vs -1.0*
•Current smoking (%) 10 vs 10 8 vs 8
*The comparison between the intensive and the standard arms was significant. Adapted from the New England Journal of Medicine. ©2008 New England Journal of Medicine.

Comment on: 10-year follow-up of intensive glucose control in type 2 diabetes
Investigators: Holman RR, Paul SK, Bethel MA, Matthews DR, Neil HAW
Published: N Engl J Med. 2008;359:1577-1589

MethodsMethods
• UKPDS randomized 4209 participants with newly diagnosed Type 2 diabetes to intensive glucose therapy or conventional therapy (diet) for 10 years
• Intensive therapy=sulfonylurea or insulin (metformin in overweight participants)
• Sulfonylurea/insulin therapy significantly reduced the risk of any diabetes-related endpoint and microvascular complications but not macrovascular disease
• Metformin significantly reduced the risk of any diabetes-related endpoint, myocardial infarction, and all-cause mortality
• 3277 participants were monitored in the 10-year post-trial follow-up via annual clinical visits for first 5 years and annual questionnaires for last 5 years
UKPDS=United Kingdom Prospective Diabetes Study

2729 Intensive
with sulfonylurea/insulin
1138 (411 overweight) Conventional
with diet
342 (all overweight) Intensive
with metformin
4209
Randomization1977-1991
Mean age, 54 years(IQR 48-60years)
880 Conventional
2118Sulfonylurea/insulin
279 Metformin
Trial End 1997
Mean age62±8 years
2007No. with final year
data
379 Conventional
1010Sulfonylurea/insulin
136 Metformin
Mortality 44% (1852)Lost to follow-up 3.5%
(147)
Enrollment and outcomes Enrollment and outcomes

Mean HbAMean HbA1c1c levels (years 1-5 levels (years 1-5 post-trial)post-trial)
Differences in mean HbA1c between participants originally assigned to intensive or conventional therapy were lost by year 1 of post-trial follow-up. A: sulfonylurea/insulin vs conventional therapy; B: metformin vs conventional therapy

After 8.5 years (median) of post-trial follow-up
Aggregate Endpoint 1997 2007
Any diabetes-related endpoint RRR: 12% 9% P-value: 0.029 0.04
Microvascular disease RRR: 25% 24% P-value: 0.0099 0.001
Myocardial infarction RRR: 16% 15% P-value: 0.052 0.01
All-cause mortality RRR: 6% 13% P-value: 0.44 0.007
Relative risk reductions with Relative risk reductions with sulfonylurea/insulinsulfonylurea/insulin
RRR=relative risk reduction P-values calculated with use of log-rank test
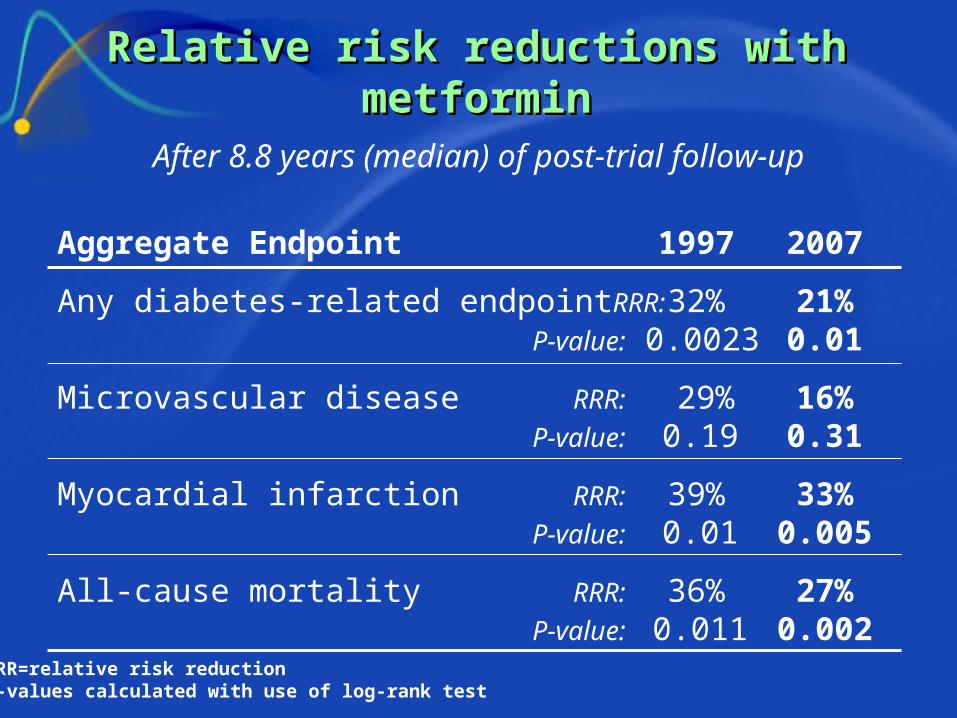
After 8.8 years (median) of post-trial follow-up
Aggregate Endpoint 1997 2007
Any diabetes-related endpoint RRR: 32% 21% P-value: 0.0023 0.01
Microvascular disease RRR: 29% 16% P-value: 0.19 0.31
Myocardial infarction RRR: 39% 33% P-value: 0.01 0.005
All-cause mortality RRR: 36% 27% P-value: 0.011 0.002
Relative risk reductions with Relative risk reductions with metforminmetformin
RRR=relative risk reductionP-values calculated with use of log-rank test

Clinical implicationsClinical implications
• The 10-year UKPDS follow-up observed a ‘legacy effect’ of intensive glucose therapy: continued vascular benefits despite loss of glycaemic differences from conventional treatment
• Sustained benefits were noted with sulfonylurea/insulin and metformin as intensive regimens
• Reductions in myocardial infarction and all-cause mortality, which had not been statistically significant in the original trial, became significant for the intensively treated participants during the post-trial
• UKPDS follow-up supports initiation of intensive glucose therapy as early as possible in course of diabetes

Goal of Treatment (1)- intensive goal
No significant hypoglycemia or other adverse effect of Tx.
Short duration of T2D, Long life expectancy No significant CVD
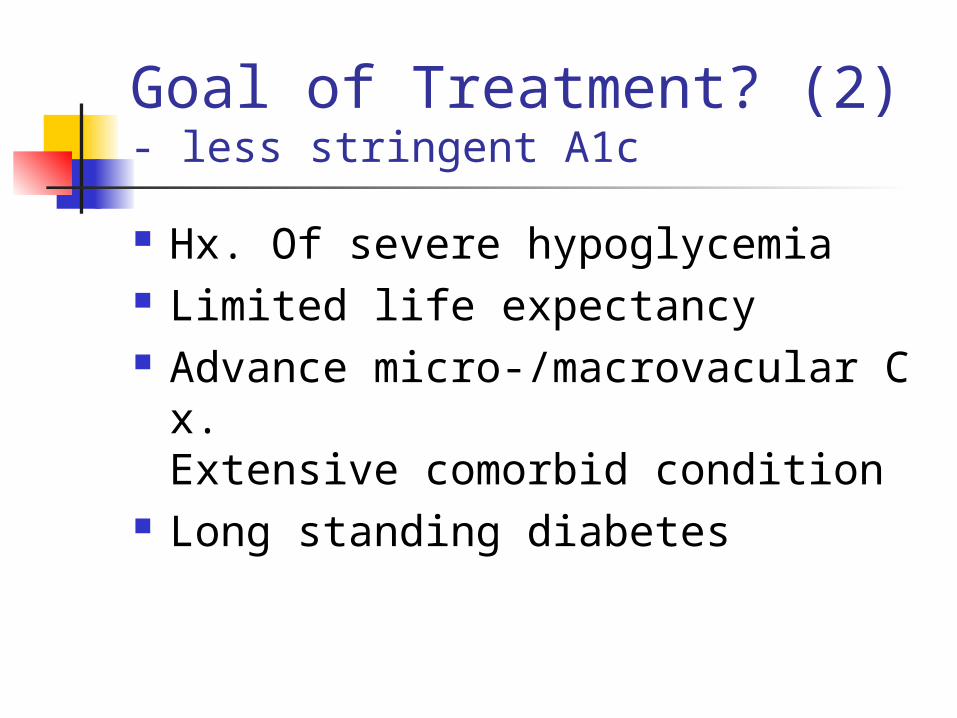
Goal of Treatment? (2)- less stringent A1c
Hx. Of severe hypoglycemia Limited life expectancy Advance micro-/macrovacular Cx.
Extensive comorbid condition Long standing diabetes

Monitoring Parameters for Control of Complications
Every visit Blood PressureFoot Exam (55% achieve goal)
_______________________________________________________
3-6 months A1C- Every 3 months if treatment changes or
not meeting goals- Every 6 months if stable
_______________________________________________________
Annual Dilated Eye Examination (63% achieve goal)Lipid Levels*Microalbumin
_______________________________________________________*Every 2 years if levels fall in lower risk categories

Reduce macrovascular complications Good glycaemic control LDL-Cholesterol <100 mg/dL (Statins) BP <130/80 mm Hg
(used by RAAS blockades) Weight loss ~5% to 10% body weight Aspirin No Smoking Realistic exercise (over 150hr/Wk)

Key message of Diabetic complications
Intensive glucose control? Restrictive BP control by using ACEIs
(<130/80) Stop smoking Control dyslipidemia Exams
(foot, OPH, Lab …) Aspirins
Top Related