


Languages
Pages
Legal

Closing the Data Gap between Simulation and Modal Test with Virtualized
Testing for an Improved FE Model Update
Joerg Sauera, Dhanushkodi Mariappanb, Matthias Schuesslera, Arend von der Liethc, Michael Stonec
a Polytec GmbH, Polytec – Platz 1-7, 76337 Waldbronn, Germany b TechPassion Technologies Pvt. Limited, 15-16 (Old No.2/7B) Yogi Gardens;
Pallipattu, Chennai 600113, India c Polytec Inc., 1046 Baker Road, Dexter, MI 48130, United States
1 ABSTRACT
FE model validation requires building prototypes and performing experimental modal analysis. The established
procedure for FE model validation requires leaving the CAE world, stepping into manual procedures for acquiring
the data for experimental modal analysis and feeding the results back into the CAE data chain.
A new approach is described, which allows to keep the CAE data chain also for the physical test. This approach
makes use of the properties of an optical laser vibration probing system combined with robotics. Optical methods
allow working with measurement grids which are derived from existing FE models of an object under test (OUT).
Being free from the constraints of physically mounted and cabled sensors, two major shortfalls of conventional
testing methods are overcome: the limited spatial density of measurement nodes and mass loading. Overcoming
those constraints, the MAC values between measurement and simulation are considerably improved which allows
for a much better quality of the FE validation.
The new method uses the object coordinate system from the FE model. An easy to perform alignment method
allows for matching the coordinate system of the OUT with the simulation. A robot program is generated
representing an envelope to the OUT. The robot moves along trajectories allowing a sensor system to cover the
full surface of the OUT. A 3-dimensional scanning laser Doppler vibrometer (SLDV) is used to acquire the full field
frequency response of the undistorted modes without mass loading from instrumentation.
The measurement is performed with three lasers pointing to the nodes of the measurement grid each from a
different direction, recording the vibration information along each of the three directions. Image processing
methods guarantee the three lasers to overlap on the structure. At the same time, deviations between the
coordinates from FE and the real geometry are recorded automatically. The FRFs are acquired directly at the
nodal points in the coordinate system of the OUT. The results of the subsequent experimental modal analysis can
be transferred to the CAE program without interpolation.
The contactless modal testing method makes use of and integrates into an existing CAE data pool of the
automotive industry. The method has proven to deliver datasets suitable for a more precise FE model update in
considerably shorter time compared to current procedures.
2 INTRODUCTION
In order to reduce costs and improve time-to-market, NVH studies today rely heavily on the simulation process.
Fewer prototypes are being built, which results in the need for significantly more thorough testing than in the past.
This requires improved test productivity, data reliability, density and accuracy.
Experimental modal analysis (EMA) is the test method to generate data required for the verification and the
update of Finite Element models. Although well established, EMA is traditionally a labor intensive process
requiring the attachment of accelerometers and cables to the object under test.
Meshes for FE calculations typically contain several thousands of nodes. Limited availability of accelerometer
channels and high sensor cost limit the number of simultaneous measurement points to around 10…100. For a
proper update of the FE model, a certain number of modes must be identified in the experimental data, therefore,
reasonable high Modal Assurance Criterion (MAC) values between simulated and measured modes should be
aimed.
In many cases, more locations should be measured than accelerometers or channels are available. For larger
objects the accelerometers are therefore moved to several sets of locations and the test is repeated. To keep the
overall dynamic conditions fixed, dummy masses can be used to replace sensor masses. The total masses need
to be taken into account, when validating the FE model. For some structures it is impossible to completely model
the effects of the added masses in the simulation.
The challenging task for the Noise, Vibration and Harshness (NVH) test lab is to acquire the necessary frequency
response functions (FRF) in the correct coordinate system at the optimum locations and in the right orientation. In
addition to the resulting time and cost constraints, the entire process of conventional measuring with
accelerometers is subject to human errors. The influence on the test results will be discussed in paragraph 5.
This paper describes a fully integrated testing system to provide feedback for updating and refining the CAE
models. The new method relies on the non-contact scanning laser Doppler vibrometry combined with robotics.
The development of the system was guided by the idea to fully automate the EMA process in order to significantly
increase the data quality combined with an increased throughput of the lab.
3 SCANNING LASER DOPPLER VIBROMETRY
A common approach for non-contact experimental modal analysis is scanning laser Doppler vibrometry (SLDV).
Scanning laser Doppler vibrometers, introduced in the 1980s [1], are systems for non-contact measurement of
vibration utilizing the optical Doppler effect, which causes a shift in the frequency of light backscattered from a
moving surface.
The frequency shift is given by the formula: Δf = 2v/λ (eq. 1)
Where λ is the wavelength of the laser, typically a visible HeNe laser operating at 632.8 nanometers and v is the
velocity of the surface.
Frequency decoding electronics produce a real-time output signal proportional to instantaneous velocity of the
surface relative to the sensor in the direction of the laser. Galvanometer-driven mirrors scan the laser over the
test surface in order to obtain vibration data at each predefined location. Because the vibrometer output is
directional and can be acquired, stored and processed in the same way as signals from an accelerometer, it is
possible, using FFT signal processing together with multi-channel data acquisition, to acquire all of the
information required for a modal analysis. Additional channels are used to simultaneously gather data from other
sources such as load cells, accelerometers, microphones.
A complete experimental modal analysis for model updating requires the vibration amplitude and phase spectra in
all three orthogonal axes of the test object’s coordinate system. It also needs to know the geometric shape of the
object under test and the exact coordinate location of each measurement. This information is provided by a three
dimensional SLDV which will be explained in paragraph 6.1.
4 CAE DATA CHAIN
The generation of FE models from the initial design of a component is the starting point for the NVH optimization.
Depending on the complexity regarding shape and material parameters a mesh is generated which ideally
represents the later prototype. The FE model should allow predicting the dynamic and durability parameters of
these components for a defined operating condition. In the discussed case the results of the modal analysis,
Eigen modes and Eigen frequencies need validation in an experimental modal analysis on the physical prototype.
The resulting data, deflection shapes, frequency response functions and – after modal extraction – experimental
mode shapes and damping values are used to update the FE model.
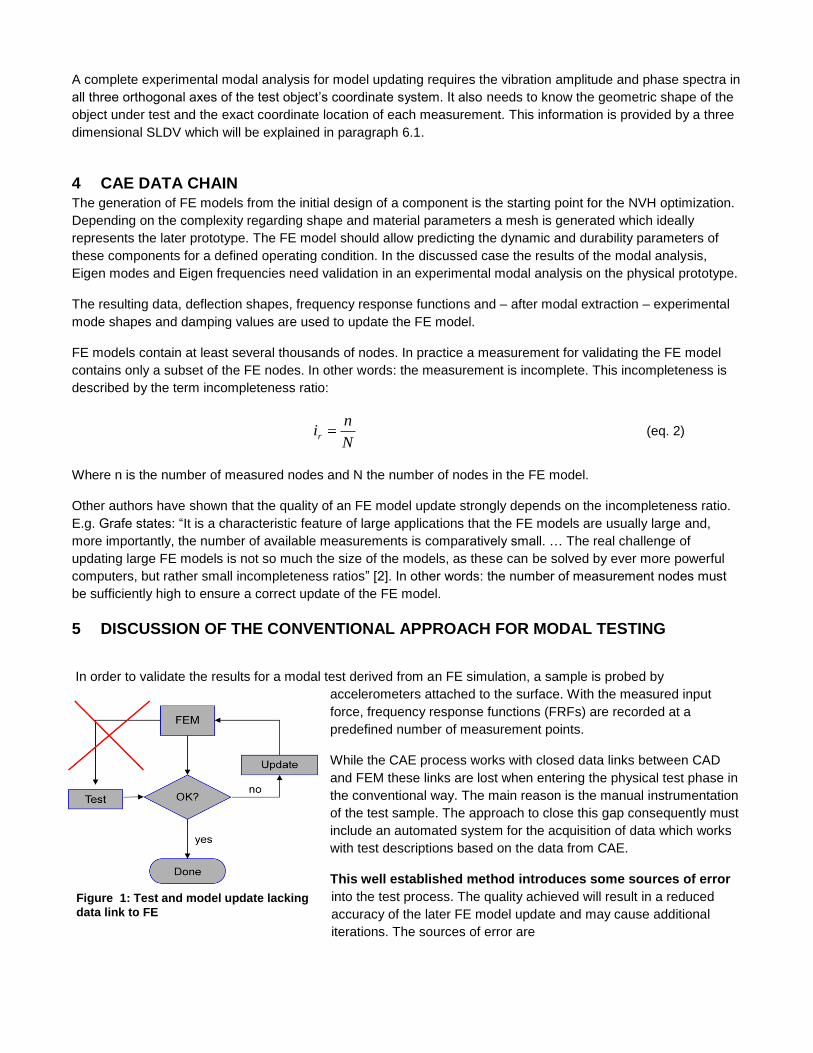
FE models contain at least several thousands of nodes. In practice a measurement for validating the FE model
contains only a subset of the FE nodes. In other words: the measurement is incomplete. This incompleteness is
described by the term incompleteness ratio:
N
nir (eq. 2)
Where n is the number of measured nodes and N the number of nodes in the FE model.
Other authors have shown that the quality of an FE model update strongly depends on the incompleteness ratio.
E.g. Grafe states: “It is a characteristic feature of large applications that the FE models are usually large and,
more importantly, the number of available measurements is comparatively small. … The real challenge of
updating large FE models is not so much the size of the models, as these can be solved by ever more powerful
computers, but rather small incompleteness ratios” [2]. In other words: the number of measurement nodes must
be sufficiently high to ensure a correct update of the FE model.
5 DISCUSSION OF THE CONVENTIONAL APPROACH FOR MODAL TESTING
In order to validate the results for a modal test derived from an FE simulation, a sample is probed by
accelerometers attached to the surface. With the measured input
force, frequency response functions (FRFs) are recorded at a
predefined number of measurement points.
While the CAE process works with closed data links between CAD
and FEM these links are lost when entering the physical test phase in
the conventional way. The main reason is the manual instrumentation
of the test sample. The approach to close this gap consequently must
include an automated system for the acquisition of data which works
with test descriptions based on the data from CAE.
This well established method introduces some sources of error
into the test process. The quality achieved will result in a reduced
accuracy of the later FE model update and may cause additional
iterations. The sources of error are
Figure 1: Test and model update lacking
data link to FE
The number of available sensors is limited. Thus one has to decide for the highest mode for the later
MAC analysis and the model update based on the test effort.
The correlation of the sensor position and the FE object coordinate system is basically lost. I.e. the
position and especially the orientation of the tri-axial sensors with their inherent x, y, z coordinate systems
have to be determined manually in order to match the object coordinate system.
Depending on the mass on the OUT the sensor mass including fixtures and cables is changing the
resonance frequencies of the structure. This effect can be compensated in the FE model by adding the
respective mass at the nodal points selected for the sensors. If the OUT cannot be measured in one set,
because the number of available acquisition channels is not sufficient, dummy masses can be used to
compensate for the sensor mass while the sensor is not mounted.
The sources of error become more significant the more lightweight and the more complex-shaped a structure is.
6 NEW MODAL TESTING APPROCH INTEGRATED IN THE CAE PROCESS
6.1 3-D LASER DOPPLER VIBROMETRY
As already stated, a laser Doppler vibrometer measures the vibration component in the direction of the laser
beam. With three laser vibrometers it is possible to determine the three-dimensional motion of a surface by
focusing three laser beams from three different, known directions onto the measurement point. Through a
coordinate transformation matrix, the measured data is transformed into a right-angled coordinate system. For
this to work it is not necessary to align the lasers at right angles to each other.
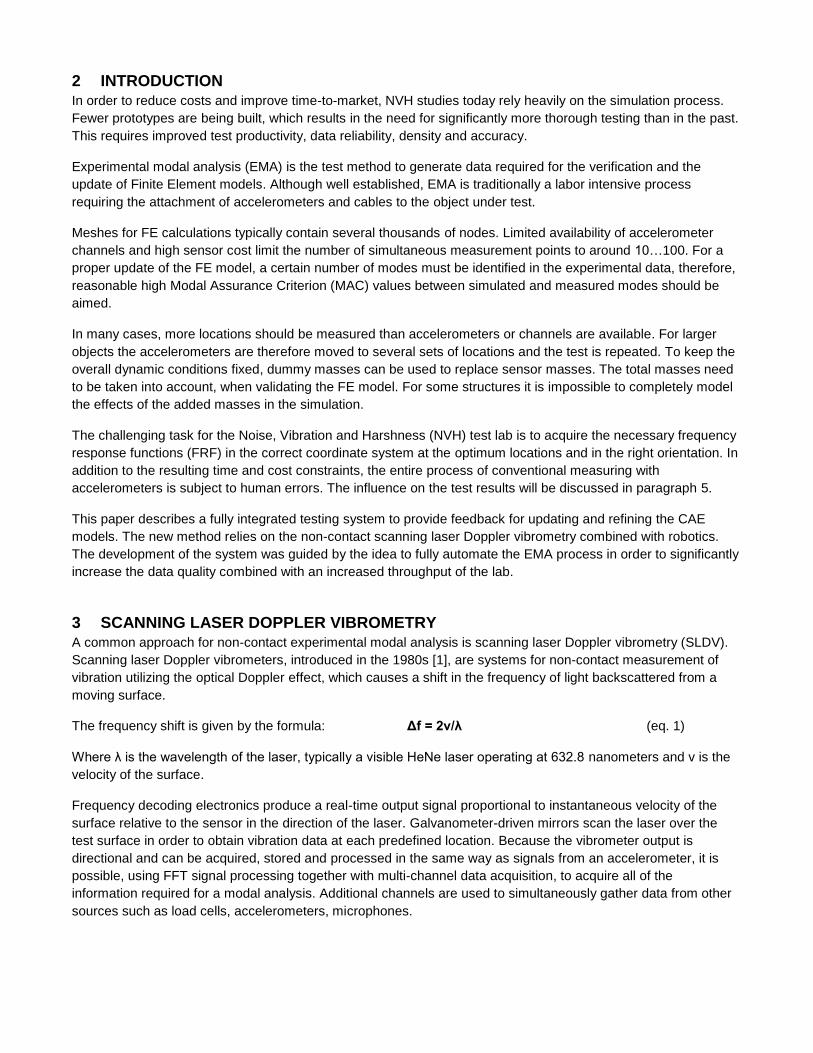
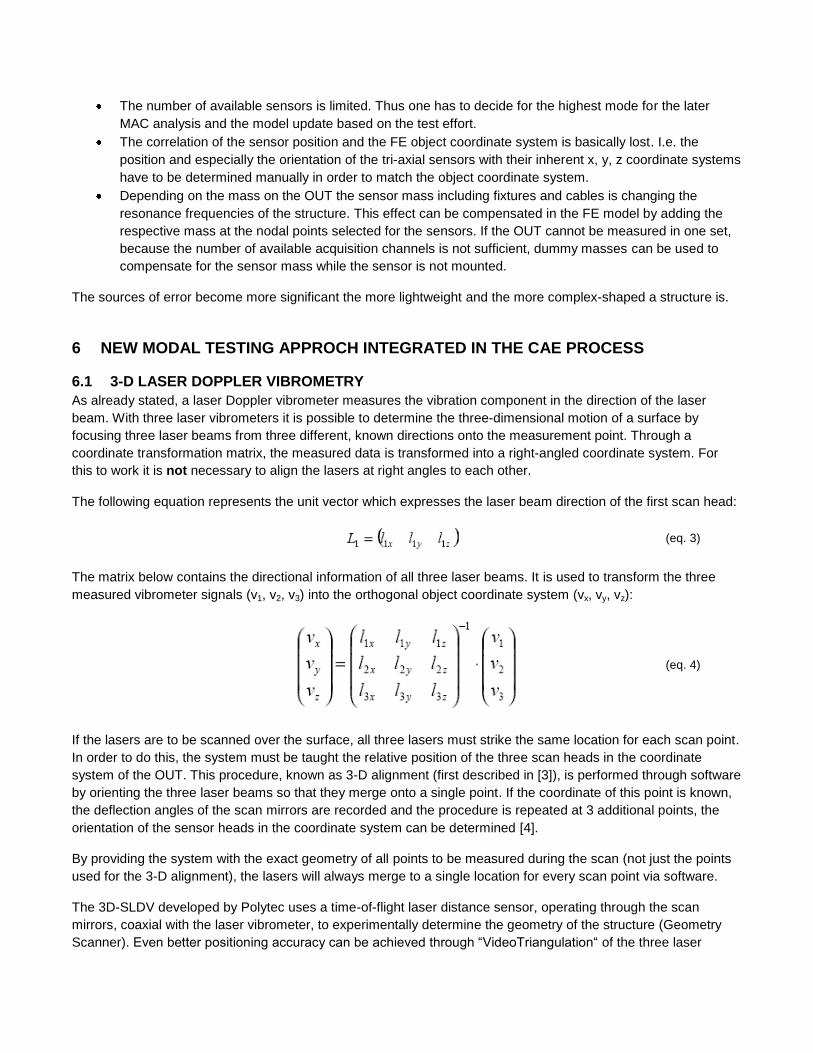
The following equation represents the unit vector which expresses the laser beam direction of the first scan head:
The matrix below contains the directional information of all three laser beams. It is used to transform the three
measured vibrometer signals (v1, v2, v3) into the orthogonal object coordinate system (vx, vy, vz):
If the lasers are to be scanned over the surface, all three lasers must strike the same location for each scan point.
In order to do this, the system must be taught the relative position of the three scan heads in the coordinate
system of the OUT. This procedure, known as 3-D alignment (first described in [3]), is performed through software
by orienting the three laser beams so that they merge onto a single point. If the coordinate of this point is known,
the deflection angles of the scan mirrors are recorded and the procedure is repeated at 3 additional points, the
orientation of the sensor heads in the coordinate system can be determined [4].
By providing the system with the exact geometry of all points to be measured during the scan (not just the points
used for the 3-D alignment), the lasers will always merge to a single location for every scan point via software.
The 3D-SLDV developed by Polytec uses a time-of-flight laser distance sensor, operating through the scan
mirrors, coaxial with the laser vibrometer, to experimentally determine the geometry of the structure (Geometry
Scanner). Even better positioning accuracy can be achieved through “VideoTriangulation“ of the three laser
(eq. 3)
(eq. 4)
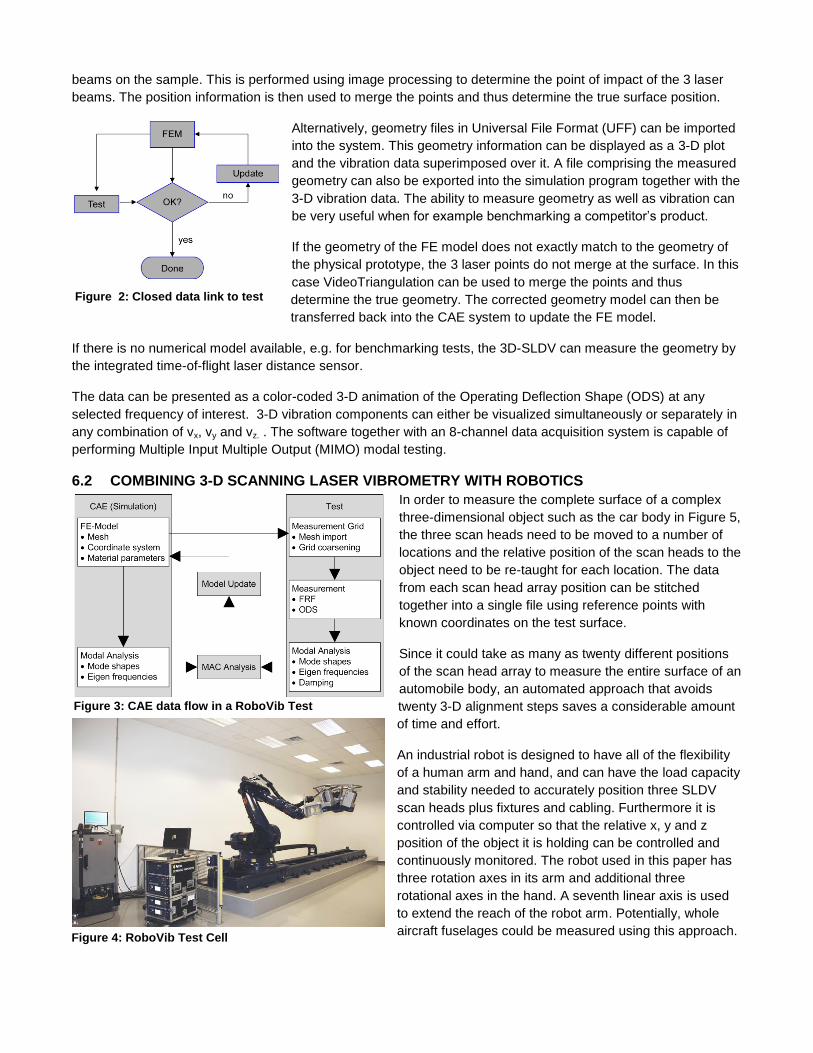
beams on the sample. This is performed using image processing to determine the point of impact of the 3 laser
beams. The position information is then used to merge the points and thus determine the true surface position.
Alternatively, geometry files in Universal File Format (UFF) can be imported
into the system. This geometry information can be displayed as a 3-D plot
and the vibration data superimposed over it. A file comprising the measured
geometry can also be exported into the simulation program together with the
3-D vibration data. The ability to measure geometry as well as vibration can
be very useful when for example benchmarking a competitor’s product.
If the geometry of the FE model does not exactly match to the geometry of
the physical prototype, the 3 laser points do not merge at the surface. In this
case VideoTriangulation can be used to merge the points and thus
determine the true geometry. The corrected geometry model can then be
transferred back into the CAE system to update the FE model.
If there is no numerical model available, e.g. for benchmarking tests, the 3D-SLDV can measure the geometry by
the integrated time-of-flight laser distance sensor.
The data can be presented as a color-coded 3-D animation of the Operating Deflection Shape (ODS) at any
selected frequency of interest. 3-D vibration components can either be visualized simultaneously or separately in
any combination of vx, vy and vz. . The software together with an 8-channel data acquisition system is capable of
performing Multiple Input Multiple Output (MIMO) modal testing.
6.2 COMBINING 3-D SCANNING LASER VIBROMETRY WITH ROBOTICS
In order to measure the complete surface of a complex
three-dimensional object such as the car body in Figure 5,
the three scan heads need to be moved to a number of
locations and the relative position of the scan heads to the
object need to be re-taught for each location. The data
from each scan head array position can be stitched
together into a single file using reference points with
known coordinates on the test surface.
Since it could take as many as twenty different positions
of the scan head array to measure the entire surface of an
automobile body, an automated approach that avoids
twenty 3-D alignment steps saves a considerable amount
of time and effort.
An industrial robot is designed to have all of the flexibility
of a human arm and hand, and can have the load capacity
and stability needed to accurately position three SLDV
scan heads plus fixtures and cabling. Furthermore it is
controlled via computer so that the relative x, y and z
position of the object it is holding can be controlled and
continuously monitored. The robot used in this paper has
three rotation axes in its arm and additional three
rotational axes in the hand. A seventh linear axis is used
to extend the reach of the robot arm. Potentially, whole
aircraft fuselages could be measured using this approach.
Figure 3: CAE data flow in a RoboVib Test
Figure 2: Closed data link to test
Figure 4: RoboVib Test Cell
The scan heads are fixed relative to the robot flange. The 3-D alignment procedure described above only needs
to be performed one time during installation in order to obtain the scan head positions and orientations relative to
the robot flange. The robot control software can automatically calculate from the robot’s coordinates the positions
and orientations of the scan heads relative to the test object at any time.
During installation, the 3-D alignment is performed on coordinates in the so called TOOL coordinate system. The
TOOL coordinate system is defined relative to the robot’s flange and moves together with the robot. The TOOL
position and orientation can be retrieved from the robot controller.
A second robot coordinate system called the BASE system is calibrated to coincide with the test object’s
coordinate system. This calibration uses all three lasers which, by moving the robot, are made to intersect at each
of several calibration points on the test object with known coordinates. The BASE coordinate system is calculated
from the robot positions and the corresponding object coordinates.
With 3-D alignment having been performed in the TOOL coordinate system and the BASE coordinate system
calibrated on the test object, the scan head positions in the test object’s coordinate system can be automatically
calculated for any robot position.
The geometry information can either be imported or measured using the integrated geometry laser.
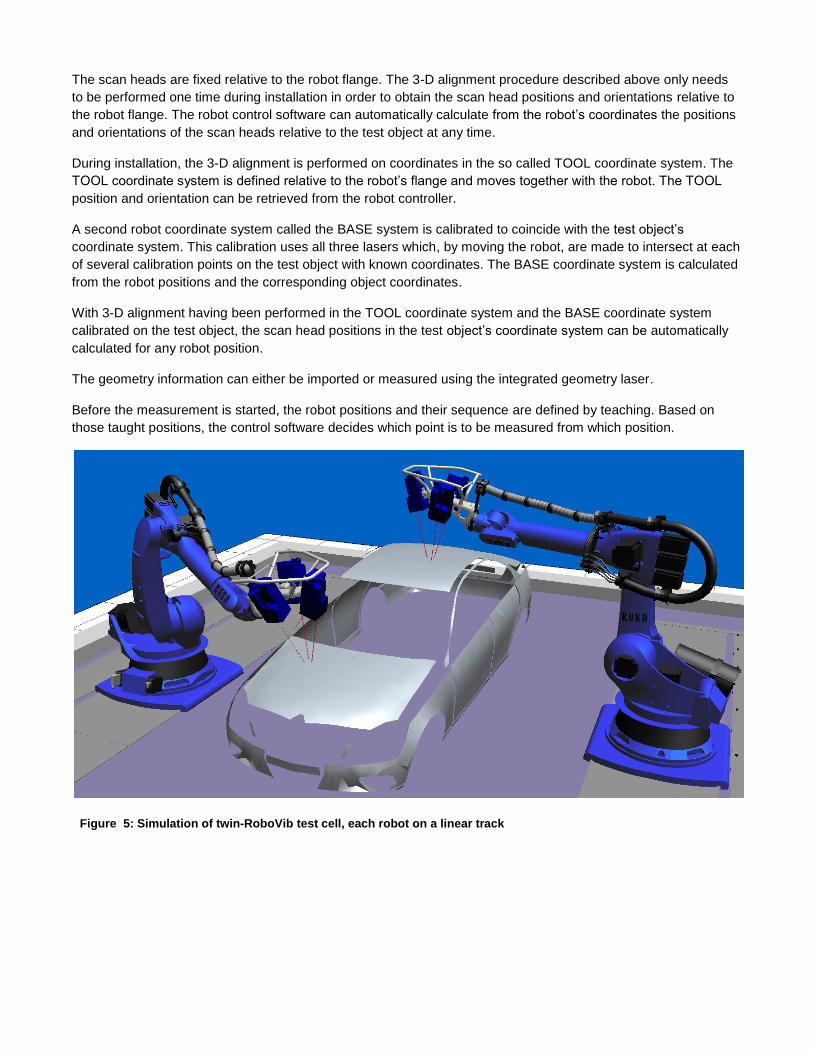
Before the measurement is started, the robot positions and their sequence are defined by teaching. Based on
those taught positions, the control software decides which point is to be measured from which position.
Figure 5: Simulation of twin-RoboVib test cell, each robot on a linear track
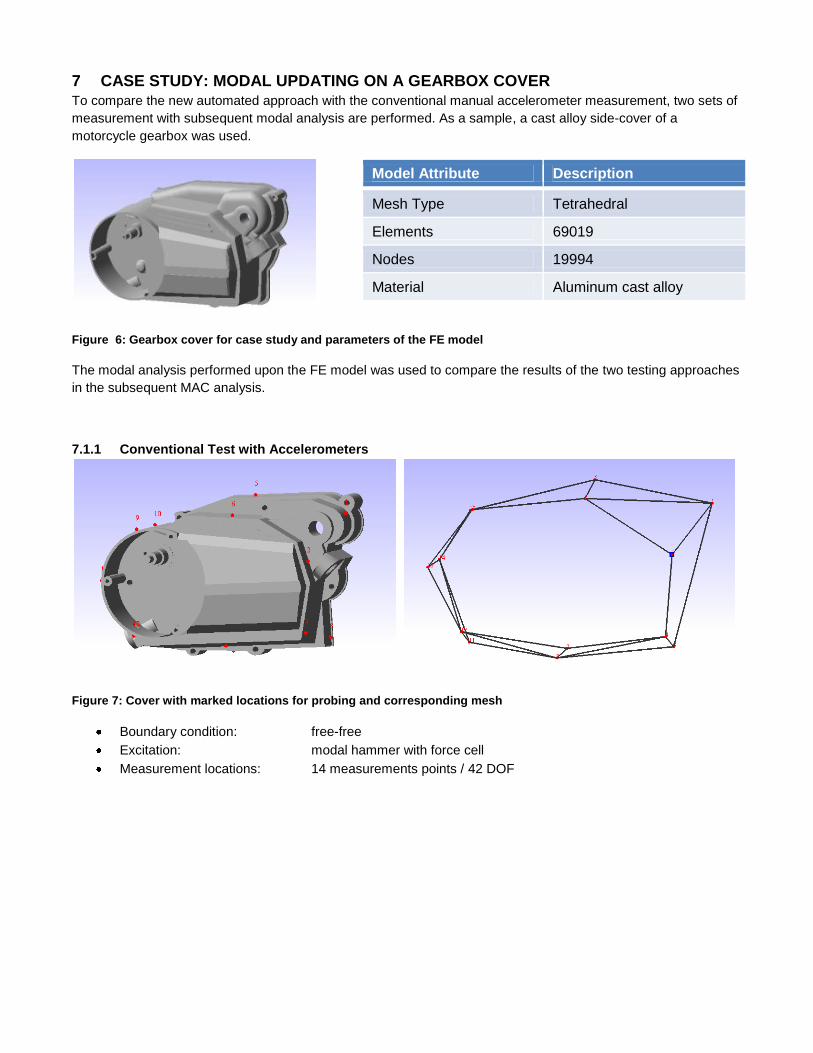
7 CASE STUDY: MODAL UPDATING ON A GEARBOX COVER
To compare the new automated approach with the conventional manual accelerometer measurement, two sets of
measurement with subsequent modal analysis are performed. As a sample, a cast alloy side-cover of a
motorcycle gearbox was used.
Model Attribute Description
Mesh Type Tetrahedral
Elements 69019
Nodes 19994
Material Aluminum cast alloy
Figure 6: Gearbox cover for case study and parameters of the FE model
The modal analysis performed upon the FE model was used to compare the results of the two testing approaches
in the subsequent MAC analysis.
7.1.1 Conventional Test with Accelerometers
Figure 7: Cover with marked locations for probing and corresponding mesh
Boundary condition: free-free
Excitation: modal hammer with force cell
Measurement locations: 14 measurements points / 42 DOF
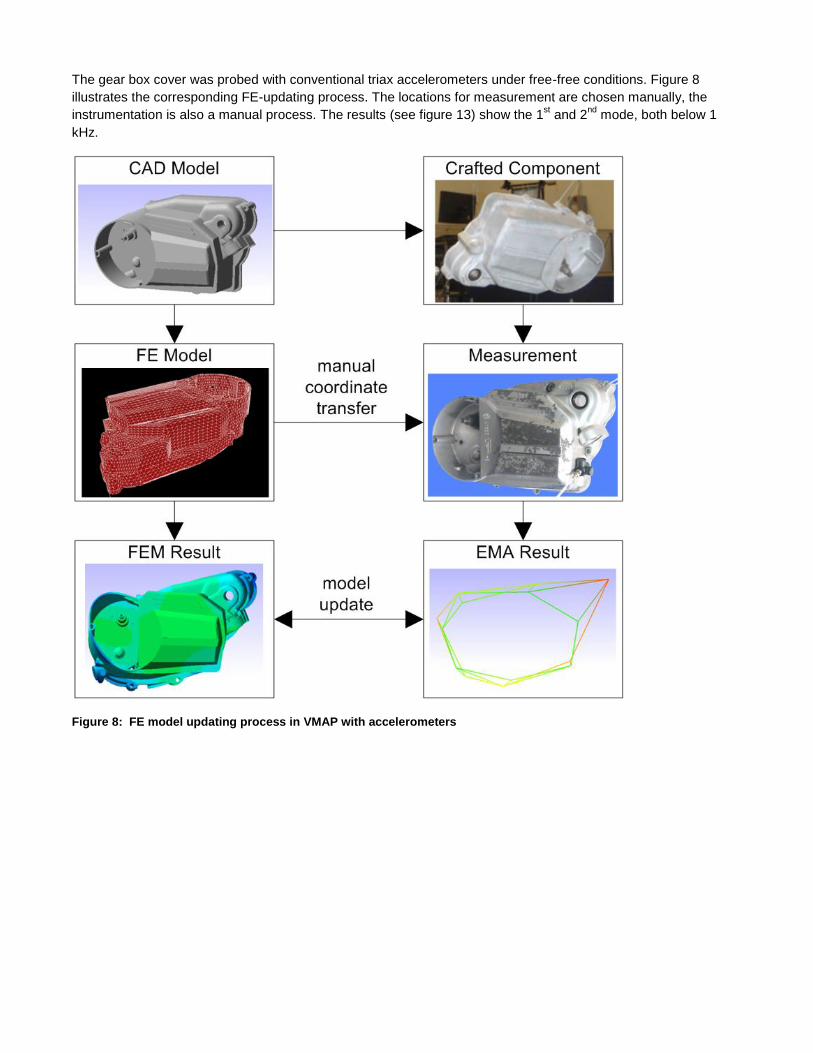
The gear box cover was probed with conventional triax accelerometers under free-free conditions. Figure 8
illustrates the corresponding FE-updating process. The locations for measurement are chosen manually, the
instrumentation is also a manual process. The results (see figure 13) show the 1st and 2
nd mode, both below 1
kHz.
Figure 8: FE model updating process in VMAP with accelerometers
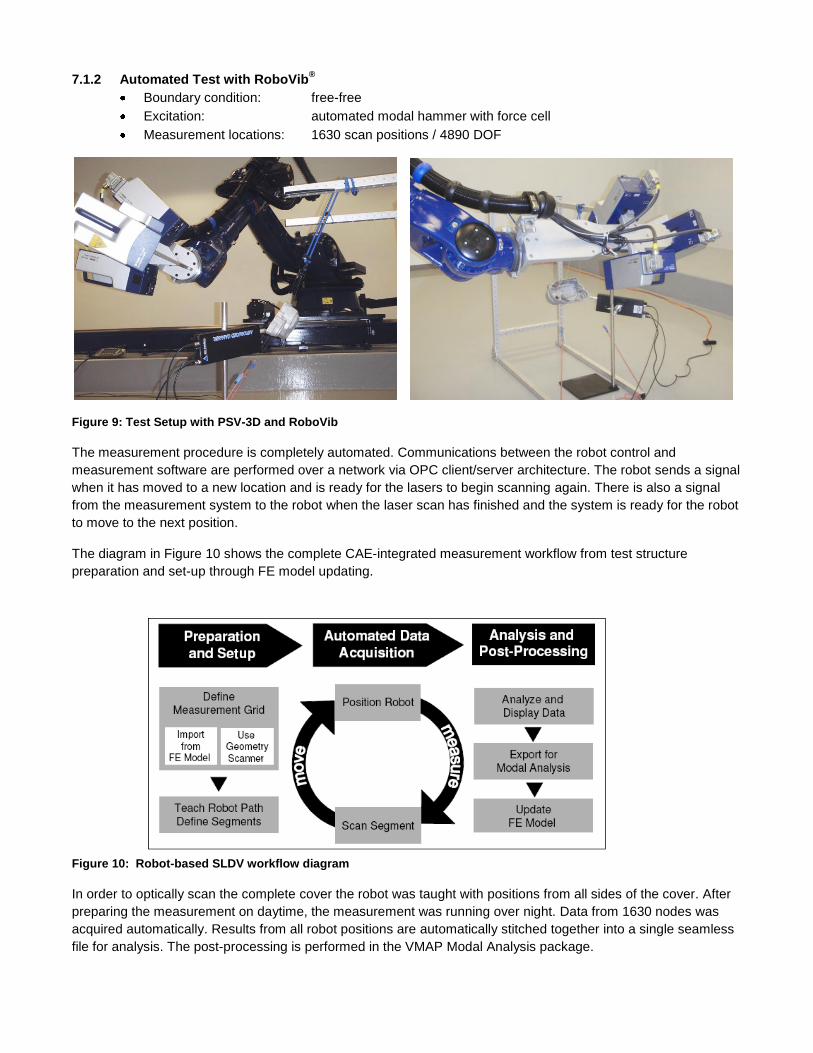
7.1.2 Automated Test with RoboVib®
Boundary condition: free-free
Excitation: automated modal hammer with force cell
Measurement locations: 1630 scan positions / 4890 DOF
Figure 9: Test Setup with PSV-3D and RoboVib
The measurement procedure is completely automated. Communications between the robot control and
measurement software are performed over a network via OPC client/server architecture. The robot sends a signal
when it has moved to a new location and is ready for the lasers to begin scanning again. There is also a signal
from the measurement system to the robot when the laser scan has finished and the system is ready for the robot
to move to the next position.
The diagram in Figure 10 shows the complete CAE-integrated measurement workflow from test structure
preparation and set-up through FE model updating.
Figure 10: Robot-based SLDV workflow diagram
In order to optically scan the complete cover the robot was taught with positions from all sides of the cover. After
preparing the measurement on daytime, the measurement was running over night. Data from 1630 nodes was
acquired automatically. Results from all robot positions are automatically stitched together into a single seamless
file for analysis. The post-processing is performed in the VMAP Modal Analysis package.
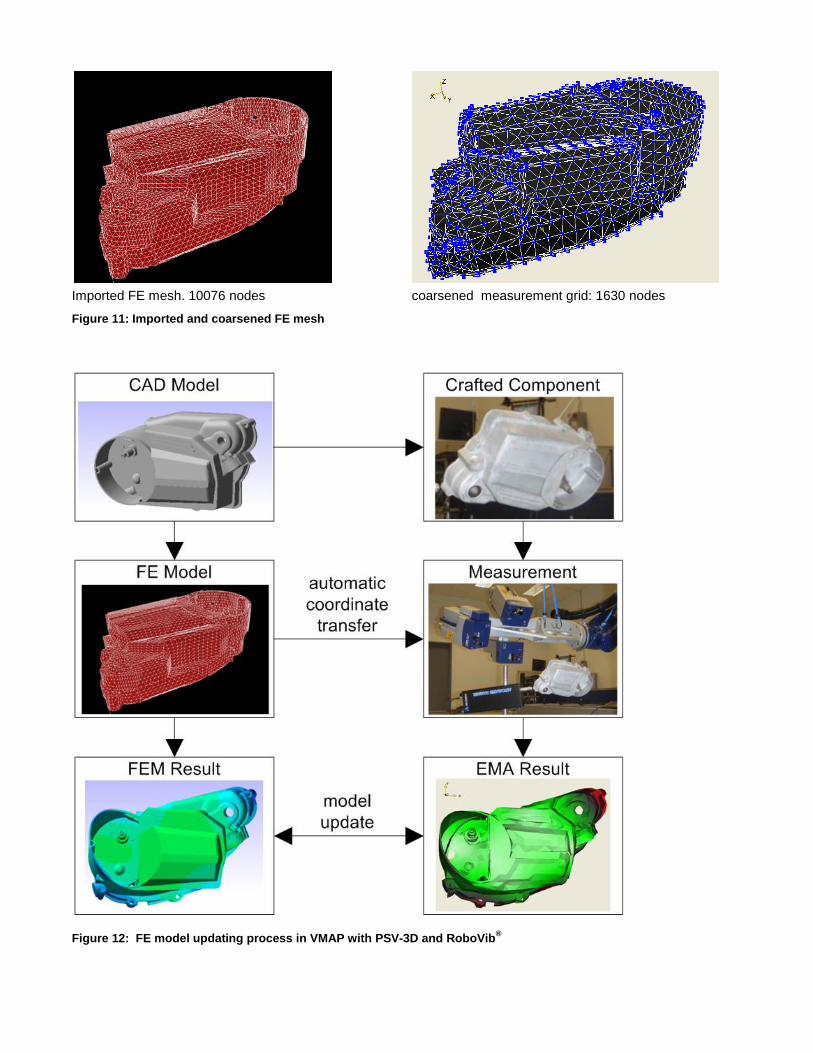
Imported FE mesh. 10076 nodes
coarsened measurement grid: 1630 nodes
Figure 11: Imported and coarsened FE mesh
Figure 12: FE model updating process in VMAP with PSV-3D and RoboVib®
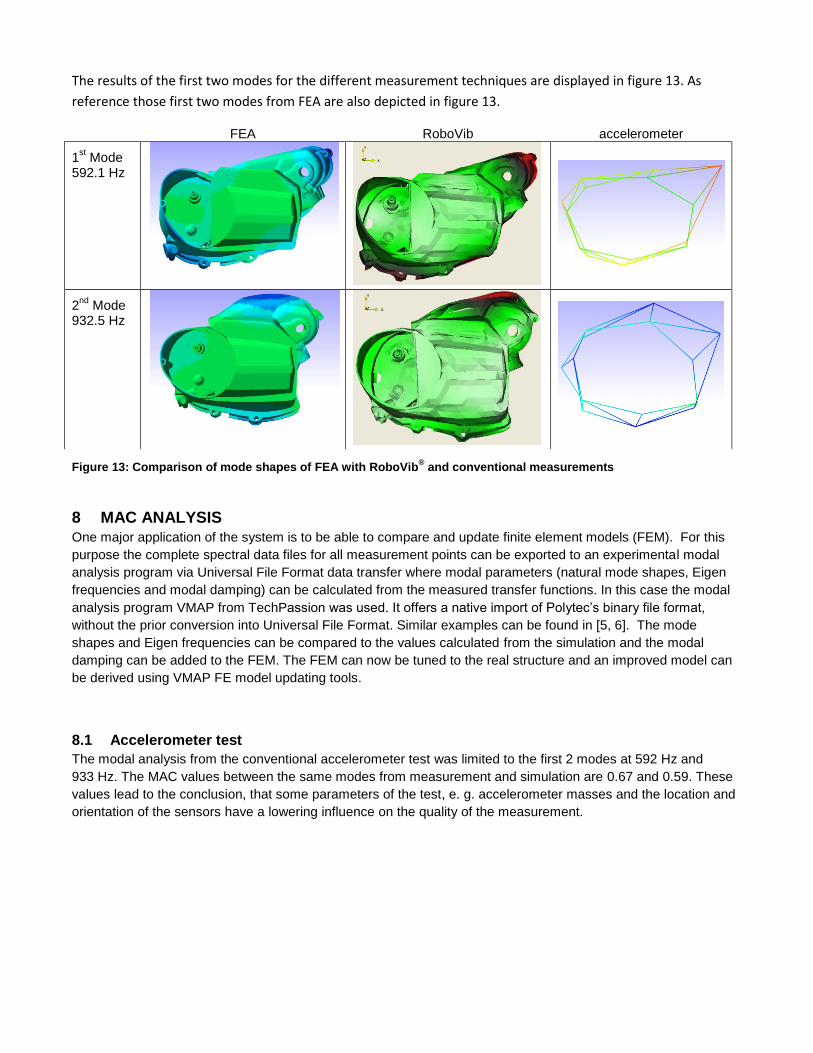
The results of the first two modes for the different measurement techniques are displayed in figure 13. As
reference those first two modes from FEA are also depicted in figure 13.
Figure 13: Comparison of mode shapes of FEA with RoboVib® and conventional measurements
8 MAC ANALYSIS
One major application of the system is to be able to compare and update finite element models (FEM). For this
purpose the complete spectral data files for all measurement points can be exported to an experimental modal
analysis program via Universal File Format data transfer where modal parameters (natural mode shapes, Eigen
frequencies and modal damping) can be calculated from the measured transfer functions. In this case the modal
analysis program VMAP from TechPassion was used. It offers a native import of Polytec’s binary file format,
without the prior conversion into Universal File Format. Similar examples can be found in [5, 6]. The mode
shapes and Eigen frequencies can be compared to the values calculated from the simulation and the modal
damping can be added to the FEM. The FEM can now be tuned to the real structure and an improved model can
be derived using VMAP FE model updating tools.
8.1 Accelerometer test
The modal analysis from the conventional accelerometer test was limited to the first 2 modes at 592 Hz and
933 Hz. The MAC values between the same modes from measurement and simulation are 0.67 and 0.59. These
values lead to the conclusion, that some parameters of the test, e. g. accelerometer masses and the location and
orientation of the sensors have a lowering influence on the quality of the measurement.
FEA RoboVib accelerometer
1st Mode
592.1 Hz
2nd
Mode 932.5 Hz
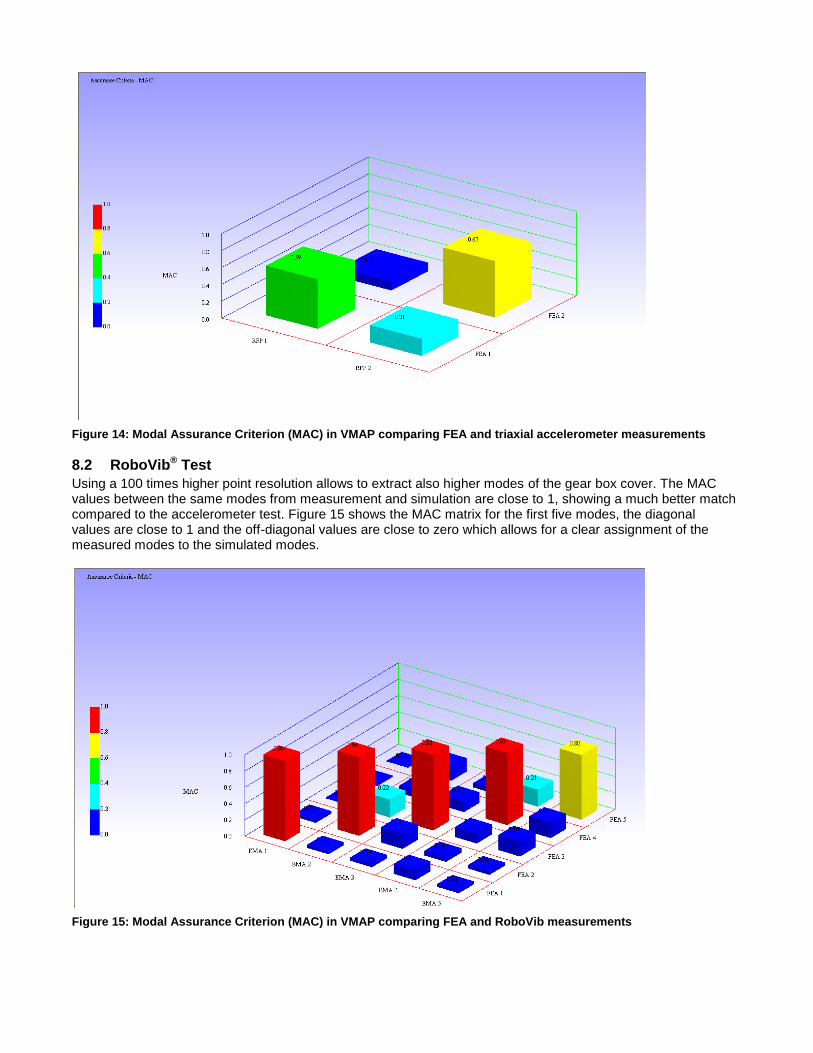
Figure 14: Modal Assurance Criterion (MAC) in VMAP comparing FEA and triaxial accelerometer measurements
8.2 RoboVib® Test
Using a 100 times higher point resolution allows to extract also higher modes of the gear box cover. The MAC values between the same modes from measurement and simulation are close to 1, showing a much better match compared to the accelerometer test. Figure 15 shows the MAC matrix for the first five modes, the diagonal values are close to 1 and the off-diagonal values are close to zero which allows for a clear assignment of the measured modes to the simulated modes.
Figure 15: Modal Assurance Criterion (MAC) in VMAP comparing FEA and RoboVib measurements
9 SUMMARY AND CONCLUSIONS
As stated before, measurements with the robot-based system presented here ensure that the measurement grids
correspond precisely with the FEM grids and conveniently allow automatically-generated FEM coordinates to
prepare the measurement points. This method eliminates a degree of complication and improves productivity.
The model updating can be more precise, faster and more efficient.
It can be expected that even with the same locations and no influence of the sensor mass the values from the
RoboVib test will deliver higher MAC values, due to the reduction of other sources of error like the orientation and
geometrical match of the results to the nodal points.
Incompleteness ratio is the ratio of the number of measurement data points and FEA nodes. The finite element
model updating algorithms perform best with high incompleteness ratio. In other words, it is important to use as
many measurement points as possible. But, this is a time-consuming process. The new RoboVib® scanning laser
Doppler vibration measurement system explained in this paper allows for one or two orders of magnitude higher
point numbers, and therefore, gives the maximum productivity and accuracy in the FEA-Test correlation and
model updating activity.
REFERENCES
[1] B. Stoffregen, A. Felske, Scanning Laser Doppler Analysis System, SAE Paper No. 850327, 1985. [2] H. Grafe, Model Updating of Large Structural Dynamics Models Using Measured Response Functions, A thesis submitted to the University of London for the degree of Doctor of Philosophy, 1998. [3] Xu, Y., Miles, R. N.: An Identification Algorithm for Directing the Measurement Point of Scanning Laser Vibrometers, Optics and Lasers in Engineering 22 (1995) 105-120 [4] Schüssler, M., Wörtge, M.: Survey of excitation signals, with respect to scanning vibrometer measurements, Third International Conference on Vibration Measurements by Laser Techniques: Advances and Applications, SPIE Vol. 3411, pp. 386-393, 1998 [5] Bouteille, F., Schüssler, M.: MIMO-testing on a car body using a three-dimensional scanning vibrometer, Proceedings of the ISMA2006 International Conference on Noise and Vibration Engineering, Leuven, Belgium, pp. 3157 – 3163 [6] Schell, J., Schüssler, M., Johansmann, M., Oliver, D., Palan, V.: Three Dimensional Vibration Testing in Automotive Applications Utilizing a New Non-Contact Scanning Method, Society of Automotive Engineers, 2006-01-1095
Top Related