


Languages
Pages
Legal


This report has been prepared by:
Jensen Planning + Design
Cit y of CharlCit y of CharlCit y of CharlCit y of Charles St urt es St urt es St urt es St urt
RRRResident ial esident ial esident ial esident ial GGGGrowt hrowt hrowt hrowt h ++++ CCCCharact er haract er haract er haract er SSSSt udyt udyt udyt udy
Summary Report
May 2011

Table of Contents
1 Overview ........................................... .................................. 1
2 Strategic Context ................................................................. 2
3 Constraints and Opportunities ............................................... 3
3.1 Roads and Traffic ........................................................................................................ 3 3.2 Cycling and Walking .................................................................................................... 3 3.3 Rail ........................................................................................................................... 4 3.4 Stormwater Management ............................................................................................. 4 3.5 Water Supply.............................................................................................................. 4 3.6 Waste water ............................................................................................................... 5 3.7 Electricity ................................................................................................................... 5 3.8 Gas ........................................................................................................................... 5 3.9 Climate Change .......................................................................................................... 5 3.10 Stormwater and Harvesting .......................................................................................... 6 3.11 Open Space................................................................................................................ 6 3.12 Heritage + Character................................................................................................... 6 3.13 Affordable Housing ...................................................................................................... 7
4 Location of Growth ............................................................... 7
5 Summary of Growth Targets for Charles Sturt based on The 30 Year Plan for Greater Adelaide............................................... 9
6 Future Social Infrastructure Requirements ........................... 11
7 Building Heights and Densities in Growth Areas .................... 12
7.1 TOD's ...................................................................................................................... 12 7.2 Transit Corridor......................................................................................................... 12 7.3 Road Corridor ........................................................................................................... 13 7.4 Activity Centres ........................................................................................................ 13
8 Recommended Policy Approaches ......................................... 14
8.1 Nominated Residential Growth Areas ........................................................................... 14 8.2 Policy Approaches in Existing Neighbourhoods Outside the Nominated Growth Areas ......... 16
9 Future Work Priorities ........................................................ 18

City of Charles Sturt Residential Growth + Character Study - Summary Report 1
1 Overview
This is a summary report of the six individual reports prepared for the City of Charles Sturt
Residential Growth and Character Study. This Study has been undertaken over by Jensen Planning
+ Design in collaboration with SGS Economics and Planning and Tonkin and Associates for the City
of Charles Sturt. The study examines future residential growth and character issues across the City
of Charles Sturt.
The first report prepared for this project - the Strategic Context Report, analyses population
trends, policy approaches and legislation within the State Government and the City of Charles Sturt
relating to residential growth and character.
The second report - Opportunities and Constraints summarises future population and housing
projections specific to Charles Sturt based on a range of population scenarios. It also summarises
major environmental, infrastructure and other opportunities and constraints to achieving future
housing growth.
The third report - Future Social Infrastructure Requirements, provides a broad overview of the
context and supply requirements of future social infrastructure needs across Charles Sturt.
The fourth report - Character and Form of Potential Growth Opportunities, provides
recommendations about the future character, form and extent of primarily residential growth in
areas that have been identified as having potential for increased residential density in the City of
Charles Sturt.
The fifth report - Development Plan Policy Analysis for Growth Areas assesses current Development
Policy relating to the identified residential growth areas. It proposes new residential design policy
and zoning changes for the identified residential growth areas that will inform a forthcoming
Residential DPA.
The sixth report - Review of Certain Historic Conservation Areas, reviews the zone boundaries and
policies for a number of existing Residential Character Zone (Historic Conservation Areas) Policy
Areas. It identifies opportunities for the refinement of the zone boundaries.
Summary of Key Residential Growth Challenges relating to the 30 Year Plan
• An additional (approximately) 20,960 dwellings should be provided in the City of Charles
Sturt by 2039 to meet the 30 Year Plan population growth targets
• In order to meet the 30 Year Plan policy directions, most of these dwellings (75% or nearly
14,000 dwellings) will be located within an 800 metre radius along corridors around
Centres. These corridors and centres include Bowden Transit Oriented Development (TOD),
Cheltenham/ Woodville TOD, West Lakes TOD, Seaton Centre, Albert Park Centre, Kilkenny
Centre, Fulham Centre, Henley Beach Centre, QEH Centre, Hindmarsh Centre, Arndale Centre,
Grange Road Corridor, Henley Beach Road Corridor, Woodville Road Corridor, Port Road
Corridor, and Torrens Road Corridor.

City of Charles Sturt Residential Growth + Character Study - Summary Report 2
• Given the priority given to residential intensification around corridors and centres, only 3,670
dwellings need to be located outside these areas. If past development trends across the City of
Charles Sturt of approx 120 dwellings per annum continue, there will be no need to
significantly increase residential development in neighbourhoods outside the
nominated growth areas.
2 Strategic Context
The Greater Adelaide 30 Year Plan details the State Government's aim to achieve significant
population growth targets by developing new residential areas in greenfield locations (30% of new
growth), and by increasing infill and population densities in existing urban centres (70% of new
growth).
The City of Charles Sturt will accommodate a substantial part of the increased population growth,
predominantly through infill and achieving higher densities in Transport Oriented Developments
and along key transport corridors. For the Western Region (including Charles Sturt, West Torrens
and Port Adelaide Enfield), the growth target is an additional 83,000 people by 2030.
Other key strategic documents are:
§ South Australian Strategic Plan (2007)
§ 30 Year Plan for Greater Adelaide (2010)
§ Directions for Creating a new Plan for Greater Adelaide (2008)
§ Draft Technical Report to 30 Year Plan for Greater Adelaide (2009)
§ Housing Plan for SA (2005)
§ Strategic Infrastructure Plan (April 2005)
§ South Australia Works in the Regions 2006-2009 Strategic Plan (2006)
§ Industrial Land Strategy for Metropolitan Adelaide (2007)
Infill opportunities (such as developing one current house site into two or three new dwellings) are
scattered throughout the Council area. However they are not likely to contribute significantly to the
growth target, and also brings little benefit to the community as a whole because they do not
provide the economies of scale to be able to provide additional services or infrastructure, and also
often detrimentally impact on the character of the neighbourhood.
It is likely that the majority of residential growth opportunities will be located around
TOD's, activity centres and transport corridors (roads and rail).
Council has a major role to play in influencing the design, sustainability and location of new
dwellings through a range of measures including planning policy, financial incentives, and legal
requirements.

City of Charles Sturt Residential Growth + Character Study - Summary Report 3
3 Constraints and Opportunities
In order to ensure that new residential growth is developed in the areas most suitable to
accommodate new populations (culturally, economically, environmentally), an understanding of the
key constraints and opportunities is required. This is described in detail in the Second Report
Constraints and Opportunities.
3.1 Roads and Traffic
Locations of potential concern include:
Port Road
§ Intersection of Port Road / Cheltenham Parade / West Lakes Boulevard. This intersection is
known to have limited capacity and we understand that DTEI have identified the need to
potentially upgrade the intersection at some time in the future. The Cheltenham, Albert
Park and West Lakes development areas will have the greatest impact on this intersection.
West Lakes
§ West Lakes Boulevard between Clark Terrace and Port Road. This section of road is only
one lane in either direction and connects West Lakes Boulevard to Port Road. It has
significant capacity limitations. The Albert Park and West Lakes development areas will
have the greatest impact on this road section.
Woodville Road, Woodville
§ The capacity of Woodville Road is limited due to its functionality in providing access to the
adjacent business and shopping precinct. Further consideration should be given to the size
of the Woodville development area and possible increased traffic demands on Woodville
Road.
Kilkenny Road/David Terrace, Kilkenny
§ The capacity of Kilkenny Road is limited due to its functionality in providing access to the
adjacent business and industrial land. Further consideration should be given to the size of
the Kilkenny development area and possible increased traffic demands on Kilkenny Road.
3.2 Cycling and Walking
There is opportunity to develop specific dedicated cycling and walking routes through the
Greenways policy initiative announced in the 30 Year Plan. This is anticipated to be a series of
connected linear routes (called Greenways) primarily alongside rail networks which meets open
space, accessibility, active living and biodiversity objectives.
City of Charles Sturt Residential Growth + Character Study - Summary Report 4
3.3 Rail
The extension of the existing light rail network to West Lakes is anticipated to be positioned along
West Lakes Boulevard.
The extension of light rail and train networks will improve access and provide an opportunity to
rezone land alongside the lines to higher density.
A key issue for many of the areas is how the interface between the tram line and dwellings will be
treated. Many areas in the City of Charles Sturt along train lines have important historic character.
The 30 Year Plan promotes Greenways along the lines which will be designated open spaces for
cycling and walking. However in many areas houses may back on to the tram lines and there will
be crime and safety challenges.
3.4 Stormwater Management
An extensive stormwater drainage network extends across the City of Charles Sturt to drain the
existing developed areas to a range of destinations including:
§ River Torrens
§ Coast
§ West Lakes; and
§ Gillman basins
The Council has previously identified that the network can be divided into 32 stormwater
catchments, each with its own unique characteristics and outfall.
In general, investment in the development of these stormwater networks occurred at around the
time of the development of the surrounding suburbs. In some locations, significant further
investment was made, particularly during the period between 1960-1980 to provide an improved
performance standard to serve the future development of these areas, as was expected at that
time. The Council is currently in the early stage of completing a series of strategic reviews
(catchment-based Stormwater Management Plans) to assess current performance standards and to
identify strategies that address not only issues of flood protection and likely future development,
but also to consider opportunities for water quality improvement (through Water Sensitive Urban
Design) and stormwater harvesting and reuse.
3.5 Water Supply
Charles Sturt Council area is located within the EL51 water supply pressure zone except for the
Clipsal site which is contained within the EL103 zone. All future development sites (indicated in
Report 2 Opportunities and Constraints) are located near large mains with some capacity to supply
increase demands. Minor augmentation works (ie mains duplication and/or relay of older mains)
may be needed to service proposed development. The scope of these works will be determined
when more detailed information is available on each development site.

City of Charles Sturt Residential Growth + Character Study - Summary Report 5
3.6 Waste water
Charles Sturt Council area falls into the Bolivar Waste Water Treatment Plant (WWTP) catchment
area. All future development sites (indicated in Report 2 Opportunities and Constraints) have the
potential to discharge into the current wastewater system without any further augmentation except
for the Kilkenny railway station TOD site.
3.7 Electricity
ETSA has stated generally there should not be many issues with network capacity and
augmentation in these areas. Augmentation rates for these sites are expected to be standard but
will be subject to the density of each residential development. There may also be changes as the
system develops. In terms of capacity, there is currently insufficient information provided for ETSA
to undertake meaningful assessment in each case and so each site is to be investigated on an
individual basis at project commencement.
3.8 Gas
APA has undertaken an assessment of gas opportunities and constraints across the Charles Sturt
Council Area. APA Group is Australia’s largest natural gas infrastructure business, owning and/or
operating more than $8 billion of gas transmission and distribution assets including across
Adelaide. Their advice is that the Charles Sturt gas infrastructure assets are ‘very mixed’ with
respect to the age and remaining capacity of the assets, and it is not possible to give a more
detailed picture about residential growth implications on gas assets at this stage.
3.9 Climate Change
Arguably, the most significant environmental issues to confront Charles Sturt Council in the next
100 years are inundation from seawater and stormwater, and the related matters of land
subsidence and sea-level rise as a consequence of both sea level rise as well as wetland
reclamation and groundwater extraction.
With respect to South Australia, the two councils that are potentially most at risk are Charles Sturt
and Port Adelaide Enfield. The Australian Government’s Climate Change Risks to Australia’s Coast
states that "between 8,850 and 14,100 residential buildings in the Charles Sturt Council Area may
be affected by sea-level rise by 2100, with the upper range representing over 30 per cent of all
current residential buildings within the Local Government Area".
The areas most at risk include Semaphore Park, West Lakes Shore, Tennyson, Queenstown, Royal
Park and West Lakes.

City of Charles Sturt Residential Growth + Character Study - Summary Report 6
3.10 Stormwater and Harvesting
Another significant environmental issue to confront Charles Sturt Council is increased stormwater
runoff due to an increase in housing densities and impervious surfaces. Recent mapping of the
1in100 ARI flooding event shows that numerous properties within the Growth Corridors,
particularly along Port Road adjacent Woodville, will be vulnerable to up to 100% flooding of the
site. Increased densification of dwellings has the potential to increase the area of land covered by
impervious structures and surfaces leading to increased run-off and localised flooding.
3.11 Open Space
There are some gaps in provision, and also issues such as the quality of a large number of
reserves, including facility/asset and landscape quality. Some areas such as Fulham Gardens,
Kidman Park and West Lakes Shore have a high level of open space provision. In general, an
increase in residential densities around Seaton, Albert Park and Cheltenham are likely to further
exacerbate the current gap in open space provision in those areas. Any new development must be
considered in the terms of opportunities for open space and greenways provision. The City of
Charles Sturt is currently investigating approaches to the provision of open space in new
development areas.
3.12 Heritage + Character
There are a number of areas which have a strong and highly valued character or heritage assets.
Many of these are around the railway stations along the Outer Harbor rail line.
In general, it is anticipated that the broader community would not wish to see these areas
significantly change to accommodate higher density dwellings. Indeed, the State Government has
recognised that character and heritage in these areas are significant constraints to achieving
greater residential densities and have lowered their residential growth targets accordingly.
There may be some opportunities to sensitively design dwellings around these areas on a case by
case basis. However at this stage the heritage and character areas presented in Pennington,
Cheltenham, Woodville, Kilkenny environs, Henley Beach and Grange are seen as areas where it is
not appropriate to change the character of the built form in order to achieve higher residential
densities.
It is suggested that there are significant opportunities elsewhere across the City of Charles Sturt to
achieving higher residential densities, and the costs of losing built form that is highly valued by the
community does not outweigh the benefits that would be gained from relatively minor increases in
dwelling numbers if these areas were developed.

City of Charles Sturt Residential Growth + Character Study - Summary Report 7
3.13 Affordable Housing
The SA Government has introduced a target for all new significant developments to include 15%
“Affordable Housing”, including 5% special needs. The Department for Planning and Local
Government has established a generic set of planning modules related to affordable housing which
are used to inform and guide Development Plan Amendments.
4 Location of Growth
The 30 Year Plan has provided growth targets for the Western Region; and has broken the growth
residential growth locations up into" Centres and Corridors", and "Areas Outside Centres and
Corridors". Centres and Corridors are the main activity centres where significant employment,
shopping, retailing, commercial and civic uses are located. Corridors are nominated main roads and
train/tram lines.
Locations of growth in Centres and Corridors are shown in the map on the following page. They will
include:
• Bowden (High Order TOD)
• Cheltenham/ Woodville (High Order TOD)
• West Lakes (High Order TOD)
• Seaton (Nodal Centre)
• Albert Park (Nodal Centre)
• Kilkenny (Nodal Centre)
• Fulham Gardens (Centre)
• QEH (Specialist Centre)
• Hindmarsh (Centre)
• Arndale (Centre)
• Grange Road (Corridor)
• Henley Beach Road (Corridor)
• Woodville Road (Corridor)
• Port Road (Corridor)
• Torrens Road (Corridor)
Within Centres and Corridors, some areas are more easily to develop than others - these are the
Core Areas which are the areas that are already underutilised or vacant or ready for
redevelopment. However many of the land parcels in these areas identified for future residential
growth are generally in individual private ownership and to achieve quality planned development
on a larger scale that can build in WSUD and stormwater management, appropriate levels of open
space, sustainable building approaches and other key planning goals, amalgamation of allotments
would be desirable.
Some other areas outside these core growth areas will also experience future growth - these will
include Housing SA Areas, Seaton, Findon, Kidman Park, and Ridleyton.

City of Charles Sturt Residential Growth + Character Study - Summary Report 8

City of Charles Sturt Residential Growth + Character Study - Summary Report 9
5 Summary of Growth Targets for Charles Sturt based on The 30 Year Plan for Greater Adelaide
In total
An additional (approximately) 20,960 dwellings should be provided in Charles Sturt by 2039 to
meet the 30 Year Plan population growth targets.
Residential Growth Within Centres and Corridors
Approximately 82% of this growth (17,290 dwellings) will be located in "Centres" and "Corridors".
25% of the "Centres and Corridor" growth (4,035 dwellings) will be within the "core areas" of
these TOD's/Centres (the core areas are the areas immediately adjacent to Centres and Corridors
which are currently vacated, non residential or underutilised. This portion of the growth does not
necessarily extend to the 800 metre radius around the centres and corridors as currently proposed
by the State Government). These areas should be relatively easily converted to housing.
75% of the "Centres and Corridor" growth (13,978 dwellings) will need to be located along
corridors and in the wider (800m) radius around the Centres. This is likely to be a challenge.
Residential Growth Outside Centres and Corridors - in the Remaining Residential Areas
Only 3,670 dwellings need to be located in the "areas not in Centres and Corridors". This means
that the ongoing development of approximately 120 dwellings per annum distributed generally
across the suburbs but not located in the centres or along train/tram lines or corridors). Based on
previous development trends this should be achievable.

City of Charles Sturt Residential Growth + Character Study - Summary Report 10
Anticipated Dwelling and Population requirements for Charles Sturt based on The 30
Year Plan for Greater Adelaide Objectives
CENTRES +
CORRIDORS
WESTERN
REGION
GOAL
CHARLES
STURT
GOAL
CORE AREAS
(KNOWN TO BE
CURRENTLY
VACANT OR
UNDERUTILISED)
WIDER
AREAS
AROUND
CORE AREAS
(800 m
RADIUS)
High order TODs
(Clipsal, Cheltenham/
Woodville, West Lakes)
19,820
persons
14,860
persons
(75%)
6,390 persons 8,470 persons
(4,035
dwellings)
Centres (Seaton, Albert
Park, Kilkenny,) +
Corridors
38,820
persons
19,410
persons
(50%)
2,400 persons 17,010
persons
(8,100
dwellings)
Other 5,080
persons
2,030
persons
(40%)
SUB TOTAL 63,720
persons
36,300
Persons
(17,290
dwellings)
8,790 persons
(4,185
dwellings)
25,480
persons
(12,135
dwellings)
AREAS NOT IN
CORRIDORS AND
CENTRES
Key Regeneration
Areas (Housing SA
Areas, Findon, Kidman
Park, Ridleyton)
5,080
persons
2,030
persons
(40%)
Minor Redevelopment 14,200
persons
5,680
persons
(40%)
SUB TOTAL 19,280
persons
7,710
persons
(40%)
(3,670
dwellings)
TOTAL 83,000
persons
44,010
persons
(20,960
dwellings)

City of Charles Sturt Residential Growth + Character Study - Summary Report 11
Level Facility Facilities by
2021 Facilities by
2031
Land area
sqm max
estimate
Local Childcare Centre (long day care) & Kindergarten 1 1 5,000 Community Centre/Multipurpose Hall 1 2 10,000 Primary and Secondary School - Public 0 0 - Youth Centre 0 0 -
District Aged Care Service/ Respite 36 beds 93 beds, 1 nursing home
5,000
Branch Library 0 1 5,000
Medium scenario - additional requirements
6 Future Social Infrastructure Requirements
Key local infrastructure facilities that have been assessed for Charles Sturt are Community Cultural
Infrastructures (Child Care Centre, Community Centre / Multipurpose Hall, Youth Centre, District
Facility Branch Library) and Education Infrastructure (Primary School + Secondary School – public).
Two population scenarios were considered to assess future need - a medium population scenario and
a high population scenario (2 million by 2050). These population scenarios are described further in
Report 2 Opportunities and Constraints. The maximum expected need for land to sustain the
anticipated services by 2031 is 25,000 sqm (2.5 ha) for the medium scenario (Figure 2).
Figure 1. Socia l Inf ras tructure Needs in Char les Stur t , Medium Populat ion Scenar io (2006 - 2031)
Figure 2. Socia l Inf rastructure Needs in Char les Stur t , 2 mi l l ion by 2050 Populat ion Scenar io (2006 - 2031)
Level Facility Facilities by
2021 Facilities by
2031 Land area sqm
(max estimate)
Local Childcare Centre (long day care) & Kindergarten 1 2 10,000 Community Centre/Multipurpose Hall 2 4 20,000 Primary and Secondary School - Public 0 1 70,000 Youth Centre 0 1 10,000
District Aged Care Service/ Respite 66 beds, 1 small nursing
home
251 beds, 2 nursing homes
10,000
Branch Library 1 2 10,000
High scenario - additional requirements

City of Charles Sturt Residential Growth + Character Study - Summary Report 12
7 Building Heights and Densities in Growth Areas
Increased growth may relate to both increases in density as well as increases in height. Typically,
people perceive increased density to equate to "high rise". There are clearly many built form
alternatives that are not necessarily high rise buildings. A major public education and consultation
programme will be required over a long period of time before the South Australian communities
begin to better understand, and start to more fully embrace, increased residential densities.
The following are summaries of the recommended levels of densities and height throughout areas
within the Council area. Since this report, DPLG has released Planning Policy Reforms - Proposed
zone modules and related general provisions, February 2011, Draft for Consultation that addresses
the issue of building heights in these areas. We note that DPLG’s proposed building heights vary
from the recommendations in this report. Below is a summary of both DPLG and this report’s
recommended building heights for the consideration of the City of Charles Sturt. This report’s
recommended building heights are shown in orange textboxes and DPLG’s proposed building
heights for the equivalent zones are shown underneath in green text boxes. There are many
similarities.
7.1 TOD's
Major TODs - Jensen Planning + Des ign Recommendat ion
<200m from rail station/centre: medium rise 5-10 storeys, high density
200-400m from rail station/centre: low-medium rise 2-4 storeys, medium density
400-800m from rail station/centre: low rise up to 2 storeys, low-medium density
Urban Core Zone - DPLG's Recommendat ion
<400m from rail station/centre: 4-10 storeys (Core Area)
400-800m from rail station/centre: 2-4 storeys (Transition Area)
7.2 Transit Corridor
Major Trans i t Corr idor - Jensen Planning + Des ign Recommendat ion
<100m of rail stations/transit shops: medium rise 4-5 storeys, high density
100-200m from rail stations/transit shops: low-medium rise 2-3 storeys, medium density
200-800m from rail stations/transit shops: low rise 2 storeys, low-medium density

City of Charles Sturt Residential Growth + Character Study - Summary Report 13
Suburban Act iv i t y Node Zone
<400m from rail station/centre: 3-6 storeys (Core Area)
400-800m from rail station/centre: 2-3 storeys (Transition Area)
7.3 Road Corridor
Road Corr idor - Jensen Planning + Des ign Recommendat ion
<60m from road: medium rise 4-5 storeys, high density
<60-200m from road: low-medium rise 2-3 storeys, medium density
<200-400m from road: low rise 2 storey, low-medium density
Urban Corr idor Zone - DPLG Recommendat ion
Abutting road corridor: minimum 3-4 storeys
<400m: maximum 4 storeys
7.4 Activity Centres
Act iv i t y Centres - Jensen Planning + Des ign Recommendation
Within and <200m from Centre: medium rise 3-5 storeys, medium-high density
200-400m from Centre: low-medium rise 2-3 storeys, medium density
Urban Core Zone
<400m from rail station/centre: 4-10 storeys (Core Area)
400-800m from rail station/centre: 2-4 storeys (Transition Area)

City of Charles Sturt Residential Growth + Character Study - Summary Report 14
8 Recommended Policy Approaches
8.1 Nominated Residential Growth Areas
As already stated, in order to achieve the residential targets outlined in the 30 Year Plan for
Greater Adelaide, a significant proportion of the expected future residential growth within the
Council area will occur in targeted growth areas (e.g. corridors, TODs and other infill sites).
This will necessitate rezoning of much of the lower density Residential Zones in the Council area
that are located in these targeted growth areas (other than the Character Area Zones which are
proposed to remain intact). Specific zoning boundaries will be explored during forthcoming DPA’s.
Department of Planning and Local Government have recommended a suite of policy approaches for
these recommended growth areas in their current BDP modules. Other recommendations in the
Residential Growth + Character Study include suggested design guidelines for:
§ Open Space
§ Aircraft Impacts
§ Interface Areas
§ Sustainability
§ Dwelling Sites
§ Fencing
§ Hammerhead Development
§ Multi Storey Apartments
§ Affordable Housing
§ Walking and Cycling
§ Water Sensitive Urban Design (WSUD)
§ Coastal Development
§ Flooding
§ Parking
A summary of other issues relating specifically to areas that will experience increases in residential
density include:
Mixture of Land Uses
A mixture of land uses is important in revitalising centres and road corridors (being Port, Torrens,
Henley Beach and Grange Roads). Mixed use developments have the benefits of increasing the
vibrancy of centres by bringing together a range of activities throughout a larger spread of hours
throughout the day and week. Successful mixed use developments can increase housing,
employment, business and investment choice and represent a more efficient use of land and
infrastructure. When integrated with public transport services mixed use development can reduce
car dependency through providing for multi-purpose trips (ACC, 2008).
City of Charles Sturt Residential Growth + Character Study - Summary Report 15
Setbacks
It is important that buildings have no or minimal setbacks to public roads and public spaces so that
they frame these spaces as a continuous and cohesive built form edge. Retaining a degree of
human scale is important in maintaining pedestrian comfort and building form should define lower
and higher land use elements through the introduction of a base podium for non-residential land
uses. Residential land uses on the higher levels should be transitioned by stepping the building
back slightly, as well as utilising different materials and finishes. There should be sufficient
setbacks between buildings to provide usable semi-private space as an outlook for occupants.
Built Form Design Techniques
There is scope for a range of contemporary and bold building designs, particularly within landmark
locations, which can facilitate the achievement of an identity to TODs, activity centres and
particular corridors.
It will also be necessary to utilising a range of design techniques to break down building massing
and bulk.
Ease of Movement
Access to affordable and accessible public transport is a critical factor for many people, particularly
the elderly as it can assist in maintaining independence and gain easy access to key services.
Making movements through our urban environment easier and more efficient also has substantial
economic benefits with improvements in the movement of people and goods reducing running
costs generally.
Transit oriented development has a principal focus on alternative modes of transport to private
vehicles. This requires a move away from the car dominated models of inward focussed, single use,
low rise centres surrounded with large areas of at grade car parking.
Parking
Accommodating vehicles is still important in the success of a vibrant mixed use TOD or activity
centre, particularly with regard to convenient shopper parking and drop-off zones adjacent public
transport stops/stations.
The provision of bicycle parking facilities is important in encouraging this form of transport within
and around the growth areas.
High Quality Public Realm
The public realm, be it in the form of an open space, plaza, footpath or shared use area, plays a
critical role in ensuring an active and vibrant activity centre. Ideally, the public realm should
facilitate a range of functions and activities, catering for a wide variety of users and times of the
day.
Safety
Increasing safety, particularly outside of retail and office hours is another aim and challenge of
revitalising activity centres and road corridors. Safety is increased with activity and the presence of
people, highlighting the importance of activation of building frontages adjacent public spaces,
pedestrian routes, train stations and bus stops. Land uses that have high interactivity with

City of Charles Sturt Residential Growth + Character Study - Summary Report 16
pedestrians should be located in key positions, particularly where they extend the nature of activity
beyond normal business hours.
Comfort and Sociability
Use of public areas will also require the provision of comfortable areas for pedestrians to walk,
shop, socialise and relax. The form of buildings and street furniture play an important part in
providing this comfort, particularly for all year weather protection.
Landscaping
Landscaping across the entire activity centre is important in providing an attractive and unified
identity to the centre as well as softening the hard edges created by built form. As the desire is for
a compact urban form, with reduced setbacks, opportunities for additional landscaping can be
limited. This places greater importance on creating boulevards, laneways and malls with high
quality landscaping finishes, particularly street trees, linked with water sensitive urban design
techniques for irrigation.
Sunlight and Ventilation
Both access to natural sunlight and natural ventilation assist with maintaining a reasonable degree
of thermal comfort without reliance on mechanical systems.
Views
The increased height of buildings within growth areas provides opportunities to take advantage of
views.
Outdoor Living Areas
The improvements in vitality and activity within the public realm provide an alternative recreation
and entertainment forum for occupants of dwellings within the core areas of the growth corridors..
Interface
Given the number and mixture of uses desired within TODs, activity centres and road corridors, the
management of the interface between these uses is important, not only to provide a suitable level
of amenity for sensitive uses, such as residential development, but also to secure the more
intensive activities that are likely to have noise, odour or traffic impacts.
8.2 Policy Approaches in Existing Neighbourhoods Outside the Nominated Growth Areas
It is noted that the State Government, through the 30 Year Plan for Greater Adelaide, proposes
that 80% of the existing metropolitan area will remain largely unchanged as a result of the Plan
(page 72). However the Plan has not yet been made clear whether keeping the character of those
areas "largely unchanged" is intended to mean that existing densities will be retained or the
existing zoning regime will be retained.
There are therefore two main policy approaches that could be applied to those areas within the
Council area that are not part of the targeted growth areas:

City of Charles Sturt Residential Growth + Character Study - Summary Report 17
1. Retain the Existing Policy Intent of these Areas
The main existing Policy Areas within the Residential Zone that will not be affected by the
targeted growth areas are the Mid Suburban, Western Edge and West Lakes General Policy
Areas. These Policy Areas provide for limited growth, which is currently generally taking place
in the form of demolitions and replacement with one house for two or sometimes one house for
three (semi-detached and group dwellings). This is generally seeing replacement of a medium
size house on a large block with two large houses on two smaller blocks.
The policy implication of this is that, over the long term, the vast majority of the Council area,
apart from the Residential Character Zone, will be replaced by new homes on generally small
(or smaller) allotments. The Residential Character Zone will provide for generally slightly
larger allotments (family housing), while high densities will be located in all of the growth
areas.
2. Restrict Increasing Densities in Areas Outside the Growth Areas
An alternative policy approach would see a further restriction of urban infill in the areas outside
of the growth areas (or part thereof), largely affecting parts of the Mid Suburban and West
Lakes General Policy Areas. It is suggested that the Western Edge Policy Area provisions could
be retained given that this Policy Area is promoting new housing in areas close to the coast.
In order to protect family housing, apart from family homes in the Residential Character Zone,
new policies could be developed that, for example, require infill housing sites to be of a larger
size in order that more comprehensive and better designed new housing can result. This would
largely require site amalgamation (other than for existing larger sites), and would therefore
dampen redevelopment activity in these areas. However, it would result in both the protection
of family housing and limited higher quality infill development on larger sites.
In the context that so much of the Council area lies within the growth areas (due to the
number of corridors, TOD sites and other infill development sites within the Council area), such
a policy approach could be justified and would be more consistent with the 30 Year Plan for
Greater Adelaide policy that the neighbourhood character of 80% of the metropolitan area will
remain unchanged.

City of Charles Sturt Residential Growth + Character Study - Summary Report 18
9 Future Work Priorities
As identified, there are many areas that have potential to accommodate increased growth. Some
areas will contribute more significantly to meeting the 30-Year Plan Growth Targets (eg: around
Activity Centres, TOD's and Major Transit Corridors) than other areas (eg: small scale infill sites
scattered throughout the suburbs).
The growth priorities will be primarily determined by:
1. The 30-Year Plan for Greater Adelaide (which has already identified and commenced work on
Bowden Village, and Woodville Village)
2. Government commitment towards infrastructure initiatives (including DTEI's rail electrification
initiative, and Housing SA's initiatives such as Woodville West Neighbourhood Renewal)
3. Inner City Dwelling Yield, DPLG
4. Planned private investment that is already known by Council
5. Infrastructure capacity and costings
6. Land size and/or ability to amalgamate sites
The recommended general work programme associated with DPA's for each growth "area" is
described in detail in Report 4 - Extent, Character and Form of Potential Growth Opportunities, and
is summarised in the diagram on the following page.
11. Henley Precinct Master Plan, Structure and Precinct Plan & DPA 12. Henley Beach Road Corridor Structure and Precinct Plan & DPA

This report has been prepared by:
Jensen Planning + Design
Cit y of Charles St urtCit y of Charles St urtCit y of Charles St urtCit y of Charles St urt
Resident ial Growt hResident ial Growt hResident ial Growt hResident ial Growt h + Charact er St udy+ Charact er St udy+ Charact er St udy+ Charact er St udy
Report 1 Strategic Context
May 2009


Table of Contents
1 Executive Summary.................................. ............................. 1
2 State Government Policy Context ........................................... 3
2.1 30 Year Plan for Greater Adelaide.................................................................................. 3 2.1.1 Location of Growth ......................................................................................... 3
2.2 Population Targets ...................................................................................................... 6 2.3 State Government Requirements Relating to Affordable Housing ....................................... 7
2.3.1 Legislative Context......................................................................................... 7 2.3.2 Affordable Housing Better Development Plan Module ........................................ 10 2.3.3 Affordable Housing – Criteria ......................................................................... 10
3 Local Government Policy Context ......................................... 12
3.1 City of Charles Sturt Community Plan (2008)................................................................ 12 3.1.1 Medium and High Density Housing ................................................................. 12 3.1.2 Housing Diversity and Affordability................................................................. 13 3.1.3 Ageing Population, Heritage and Character and the Economy ............................ 13
3.2 City of Charles Sturt Section 30 Development Plan Review Recommendations (2008)........ 13 3.2.1 Residential Areas Character Study.................................................................. 13
3.3 City of Charles Sturt Industrial Land Study (2008) ........................................................ 14 3.4 City of Charles Sturt Flood Mapping and Stormwater Management Plans .......................... 14 3.5 Community Health Report (2009)................................................................................ 15 3.6 City of Charles Sturt Residential Character Studies (1998) ............................................. 15 3.7 City of Charles Sturt Open Space Strategy ................................................................... 16 3.8 Towards One Planet Living - Greening the Western Suburbs 2008 - 2013......................... 16 3.9 City of Charles Sturt Traffic Management Study ............................................................ 17 3.10 City of Charles Sturt Transport Strategy....................................................................... 17
4 Demographic Profile and Trends - Overview .......................... 18
4.1 Community Profile..................................................................................................... 20 4.2 Population by age...................................................................................................... 23 4.3 Country of Birth ........................................................................................................ 25 4.4 Migration.................................................................................................................. 26 4.5 Income, Housing Rent and Repayments ....................................................................... 26 4.6 Employment and labour force ..................................................................................... 27 4.7 Disabilities................................................................................................................ 28 4.8 Family composition.................................................................................................... 28 4.9 Households in Private Occupied Dwellings .................................................................... 30 4.10 Households by Dwellings Structure Type ...................................................................... 31 4.11 Tenure..................................................................................................................... 34 4.12 Population Projections................................................................................................ 36
5 Housing Trends - Drivers of Housing Demand ........................ 41
5.1 Housing affordability.................................................................................................. 41
5.2 Ageing of Population.................................................................................................. 44 5.3 Decreasing Household Sizes ....................................................................................... 47 5.4 Migration.................................................................................................................. 47
6 Appendix 1: State Government Policy Directions and Implications For Future Growth ........................................... 49
7 Appendix 2 City of Charles Sturt Policy Directions and Implications for Future Growth ............................................ 61
Figures
Figure 1. Proposed Locations for the Western Region in relation to TOD's, Activity
Centres and Corridors as identified in the 30 Year Plan for Greater Adelaide .......... 5 Figure 2. * Population Targets for the Western Region in relation to TOD's, Activity
Centres and Corridors..................................................................................... 7 Figure 3. Statistical Local Area by Suburbs............................................................ 19 Figure 4. Study Area in the City of Charles Sturt, its SLAs and Suburbs .................... 20 Figure 5. Population and Population Change (in %), 2001 - 2006............................. 21 Figure 6. Population and Population Change by Suburbs of Charles Sturt (Count and
%), 2001 - 2006.......................................................................................... 21 Figure 7. Population by Age (in %)2006 ............................................................... 23 Figure 8. Population Change by Age Group in Charles Sturt (count); 2001 - 07 ......... 24 Figure 9. Ageing of Population, Change in number of persons aged <35 and 65 and
over (in %), 2001 - 2006.............................................................................. 24 Figure 10. Population by Country of Birth (top 5), 2006 ........................................... 25 Figure 11. Place of Usual Residence 1 Year and 5 Years Ago *in % of Total Population,
2006 26 Figure 12. Key Income and Housing Cost Indicators (in $), 2006............................... 27 Figure 13. Unemployment Rate and Labour Force Participation, 2006......................... 27 Figure 14. Family Composition of Family Households in Charles Sturt (count and % of
families), 2006 ............................................................................................ 28 Figure 15. Family Household Composition in Charles Sturt and SLA's (in % of Family
Households), 2006 ....................................................................................... 30 Figure 16. Households in Occupied Private Dwellings (count or % Dwellings), 2006 ..... 31 Figure 17. Dwellings by Structure Type (Count, %) ................................................. 32 Figure 18. Dwellings structure type by household category in Charles Sturt (in % of all
dwellings), 2006 .......................................................................................... 33 Figure 19. Change in household propensity to occupy dwellings structure types in Charles
Sturt (% point), 1996 - 2006......................................................................... 34 Figure 20. Tenure types of occupied private dwellings in Charles Sturt and Adelaide
(count, %), 2006 ......................................................................................... 35 Figure 21. Rented private occupied dwellings by operator (in % of all rented dwellings),
2006 36 Figure 22. Population projections South Australia (number of residents), 2001 - 2031 . 38 Figure 23. Population projections Adelaide SD, 2001 - 2021 ..................................... 38

Figure 24. Projected population change in Charles Sturt (persons), 2001 - 2021 ......... 40 Figure 25. Changes in public, community and total social housing stock by
State/Territory (number of dwellings), 1996-2006 ........................................... 41 Figure 26. Projected ageing of population in Adelaide SD (count and % of population
change), 2001 - 2021 (medium scenario) ....................................................... 46 Figure 27. Projected population change in SLAs of Charles Sturt (persons, medium
scenario), 2001 - 2021 ................................................................................. 46


City of Charles Sturt Residential Growth + Character Study - Report No 1 Strategic Context 1
1 Executive Summary
This report is the first report prepared for the Residential Growth and Character Study. This Study
has been undertaken by Jensen Planning + Design in collaboration with SGS Economics and
Planning and Tonkin and Associates for the City of Charles Sturt. The study is examining future
residential growth and character issues across the City of Charles Sturt.
This first report, prepared in March 2009, is a summary of the background policy and population
context that will influence opportunities and challenges facing Council's growth options into the
future. Against this context, a series of draft recommendations regarding broad growth and built
form character have been identified and are described in the Residential Growth + Character
Study, Report 2 - Opportunities and Constraints.
The key population context has been recently released by the Government of South Australia. The
30 Year Plan for Greater Adelaide details government's aim to achieve significant population growth
targets by developing new residential areas in greenfield locations (30% of new growth), and by
increasing infill and population densities in existing urban centres (70% of new growth).
The City of Charles Sturt will accommodate a substantial part of the increased population growth,
predominantly through infill and achieving higher densities in Transport Oriented Developments
and along key transport corridors. As part of its strategy, the Government has announced to invest
$2 billion in upgrading and expanding public transport in Greater Adelaide, much of which (tram
line extension, train line electrification) will directly benefit business and residents in the City of
Charles Sturt.
The population growth target for South Australia was 2 million people by 2050 (South Australia's
Strategic Plan 2004). Recently this has been revised and this is now projected to be reached 23
years ahead of target, in 2027. This means that Greater Adelaide is forecast to grow by about
560,000 people over the next 30 years. For the Western Region (including Charles Sturt, West
Torrens and part of Port Adelaide Enfield), the growth target is an additional 83,000 people. This is
projected to occur largely as a result of:
• Natural population growth (we are seeing an average of an additional 7600 people a year)
• Large increases in overseas migration (an additional 14,000 people in 2007 - 2008)
• Growing proportion of elderly people, and
• Changing living arrangement and consequently decreasing household sizes
An estimate for what this means for the City of Charles Sturt is that an additional approximate
22,700 dwellings will need to be provided over the next 30 years. The majority of these will need
to provided in the form of buildings that have up to 5 storeys along Corridors (in key locations
along Port Road, Torrens Road, Grange Road and West Lakes Boulevard). Sites at Railway Stations
(Woodville, Cheltenham, Seaton, Kilkenny) and densification around Centres (such as Arndale and
West Lakes) will also contribute to the required dwelling yield but to a much lesser extent. These
development opportunities potentially can bring significant benefits to the community including
provision of new facilities and infrastructure and vibrant and energetic living areas. They may also
significantly change the character of the existing areas.

City of Charles Sturt Residential Growth + Character Study - Report No 1 Strategic Context 2
Infill opportunities (such as developing one current house site into two or three new dwellings) are
scattered throughout the Council area. However they are not likely to contribute significantly to the
growth target, and also brings little benefit to the community as a whole because they do not
provide the economies of scale to be able to provide additional services or infrastructure, and also
could detrimentally impact on the character of the neighbourhood.
Council has a role to play in influencing the design, sustainability and location of new dwellings
through a range of measures including planning policy, financial incentives, and legal
requirements. These measures that address new housing location and form should consider the
characteristics of the community that will be living in the areas. A demographic analysis of the
Council area shows that there are significant differences across the council area relating to income
levels, levels of ageing, cultural backgrounds, household type, and housing affordability.
Council's internal policy documents provide some direction about future growth in Charles Sturt.
Whilst they have been written prior to the release of the 30 Year Plan, generally they are
consistent with state government aims that promote a suite of areas that are suitable for
increasing densities and renewal.
The background context described in this document has been informed by:
§ a range of State Government and Local Government policies and reviews
§ 2009 ABS demographic analysis and previous Planning SA demographic analysis, and
§ consultation with council staff, key government and industry stakeholders.

City of Charles Sturt Residential Growth + Character Study - Report No 1 Strategic Context 3
2 State Government Policy Context
There are a range of key State Policy Documents that will influence the future growth and
character of the City of Charles Sturt.
Specifically these are:
§ South Australian Strategic Plan (2007)
§ 30 Year Plan for Greater Adelaide (2010)
§ Planning Strategy for Metropolitan Adelaide (2007)
§ Directions for Creating a new Plan for Greater Adelaide (2008)
§ Draft Technical Report to 30 Year Plan for Greater Adelaide (2009)
§ Housing Plan for SA (2005)
§ Strategic Infrastructure Plan (April 2005)
§ South Australia Works in the Regions 2006-2009 Strategic Plan (2006)
§ Industrial Land Strategy for Metropolitan Adelaide (2007)
Appendix 1 provides detail about each of these plans. Of all of these documents, the key
implications are in the South Australian 30 Year Greater Adelaide Plan as below.
2.1 30 Year Plan for Greater Adelaide
This plan provides targets for jobs needed to sustain population targets, provide strategies to
respond to climate change, identify transit corridors, growth precincts and land use priorities and
identify areas for conservation and protection.
It is the principal document to set policy and principles for local government strategic plans,
Section 30 reviews and Development Plans.
The Plan is in line with and will contribute to South Australia’s Strategic Plan and is a volume of the
Planning Strategy.
It indicates the population of Greater Adelaide is expanding and expected to grow substantially
over the next 30 years. The population is ageing at a rapid pace and the number of single-person
households is increasing.
2.1.1 Location of Growth
To allow for sustainable urban growth, much of this growth should be concentrated in transit
corridors, Transit oriented Developments (TODs) and growth investigation areas. Key aspects of
the proposed location of growth are:
§ Approximately 80 per cent of the existing urban character will remain largely unchanged as
a result of the Plan.
City of Charles Sturt Residential Growth + Character Study - Report No 1 Strategic Context 4
§ Over the life of the Plan, about 70 per cent of all new housing will be built either within the
existing urban areas (including townships) or proposed transit corridors, to create an
efficient urban form.
§ The bulk of growth within existing metropolitan Adelaide will take place within transit
oriented developments.
§ Plan for about 60 per cent of metropolitan Adelaide’s growth to be within 800 metres of
current or extended transit corridors.
§ Set clear targets for the planning for transit corridors, transit-oriented developments and
activity centres, so that only 20 per cent of metropolitan Adelaide needs to change
significantly to accommodate these targets
For City of Charles Sturt
§ Increased densities along Main Road Corridors (Port Road, Torrens Road, Henley Beach
Road and Grange Road)
§ Outer Harbor and Grange rail corridor
§ West Lakes proposed light rail
§ Regeneration areas/ infill or lower order TOD's adjacent to main railway stations
§ High Order TOD sites at Bowden, West Lakes and Woodville
§ Activity Centres at Arndale, Fulham Gardens and Queen Elizabeth Hospital

City of Charles Sturt Residential Growth + Character Study - Report No 1 Strategic Context 5
Figure 1. Proposed Locat ions for the TOD's , Act iv i t y Centres and Corr idors as ident i f ied in the 30 Year Plan for Greater Adela ide. Locat ions in Char les Sturt are h ighl ighted.

City of Charles Sturt Residential Growth + Character Study - Report No 1 Strategic Context 6
2.2 Population Targets
§ The population growth target for Greater Adelaide is 560,000 persons over the next 30 years.
§ Population growth target of 560,000 residents over the next 30 years, and a new housing
development target of 258,000 dwellings
§ Of which 137,000 dwellings should be accommodated transit corridors
§ New housing will move over time from a 50:50 split between existing areas and new land
divisions, to a 70:30 split
§ Well located and functioning transit oriented developments
§ Six major transit corridors (of which two are situated in Charles Sturt)
§ Provide 10% affordable and 5% high need housing in all significant new housing developments
§ Increase use of public transport to 10% of metropolitan weekday passenger vehicles
kilometres travelled by 2018
§ Provide for 282,000 new jobs by 2036 through an additional 5,115 hectares and 1.5 million
square meters of employment lands, and
§ For the Western Region (including Charles Sturt, West Torrens and Port Adelaide Enfield),
83,000 additional people
The table below outlines the population targets for the Western Region as expressed in the 30 Year
Plan.

City of Charles Sturt Residential Growth + Character Study - Report No 1 Strategic Context 7
Figure 2. * Populat ion Targets for the Western Region in re lat ion to TOD's, Act iv i t y Centres and Corr idors – Draf t 30 Year Plan for Greater Adela ide 2009
* Note: the final release of the 30 Year Plan for Greater Adelaide has identified that the population growth target for
Western Region is 83,000 people. The draft 30 Year Plan had originally identified the population growth target as 90,000
people. The figures in Figure 2 above come from the draft plan so they slightly over represent the final targets for the
Western region.
2.3 State Government Requirements Relating to Affordable Housing
2.3.1 Legislative Context
The SA Government has introduced a target for all new, significant developments to include a
component of 15% “Affordable Housing”, including 5% special need. The delivery of this
“affordable housing” component will take place via two paths.
Path 1 will be negotiated by the South Australian Affordable Housing Trust and secured through
legal agreements. This path will involve all significant, new, residential developments involving:
• Government owned land
• Major developments
• Major rezoning of land for residential development
Path 2 will occur by insertion of planning policy in Development Plans. Policies have been written
for the BDP library for adoption by councils (See Section 2.3.2). These policies promote and
encourage affordable housing in:

City of Charles Sturt Residential Growth + Character Study - Report No 1 Strategic Context 8
• new developments
• land that is re-zoned from non-residential use to residential use
• land that is up-zoned to provide increased residential densities
These policies will also support specific sites with an existing agreement between the government
and the land owner / developer (See Path 1).
The statutory and policy framework for “Affordable Housing” is provided by the following sections
of the Development Act 1993. This framework is set out in the figures on the next page, together
with a diagram of the application assessment process. The key parts of the Act are shown below:
3—Objects
The object of this Act is to provide for proper, orderly and efficient planning and development in
the State and, for that purpose—
(ea) to promote or support initiatives to improve housing choice and access to affordable
housing within the community;
23—Development Plans
(3) A Development Plan should seek to promote the provisions of the Planning Strategy and may
set out or include—
(a) planning or development objectives or principles relating to—
(vii) the provision of affordable housing within the community;
30—Strategic Directions Reports
(1) A council must, from time to time, in accordance with the requirements of this section, prepare
a report under this section (a Strategic Directions Report) that—
(c) sets out the council's priorities for—
(iiia) implementing affordable housing policies set out in the Planning Strategy within its area;
101A—Councils to establish strategic planning and development policy committees
(2) The functions of the committee are:
(b) to assist the council in undertaking strategic planning and monitoring directed at achieving—
(iiia) the implementation of affordable housing policies set out in the Planning Strategy within
the area of the council;
57A—Land management agreements—development applications
Generally, the means by which the “affordable housing” outcomes are ensured is via a Land
Management Agreement (set out in Section 57A of the Development Act 1993). Housing SA has
developed template agreements to assist the application process.

City of Charles Sturt Residential Growth + Character Study - Report No 1 Strategic Context 9
Figure 3:Affordable Housing Regulatory Framework
Figure 4: Assessment for Applications Including Affordable Housing

City of Charles Sturt Residential Growth + Character Study - Report No 1 Strategic Context 10
2.3.2 Affordable Housing Better Development Plan Module
The Department for Planning and Local Government has established a generic set of planning
modules which are used to inform and guide Development Plan Amendments. These "Better
Development Plan" or BDP Modules include provisions relating to affordable housing. Within the
Residential Zone BDP module, the following policies apply:
11 Development should include a minimum 15 per cent of residential dwellings for affordable housing.
12 Affordable housing should be distributed throughout the zone / X policy area to avoid over-concentration of similar types of housing in a particular area.
13 Dwellings constituting affordable housing should be designed within the following parameters and have a minimum site area (and in the case of residential flat buildings, an average site area per dwelling) not less than that shown in the following table:
Dwelling type
Parameter
Detached Semi-detached
Group Residential flat building
Row
Site area
(square metres)
X
minimum
X
minimum
X
minimum
X
average
X
minimum
Minimum area of private open
space for ground level dwellings
(square metres)
X X X X X
Minimum area of private open
space
in the form of a balcony for
dwellings above ground level
(square metres)
X X X X X
Minimum number of on site car
parking spaces
(one of which should be covered)
X X X X X
2.3.3 Affordable Housing – Criteria
Affordable housing criteria are specified by gazettal notice. This gazettal is updated annually –
generally in September/October. The current gazettal contains three criteria that must be met for a
residence in a development to meet the concept of affordable housing:
§ The residence must be offered for sale at or below the appropriate price (see below);
§ The residence must be offered for sale to eligible buyers; and
Note: X refers to a specific value which is to be inputted by Councils when BDP module adopted
for a specific zone or policy area.

City of Charles Sturt Residential Growth + Character Study - Report No 1 Strategic Context 11
§ The development must be subject to a legally binding agreement to ensure these requirements
are met.
Figure 6: Affordable Housing Price Points
There are also additional requirements in relation to the type, mix, and quality of housing. The
maximum price can vary by up to 15% based upon specified circumstances such as energy
efficiency, proximity to public transport, and specialised financing.
City of Charles Sturt Residential Growth + Character Study - Report No 1 Strategic Context 12
3 Local Government Policy Context
Key Documents assessed to provide a context for this review of Residential Character and Growth
in Charles Sturt are:
§ City of Charles Sturt Community Plan (2008)
§ City of Charles Sturt Section 30 Development Plan Review Recommendations (2008)
§ City of Charles Sturt Industrial Land Study (2008)
§ City of Charles Sturt Flood Mapping and Stormwater Management Plans
§ Community Health Report (2009)
§ City of Charles Sturt Residential Character Studies (1998)
§ City of Charles Sturt Open Space Strategy (2006)
§ Towards One Planet Living - Greening the Western Suburbs 2008 – 2013 (2008)
§ City of Charles Sturt Traffic Management Strategy (2005)
§ City of Charles Sturt Transport Strategy 2005-2025 (2005)
§ City of Charles Sturt Development Plan, 13 August 09
Appendix 2 provides detail about each of these plans. The key policy implications are summarised
below.
3.1 City of Charles Sturt Community Plan (2008)
During 2007 the City of Charles Sturt had been involved in the preparation of a Community Plan
under Section 122 of the Local Government Act. Preparation of the Community Plan has involved a
face to face household survey with 500 residents within the Council area; and a telephone survey
of 200 businesses within the Council area between the 5th and 15th October, 2007.
In summary findings of the survey that are relevant to this consideration of growth and character
opportunities are:
3.1.1 Medium and High Density Housing
New redevelopments of major industrial areas and vacant areas were clearly regarded as the best
way in which the Council should accommodate a 20% increase in the number of dwellings in the
Council area. This is not particularly consistent with the directions of the 30 Year Plan which
focuses new developments into areas along transit routes.
A combination of the following was also considered by many residents and businesses with varying
levels of support:
§ Higher density housing which would include apartments around major centres and railway
stations
§ Continued infill development around the City

City of Charles Sturt Residential Growth + Character Study - Report No 1 Strategic Context 13
3.1.2 Housing Diversity and Affordability
The overwhelming majority of residents and businesses surveyed indicated that it is important that
the Council maintains the area’s wide range of housing types and affordability.
Further, very high proportions of both residents and businesses stated that the Council should
pursue policies that encourage housing affordability and diversity.
3.1.3 Ageing Population, Heritage and Character and the Economy
The following issues were considered to be of very high to extremely high importance to both
residents and businesses:
§ That suitable or adaptable housing for older people is provided in the Council’s planning;
§ That the Council retains areas for industry and business, as a source of employment for the
wider region; and
§ That in future residential developments, older buildings and character of the suburbs within the
City are maintained.
3.2 City of Charles Sturt Section 30 Development Plan Review Recommendations (2008)
In 2008 Council undertook a Section 30 Review. This review involved a thorough review of
Council's Development Plan in relation to current and emerging social, environmental and economic
issues affecting the communities in Charles Sturt Council area. This review was a legal requirement
of Section 30 of the Development Act. The review raised a number of issues relevant to this study.
Particularly noteworthy are the issues raised about residential areas as identified below:
3.2.1 Residential Areas Character Study
§ Improve descriptions of areas through desired future character statements
§ Rationalise and where appropriate to better delineate the character of residential areas,
potentially increase the number of residential policy areas
§ Review boundaries of the Residential Historic (Conservation) Zone
§ Review the impact of regeneration on the character of suburbs
§ Review development along the coast
§ Review areas adjacent Port Road and the Outer Harbor rail corridor (including the Clipsal site at
Bowden) to support population growth through increased mixed tenure housing at higher
densities, incorporating sustainable design features.
City of Charles Sturt Residential Growth + Character Study - Report No 1 Strategic Context 14
3.3 City of Charles Sturt Industrial Land Study (2008)
This study involved a comprehensive review of industrial land across the Council area, addressing
the continuing strategic relevance of the current industrial zones and recommending change where
appropriate.
Sites identified that have potential to be re-zoned for an alternative use:
§ West Lakes (Corner West Lakes Boulevard and Frederick Road)
§ Seaton (Corner of Trimmer Parade and adjacent the railway line)
§ Devon Park (Adjacent to the railway line, north of Torrens Road)
Other sites with possible re-zoning potential include:
§ Kilkenny (adjacent the railway line and Kilkenny Road)
§ Royal Park (corner Tapleys Hill Road and Port Road)
§ Kidman Park South (along Findon Road)
§ Bowden/Brompton (Clipsal Site)
A number of these sites have been identified as locations of increased residential growth as part of
this Growth and Character Study.
3.4 City of Charles Sturt Flood Mapping and Stormwater Management Plans
The Council is currently in the early stage of completing a series of strategic reviews (catchment-
based floodplain mapping investigations and Stormwater Management Plans) to assess current
performance standards and to identify strategies that address not only issues of flood protection
and likely future development, but also to consider opportunities for water quality improvement
(through Water Sensitive Urban Design) and stormwater harvesting and reuse.
The Council has completed the preparation of floodplain mapping data for many of the larger
catchment areas, however this work is ongoing.
The mapping completed to date highlights the many areas across the Council area which are at risk
of flooding in the 100 year ARI event. This floodplain mapping data is available to the public on
Council's website (http://gis.charlessturt.sa.gov.au/eview-html/index.html).
Also available is the 'Development Information Guide No 27' which documents a procedure by
which new development can be designed to take into account the identified flood risk for any
property across the Council area.
(http://www.charlessturt.sa.gov.au/webdata/resources/files/Development_Information_Guide_27_
-_Flood_Mitigation.pdf)

City of Charles Sturt Residential Growth + Character Study - Report No 1 Strategic Context 15
Information from these maps has been incorporated into the analysis of stormwater infrastructure
constraints identified in the Report No 2 Character and Strategic Growth Options which identifies
specific locations for further residential growth.
Future development of Stormwater Management Plans are expected to seek opportunities to
reduce existing flood risk.
In addition, Council has also recently developed a concept for the broad-scale capture and reuse of
stormwater for non-potable purposes such as irrigation of Council parks, school reserves and golf
courses. Details of this concept, which integrates harvesting opportunities at Old Port Road and the
Cheltenham development site, have been approved by the Commonwealth Government for grant
funding under the ‘Water Proofing the West’. There are opportunities for new developments to
incorporate the use of this non-potable water source.
3.5 Community Health Report (2009)
This report details health of communities at an Statistical Local Area (SLA) level in relation to a
wide range of health indicators. Of particular relevance to future growth issues is the
acknowledgement that the City of Charles Sturt has substantial transport networks within its
boundaries (Section 10.3).
Whilst there is increased accessibility, there are also health implications. The North East and Inner
East SLA’s have the highest density of industrial and commercial land use and also the highest
rates of disease incidence, hospitalisation and death.
This should be considered and further reviewed in the context of growth objectives of increasing
densities along major transport routes (in the North East and Inner East particularly).
3.6 City of Charles Sturt Residential Character Studies (1998)
A series of comprehensive residential character studies was undertaken in 1998 for the following
areas:
§ Royal Park
§ Hindmarsh
§ Henley and Grange
§ Findon/Flinders Park
§ Findon/Woodville
§ Fulham Gardens
§ Welland
§ Woodville/Kilkenny
The studies reviewed the following:
§ Urban design and character
§ Demographics

City of Charles Sturt Residential Growth + Character Study - Report No 1 Strategic Context 16
§ Allotment patterns
§ Activities/economic development
§ Land use conflicts and existing uses
§ Housing needs, choice and supply
§ Infrastructure and development constraints
§ Transport and accessibility
§ Community Facilities and Open Space
§ Heritage
§ Environment
Although the information is over ten years old, much of the description and assessment is still
relevant and has informed the Residential Growth and Character Assessment.
3.7 City of Charles Sturt Open Space Strategy (2006)
The City of Charles Sturt Open Space Strategy comprises three main reports which collectively
provide the direction and basis for open space related decisions and actions. These are the
Directions and Strategic Actions Report which provides the directions and actions, guidelines for
implementation, and is the main focus of the Strategy. The second report is an Open Space Matrix
which outlines issues and suggested works relating to specific reserves visited in the Open Space
study (110 reserves). The Findings and Opportunities Paper provides background information and a
basis for directions and actions in the Directions and Strategic Actions Report.
Key findings related to opportunities in water management, in connections with adjacent and
regional land uses and in open space supply. A number of key locations where opportunities for
better use or increased supply of open space are identified in Appendix 2.
The Charles Sturt Open Space Strategy (2006) is currently being reviewed. The review will update
the plan in the context of the 30 Year Plan for Greater Adelaide, Council’s Community Plan and One
Planet Living and the Local Government Association research project into open space provision for
infill and medium to high density development.
3.8 Towards One Planet Living - Greening the Western Suburbs 2008 – 2013 (2008)
Greening the Western Suburbs’ is a five year draft plan that proposes a range of strategies and
actions under four key themes: climate change, water, biodiversity and waste. Many strategies
relate to Council showing sustainable leadership in management and policy. Key strategies that
relate specifically to new growth and infrastructure include:
§ Manage the impacts of climate change on Council and on the community
§ Reduce transport related greenhouse gas emissions
§ Move progressively to more sustainable sources of water
§ Incorporate Water Sensitive Urban Design (WSUD) in existing and new development
§ Revegetate with local native vegetation species

City of Charles Sturt Residential Growth + Character Study - Report No 1 Strategic Context 17
3.9 City of Charles Sturt Traffic Management Study (2005)
A study was undertaken to determine the definition of the road network, local areas and precincts,
as well as the methodology for prioritising the precincts for further study. The Strategy has:
§ identified the need to review Council’s bicycle plan and prepare a pedestrian plan; and
§ established a road hierarchy which is used to determine the types of abutting land uses.
3.10 City of Charles Sturt Transport Strategy 2005 -2025 (2005)
A study was undertaken to better understand transport issues across the Council area, and how
they relate to the use of land and the provisions in the Development Plan. The study recommends:
§ Defining precincts based on commercial, residential, and industrial land uses for the future
development of traffic management and land use strategies.
§ Reviewing the Development Plan to allow for the gradual removal of inappropriate or conflicting
land uses from each precinct.
§ Encouraging medium and high density urban development around existing transport nodes and
along transport corridors. Build on the significant analysis by the Department of Planning and
Local Government of the opportunities to introduce Transport Orientated Developments.

NOTE: Demographic Information in Sections 4 & 5 to be updated by Adelaide University Demographic Analysis Study 2011.
City of Charles Sturt Residential Growth + Character Study - Report No 1 Strategic Context 18
4 Demographic Profile and Trends - Overview
The current demographic profile and trends sit within a context of the State Government pursuing:
§ Increased population growth
§ Increased medium and high density housing in key activity areas in the Western suburbs
The profile and trends, reflected also in consumer demand for housing types and housing locations,
show that they are currently in part inconsistent with government goals relating to housing growth
and density. Therefore there needs to be a series of strong and effective actions (incentives,
education, marketing, legal requirements, policy) that will facilitate changes to consumer demand
in the housing market.
The community profile and population projections for Charles Sturt (1%) and its SLAs have shown
that in the past (2001-06) population growth has been below that of Adelaide SD (4%) as a
whole.
However, in a number of suburbs in the North-East of Charles Sturt, population growth was strong
from 2001-2006, in particular in Bowden, Brompton, Cheltenham, Ridleyton and Kilkenny. In broad
terms these suburbs have a relatively young population, high shares of persons born overseas, the
cheapest rents and a lot of public housing.
Population in Coastal SLA is generally somewhat older and there is a high share of households
without children, high full home ownership and a decreasing population number.
During the 1996-2006 period Charles Sturt witnessed a clear shift in the household structure
towards smaller households, i.e. more one parent families, lone person households and couples
with no children, away from the typical couple household with children.
Although the share of small household types grew, increasingly households choose to occupy
separate houses, especially among single parent and lone person households most rapidly.
The majority of the dwellings (72% or 30,782 dwellings) continue to be separate houses.
However the propensity to occupy semi-detached and townhouses decreased among all
household types, while flats and units gained somewhat in popularity. One storey semi-
detached, row and town houses represent only 12% of the occupied stock.
The population of Charles Sturt is projected to age at a rapid pace. Across Adelaide, overall
population is projected to grow by 11% from 2001 to 2021, but the number of persons aged 65
years and over is projected to jump by 68% (medium scenario) refer to section 4.12 Population
Projections for discussion.
The illustrated shifts in population will have significant impacts on the demand and requirements
for housing, dwelling adjustments, design of public open space, health and social services, and
other services.
NOTE: Demographic Information in Sections 4 & 5 to be updated by Adelaide University Demographic Analysis Study 2011.
City of Charles Sturt Residential Growth + Character Study - Report No 1 Strategic Context 19
The City of Charles Sturt consists of the following four Statistical Local Areas (SLAs) and suburbs
as detailed in Figure 3 and 4 below:
Figure 3. Stat is t ica l Local Area by Suburbs
Charles Sturt - Coastal West Lakes Charles Sturt-Inner West Albert Park
West Lakes Shore Hendon
Semaphore Park Royal Park
Grange Kidman Park
Tennyson Seaton
Henley Beach Fulham Gardens
Henley Beach Sth
West Beach Charles Sturt - North-East Athol Park
Cheltenham
Charles Sturt - Inner East Findon Pennington
Woodville South Woodville North
Woodville West Bowden
West Hindmarsh Renown Park
Allenby Gardens Brompton
Flinders Park Croydon
Hindmarsh Ovingham
Welland Ridleyton
Beverley Woodville
Kilkenny
West Croydon
Woodville Park

NOTE: Demographic Information in Sections 4 & 5 to be updated by Adelaide University Demographic Analysis Study 2011.
City of Charles Sturt Residential Growth + Character Study - Report No 1 Strategic Context 20
Figure 4. Study Area in the City of Char les Sturt , i ts SLAs and Suburbs
Coastal SLA
Inner West SLA
Inner East SLA
North East SLA
BowdenOvingham
Beverley
Woodville West
Woodville South
Henley Beach South
Henley BeachFulham Gardens
Flinders ParkKidman Park
Grange
Seaton
Tennyson
KilkennyWoodville Park
West Croydon
CroydonRidleyton
Renown Park
Brompton
HindmarshWest Hindmarsh
Allenby Gardens
Findon
West Lakes
West Lakes Shore
Semaphore Park
Royal Park
Albert ParkHendon
Cheltenham
PenningtonAthol Park
Woodville North
Woodville
Charles Sturt (C)
Prospect (C)
Walkerville (M)
Adelaide (C)
Source: ABS CData (2006), SGS (2009)
4.1 Community Profile
As of 30 June 2006, the Estimated Residential Population (ERP) of the City of Charles Sturt was
104,069 residents. ERP provides the best estimate of the population of an area. This ABS
estimate is based on Census data and has undergone some corrections to the Census counts,
including the addition of the estimated number of residents not in Australia at the time of the
Census.
Most detailed community profile data by ABS are not provided in ERP, but based on ‘place of usual
residence’ at time of the Census. Population estimates of Charles Sturt based on this premise are
approximately 4% below the ERP estimates and for instance do not include persons not present in
Australia at the night of the Census (often persons in the age groups 15 to 24 and 25 to 34 years
of age). The following analysis is predominantly based on population estimates based on place of
usual residence, and the above mentioned should be kept in mind.
Population growth in Charles Sturt has stayed behind that of Adelaide as a whole.
The population of Charles Sturt in 2006 based on place of usual residence was 100,528 residents
excluding overseas visitors and 102,510 including international visitors. Compared to 2001,
population grew by 1% from 99,605. During that same time the entire population of Adelaide SD
expanded by 4% from 1,066,103 in 2001 to 1,105,841 residents in 2006.
The table below illustrates population growth in Charles Sturt and its four SLAs between 2001 and
2006.

NOTE: Demographic Information in Sections 4 & 5 to be updated by Adelaide University Demographic Analysis Study 2011.
City of Charles Sturt Residential Growth + Character Study - Report No 1 Strategic Context 21
Figure 5. Populat ion and Populat ion Change ( in %), 2001 - 2006
Area 2001 2006 Change 2001-06
Coastal (SLA) 30,135 29,959 -1%
Inner East (SLA) 20,973 21,323 2%
Inner West (SLA) 24,324 23,629 -3%
North-East (SLA) 24,777 25,622 3%
Charles Sturt (LGA) 99,605 100,538 1%
Adelaide (SD) 1,066,103 1,105,839 4%
Source: ABS Census 2001 and 2006, Place of usual residence, excluding overseas visitors
Between the SLAs of Charles Sturt there are marked differences in the pace of population
growth. Both Inner East and North-East experienced a growth of population of 2% and 3%
respectively, while Coastal and Inner West experienced a negative growth of -1% and -3%.
Between the suburbs within the SLAs of Charles Sturt, population change varied markedly as well.
Figure 6. Populat ion and Populat ion Change by Suburbs of Char les Sturt (Count and %), 2001 - 2006
SLA Suburb 2006
population
2001
population
pop change %pop
change
Coastal Grange 5236 5105 131 3%
Henley Beach 5406 5452 -46 -1%
Henley Beach
South 2289 2233 56 3%
Semaphore Park 4260 4493 -233 -5%
Tennyson 1053 1020 33 3%
West Beach 4333 4420 -87 -2%
West Lakes 5807 5940 -133 -2%
West Lakes Shore 2964 3030 -66 -2%
SLA total 313481 31693 -345 -1%
Inner
East Allenby Gardens 1846 1894 -48 -3%
Beverley 1360 1310 50 4%
Findon 5452 5271 181 3%
Flinders Park 4366 4199 167 4%
Hindmarsh 128 142 -14 -10%
Welland 914 916 -2 0%
West Hindmarsh 1580 1577 3 0%
Woodville South 2764 2930 -166 -6%
Woodville West 2913 2798 115 4%
SLA total 21323 21037 286 1%
Inner Albert Park 1634 1668 -34 -2%
1 Note the small difference with the previous table. All data sources were checked and it is appears the inconsistency is caused by the inclusion of visitors in the suburb data.

NOTE: Demographic Information in Sections 4 & 5 to be updated by Adelaide University Demographic Analysis Study 2011.
City of Charles Sturt Residential Growth + Character Study - Report No 1 Strategic Context 22
SLA Suburb 2006
population
2001
population
pop change %pop
change
West
Fulham Gardens 5942 5918 24 0%
Hendon 1121 1138 -17 -1%
Kidman Park 2954 2975 -21 -1%
Royal Park 2653 2826 -173 -6%
Seaton 9706 9641 65 1%
SLA total 24010 24166 -156 -1%
North-
East Athol Park 1307 1342 -35 -3%
Bowden 643 602 41 7%
Brompton 2490 2296 194 8%
Cheltenham 2177 2053 124 6%
Croydon 1347 1360 -13 -1%
Kilkenny 1552 1392 160 11%
Ovingham 657 675 -18 -3%
Pennington 3604 3456 148 4%
Renown Park 1577 1684 -107 -6%
Ridleyton 943 763 180 24%
West Croydon 3879 3808 71 2%
Woodville 1972 1994 -22 -1%
Woodville North 2041 2067 -26 -1%
Woodville Park 1640 1610 30 2%
SLA total 25829 25102 727 3%
LGA total 102510 101998 512 1%
Source: ABS Census 2001 & 2006, CData
Although Coastal SLA experienced a decline in population; population in the suburbs of Grange,
Henley Beach South and Tennyson expanded. In Inner West, population in all suburbs dropped,
most markedly in Royal Park.
In Inner East, growth was strong in Beverly, Findon, Flinders Park and Woodville West while
population dropped significantly in Hindmarsh and Woodville South. The most significant growth
occurred in some of the North-East suburbs: Bowden (8%), Brompton (7%), Cheltenham (6%),
Kilkenny (11%) and Ridleyton (24%). Significant decline of population appeared in Renown Park.
There is no obvious correlation between age structure and positive/negative population growth. So,
no consistent relation was found between for instance ‘older’ suburbs and population decline or
‘young family’ suburbs and population growth.
The implications of the trends in population growth are that the growth in suburbs such as Bowden
and Brompton matches the State Government's strategic growth directions which is to increase
densities in parts of these areas (such as the Clipsal site). Other areas that are also identified as
having growth opportunities as described further in this report (such as around Woodville Train
Station, Cheltenham, and West Lakes) are not necessarily matched by current growth trends.

NOTE: Demographic Information in Sections 4 & 5 to be updated by Adelaide University Demographic Analysis Study 2011.
City of Charles Sturt Residential Growth + Character Study - Report No 1 Strategic Context 23
Highly active marketing will be necessary to shift natural growth trends to areas where growth is
desired.
4.2 Population by age
The table below provides an overview of the population by age. In Charles Sturt there are
relatively less persons aged up to 35 years (40%) than in Adelaide SD (45%). In the Coastal part
of Charles Sturt there are many residents aged between 45 and 55 years. The North-East
population is the youngest population in Charles Sturt. In both Inner East and Inner West the
proportion of total population aged 65 and over is higher than the City’s average.
Figure 7. Populat ion by Age ( in %)2006
Adelaide Charles
Sturt
Coastal Inner East Inner West North-East
0-14 18% 16% 15% 16% 17% 18%
15-24 14% 12% 13% 12% 12% 12%
25-34 13% 12% 12% 16% 13% 17%
35-44 14% 15% 14% 15% 14% 16%
45-54 14% 14% 17% 11% 12% 12%
55-64 11% 12% 12% 9% 11% 8%
65-74 7% 9% 9% 10% 10% 8%
75-84 6% 8% 7% 8% 7% 6%
85 years+ 2% 3% 2% 2% 4% 2%
Total 100% 100% 100% 100% 100% 100%
Source: ABS Census 2006
Ageing of population is signified by a decrease in the number of persons aged up to 35 years of
age and an increase of persons aged 65 and over. In Charles Sturt, the number of persons up to
35 years of aged dropped by 5%, while the number aged 65 and over increased by 5%.
The figure below shows population change in Charles Sturt by age group. It shows there was a
17% increase in persons aged 55 to 64 years and a -14% decrease in the number of persons aged
25 to 34 years.

NOTE: Demographic Information in Sections 4 & 5 to be updated by Adelaide University Demographic Analysis Study 2011.
City of Charles Sturt Residential Growth + Character Study - Report No 1 Strategic Context 24
Figure 8. Populat ion Change by Age Group in Char les Stur t (count) ; 2001 - 07
0
2000
4000
6000
8000
10000
12000
14000
16000
18000
0-14 15-24 25-34 35-44 45-54 55-64 65-74 75-84 85 years+
2001
2006
Source: ABS Census 2001 and 2006
Similar patterns can be observed in the four SLAs of Charles Sturt (see table below). Ageing of
population is particular strong in Coastal SLA, where between 2001 and 2006 the number of
persons aged up to 35 years dropped by 8% and those aged 65 and over increased by 8%.
Figure 9. Ageing of Populat ion, Change in number of persons aged <35 and 65 and over ( in %), 2001 - 2006
Source: ABS Census 2001 and 2006
There is some variation in the age profiles by suburb. The suburbs with the highest share of
persons aged 65 and over is Hendon (30%) followed by West Lakes (24%). The average share
aged 65 and over is 19%. Typically ‘young suburbs’ with a high share of persons aged up to 35
years is found in Ridleyton (50%), Hindmarsh (49%), Beverley (48%), Ovingham (47%), West
Hindmarsh (46%) and Woodville Park (46%).
Suburbs with a higher share of people aged over 65, and that are ageing significantly, will need to
have levels of support and facilities. Policies should also be pro active in encouraging a greater
level of population mix in these suburbs.
Area Change persons aged up to 35
years
Change persons 65 years and
over
Coastal (SLA) -8% 8%
Inner East (SLA) -1% -3%
Inner West (SLA) -9% -2%
North-East (SLA) -3% 3%
Charles Sturt (LGA) -5% 5%

NOTE: Demographic Information in Sections 4 & 5 to be updated by Adelaide University Demographic Analysis Study 2011.
City of Charles Sturt Residential Growth + Character Study - Report No 1 Strategic Context 25
4.3 Country of Birth
In the City of Charles Sturt 68% of residents stated they were born in Australia compared with
71% across the Adelaide SD as a whole.
26% were born elsewhere and nearly all of those residents (25%) speak another language (other
than English) at home. In Adelaide SD this percentage is lower at 15%.
In Charles Sturt, the United Kingdom is the dominant as a country of birth (5% of all residents
were born in the UK which is less compared to Adelaide SD at 9%) closely followed by Italy (4%).
This pattern has not changed since 2001, when the UK and Italy were already the dominant
countries of birth. Some suburbs show higher numbers of other nationalities (in particular
Vietnam and Greece) compared with other suburbs (see tables below).
The table below shows the top five by country of birth for Charles Sturt and by SLA.
Figure 10. Populat ion by Country of Bir th ( top 5), 2006
City of Charles
Sturt
Coastal SLA Inner East SLA Inner West SLA North East SLA
1 Australia
(68,733)
Australia
(22,271)
Australia
(14,451)
Australia
(15,786)
Australia
(16,226)
2 United Kingdom
(4,964)
United Kingdom
(2,287)
Italy (1,212) Italy (1,710) United Kingdom
(1,053)
3 Italy (4,169) Italy (496) United Kingdom
(759)
United Kingdom
(865)
Italy (748)
4 Greece (2,124) Germany (292) Greece (469) Greece (658) Greece (706)
5 Vietnam (1,814) Greece (292) Vietnam (219) Croatia (285) China (197)
Source: ABS Census 2006
Suburbs with specifically high numbers of persons born overseas are:
§ Athol Park (52% born overseas; North-East)
§ Woodville North (46%, North-East)
§ Hindmarsh (45%, Inner East)
§ Kilkenny (43%, North-East)
§ Renown Park (43%, North-East)
§ Ridleyton (41%, North-East)
Suburbs with the lowest shares of persons born overseas are:
§ Grange (23%, Coastal)
§ Cheltenham (23%, North-East)
§ Henley Beach South (24%, Coastal)
§ Tennyson, West Lakes Shore and West Lakes (all three 25%, Coastal)

NOTE: Demographic Information in Sections 4 & 5 to be updated by Adelaide University Demographic Analysis Study 2011.
City of Charles Sturt Residential Growth + Character Study - Report No 1 Strategic Context 26
4.4 Migration
As indicated earlier, migration is an important driver of population growth in South Australia. In
Adelaide SD, in 2006 there were approximately 16,000 settlers from overseas which is equal to
1.5% of total population.
Nationally, in 2006 there were 3,724,535 people born overseas, 7 out of 10 Australian residents
(70%) were born in Australia, a slight decrease from 2001. Of people born overseas, the most
common countries of birth were England, New Zealand, China, Italy, and Vietnam.
Within Charles Sturt, the SLAs of Inner East and North-East attract the highest ratios of
settlers from overseas (see table below).
Figure 11. Place of Usual Residence 1 Year and 5 Years Ago * in % of Tota l Populat ion, 2006
Area Lived overseas 1 year ago Lived overseas 5 years ago
City of Charles Sturt 1,276 (1.3%) 3,459 (3.6%)
Coastal SLA 446 (1.5%) 990 (3.5%)
Inner East SLA 321 (1.5%) 884 (4.4%)
Inner West SLA 161 (0.7%) 561 (2.5%)
North East SLA 348 (1.4%) 1025 (4.2%)
Source: ABS Census 2006
Cultural backgrounds have a significant influence on the desired form and location of housing.
Suburbs that are experiencing significant increases in people from other countries will over time
display differing neighbourhood characters. Growth opportunities, and the way in which policy
addresses or facilitates growth, should take into account cultural issues related to the incoming
residents.
4.5 Income, Housing Rent and Repayments
The table below is an overview of key socio-economic details for Charles Sturt and SLAs within the
City.
Income levels in Charles Sturt are below the Adelaide medians, with median household incomes
12% and median family incomes 4% below Adelaide.
Rents are generally lower too in Charles Sturt; the median rent is 6% lower than in Adelaide. The
housing loan repayments are somewhat above the regional average which is due the high housing
loan repayments in the Coastal SLA.

NOTE: Demographic Information in Sections 4 & 5 to be updated by Adelaide University Demographic Analysis Study 2011.
City of Charles Sturt Residential Growth + Character Study - Report No 1 Strategic Context 27
Figure 12. Key Income and Hous ing Cost Indicators ( in $) , 2006
Median
individual
income
($/weekly)
Median family
income
($/weekly)
Median
household
income
($/weekly)
Median
housing loan
repayment
($/monthly)
Median rent
($/weekly)
Adelaide SD $447 $1,137 $924 $1,083 $165
Charles Sturt $406 $1,093 $816 $1,100 $155
Coastal $486 $1,247 $986 $1,200 $170
Inner East $388 $1,048 $784 $1,083 $160
Inner West $376 $1,025 $738 $1,083 $150
North-East $377 $1,047 $750 $1,083 $146
Source: ABS Census, 2006
Income levels in Inner East, Inner West and North-East are below incomes in Adelaide SD, while
the income levels in Coastal SLA are well above the wider region. The design and form of new
housing will be significantly influenced by market demand and the ability of people to afford it.
There is significant difference in levels of affordability across differing suburbs in the Council area,
and therefore significantly differing housing styles and densities is likely.
4.6 Employment and labour force
In Charles Sturt, 55% of all the persons aged 15 years and over are in the labour force.
Labour force participation is lower than in Adelaide SD (59%).
In Charles Sturt 39% of residents aged 15 and over stated not to be in the labour force and 6% did
not state their status. In 2006 5% of the labour force was unemployed, which is similar to Adelaide
SD.
Within the City of Charles Sturt, unemployment is the lowest in Coastal SLA while the labour force
participation rate is the highest (59%). Unemployment is highest in North-East (7%) and Inner
East (6%). Labour force participation is lowest in Inner West (52%).
Figure 13. Unemployment Rate and Labour Force Part ic ipat ion, 2006
Area Unemployment Labour force
participation
City of Charles Sturt 2,490 (5%) 46,652 (55%)
Coastal SLA 608 (2%) 15,074 (59%)
Inner East SLA 565 (6%) 9,753 (55%)
Inner West SLA 491 (5%) 10,422 (52%)
North East SLA 826 (7%) 11,404 (54%)
Source: ABS Census 2006
NOTE: Demographic Information in Sections 4 & 5 to be updated by Adelaide University Demographic Analysis Study 2011.
City of Charles Sturt Residential Growth + Character Study - Report No 1 Strategic Context 28
4.7 Disabilities
The number of persons with a disability of some level is increasing with age. As population ages, it
is expected more people will have a disability. In Charles Sturt, 5,784 persons (6% of population)
stated to have a core activity need for assistance, while 5,151 did not state their need. The
highest level of stated need for assistance was counted in North-East where 7% of
population has a core activity need for assistance. This will need to be considered in the North
Eastern areas that are identified as having significant residential growth opportunity. In many
ways, higher population levels provide greater levels of support and opportunities for increased
provision of infrastructure (due to increased demand).
4.8 Family composition
The population of Charles Sturt counts (in 2006) 27,125 family households consisting of 76,304
persons.
The remainder of the population of 24,224 persons is living in non-family households (estimated
just over 15,664 households).
Of the family households, most consist of couples with children (41%), most of who are dependent
on their parents (see table below). Of the 11,141 couples with children, 6,964 have children under
the age of 15 years and 4,177 only have children over 15 years of age still living at home.
Approximately 17% or 4,729 households are one parent households.
A significant share (39% or 10,682 households) of family households consists of couples with no
children (living at home).
Figure 14. Family Composit ion of Fami ly Households in Char les Sturt (count and % of famil ies) , 2006
Family composition Families Share (%)
Couple family with no children 10,682 39%
Couple family with:
children under 15 and:
dependent students and non- dependent children 168 1%
dependent students and no non-dependent children 1,001 4%
no dependent students and non-dependent children 312 1%
no dependent students and no non-dependent children 5,483 20%
Total 6,964 26%
no children under 15 and:
dependent students and non-dependent children 634 2%
dependent students and no non-dependent children 939 3%
no dependent students and non-dependent children 2,604 10%
Total 4,177 15%
Total 11,141 41%

NOTE: Demographic Information in Sections 4 & 5 to be updated by Adelaide University Demographic Analysis Study 2011.
City of Charles Sturt Residential Growth + Character Study - Report No 1 Strategic Context 29
Family composition Families Share (%)
One parent family with:
children under 15 and:
dependent students and non-dependent children 52 0%
dependent students and no non-dependent children 288 1%
no dependent students and non-dependent children 171 1%
no dependent students and no non-dependent children 1,752 6%
Total 2,263 8%
no children under 15 and:
dependent students and non-dependent children 154 1%
dependent students and no non-dependent children 457 2%
no dependent students and non-dependent children 1,855 7%
Total 2,466 9%
Total 4,729 17%
Other family 573 2%
Total 27,125 100%
Source: ABS Census 2006
Of the 27,125 family households in Charles Sturt, 8,291 are in Coastal SLA, 5,686 in Inner East,
6,702 in Inner West and 6,442 in North-East.
Household compositions vary somewhat across the LGA, as is illustrated in the figure below.
Family composition in Charles Sturt is similar to Adelaide SD as a whole. In the Coastal part of
Charles Sturt there are more couples without children; 45% of families as opposed to 38% in
Charles Sturt. In North-East there are more one parent families (22% compared to 17% in Charles
Sturt).

NOTE: Demographic Information in Sections 4 & 5 to be updated by Adelaide University Demographic Analysis Study 2011.
City of Charles Sturt Residential Growth + Character Study - Report No 1 Strategic Context 30
Figure 15. Family Household Composit ion in Char les Stur t and SLA's ( in % of Family Households) , 2006
Adelaide SD
Charles Sturt
CoastalInner East
Inner West
North-East
Other family 5,385 573 132 145 127 166
One parent family 50,647 4,729 1,105 1,045 1,174 1,404
Couple family 126,834 11,141 3,286 2,394 2,726 2,737
Couple family with no children 114,245 10,682 3,768 2,102 2,675 2,135
0%
10%
20%
30%
40%
50%
60%
70%
80%
90%
100%
Source: ABS Census, 2006
4.9 Households in Private Occupied Dwellings
Most of the family households occupy private dwellings: in Charles Sturt families occupy 26,810
dwellings, implying 315 families live in non-private dwellings or multi-family households. In
addition, there are 15,664 non-family households occupying private dwellings.
The table below gives an overview of the existing occupied private dwellings in Charles Sturt and
the households occupying these dwellings.
The table below illustrates there is a trend away from households with children.
At the same time there is a marked increase in lone parent households, lone person households
and couples without children.
The following underlying social/demographic trends drive these changes:
§ The growth of the number of divorces and (young) persons choosing a singular lifestyle, and;
§ Ageing of population, this results in more aged couples whose children have grown up and no
longer live in a household together with their parents.
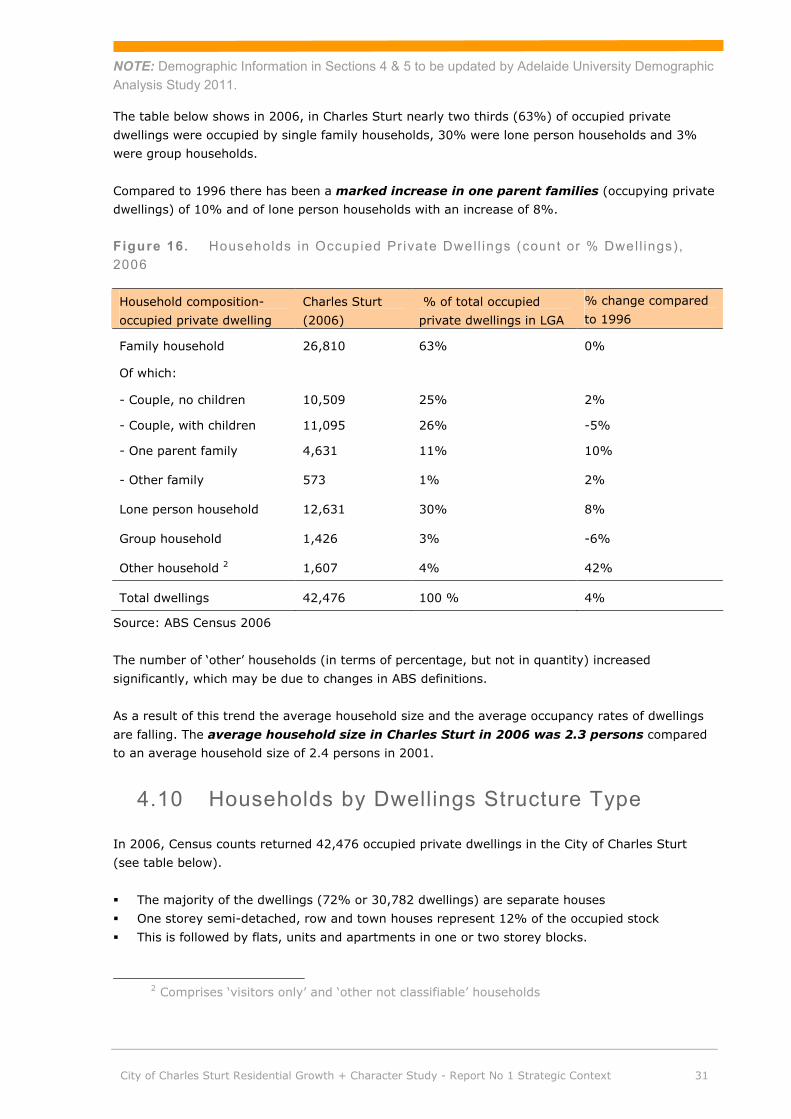
NOTE: Demographic Information in Sections 4 & 5 to be updated by Adelaide University Demographic Analysis Study 2011.
City of Charles Sturt Residential Growth + Character Study - Report No 1 Strategic Context 31
The table below shows in 2006, in Charles Sturt nearly two thirds (63%) of occupied private
dwellings were occupied by single family households, 30% were lone person households and 3%
were group households.
Compared to 1996 there has been a marked increase in one parent families (occupying private
dwellings) of 10% and of lone person households with an increase of 8%.
Figure 16. Households in Occupied Pr ivate Dwell ings (count or % Dwel l ings), 2006
Household composition-
occupied private dwelling
Charles Sturt
(2006)
% of total occupied
private dwellings in LGA
% change compared
to 1996
Family household 26,810 63% 0%
Of which:
- Couple, no children 10,509 25% 2%
- Couple, with children 11,095 26% -5%
- One parent family 4,631 11% 10%
- Other family 573 1% 2%
Lone person household 12,631 30% 8%
Group household 1,426 3% -6%
Other household 2 1,607 4% 42%
Total dwellings 42,476 100 % 4%
Source: ABS Census 2006
The number of ‘other’ households (in terms of percentage, but not in quantity) increased
significantly, which may be due to changes in ABS definitions.
As a result of this trend the average household size and the average occupancy rates of dwellings
are falling. The average household size in Charles Sturt in 2006 was 2.3 persons compared
to an average household size of 2.4 persons in 2001.
4.10 Households by Dwellings Structure Type
In 2006, Census counts returned 42,476 occupied private dwellings in the City of Charles Sturt
(see table below).
§ The majority of the dwellings (72% or 30,782 dwellings) are separate houses
§ One storey semi-detached, row and town houses represent 12% of the occupied stock
§ This is followed by flats, units and apartments in one or two storey blocks.
2 Comprises ‘visitors only’ and ‘other not classifiable’ households

NOTE: Demographic Information in Sections 4 & 5 to be updated by Adelaide University Demographic Analysis Study 2011.
City of Charles Sturt Residential Growth + Character Study - Report No 1 Strategic Context 32
Since 1996 there has been an increase in separate houses (+10%) and units in one or two
storey blocks (+12%) while there has been a drop in the number of occupied semi-
detached, row, terrace and townhouses (-13%).
Figure 17. Dwell ings by Struc ture Type (Count, %) – Char les Sturt
2006 In % 2001 1996 96-06
change
(%)
Separate house 30,782 72% 29,373 28,100 10%
Semi-detached, row, terrace house, townhouse
with:
One storey 5,137 12% 6,122 6,110 -16%
Two or more storeys 1,369 3% 1,220 1,328 3%
Total 6,506 15% 7,342 7,438 -13%
Flat, unit or apartment:
In a one or two storey block 4,394 10% 4,204 3,917 12%
In a three storey block 326 1% 361 362 -10%
In a four or more storey block 215 1% 174 182 18%
Attached to a house 37 0% 76 122 -70%
Total 4,972 12% 4,815 4,583 8%
Other dwelling (caravan, cabin, houseboat,
improvised, house attached to shop)
216 1% 265 231 -6%
Dwelling structure not stated 0 0% 158 443 -100%
Total 42,476 100% 41,953 40,795 4%
Source: ABS Census, time series 1996-2006
The figure below reflects the dwelling structure types occupied by households categories.
§ Separate houses are the dominant dwelling structure among most household types, particularly
among couples with children (91%), couples without children (80%) and lone parent
households (73%).
§ Lone person households are least likely to occupy separate houses although still 53% do
occupy separate houses.
§ Lone person households are more likely than other households to occupy semi-detached
dwellings and townhouses (24% of lone person households) and flats, units and apartments
(23%).
The high occupancy of separate houses is an indication of low population and dwellings densities in
Charles Sturt.

NOTE: Demographic Information in Sections 4 & 5 to be updated by Adelaide University Demographic Analysis Study 2011.
City of Charles Sturt Residential Growth + Character Study - Report No 1 Strategic Context 33
Figure 18. Dwell ings s truc ture type by household category in Char les Stur t ( in % of a l l dwel l ings) , 2006
Couples, no
children
Couples, with
children
One parent family
Other family
Lone person househ
old
Group househ
old
Other househ
oldsTotal
Other 43 22 9 - 52 8 82 216
Flat, unit apartment 755 299 390 75 2,869 267 317 4,972
Semi-detached/townhouse 1,327 636 869 106 3,018 258 292 6,506
Seperate house 8,384 10,138 3,363 392 6,696 893 916 30,782
0%
10%
20%
30%
40%
50%
60%
70%
80%
90%
100%
Other
Flat, unit apartment
Semi-detached/townhouse
Seperate house
Source: ABS Census, 2006
In Charles Sturt, the stock of occupied separate houses has increased by 10% between 1996 and
2006. During that same period, the overall stock of private occupied dwellings increased by 4%
from 40,795 in 1996 to 42,476 (ABS, 1996-2006 time series3). This represents an increase of 1681
dwellings, averaged out over the period to an increase of 168 dwellings each year. This is
significantly lower than what will need to be achieved if growth targets established by the 30 Year
Plan for Greater Adelaide are to be achieved.
The popularity of separate houses has increased among all household types, but most markedly
among one parent families and lone person households.
§ In 1996, 64% of lone parent households occupied separate houses, by 2006 this share had
increased to 73%, a 9% point increase.
The graph below illustrates the change in propensity to occupy dwelling structure types.
3 Time series for occupied private dwellings take any geographical boundary changes of CCDs into account. In Charles Sturt there have been some significant boundary changes.

NOTE: Demographic Information in Sections 4 & 5 to be updated by Adelaide University Demographic Analysis Study 2011.
City of Charles Sturt Residential Growth + Character Study - Report No 1 Strategic Context 34
Figure 19. Change in household propens i ty to occupy dwel l ings structure types in Char les Stur t (% point ) , 1996 - 2006
-10%
-5%
0%
5%
10%
15%
Seperate house Semi-detached/townhouse Flat, unit apartment Other
Couples, no children
Couples, with children
One parent family
Other family
Lone person household
Group household
Other households
All households
Source: ABS, 1996-2006 time series
4.11 Tenure
The figure below shows in 2006, in Charles Sturt
§ 37% of occupied private dwellings were fully owned
§ 26% were being purchased and
§ 29% were rented.
Compared to Adelaide SD as a whole, home ownership is somewhat above the Adelaide SD
average. Home ownership is particularly high in Coastal SLA and in Inner West SLA, with 42% and
43% of dwellings being fully owned.
In Charles Sturt there are relatively few households purchasing their dwelling and many
households renting. North-East has the highest share of renting households with 36%
renting, compared to 29% in Charles Sturt and 27% in Adelaide SD.

NOTE: Demographic Information in Sections 4 & 5 to be updated by Adelaide University Demographic Analysis Study 2011.
City of Charles Sturt Residential Growth + Character Study - Report No 1 Strategic Context 35
Figure 20. Tenure types of occupied pr ivate dwel l ings in Char les Stur t and Adela ide (count , %), 2006
Adelaide SD
City of Charles
Sturt (LGA)
Coastal SLA
Inner east SLA
Inner west SLA
Northeast SLA
Tenure type not stated 12,608 1,473 384 308 382 399
Other tenure type 5,755 506 201 56 129 116
Rented 114,900 12,203 3,321 2,617 2,620 3,648
Being purchased 152,864 11,180 3,278 2,439 2,424 3,038
Fully owned 144,652 15,511 5,163 3,203 4,123 3,023
0%
10%
20%
30%
40%
50%
60%
70%
80%
90%
100%
Tenure type (in %)
Source: ABS Census 2006
The table below breaks the rental properties down by type of operator/owner. The biggest share of
households renting in Charles Sturt are renting from the SA housing authority: 33% of rented
dwellings, or 10% of all occupied private dwellings are public housing. In Adelaide SD only 7% of
the properties are public housing. State housing is most prominent in Inner West and North-East
with 37% and 38% of rental properties being operated by the housing authority.
Renting via real estate agents is the most common rent formation in the Coastal SLA (36%).

NOTE: Demographic Information in Sections 4 & 5 to be updated by Adelaide University Demographic Analysis Study 2011.
City of Charles Sturt Residential Growth + Character Study - Report No 1 Strategic Context 36
Figure 21. Rented pr ivate occupied dwell ings by operator ( in % of al l rented dwel l ings), 2006
Adelaide SD
City of Charles
Sturt (LGA)
Coastal SLA
Inner east SLA
Inner west SLA
Northeast SLA
Landlord type not stated 2,760 327 72 82 72 104
Other landlord type(d) 3,506 391 58 113 82 138
Housing co-operative/community/church group 4,813 479 117 59 84 218
Person not in same household(c) 34,607 3,640 945 885 822 987
State or territory housing authority 30,650 4,066 937 770 978 1,387
Being purchased under a rent/buy scheme
Real estate agent 38,564 3,300 1,192 708 582 814
0%
10%
20%
30%
40%
50%
60%
70%
80%
90%
100%
Rented dwellings (in %)
Source: ABS Census 2006
Public housing is highly concentrated in certain suburbs of Charles Sturt, including:
§ Bowden (29% of all dwellings)
§ Renown Park (24%)
§ Ridleyton (19%)
§ Brompton (19%)
4.12 Population Projections
Note that these projections were reported on prior to the release of the 30 Year Growth Plan,
hence they do not describe projections related to the 30 Year Growth Plan. They focus on ABS
Population Projections, and previous Planning SA Projections. They also consider the State
Strategic Plan.
Population growth is the result of natural increase (births minus deaths) and net migration (both
domestic and international).
NOTE: Demographic Information in Sections 4 & 5 to be updated by Adelaide University Demographic Analysis Study 2011.
City of Charles Sturt Residential Growth + Character Study - Report No 1 Strategic Context 37
The population targets in the Strategic Plan are as follows:
§ Increase in South Australia’s population to 2 million by 2050, with an interim target of 1.64
million by 2014 (Between 1996 and 2001, population growth in South Australia has been low,
largely due to low natural increase and high outmigration of young persons and families to
other states.)
§ Fertility to be maintained at a rate of at least 1.7 births per woman
§ Reduce net interstate migration losses to zero by 2010, with a net inflow thereafter to be
sustained through to 2014, and
§ Increase net overseas migration gain to 8,500 persons per annum by 2014 (In 2008 net
international migration topped with just over 14,000 migrants settling in South Australia. In
recent times South Australia has been able to attract increasing numbers of new international
migrants, with City of Charles Sturt attracting a significant share of new migrants).
Adelaide is expected to accommodate a significant share of future population growth. According to
the projections Adelaide SD is projected to take up 71% of total population growth (net) in South
Australia.
The South Australian Government, Planning SA (now the Department for Planning and Local
Government), has prepared population projections. The projections take detailed ABS data into
account regarding population, mortality, fertility and migration. The projections cover a 30-year
period from 2001 to 2031.
Low, Medium and High Population Scenarios
There are three main scenario’s, low, medium and high, plus a new scenario reflecting the
population targets of South Australia’s Strategic Plan of late January 2007, referred to as ‘2 million
by 2050 scenario’.
Figures 22 and 23 show the projected population trends for SA and for Adelaide for the different
scenarios.

NOTE: Demographic Information in Sections 4 & 5 to be updated by Adelaide University Demographic Analysis Study 2011.
City of Charles Sturt Residential Growth + Character Study - Report No 1 Strategic Context 38
Figure 22. Populat ion project ions South Austra l ia (number of res idents) , 2001 - 2031
2001 (Base yr)
2006 2011 2016 2021 2026 2031
Low 1,511,728 1,551,787 1,585,670 1,606,774 1,627,343 1,644,945 1,656,245
Medium 1,511,728 1,553,201 1,608,358 1,649,833 1,688,240 1,723,968 1,753,430
2 mill by 2050 1,511,728 1,553,651 1,614,876 1,675,738 1,736,879 1,797,183 1,852,709
High 1,511,728 1,554,219 1,624,949 1,695,514 1,768,391 1,841,093 1,909,596
1,000,000
1,100,000
1,200,000
1,300,000
1,400,000
1,500,000
1,600,000
1,700,000
1,800,000
1,900,000
2,000,000
Population
Source: Planning SA, 2007
Figure 23. Populat ion project ions Adela ide SD, 2001 - 2021
2001 2006 2011 2016 2021
low 1,107,986 1,136,280 1,158,620 1,173,956 1,190,631
medium 1,107,986 1,137,354 1,174,872 1,204,165 1,232,805
high 1,107,986 1,138,089 1,186,378 1,237,703 1,292,651
estimated 2 mill 1,107,986 1,137,684 1,179,633 1,223,072 1,268,323
1,000,000
1,050,000
1,100,000
1,150,000
1,200,000
1,250,000
1,300,000
1,350,000
Population
Source: Planning SA (2007), SGS (2009)
NOTE: Demographic Information in Sections 4 & 5 to be updated by Adelaide University Demographic Analysis Study 2011.
City of Charles Sturt Residential Growth + Character Study - Report No 1 Strategic Context 39
The key difference between the medium and the ‘2 million by 2050 scenario’ is the
migration gain. The Government of South Australia attributes a critical role to migration in
influencing future population growth (Planning SA (2007), SA Population Projections).
Note that Planning SA has only provided data at the LGA level for the medium scenario only.
Furthermore, projections are made until 2021, as longer term projections at the local level are
deemed unreliable.
High Scenario
§ A total estimated population of 1.91 million residents.
§ It is important to note that ABS Estimated Residential Population (ERP) data show Adelaide’s
population reached 1,146,116 in 2006, which is tracking well above the high scenario
projection.
Medium Scenario
The 'medium' scenario is the autonomous trends or changes in population according business as
usual without the application of any policies that would steer or guide population changes in any
directions.
§ Population in Adelaide SD is projected to grow from 1.07 million persons in 2001 to 1.232
million persons in 2021
§ In Charles Sturt, population is projected to grow by 9,136 persons between 2001 and 2021,
resulting in a total population of 112,641 by 2021.
Low Scenario
In 2031, population in the Adelaide SD is projected to consist of 1.66 million residents.
According to the low scenario there would even be a drop in the number of persons younger than
65 years, and a duplication of persons aged 65+.
2 million by 2050 Scenario
The ‘2 million by 2050’ scenario is between the medium and high scenario, and would reach a total
population of 1.85 million by 2031.
Charles Sturt would see a total population of ~116,000 in 2021.
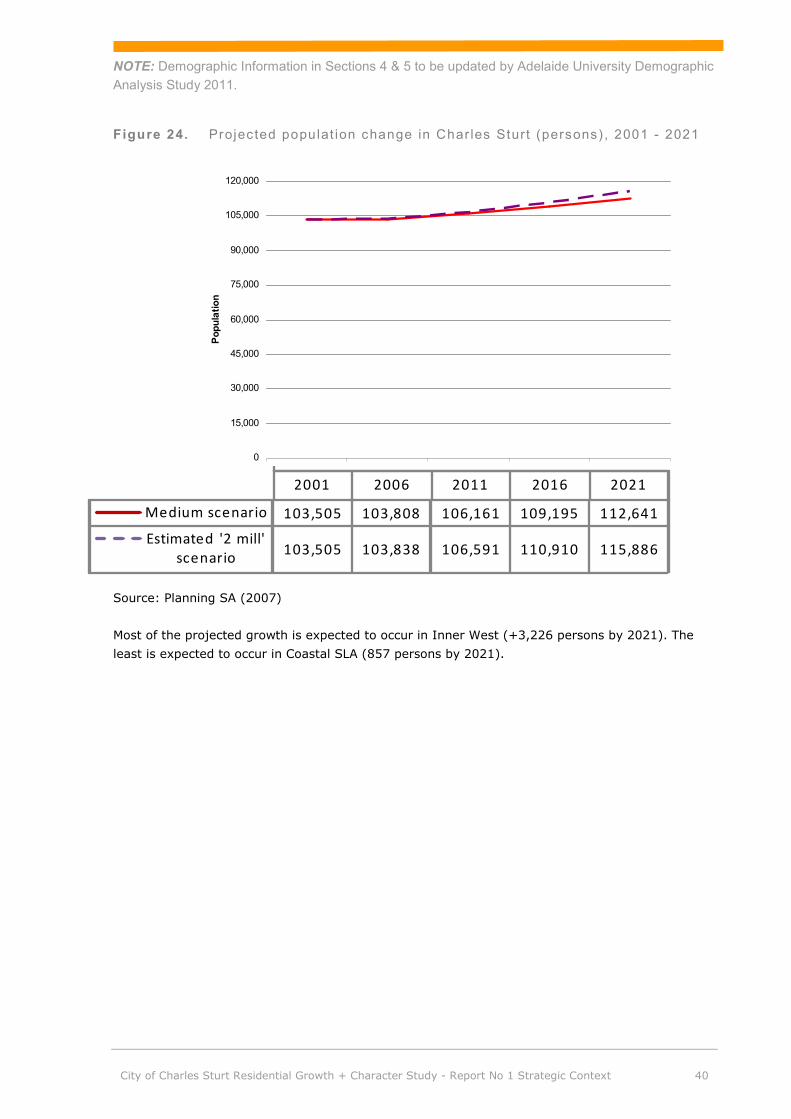
NOTE: Demographic Information in Sections 4 & 5 to be updated by Adelaide University Demographic Analysis Study 2011.
City of Charles Sturt Residential Growth + Character Study - Report No 1 Strategic Context 40
Figure 24. Projected populat ion change in Char les Sturt (persons) , 2001 - 2021
Source: Planning SA (2007)
Most of the projected growth is expected to occur in Inner West (+3,226 persons by 2021). The
least is expected to occur in Coastal SLA (857 persons by 2021).
0
15,000
30,000
45,000
60,000
75,000
90,000
105,000
120,000
Pop
ulation
2001 2006 2011 2016 2021
Medium scenario 103,505 103,808 106,161 109,195 112,641
Estimated '2 mill' scenario 103,505 103,838 106,591 110,910 115,886
102,000

NOTE: Demographic Information in Sections 4 & 5 to be updated by Adelaide University Demographic Analysis Study 2011.
City of Charles Sturt Residential Growth + Character Study - Report No 1 Strategic Context 41
5 Housing Trends - Drivers of Housing Demand
There are a number of key issues that influence the projected housing trends and drivers of
demand in City of Charles Sturt including housing affordability, ageing of the population,
decreasing housing size and migration increases.
5.1 Housing affordability
Housing affordability crisis
In 2005-06 there were 186,900 households on public housing waiting lists (FaCSIA, 2006). In
January 2009, the Australian Institute of Health and Welfare (AIHW) announced the waiting lists
had gone up to just over 200,000 households. Housing affordability is an issue nationwide for low
and moderate income households. Increasingly more households are experiencing housing stress,
i.e. households spending 30% of their income of more on housing.
The social housing sector, consisting of public and community housing, has historically been an
important provider of affordable housing to low income and special needs households. Over the last
ten years there has been a reduction in Australia’s social housing stock of 2% to 357,860 dwellings
in 2006 (ABS Census time series).
In no state or territory has the drop in the social housing stock been as strong as in South
Australia. There has been significant disinvestment in the public housing sector, with some of the
loss in public housing taken up by community housing providers. Overall, the drop in the social
housing stock in South Australia (from 1996-2006) was -10,000 dwellings. The public housing
stock contracted by approximately 12,500 while community housing providers expanded by 2,500
dwellings.
Figure 25. Changes in publ ic , community and total socia l hous ing stock by State/Terr i tory (number of dwel l ings) , 1996-2006
-15,000
-10,000
-5,000
-
5,000
10,000
New South Wales
Victoria Queensland South Australia
West Australia
Tasmania Northen Territory
Australian Territory
Public housing
Community housing
Sum Social housing
Source: ABS Census time series 1996, 2001 and 2006
NOTE: Demographic Information in Sections 4 & 5 to be updated by Adelaide University Demographic Analysis Study 2011.
City of Charles Sturt Residential Growth + Character Study - Report No 1 Strategic Context 42
Recent trends in social housing
In a speech to the Sydney Institute on March 19, 2009, the Commonwealth Minister of Housing,
the Hon Tanya Plibersek, outlined the beginnings of a comprehensive national policy on social
housing.
The Minister made similar observations to those set out above regarding the dramatic recasting of
the role social housing as a welfare safety net.
The role of public housing, at its inception during Australia’s post war reconstruction, was
to create an affordable and secure base from which tenants could build or rebuild their
lives. Public housing was a spring board allowing people to land softly and then jump out
of disadvantage…..But today public housing caters for a very different group of tenants.
Reduced Government investment has necessitated tighter targeting and this in turn has
resulted in the profile of public housing tenants becoming more disadvantaged over the
years. ..Whereas public housing was once an enabler, part of a housing career which
allowed working class people opportunities including home ownership, today it is too often
just a safety net that fails to provide the range of assistance required by tenants.
The Minister particularly highlighted the run down in investment as the key reason for the
residualisation of social housing.
The Social Housing Initiative is part of the Nation Building - Economic Stimulus Plan providing $6.4
billion to state and territory governments to substantially boost over the next three years the
supply of social housing currently available for disadvantaged Australians. This investment will see
the construction of 20,000 new dwellings and the refurbishment of 45,000 existing dwellings.
South Australia's public housing authority (Housing SA) as well as not for profit providers will be
involved in constructing new dwellings to meet these objectives. A key goal is to increase the
private sector’s and not for profit sector’s role in affordable housing. Some of the areas targeted
for increased public housing provision are in the City of Charles Sturt.
The SA Government has introduced a target for all new significant developments to include 15%
“Affordable Housing”, including 5% high need. The way in which this must be provided across the
City of Charles Sturt will vary, and is described further in Section 2.3.1 which discusses legislative
requirements and BDP module approaches. It is also discussed further in Report 5 - Development
Plan Policy Analysis for Growth Areas.
Definition
The State’s Housing Strategy defines affordable housing development as:
“housing that is affordable for low and moderate income households. A household is said to be
experiencing “housing stress” where the household is low income (that is, the lower 40% of income
distributions) and spends more than 25% of gross income on rent or 30% on mortgage repayments”.
It is important to understand that affordable housing development refers to much more than the cost of
rent or the purchase price of a dwelling. Other issues need to be considered in relation to the design and
provision of affordable housing development. Providing affordable housing that meets the definition

NOTE: Demographic Information in Sections 4 & 5 to be updated by Adelaide University Demographic Analysis Study 2011.
City of Charles Sturt Residential Growth + Character Study - Report No 1 Strategic Context 43
cited above is relatively meaningless, unless associated issues such as proximity to services and
transport, energy efficient design and a range of housing types and targeting affordability to different
groups (eg first home buyers, workforce housing, migrants) are addressed.
Rationale
To better appreciate potential solutions relating to the housing affordability issue, the following four
key factors have a significant impact on establishing affordable housing:
§ availability of inexpensive land;
§ ability to obtain a high dwelling yield per allotment (eg medium/high density residential allotments);
§ ability to limit dwelling sizes (eg promotion of 1 bedroom dwellings / apartments); and
§ ability to control resale value of dwellings originally constructed for the affordable housing market.
Previous studies, including those from Radford and Sarris (2003) and Wendy Sarkissian (2004),
have indicated that affordable housing policies must be based on an understanding of the
expectations held by occupants, neighbours, providers and society.
The expectations of occupants are that affordable housing should:
� be close to facilities and services (eg shops and public transport);
� have safe and secure (focus on Crime Prevention Through Environmental Design Principles);
� have private indoor areas;
� be comfortable with enough space, including space nearby for children’s play;
� include small dwellings (ie small kitchen, laundry, combined with bathroom or cupboard, 1-2 small bedrooms, and one bathroom per dwelling (no ensuite);
� have low running costs;
� have an appearance that is not distinguishable from other housing; and
� have reduced car parking spaces (eg 0-1 per dwelling).
The expectations of neighbours are:
� low or positive impact on neighbouring residents and property;
� low or positive impact on traffic and parking; and
� they are designed in contextual with the character of the neighbourhood.
The expectations of housing providers/owners are:
� low cost;
� low maintenance;
NOTE: Demographic Information in Sections 4 & 5 to be updated by Adelaide University Demographic Analysis Study 2011.
City of Charles Sturt Residential Growth + Character Study - Report No 1 Strategic Context 44
� adaptable (to allow a wide range of future occupiers);
� sustained asset value;
� ability to quickly liquidate asset.
The expectations of society are:
� environmentally sustainable (energy efficient, minimal negative effects on local and global environments, quality urban design);
� socially sustainable (a mix of income groups living in the City and inner suburbs);
� economically sustainable (strategies that are viable in the long term).
Several Australian Housing and Urban Research Institute (AHURI) reports have articulated a range
of barriers to private sector involvement in the affordable housing market. Despite a range of
approaches covered, a general conclusion of these studies is that current conditions in Australia
have not, to date, facilitated private sector investment in the affordable housing sector. A number
of significant barriers exist preventing more interest, especially by the financial institutions (eg
superannuation trusts), in the provision of rental housing at the affordable end.
These barriers relate to:
� Low returns;
� High risks – revenue, credit, financial and profit risks;
� High management costs;
� Liquidity (how quickly assets can be disposed of);
� Poor and incomplete market information on the performance of housing as an asset;
� No established track record for this asset class.
� Dealing with the issue of inadequate returns, given the perceived risks, is central to encouraging greater private sector investment in the private sector.
5.2 Ageing of Population
Ageing of population will accelerate over the next 20 years. Most of the expected growth will occur
in the older age groups.
In the Adelaide (SD) the number of persons aged 65 and over is expected to grow by 83,893 to
86,526 persons. This shift in the population’s age profile will have profound consequences for the
future demand for housing, (health) facilities and services. In particular it will influence a
significant proportion of the type and location of housing that should be developed into the future.
In January 2009 AHURI published a positioning paper on the housing needs of older home owners,
called “Dwelling, land and neighbourhood use by older Home Owners”. Home ownership is
particularly high among older households. The 2002-03 Survey of Income and Housing indicates
NOTE: Demographic Information in Sections 4 & 5 to be updated by Adelaide University Demographic Analysis Study 2011.
City of Charles Sturt Residential Growth + Character Study - Report No 1 Strategic Context 45
that in Australia 80% of older person households lived in their own home, without a mortgage (Cat
No. 4130.0.55.001 Housing Occupancy and Costs, Australia, 2002-03).
Increasingly, older people prefer to remain living independently in their own home for as long as
possible. Due to ageing of population the costs related to aged and health care are expanding
rapidly. Providing care at people’s own homes meets people’s preferences and is cheaper.
Therefore, the Australian Government has since the 80s introduced a number of policies and
programmes to support people to live in their own homes for as long as possible. Recently, some
initiatives were launched to:
• Improve housing design, enabling people to maintain accommodation or move to more
suitable accommodation4
• Improving awareness amongst consumers and the building industry1
• Encouraging innovation in housing design1
• Multidisciplinary strategy to build more age friendly environments5 including improvements
in land use planning, transport investment, building regulations, design of public spaces
and community crime prevention
Some key statistics and findings:
• Health and disability issues increase markedly with age and many older persons are
primary carers for partners or others.
• Only 7% of persons aged 65 and over live in residential aged care.
• The dominant dwelling types among persons aged 65 and over, are separate houses, with
more medium and higher density housing as age increases.
• Most older resident households own their home outright (80%). Of older person households
renting, 50% is in public housing. For households younger than 65 years of age this is only
16%.
• Within cities, older people are more concentrated in certain suburbs, often in coastal
locations, high amenity inner-middle or outer suburbs, or in areas with high amounts of
public housing.
• Older resident households (mostly one and two person households) predominantly occupy
three bedroom dwellings, implying most households would have some spare capacity.
• Public transport becomes more important with age, particularly for women.
• Difficulties that may arise when staying in their own home include property maintenance,
health care needs, transport, housework and mobility difficulties.
4 National Strategy for an Ageing Australia (Australian Government, 2002) 5 Prime Minister’s Science, Engineering and Innovation Council (2003)

NOTE: Demographic Information in Sections 4 & 5 to be updated by Adelaide University Demographic Analysis Study 2011.
City of Charles Sturt Residential Growth + Character Study - Report No 1 Strategic Context 46
Medium Scenario
Between 2001 and 2021 the number of persons aged 65 and over will grow by 68% or by
approximately 85,000 people, while total population is projected to grow by 11% and the number
of persons younger than 65 by 4% only (see table below).
Figure 26. Projected ageing of populat ion in Adela ide SD (count and % of populat ion change), 2001 - 2021 (medium scenar io)
Population growth
(count)
Change
(in %)
Total population growth 124,819 +11%
Persons aged 65+ 85,091 +68%
Persons <65 years 39,728 + 4%
Source: Planning SA (2007); computations SGS (2009)
Figure 27. Projected populat ion change in SLAs of Char les Stur t (persons, medium scenar io) , 2001 - 2021
2001 2006 2011 2016 2021
Coastal 31,495 30,981 31,205 31,702 32,352
Inner East 21,501 21,733 22,357 23,100 23,922
Inner West 24,710 25,092 25,945 26,901 27,936
North-East 25,799 26,002 26,654 27,492 28,431
20,000
22,000
24,000
26,000
28,000
30,000
32,000
34,000
Population
Source: Planning SA, 2007
Ageing of population will change the age profile of the population as 60% of projected growth will
consist of persons aged 65 and over. The number of persons aged 65 and over is projected to
increase by 29% (See Figure 22). The population of Coastal SLA – which already is the oldest
population - is expected to ‘age’ more profoundly than the other SLAs. In 2021 there will be 67%
more persons aged 65 and over compared to 2001. Inner East will be the single SLA experiencing
an absolute drop in the number of persons aged 65 and over. The current relatively young
population is expected to grow markedly.
NOTE: Demographic Information in Sections 4 & 5 to be updated by Adelaide University Demographic Analysis Study 2011.
City of Charles Sturt Residential Growth + Character Study - Report No 1 Strategic Context 47
5.3 Decreasing Household Sizes
Average household sizes and occupancy rates of privately owned dwellings have been decreasing in
Australia for many years. Smaller families, increase in single person households and ageing of
population are important drivers of this trend.
The first State of Supply Report by the National Housing Supply Council (NHSC), released in March
2009, indicates a significant and growing housing shortfall. Unless there are significant responses
by the industry and by the government, the shortfall will increase over the next 20 years and the
affordability of housing will further deteriorate. It is noted that the population projections by the
NHSC are lower than the estimates and growth target by the South Australian Government. The
NHSC estimates are based on ABS population projections.
At a national level demand for housing will come from:
• Single person households (+63.7% increase from 2008 to 2028)
• Couple households without children (+36.7%)
• Single-parent families (+23.7%)
• Two-parent families (+20%)
5.4 Migration
Another key characteristic of population growth and hence housing demand in Adelaide (SD) and
Charles Sturt is the arrival of overseas migrants. Research shows that their ability to (quickly) find
appropriate housing can enhance their settlement process and reduces their long term needs for
assistance and social services.
In June 2002 Australian Housing and Urban Research Institute (AHURI) published a research report
“The housing and other service needs of recently arrived immigrants”. The report indicates tenure
types vary by category of immigrant, with the visa category, educational qualifications, country of
birth and age being the key variables. Immigrants arriving under the Independent, Business Skills,
Employer Nomination and Concessional Family streams tend to enter home purchase within 3.5
years after arrival, with many commencing in the private rental market.
In general, most immigrants commence in the private rental market. Those arriving under the
Humanitarian program, Preferential Family program and those requiring high levels of education
and language training tend to rent in private (often receiving Rent Assistance) and public sector
and tend to remain in the rental sector for a longer period of time.
Support from community members is a significant contributor for successful settlement in
Australia.
The study found there is no consolidated approach, to recent immigrants that combines housing
assistance, labour market access, mobilising social capital and other services.

NOTE: Demographic Information in Sections 4 & 5 to be updated by Adelaide University Demographic Analysis Study 2011.
City of Charles Sturt Residential Growth + Character Study - Report No 1 Strategic Context 48
While there has been a cut by 14 per cent to the national 2008–09 permanent skilled migration
program intake from 133,500 to 115,000, this is a relatively small reduction from what was
historically an exceptionally high national immigration target.
Such a reduction will have the effect of removing building and manufacturing trades from the
Critical Skills List – such as bricklayers, plumbers, welders, carpenters and metal fitters – with the
list now comprising mainly health and medical, engineering and IT professionals.
It is likely that immigration to South Australia will continue at historically high levels for several
decades, even if temporary cuts occur in response to unfavourable economic conditions and rising
unemployment.

City of Charles Sturt Residential Growth + Character Study - Report No 1 Strategic Context 49
6 Appendix 1: State Government Policy Directions and Implications For Future Growth
• Policy • Relevant
Policies
• Implications / Key initiatives / Targets of policies
• South
Australian
Strategic
Plan
•
• (Statewide
Plan
specifying
desired
future for
South
Australia.)
• Objective 1:
Growing
Prosperity
• T 1.21
Adequate
strategic
infrastructure
• T 1.22- T 1.25
Increase
South
Australia’s
Population
• Objective 2:
Improving
Wellbeing
• T 2.1-T 2.6
• Increase
Healthy Life
Expectancy,
Increase
Exercise,
Reduce
Chronic
Diseases
• T 2.7 Improve
psychological
wellbeing
• Ensure key economic and social infrastructure is provided
to the community
• Additional dwellings and population in Council
• Encourage walking and exercise within neighbourhoods
• Ensure adequate open space for recreation
• Create attractive areas in which to live to encourage
positivity about environment

City of Charles Sturt Residential Growth + Character Study - Report No 1 Strategic Context 50
• Policy • Relevant
Policies
• Implications / Key initiatives / Targets of policies
• Objective 3:
Attaining
sustainability
• T 3.5, T 3.6
Reduce
Greenhouse
gas emissions;
increase use
of public
transport
• T 3.12 - T
3.14
• Reduce
reliance on
non-renewable
energies
• T 6.7 Increase
affordable
housing
• Ensure transport corridors are developed in a safe
sustainable and controlled manner
• Provide efficient public or Council provided transport
routes and options
• Reduce daily vehicle trips per household
• Proximity and accessibility to services
• Dwellings and buildings designed to reduce non-renewable
energy reliance
• Seek ways of increasing affordable housing and
implementing same
• Regional
Spatial
Framework
for
Metropolitan
Adelaide
§ Local employment opportunities enhanced – near nodes & transport corridors.
§ Further development of centres as public and community spaces as well as retail hubs.
§ Maintenance of viability of established smaller walkable facilities and centres.
§ Recognition of true role and function of West Lakes and Arndale.
§ Accommodation of mixed use and apartment development.
§ Reviewing the roles and future of industrial areas and employment.
§ Addressing demands for bulky goods retailing.
• Planning
Strategy for
Metropolitan
Adelaide
• METRO WIDE
POLICIES
• 3.1 Water
Resources
• (Policies 1,2)
• Design development that incorporates efficient and
integrated disposal of water
• Ensure Water Sensitive Urban Design is considered

City of Charles Sturt Residential Growth + Character Study - Report No 1 Strategic Context 51
• Policy • Relevant
Policies
• Implications / Key initiatives / Targets of policies
• 3.3 Open
Space,
Recreation
and Sport
• (Policies 1 - 4)
• 3.4 Land Use
and Transport
Integration
• (Policies 1, 2,
3, 4, 9)
• Improvement in access and availability to open space
• Plan and provide for a network of accessible sport and
informal recreation facilities.
• Develop and maintain waterway linear parks
• Integrate transport and land use planning decisions to
facilitate a safe, sustainable and effective transport
network
• Facilitate transit-oriented development around selected
high-service public transport routes
• Promote transit-focused neighbourhoods along public
transport routes identified on the Adelaide Metropolitan
Spatial Framework (Figure 1)
• Locate higher intensity uses within walking distance of
transit stops
• Incorporate provision of public transport in new
development
• Increase dwelling densities near major public transport
routes, stations and interchange points
• Provide safe, attractive and convenient walking and
cycling environments to encourage walking and cycling to
destinations
• Ensure integrated transport and land use supports quality
of life outcomes.
• Allow for and encourage buildings designed with low
energy consumption
• Encourage higher density development where there is
spare infrastructure

City of Charles Sturt Residential Growth + Character Study - Report No 1 Strategic Context 52
• Policy • Relevant
Policies
• Implications / Key initiatives / Targets of policies
• 3.11 Health
and
Community
Services
• (Policies 1, 2)
• 3.12 Hazard
Avoidance,
Minimisation
and
Management
• (Policies 1, 3,
4, 5, 6)
• RESIDENTIAL
AND URBAN
DEVELOPMENT
• 3.14 Activity
Centres
• (Policies 1-7)
• Locate schools, community and adult learning facilities in
or near neighbourhood and district activity centres to
allow convenient access by all methods
• Support the physical, mental and social health of
individuals and communities by ensuring good access to a
range of facilities
• Encourage a range of housing options in easy access
locations to activity centres making it possible for aged
and those with disabilities to live more independently
• Reduce flooding risk to population
• Place greater emphasis on role of activity centres
particularly neighbourhood and local activity centres in
revitalising and strengthening local communities
• Develop activity centres in accordance with Activity
Centres Hierarchy
• Increase diversity and density of housing in and around
activity centres, including alternative forms of housing and
mixed-use developments
• Ensure layout and design of activity centres facilitate ease
of access and are well connected to the surrounding
areas.
• Ensure pedestrian environments within activity centres
are walkable, direct, convenient, safe, well-signposted,
sheltered and shaded and accommodate disabled access.
• Redevelop existing, and design new activity centres to

City of Charles Sturt Residential Growth + Character Study - Report No 1 Strategic Context 53
• Policy • Relevant
Policies
• Implications / Key initiatives / Targets of policies
• 3.15
Residential
Neighbourhoo
incorporate direct and highly accessible connections to
public and community transport facilities.
• Locate high-activity and employment-generating uses in
close proximity to public transport interchanges and stops
within activity centres.
• Encourage development of new transit focused activity
centres in selected locations which complement the
existing Activity Centres Hierarchy.
• Encourage shared access and car-parking arrangements
between different uses in activity centres.
• Ensure appropriate urban design and planning of activity
centres to achieve high quality, attractive and functional
outcomes particularly in public spaces.
• Improve strip-style activity centres to embrace principles
of main street design, including consolidation of car-
parking and access and the introduction of housing above
and behind commercial uses.
• Retain and protect heritage assets.
• Provide supply of residential land that is well serviced,
appropriately zoned and capable of accommodating
projected housing demand.
• Ensure release and development of land and infrastructure
that reflects the preferred sequencing as per the
Residential Metropolitan Development Program.
• Prepare structure plans for future residential
development.
• Promote higher population densities in appropriate
locations however protecting desired character and
heritage.
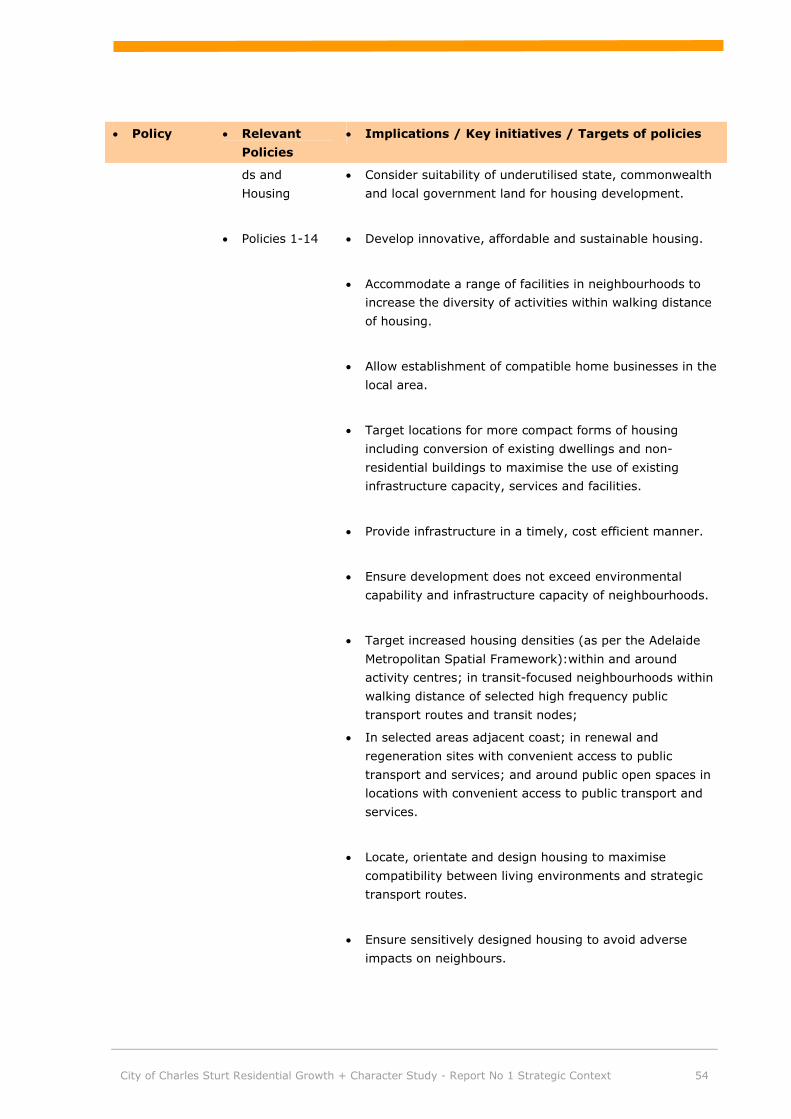
City of Charles Sturt Residential Growth + Character Study - Report No 1 Strategic Context 54
• Policy • Relevant
Policies
• Implications / Key initiatives / Targets of policies
ds and
Housing
• Policies 1-14
• Consider suitability of underutilised state, commonwealth
and local government land for housing development.
• Develop innovative, affordable and sustainable housing.
• Accommodate a range of facilities in neighbourhoods to
increase the diversity of activities within walking distance
of housing.
• Allow establishment of compatible home businesses in the
local area.
• Target locations for more compact forms of housing
including conversion of existing dwellings and non-
residential buildings to maximise the use of existing
infrastructure capacity, services and facilities.
• Provide infrastructure in a timely, cost efficient manner.
• Ensure development does not exceed environmental
capability and infrastructure capacity of neighbourhoods.
• Target increased housing densities (as per the Adelaide
Metropolitan Spatial Framework):within and around
activity centres; in transit-focused neighbourhoods within
walking distance of selected high frequency public
transport routes and transit nodes;
• In selected areas adjacent coast; in renewal and
regeneration sites with convenient access to public
transport and services; and around public open spaces in
locations with convenient access to public transport and
services.
• Locate, orientate and design housing to maximise
compatibility between living environments and strategic
transport routes.
• Ensure sensitively designed housing to avoid adverse
impacts on neighbours.

City of Charles Sturt Residential Growth + Character Study - Report No 1 Strategic Context 55
• Policy • Relevant
Policies
• Implications / Key initiatives / Targets of policies
• Encourage higher housing densities in transit-focused
neighbourhoods while preserving local qualities such as
neighbourhood character and heritage and safety.
• Promote more compact neighbourhoods, particularly
around activity centres, to reduce travel.
• Encourage potential ‘coastal growth areas’.
• Change focus from minimum car-parking requirements for
housing to maximum car-parking requirements,
particularly in transit-oriented development.
• Provide a range of housing types to accommodate a
variety of residents and their needs.
• Facilitate and support a variety of affordable housing
options (including a target of 15% affordable housing
including a 5% component for high need housing).
• Ensure areas identified in the Residential Metropolitan
Development Program for redevelopment address
potential impact on supply of affordable and high need
housing.
• Explore financial models to raise funds for affordable
housing.
• Encourage a broad distribution of social housing.
• Reinforce the importance of active street frontages.
• Prioritise urban regeneration projects based on social,
economic and environmental benefits to be gained.
• Use underutilised government land to maximise urban
regeneration opportunities.
• Maximise the potential for infrastructure projects to

City of Charles Sturt Residential Growth + Character Study - Report No 1 Strategic Context 56
• Policy • Relevant
Policies
• Implications / Key initiatives / Targets of policies
stimulate urban regeneration and economic development.
• Ensure policies relating to areas likely to be subject to
urban regeneration promote innovation, housing diversity
and housing affordability.
• Stimulate private investment in urban regeneration
projects to revitalise public housing areas.
• Charles Sturt is part of the Inner West. Sites identified in
City of Charles Sturt as development sites are:
• the former Sheridan site;
• St Clair Recreation facility; and
• Brompton regeneration site.
• Infrastructure upgrades mentioned are stormwater, sewer
augmentation for some areas and some roads are
approaching capacity. More work required to determine
the human services of the area required.
• 30 Year Plan
for Greater
Adelaide
Technical
Reports for
Western
Adelaide
Region
• Increased densities along Main Corridors (Woodville
Road, Port Road, Torrens Road)
• Port Road/.Torrens Road rail corridor
• Grange Road proposed light rail
• Regeneration areas/ infill adjacent to main railway
stations
• TOD sites at Clipsal, West Lakes and Woodville
• An additional 90,000 people in Western Region to 2038
• Greenways along transit corridors
• 15% affordable housing in new development
• Housing
Plan for SA
• (Plan to
make
affordable
housing
available to
more
• Objective 1:
Affordable
housing and
strong
communities
• Undertake new developments in partnership with local
government and industry to provide a mix of affordable
and high need housing opportunities
• Expand supply of affordable housing by implementing a
target of 10% affordable and 5% high need housing in all
significant new housing developments. Industry, local
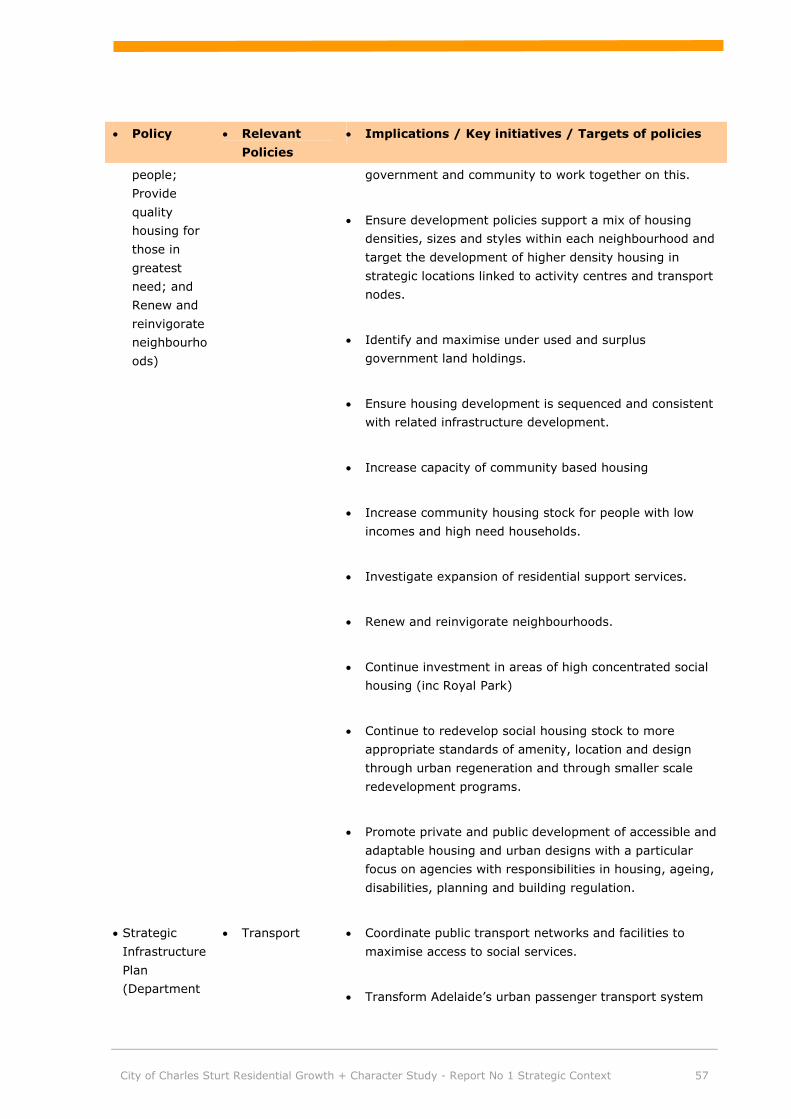
City of Charles Sturt Residential Growth + Character Study - Report No 1 Strategic Context 57
• Policy • Relevant
Policies
• Implications / Key initiatives / Targets of policies
people;
Provide
quality
housing for
those in
greatest
need; and
Renew and
reinvigorate
neighbourho
ods)
government and community to work together on this.
• Ensure development policies support a mix of housing
densities, sizes and styles within each neighbourhood and
target the development of higher density housing in
strategic locations linked to activity centres and transport
nodes.
• Identify and maximise under used and surplus
government land holdings.
• Ensure housing development is sequenced and consistent
with related infrastructure development.
• Increase capacity of community based housing
• Increase community housing stock for people with low
incomes and high need households.
• Investigate expansion of residential support services.
• Renew and reinvigorate neighbourhoods.
• Continue investment in areas of high concentrated social
housing (inc Royal Park)
• Continue to redevelop social housing stock to more
appropriate standards of amenity, location and design
through urban regeneration and through smaller scale
redevelopment programs.
• Promote private and public development of accessible and
adaptable housing and urban designs with a particular
focus on agencies with responsibilities in housing, ageing,
disabilities, planning and building regulation.
• Strategic
Infrastructure
Plan
(Department
• Transport
• Coordinate public transport networks and facilities to
maximise access to social services.
• Transform Adelaide’s urban passenger transport system

City of Charles Sturt Residential Growth + Character Study - Report No 1 Strategic Context 58
• Policy • Relevant
Policies
• Implications / Key initiatives / Targets of policies
of
Infrastructure
, the plan
identifies
opportunities
for improving
infrastructure
in our state)
• Land
• Community
Services and
Housing
into a cost-effective, environmentally friendly fuels and
transport modes.
• Reduce impact of passenger transport on the environment
by using environmentally friendly fuels and transport
modes.
• Ensure residential land supply is available when needed to
meet market demand.
• Ensure that planning for residential developments is more
closely integrated with infrastructure and transport
planning.
• Make changes to planning system to increase housing
densities in strategic locations and to increase the supply
of affordable housing in locations that have access to
infrastructure and services.
• Improve community access by better linking housing to
transport infrastructure and services.
• Increase housing options and the level of social housing
stock available for high need or homeless people,
including the development of long-term transitional
accommodation.
• Develop capacity for new joint ventures between
government, not-for-profit organisations, private sector
and local government to develop new, affordable and high
needs housing and support community aspirations for
home ownership.
• Accelerate areas urban regeneration in areas of
disadvantage to improve amenity for tenants and expand
housing choice.
• Encourage higher-density residential development in
appropriate urban areas through planning for land use and
infrastructure augmentation.

City of Charles Sturt Residential Growth + Character Study - Report No 1 Strategic Context 59
• Policy • Relevant
Policies
• Implications / Key initiatives / Targets of policies
• South
Australia
Works in the
Regions
2006-2009
Strategic
Plan
• (Departmen
t of Further
Education,
Employment
, Science
and
Technology’
s vision for
employment
and skill’s
vision for
future)
• Create
employment
and skill
formation
opportunities
for western
suburb
residents
particularly
those
disadvantaged
in the
workforce,
through
building
effective
partnerships
with industry,
Government
and the
community.
• Four objectives that largely discuss assisting the residents
of the Western Adelaide Region in employment and
gaining skills, particularly those in disadvantaged areas ie
the Parks and others considered disadvantaged.
• Industrial
Land
Strategy
(strategic
document
that
provides a
framework
for provision
of industrial
land in the
metropolita
n area for
short,
medium and
long term
(up to 15
years)
• Part 1
identifies
government,
industry roles
and the
strategic and
policy context
• Map 1
identifies
industrial
areas that
shows 3 key
strategic
industrial
areas (not in
subject
Council)
• Part 2
• Objective 1: provide a rolling 400-600 hectare supply of
industrial land sites that are ready for development.
• Action 1: Encourage Councils to adapt policies and zoning
provisions in Development Plans to protect strategic and
other industrial sites to secure future industrial activities.
• Objective 2: Identify a rolling 15-year industrial land
bank.
• Action 3: Develop and Industrial Land Program for the
supply and release of industrial land in both private and
government ownership.
• Action 4: Investigate land banking as a mechanism for
timely supply of industrial land.
• Action 5: Undertake master planning and feasibility
studies of existing and future strategic industrial areas.

City of Charles Sturt Residential Growth + Character Study - Report No 1 Strategic Context 60
• Policy • Relevant
Policies
• Implications / Key initiatives / Targets of policies
provides an
analysis of
demand,
supply and
infrastructure
issues and
projects.
• Part 3
identifies the
industrial land
strategy,
protecting or
rezoning
industrial land
(includes an
assessment
framework
that takes into
account ‘prime
industrial
land’) and
actions for
implementatio
n
• Action 6: Coordinate timely provision of infrastructure to
key sites and locations.
• Action 7: Encourage the consolidation of existing industrial
sites through redevelopment of brownfields and infill of
under-utilised sites and through rezoning opportunities.
• Objective 3: Monitor industrial land supply, demand and
use.
• Action 9: Maintain a database with input from State, Local
Government and private sources.
• Action 10: Monitor local, national and international trends
to ensure policies meet industry requirements.
• Action 11: Establish a joint State, Local and private sector
industry reference group to monitor industrial land supply,
demand and use issues and trends.
• Objective 4: Review the strategy, assessment framework
and regulatory controls.
• Action 13: Regularly review the effectiveness of the
Assessment Framework.
• Action 14: When Councils review Development Plan
policies, ensure that such policies and zoning protect and
stimulate industrial and mixed use development.

City of Charles Sturt Residential Growth + Character Study - Report No 1 Strategic Context 61
7 Appendix 2 City of Charles Sturt Policy Directions and Implications for Future Growth
• Policy
Document
• Relevant
Policies
• Implications / Key initiatives / Targets of
policies
• City of
Charles Sturt
Industrial
Land Study
• (defines
“Prime
• Industrial
Areas” (PIA’s)
against a
dozen criteria,
and reinforces
this by also
requiring
• assessment of
rezoning
potential.)
• Provide
directions for
Council and
identify pockets
of land which is
no longer
required for
industrial uses.
• Sites identified that have potential to be re-zoned for
an alternative use:
§ West Lakes (Corner West Lakes Boulevard and
Frederick Road)
§ Seaton (Corner of Trimmer Parade and adjacent the
railway line)
§ Devon Park (Adjacent to the railway line, north of
Torrens Road)
• Other sites with possible re-zoning potential include:
§ Kilkenny (adjacent the railway line and Kilkenny Road)
§ Royal Park (corner Tapleys Hill Road and Port Road)
§ Kidman Park South (along Findon Road)
§ Bowden/Brompton (Clipsal Site)
• City of
Charles Sturt
Community
Plan
•
• (Vision
resulting from
collaboration
with the
community
determining
the desired
characteristics
of the City for
2027)
• Summary of
Consultation
• Strategy 2.2.1
• Provide for
appropriately
located, mixed
density housing
that caters for
our diverse
population
(supporting
T1.22, T6.7)
• Affordable
Housing
• Supporting the State Strategic targets, more
specifically to:
§ Increase South Australia’s population to 2 million by
2050
§ Increase affordable home purchase and rental
opportunities by 5% by 2014

City of Charles Sturt Residential Growth + Character Study - Report No 1 Strategic Context 62
• Policy
Document
• Relevant
Policies
• Implications / Key initiatives / Targets of
policies
on Built Form
• Protect the
character and
heritage of the
City
• Provide a
balance of
housing
densities
§ Affordable housing for the aged including more
retirement villages (to enable them to remain in the
local area)
§ Affordable housing for all age groups and particularly
young families to enable them to stay in the area
they grew up in
§ Fewer Housing Trust homes
§ Provide for a balance of homes at the high end and
low end of the market
§ Protect heritage landmarks such as the Burley Griffin
furnace;
§ Old world charm needs to be preserved
§ New housing development is improving the character
of areas like Royal Park and parts of Seaton
§ Retain character and heritage (and charm) of the older
parts of the City (Bowden, Brompton, Croydon, West
Croydon)
§ New developments to be designed to compliment the
heritage and character of the City
§ Eclectic mix of old and new buildings
• Note: There are mixed views about the character of
housing (there is a desire to retain the character of
the older parts of the City with Tudor, Bungalow
homes etc (eg Bowden, Brompton, Croydon, parts of
Allenby Gardens, Cheltenham, etc) but the
development that is occurring in parts of Seaton and
Royal Park and the redevelopment of former housing
trust areas is generally seen as a positive.
§ The trend towards increased housing densities is
taking away the thing that has made the area
attractive to many people (space, peace and quiet,
room to move)
§ Prevent intensification of foreshore development to
minimise impacts on the Coast
§ High density housing and student accommodation to
be selective and well planned in association with
transport nodes (eg at Bowden, Croydon, Woodville,
Seaton and Grange stations, Hindmarsh end of Port

City of Charles Sturt Residential Growth + Character Study - Report No 1 Strategic Context 63
• Policy
Document
• Relevant
Policies
• Implications / Key initiatives / Targets of
policies
• Protect and
enhance open
space
• Attractive and
integrated
streetscapes
Road) – this will also create higher demand for public
transport
§ Minimum ratios of development to private open space
on private developments should be increased
§ High density living and multi-story apartments need to
consider noise attenuation and traffic implications on
adjoining land uses / neighbours
• Note: There are mixed views about increasing the
density of residential development from no high rise at
all to high rise at select locations (associated with
transport nodes or in the Hindmarsh area close to the
City).
• There is concern about the amount of private open
space in areas of high density.
• In addition, there seems to be a strong desire to
contain housing density along the coast with a concern
that high density will reduce public access to the
beach and will adversely impact on the sustainability
of the coast.
§ Ensure adequate private and public open space is
provided in areas where housing density is increasing
§ Ensure well developed, accessible, usable and well
maintained public open space is provided for sport,
active and passive recreation particularly as housing
densities increase
§ Establish and maintain a network of connected open
space including the River Torrens Linear Park and
Coast Park that is accessible by all people
§ Develop selected open space for wetlands and
biodiversity - natural areas that create clear
separation from the built form
§ Develop Cheltenham Racecourse as a wetland with a
range of recreation and sport opportunities provided
within the open space
§ Enhance the Freshwater Lake on Delfin Island
§ Port Road to be upgraded as the major boulevard
linking the City to the Port with varied and

City of Charles Sturt Residential Growth + Character Study - Report No 1 Strategic Context 64
• Policy
Document
• Relevant
Policies
• Implications / Key initiatives / Targets of
policies
• Places for People
complimentary land uses (residential, retail,
commercial)
§ Tapleys Hill Road streetscape to be upgraded – a
major thoroughfare
§ Identify and develop local ‘places for people’ / villages
eg Hindmarsh end of Port Road, Henley Square,
Grange Jetty, Woodville Road, sections of the coast –
which provide for people of all ages
§ New private development along the beach and lake to
be limited in scale to ensure these areas remain
accessible to the public.
§ Accessible shopping areas
§ A variety of cafes (including outdoor) and restaurants
suitable for the different lifestyle needs of the
community – affordable, child and family friendly,
young people, variety of cuisine – that are easily
accessible
§ Create a soul / heart within the City
§ Retain a mix of residential, commercial and industrial
land uses
§ Create industrial and commercial precincts that are
separated from residential areas, that are
environmentally responsible and good corporate
citizens (ie low emissions, low noise, maintain
attractive streetscapes, minimise traffic impacts)
§ Encourage a mix of accessible shopping experiences –
local (Mirani Court / corner shop), district (Fulham
Gardens / Findon) and regional (West Lakes /
Arndale)
§ Accessible, affordable, diverse restaurant strips
(Woodville Road, Port Road Hindmarsh, Henley
Square, along the coast)

City of Charles Sturt Residential Growth + Character Study - Report No 1 Strategic Context 65
• Policy
Document
• Relevant
Policies
• Implications / Key initiatives / Targets of
policies
• City of
Charles Sturt
Traffic
Management
Strategy
• (A study
undertaken to
determine the
definition of
the road
network, local
areas and
precincts, as
well as the
methodology
for prioritising
the precincts
for further
study)
• The strategy
assesses general
traffic
behaviour;
develop
strategic
principles and
guidelines for
traffic
management,
• develop a
structure for
defining a road
hierarchy, define
local traffic
areas for future
study, establish
a prioritised
approach to
studying the
local traffic
areas and;
• develop a
process for
undertaking
studies on these
local traffic
areas.
• The Strategy has identified the need to review
Council’s bicycle plan and prepare a pedestrian plan. It
also establishes a road hierarchy which is used to
determine the types of abutting land uses.
• City of
Charles Sturt
Transport
Strategy
• (aims to
provide a
framework for
decisions
making with
respect to the
• maintenance
and
• 7.1 Integrated
Land Use and
Transport
• Objective:
Maximise the
land use-
transport
development
relationship.
§ Defining precincts based on commercial, residential,
and industrial land uses for the future development of
traffic management and land use strategies.
§ Review the Development Plan to allow for the gradual
removal of inappropriate or conflicting land uses from
each precinct.
§ Encourage medium and high density urban
development around existing transport nodes and
along transport corridors. Build on the significant
analysis by Planning SA of the opportunities to
introduce Transport Orientated Developments.

City of Charles Sturt Residential Growth + Character Study - Report No 1 Strategic Context 66
• Policy
Document
• Relevant
Policies
• Implications / Key initiatives / Targets of
policies
development
of the
transport and
land use
systems)
• City of
Charles Sturt
Open Space
Strategy
• (guides the
provision,
development
and
management
of open space
over the next
20 years)
• 1.3 Develop
open space that
meets the
demand created
by urban
consolidation
• With continued
urbanisation and
infill
development
throughout the
City, the role of
urban
regeneration in
providing new
open space,
links, habitats
and stormwater
management
opportunities is
significant.
• 1.3.1 Develop open space that responds to urban
consolidation within the City of Charles Sturt.
• Any new development must be considered in the
terms of opportunities for open space and greenways
provision through WSUD and the relative Stormwater
Catchment Management Plans.
• Some areas such as Fulham Gardens, Kidman Park
and West Lakes Shore have a high level of open space
provision. There are also issues with the quality of a
large number of reserves, including facility/asset and
landscape quality.
• In general, an increase in residential densities around
Seaton, Seaton, Albert Park and Cheltenham are likely
to further exacerbate the current gap in open space
provision in those areas.
• Specific areas identified:
§ Athol Park: Develop local reserves
§ Findon, Kidman Park and Flinders Park: Increased
quality of open space.
§ Hindmarsh: Develop an open space master plan
as part of the Hindmarsh Urban Village concept. .
§ Pennington: Develop local open space
§ Cheltenham: Develop open space connections
through the Port Rail corridor and local open
space.
§ Royal Park: Maintain the quality of Carnegie
Reserve (north and south).
§ Seaton: Develop open space master plans for
SAHT areas.
§ West Lakes: Monitor urban consolidation and
open space provision.

City of Charles Sturt Residential Growth + Character Study - Report No 1 Strategic Context 67
• Policy
Document
• Relevant
Policies
• Implications / Key initiatives / Targets of
policies
§ Woodville: Explore the feasibility of the Port Rail
corridor to connect open space. Review the
potential of local road closures and traffic calming
measures to provide additional connections within
suburbs to meet demand
§ Woodville West: Respond to urban consolidation
through improvements to existing open space.
§ Increased provision at Findon Reserve, Frank
Mitchell Reserve and Matheson Reserve
• City of
Charles Sturt
Flood Mapping
• The Council has
completed the
preparation of
floodplain
mapping data
for many of the
larger
catchment
areas, however
this work is
ongoing.
• The mapping
completed to
date highlights
the many areas
across the
Council area
which are at risk
of flooding in
the 100 year
ARI event. This
floodplain
mapping data is
available to the
public on
Council's
website
(http://gis.charl
essturt.sa.gov.a
u/eview-
html/index.html
• City of
Charles Sturt
• 8.4 Land Use
and Transport
• Review Development Plan to nominate appropriate
locations.

City of Charles Sturt Residential Growth + Character Study - Report No 1 Strategic Context 68
• Policy
Document
• Relevant
Policies
• Implications / Key initiatives / Targets of
policies
Section 30
Development
Plan Review
(April 2008)
• (Determines
the
appropriatene
ss of the
Development
Plan in
relation to the
Council area;
and its
consistency
with the State
Government
Planning
Strategy for
Metropolitan
Adelaide)
Integration
• 2. Facilitate
transit-oriented
development
around selected
high-service
public transport
routes.
• 8.11 Residential
Neighbourhoods
and Housing
• 1. Ensure land is
used
appropriately
within the Urban
Boundary to
meet projected
housing
demands and
satisfy varied
housing
preferences and
incomes.
• 4. Provide a
range of
medium-to-high
density housing
forms in
targeted
locations to
maximise the
use of existing
infrastructure,
services and
facilities,
including public
transport,
schools and
open space.
• (a) Promote transit-oriented development and
employment uses in a band of activity from the
Central City Activity Centre to Port Adelaide to
maximise accessibility to, and make use of, that
corridor’s existing transport infrastructure and
services.
• Undertake residential character analysis to establish
areas for retention and
• redevelopment
• (d) Promote higher densities of residential
development in appropriate locations to significantly
increase the average dwelling replacement rates for
metropolitan Adelaide taking into account the need to
protect desired character and heritage.

City of Charles Sturt Residential Growth + Character Study - Report No 1 Strategic Context 69
• Policy
Document
• Relevant
Policies
• Implications / Key initiatives / Targets of
policies
• 5. Develop
transit-focused
neighbourhoods
which provide
opportunities for
people to walk
to public
transport and
other services
and facilities.
• One Planet
Living
• One Planet
Living: Greening
the Western
Suburbs’ is a 5
year draft plan
that proposes a
range of
strategies and
actions under
four key
themes: climate
change, water,
biodiversity and
waste

This report has been prepared by:
Jensen Planning + Design
In collaboration with
SGS Economics and Planning Pty. Ltd.
Tonkin and Associates
Cit y of Charles St urtCit y of Charles St urtCit y of Charles St urtCit y of Charles St urt
Resident ial Growt hResident ial Growt hResident ial Growt hResident ial Growt h ++++ Charact er St udyCharact er St udyCharact er St udyCharact er St udy
Report 2 Residential Opportunities +
Constraints May 2011

City of Charles Sturt Residential Growth + Character Study - Report No 2: Opportunities and Constraints

City of Charles Sturt Residential Growth + Character Study - Report No 2: Opportunities and Constraints
1 Executive Summary.................................. ............................. 1
2 Background to the Proposed Population Growth in Charles Sturt 3
3 Opportunities - Future Population and Housing in the City of Charles Sturt ...................................... .................................. 6
3.1 Dwelling Supply Scenarios............................................................................................ 6 3.1.1 "Medium population growth scenario" applied to Charles Sturt to 2031 is an
additional 8447 household. ............................................................................. 6 3.1.2 “2 million by 2050” State Strategic Plan scenario applied to Charles Sturt to 2031 is
an additional 16,857 dwellings......................................................................... 7 3.1.3 "30 Year Plan for Greater Adelaide scenario" applied to Charles Sturt is an
additional 22,730 dwellings to 2039. ................................................................ 7 3.2 Living Arrangements.................................................................................................... 9 3.3 What dwelling types will be in most demand in the future?............................................. 11
4 Constraints - Infrastructure ................................................ 13
4.1 General Infrastructure ............................................................................................... 13 4.1.1 Roads and Traffic ......................................................................................... 13 4.1.2 Cycling and Walking ..................................................................................... 14
4.2 Rail ......................................................................................................................... 15 4.3 Stormwater Management ........................................................................................... 15 4.4 Water Supply............................................................................................................ 17 4.5 Waste water ............................................................................................................. 17 4.6 Electricity ................................................................................................................. 19 4.7 Gas ......................................................................................................................... 19
5 Constraints - Environmental ................................................ 20
5.1 Climate Change ........................................................................................................ 20 5.2 Stormwater and Harvesting ........................................................................................ 21 5.3 Water Sensitive Urban Design (WSUD) ........................................................................ 26 5.4 Open Space.............................................................................................................. 26
6 Constraints - Heritage + Character....................................... 28
7 Spaces for Places – How Many Additional Dwellings will be Required? .......................................... ................................ 30
7.1 Anticipated Dwelling Demand to 2031 in Relation to the 30 Year Plan .............................. 30

City of Charles Sturt Residential Growth + Character Study - Report No 2: Opportunities and Constraints
8 Spaces for Places – Potential Locations for New Dwellings ..... 33
8.1 Train Stations/TOD’s + Centres................................................................................... 33 8.1.1 West Lakes Boulevard and Seaton = 2400 dwellings ........................................ 33 8.1.2 Kilkenny Railway Station, Rail corridor and Port Road (Bowden to Cheltenham) =
260 dwellings .............................................................................................. 36 8.1.3 Albert Park TOD/Woodville West Housing SA land = 700 dwellings ..................... 36 8.1.4 Cheltenham/Sheridan Site and Woodville Road = 1190 dwellings....................... 38 8.1.5 Bowden Urban Village (TOD) = 1880 dwellings ................................................ 39
8.2 Road Corridors.......................................................................................................... 41 8.2.1 Grange Road ............................................................................................... 41 8.2.2 Woodville Road............................................................................................ 41 8.2.3 Port Road/Torrens Road................................................................................ 41
8.3 Existing Suburbs Outside the TOD’s/Centres................................................................. 42 8.3.1 Future Public Housing Yields = 400+ dwellings ................................................ 42 8.3.2 Findon = 117 dwellings................................................................................. 40 8.3.3 Ridleyton = 100 dwellings ............................................................................. 42
Tables
Table 1. Net housing demand in Charles Sturt (no. of dwellings), 2006-2031................... 11 Table 2. Anticipated Dwelling and Population requirements for Charles Sturt based upon The
30 Year Plan for Greater Adelaide Objectives ................................................... 31
Figures
Figure 1. Population Projections in Charles Sturt, 2006 - 2031 (Source SGS 2009,
Planning SA 2007) ......................................................................................... 8 Figure 2. Net demand for private dwellings in Charles Sturt (number of dwellings),
2006-2031(Source SGS 2009, Planning SA 2007) .............................................. 8 Figure 3. Households by type in Charles Sturt (number of households), 2006-2031 ... 10 Figure 4. Projected demand private dwellings (no. of dwellings), medium scenario .... 12 Figure 5. Projected demand private dwellings (no. of dwellings), 2 million by 2050
scenario...................................................................................................... 12 Figure 6. Water Proofing the West – Key Elements of the Project ............................. 17 Figure 7. Waste and Water Augmentation Requirements......................................... 18 Figure 8. Water Supply Capacity at Cheltenham .................................................... 19 Figure 9. Low scenario for 2100 time period – 50 cm sea-level rise.......................... 20 Figure 10. Medium scenario for 2100 time period - 80 cm sea-level rise..................... 20 Figure 11. High scenario for 2100 time period - 1.1m sea-level rise ........................... 20 Figure 12. Runoff Coefficient Increase (10 year time horizon) ................................... 24 Figure 13. Localised Flooding Potential Around Woodville.......................................... 25 Figure 14. Charles Sturt Open Space Strategy: Gaps in the provision of Open Space in
Charles Sturt ............................................................................................... 27 Figure 15. City of Charles Sturt's Draft Defined areas of Neighbourhood Character and
Heritage...................................................................................................... 29 Figure 16. West Lakes - Overall Site of Potential Future Development Options ............ 34 Figure 17. Seaton - Site of Potential Future Development Options 400 m either side of
Road Corridor .............................................................................................. 34

City of Charles Sturt Residential Growth + Character Study - Report No 2: Opportunities and Constraints
Figure 18. Seaton Park Railway Station - Site of Identified TOD................................ 35 Figure 19. Albert Park Railway Station - Site of Potential Growth ............................... 36 Figure 20. Kilkenny Railway Station - Site of Currently Identified Potential Future
Development Options ................................................................................... 37 Figure 21. Cheltenham/Woodville Train Station Site - Currently Identified Future
Development Options ................................................................................... 38 Figure 22: Bowden Urban Village Master Plan Study Area ............................................. 39 Figure 23. Woodville Village Master Plan Study Area ................................................ 41

City of Charles Sturt Residential Growth + Character Study - Report No 2: Opportunities and Constraints 1
1 Executive Summary
This report is the second report prepared for the Residential Growth and Character Study. This
study has been undertaken by Jensen Planning + Design in collaboration with SGS Economics and
Planning and Tonkin and Associates for the City of Charles Sturt. The study is examining future
residential growth and character issues across the City of Charles Sturt.
This second report examines potential opportunities and constraints for future residential growth in
the City of Charles Sturt within the context of increased population growth proposed by the
recently released 30 Year Plan for Greater Adelaide. It also considers the population scenarios
presented by the Australian Bureau of Statistics (ABS) and the previous population forecasts by the
SA State Government. The general location of future population growth is described.
This report:
§ Summarises future population and housing projections specific to Charles Sturt based on a
range of population scenarios
§ Examines how many additional dwellings will be required in the City of Charles Sturt to 2031 to
meet the Greater Adelaide 30 Year Plan Growth Targets
§ Summarises major constraints to achieving future housing growth in a range of locations that
are identified as having potential for future residential growth
§ Summarises potential locations for future Transit Oriented Development's (TOD's)/Centres and
Corridor Development which are the main opportunities for hosting significant dwelling yields
into the future
§ Provides a general commentary on the future character of the TOD's/ Centres and Corridors.
It has been informed by previous Strategic Context Report.
The first report prepared for this project - the Strategic Context Report , provides a more detailed
analysis of population trends and policy approaches from the State Government and within the City
of Charles Sturt.
The ramifications of the future dwelling yields required to meet the State 30 Year Growth Plan
objectives as presented in this report are significant.
This report therefore is intended to provide an overview of the future growth scenarios,
explaining the general constraints and opportunities, and assumptions made behind the
figures and dwelling scenarios presented.
It should be noted that since the preparation of this report which was finalised in March 2010, the
South Australian Government (Department for Planning and Local Government) has since
undertaken further investigations into the nature of anticipated future growth and character of the
Western area of metropolitan Adelaide, as part of the finalisation of the 30 Year Plan, and also as
part of the Structure Planning process.

City of Charles Sturt Residential Growth + Character Study - Report No 2: Opportunities and Constraints 2
Report 4 - Character and Form of Potential Growth will provide more detailed guidance about the
character and densities in each of the key areas that are identified as ones which could experience
significant dwelling increases in line with the targets established by the Greater Adelaide 30 Year
Plan.
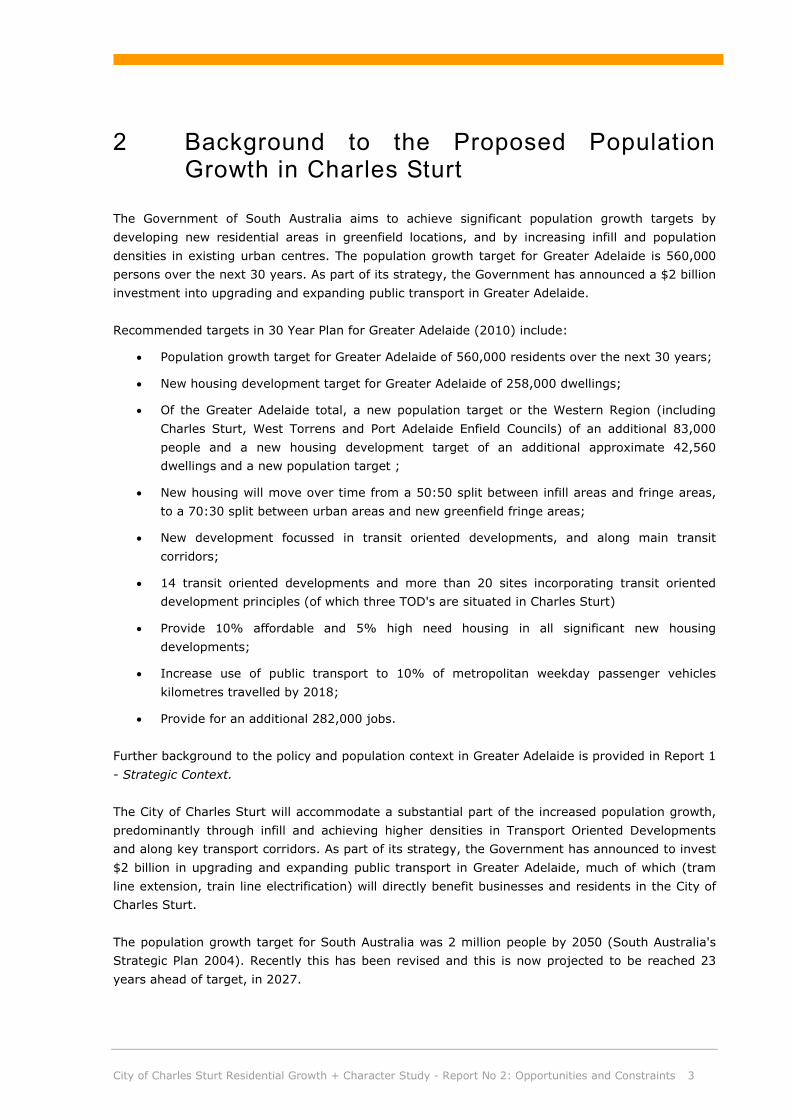
City of Charles Sturt Residential Growth + Character Study - Report No 2: Opportunities and Constraints 3
2 Background to the Proposed Population Growth in Charles Sturt
The Government of South Australia aims to achieve significant population growth targets by
developing new residential areas in greenfield locations, and by increasing infill and population
densities in existing urban centres. The population growth target for Greater Adelaide is 560,000
persons over the next 30 years. As part of its strategy, the Government has announced a $2 billion
investment into upgrading and expanding public transport in Greater Adelaide.
Recommended targets in 30 Year Plan for Greater Adelaide (2010) include:
• Population growth target for Greater Adelaide of 560,000 residents over the next 30 years;
• New housing development target for Greater Adelaide of 258,000 dwellings;
• Of the Greater Adelaide total, a new population target or the Western Region (including
Charles Sturt, West Torrens and Port Adelaide Enfield Councils) of an additional 83,000
people and a new housing development target of an additional approximate 42,560
dwellings and a new population target ;
• New housing will move over time from a 50:50 split between infill areas and fringe areas,
to a 70:30 split between urban areas and new greenfield fringe areas;
• New development focussed in transit oriented developments, and along main transit
corridors;
• 14 transit oriented developments and more than 20 sites incorporating transit oriented
development principles (of which three TOD's are situated in Charles Sturt)
• Provide 10% affordable and 5% high need housing in all significant new housing
developments;
• Increase use of public transport to 10% of metropolitan weekday passenger vehicles
kilometres travelled by 2018;
• Provide for an additional 282,000 jobs.
Further background to the policy and population context in Greater Adelaide is provided in Report 1
- Strategic Context.
The City of Charles Sturt will accommodate a substantial part of the increased population growth,
predominantly through infill and achieving higher densities in Transport Oriented Developments
and along key transport corridors. As part of its strategy, the Government has announced to invest
$2 billion in upgrading and expanding public transport in Greater Adelaide, much of which (tram
line extension, train line electrification) will directly benefit businesses and residents in the City of
Charles Sturt.
The population growth target for South Australia was 2 million people by 2050 (South Australia's
Strategic Plan 2004). Recently this has been revised and this is now projected to be reached 23
years ahead of target, in 2027.

City of Charles Sturt Residential Growth + Character Study - Report No 2: Opportunities and Constraints 4
This means that Greater Adelaide is forecast to grow by about 560,000 people over the next 30
years.
This is largely as a result of:
• Natural population growth (we are seeing an average of an additional 7600 people a year),
• Large increases in overseas migration (we saw an additional 14,000 people in 2007 -
2008), and
• Growing proportion of elderly people
• Changing living arrangement and consequently decreasing household sizes
In order to meet these state government goals, it is anticipated that the Western Region will be
required to accommodate a large percentage of the total growth in Greater Adelaide - housing for
an additional 90,000 people (about 46,000 additional dwellings).* Note that this figure has been
changed to a new growth target of 83,000 people in the final 30 Year Plan for Greater Adelaide. All
of the figures quoted in this report are still based on the original 90,000 people growth target.
An estimate for what this means for the City of Charles Sturt is that an additional approximate
22,700 dwellings will need to be provided over the next 30 years. The majority of these will
need to provided along Corridors (in key locations along Port Road, Torrens Road,
Grange Road, Henley Beach Road and West Lakes Boulevard).
Sites at Railway Stations (TOD's) and densification around Centres will also contribute to the
required dwelling yield but to a much lesser extent.
Alternative population scenarios are that over the next 30 years Charles Sturt could grow by an
additional 15,000 dwellings (if normal population trends without additional migration continued) or
by an additional 16,800 dwellings (if the 2 million by 2050 target was reached).
Whatever population scenario is applied, there will be a strong increase in demand for housing over
the next 30 years.
Without any policy and/or price mechanisms to influence households to change their housing
preferences, future demand for housing (based on past trends) will continue to be primarily for
separate, low density houses. With a finite supply of land in Charles Sturt, continuance of this
trend will result in a failure to provide enough land for new housing to support population growth.
Housing prices, which are currently a competitive advantage for South Australia, could be placed at
risk. As house prices increase, while land availability drops, the market will typically be forced
towards more higher density housing.
Should such measures be adopted and normal market mechanisms shift to see changing demand
patterns, the housing industry is more likely to respond by increasing supply of a range of housing
types including medium to high density housing.
Council has a major role to play in influencing the design, sustainability and location of new
dwellings through a range of measures including planning policy, financial incentives, and legal
requirements.

City of Charles Sturt Residential Growth + Character Study - Report No 2: Opportunities and Constraints 5
There are a number of strategic and policy projects that are underway in the City of Charles Sturt
that are consistent with the aims of the 30-Year Plan for Greater Adelaide and promote areas that
are suitable for renewal and increasing densities.
These are:
§ St Clair (Cheltenham Racecourse) Development
§ Woodville Village Transit Oriented Development (TOD)
§ Bowden Urban Village TOD
§ Woodville West Housing SA Redevelopment
§ Seaton Park and Kilkenny TODs
The biggest opportunity for accommodating increased growth will be along major road corridors,
and to a lesser extent, around railway stations (TOD's).
There will be significant infrastructure implications from this new rate of growth, particularly for
stormwater, open space, social infrastructure provision and road capacities.
City of Charles Sturt Residential Growth + Character Study - Report No 2: Opportunities and Constraints 6
3 Opportunities - Future Population and Housing in the City of Charles Sturt
In order to assess population growth and housing demand in the City of Charles Sturt a Housing
Demand Model was applied by SGS Consulting which forward projects population. It should be
recognised that this is a broad tool used to give an indication of future population implications.
Three population scenarios have been used to indicate housing demand in Charles Sturt. The
projections should be used cautiously as they only provide an indication of total population
numbers that are in line with an assumed target: the target’s feasibility has not been tested. For
instance, it has not been tested whether the migration and natural increase required to achieve
these targets are realistic or not.
Key inputs of the model are:
• Population projections by age (two scenarios were applied, further explained in the
following section);
• Data on dwelling types by household types in Charles Sturt to model the population’s
propensity to occupy dwelling types
• Population data on family types and relationships in household by age in Charles Sturt to
model trends in household composition
• Data on household sizes to model the number of households in Charles Sturt.
The key finding is that whilst there are differences in the population scenario projections, they all
point towards a significant increase in the dwelling supply in Charles Sturt, ranging from an
additional 8,400 dwellings (medium scenario which provides for no additional migration) to an
additional 22,700 dwellings by 2031(30 Year Plan for Greater Adelaide scenario).
3.1 Dwelling Supply Scenarios
In 2006 there are 44,062 households living in private dwellings in Charles Sturt.
3.1.1 "Medium population growth scenario" applied to Charles Sturt to 2031 is an additional 8447 household.
This is based broadly on the Department of Planning and Local Government's (DPLG) own
projections. However DPLG's projections only went to 2021 so we have expanded them to 2031.
This scenario indicates the housing demand should current population trends continue, and should
there be no significant market interference that changes housing demand or supply.
In total this equates to about 52,509 households or a total of 117,312 people by 2031 which
represents a 19% increase from current numbers.
City of Charles Sturt Residential Growth + Character Study - Report No 2: Opportunities and Constraints 7
3.1.2 “2 mill ion by 2050” State Strategic Plan scenario applied to Charles Sturt to 2031 is an additional 16,857 dwellings
The projections for this scenario uses the Planning SA scenario at the SA level as a guideline and
applies it to the local level by using South Australian growth rates by age over time (2011, 2016,
2021, 2026 and 2031). This scenario is based on a government policy growth objective. For it to
be achieved, significant initiatives that influence housing demand and supply will be required.
This scenario indicates a jump of population growth after 2021. By 2021 the total population would
be 117,492, by 2031 population would have expanded to 141,410.
The total number of households is estimated to be 60,919 households by 2031, or a 38% increase
from current numbers.
Figure 1 shows the population projections for Charles Sturt according to the medium scenario and
the 2 million by 2050 scenario to 2031.
3.1.3 "30 Year Plan for Greater Adelaide scenario" applied to Charles Sturt is an additional 22,730 dwellings to 2039.
This projection is based on the 30 Year Plan for Greater Adelaide's goal of achieving an additional
90, 000 people across the "Western" region which has been translated through our analysis of the
distribution of anticipated TOD's and growth in transit corridors and activity areas to approximately
40,735 persons. The household size has been calculated at 2.1 persons per household. 30 Year
Plans Targets are for 2039.
This Plan also notes that the original population forecasts in the 2 million by 2050 scenario (part of
the previous State Strategic Plan) are likely to be achieved ahead of time. It suggests that it will be
reached 23 years ahead of target, in 2027.
The dwelling forecast for Charles Sturt based on the 30 Year Plan is based on our analysis of
household dwelling sizes of 2.1 persons. This reflects an average of what has been used in the 30
Year Plan (1.9 persons per household for dwellings in transit oriented developments and activity
centres and 2.2 persons per household for dwellings in areas outside transit oriented developments
and key activity centres).

City of Charles Sturt Residential Growth + Character Study - Report No 2: Opportunities and Constraints 8
Figure 1. Populat ion Project ions in Char les Sturt , 2006 - 2031 (Source SGS 2009, Planning SA 2007)
Figure 2. Net demand for pr ivate dwel l ings in Char les Sturt (number of dwel l ings) , 2006-2031(Source SGS 2009, Planning SA 2007)
2011 2016 2021 2026 2031
Medium scenario 1,584 3,360 5,418 6,949 8,447
2 million by 2050 scenario 2,574 5,512 8,838 12,526 16,857
0
2,000
4,000
6,000
8,000
10,000
12,000
14,000
16,000
18,000
Dw
ellin
gs
2006 2011 2016 2021 2026 2031
Medium scenario 103808 106161 109195 112641 114947 117212
"2 million by 2050" scenario 103808 108180 112766 117492 128830 141410
100000
105000
110000
115000
120000
125000
130000
135000
140000
145000
Popu
latio
n

City of Charles Sturt Residential Growth + Character Study - Report No 2: Opportunities and Constraints 9
3.2 Living Arrangements
What will be the future demand for people’s living arrangements? This includes persons living in
family households with dependent children, as a couple or as a single person households. The type
of living arrangements will have important influences on the type of housing provided in Charles
Sturt and also the services and infrastructure.
To project future living arrangements, historical data is extrapolated from 1996 to 2006 into the
future.
Due to the ageing of the population, increasing numbers of single parent families and single person
households, the demand for housing will increasingly be driven by smaller households.
Figure 3 shows the expected changes in the population’s living arrangements in Charles Sturt
(number of persons), 2006-2031
Regardless of which scenario is considered, the most significant increase is among persons living as
a couple without dependent children.
The second largest growth will be among persons in lone person households, by 2031, lone person
households are anticipated to be the biggest category of households.
The number of single parent households is also expected to increase markedly.
There is a clear shift towards smaller household sizes. The number of persons aged 65 and over is
expected to increase quite dramatically (and usually elderly couples do not live together with their
children).
Medium Scenario
In 2031 there will be 6,700 persons more living in couple households compared to 2006, an
increase of 29%. It also anticipates a net decrease in the number of couple households with
children, by 353 persons in 2031
2 million scenario
For the 2 million scenario, the increase will be 58%. It also anticipates increases in the number of
couple households with children, but the share is expected to drop from 45% in 2006 to 38%.

City of Charles Sturt Residential Growth + Character Study - Report No 2: Opportunities and Constraints 10
Figure 3. Households by type in Char les Stur t (number of households), 2006-2031
Source: SGS estimates (2009)
-
10,000
20,000
30,000
40,000
50,000
60,000
70,000
2006 2031
Medium
Lone person households 13,967 18,102 20,346
Group households 1,401 1,474
Other family households. 554 610 704
One parent families 5,190 6,098
Couple families without children 11,529 14,831
2031 2 million'
1,780
6,848
18,251
Couple families with children 11,421 11,395 12,991
H o u s e
Ho
use
ho
lds

City of Charles Sturt Residential Growth + Character Study - Report No 2: Opportunities and Constraints 11
3.3 What dwelling types will be in most demand in the future?
As in many other parts of Greater Adelaide, housing in Charles Sturt is currently at low densities
and primarily consists of separate houses. Historically, separate houses were primarily occupied by
family households with children. Increasingly however, couples without children, single parents and
lone persons tend to occupy separate houses as well. So, although household sizes are
diminishing, demand for larger private dwellings is expected to grow.
It is expected that this trend will continue in the future, unless policy and/or price
mechanisms force households to change their preferences. It is anticipated that without
policy or price mechanism changes, demand will continue to be particularly strong for separated
houses, and some minor take up of flats and apartments and some medium density detached
dwellings on around 300m2 allotments. Demand for medium to high density will need to increase
significantly if the goal to increase densities around TOD's, Centres and Corridors is to be reached.
The kinds of dwelling forms adjacent to main roads and around TOD's and activity centres are the
most likely to achieve appropriate economic yields for investors. They will also reach density
requirements that are needed to achieve the growth goal in the form of apartments and residential
flat buildings, typically up to five storeys. Town houses are less likely to achieve these yields, but
may be more suited to areas further back from main roads and TOD's. The dwelling types most
appropriate to identified growth areas are discussed in more detail in Report 4 (Character and
Form of Potential Residential Growth in the City of Charles Sturt).
Table 1. Net hous ing demand in Char les Stur t (no. of dwel l ings) , 2006-2031
Medium scenario
Two million scenario
Separate house 10,064 16,842 Semi-detached, townhouse - 2,932 -2,360 Flat / unit / apartment 1,259 2,286
Other 56 90
No. of Private
Dwellings
Total Private Dwellings 8,447 16,857
Source: SGS estimates (2009)
Carrying current housing demand trends through into the future to meet either the medium
scenario or the 2 million by 2050 scenario, the following types of houses will be required. Of
course, this demand can change should there be a range of policy and price tools/incentives that
support new higher density housing models.

City of Charles Sturt Residential Growth + Character Study - Report No 2: Opportunities and Constraints 12
Figure 4. Projected demand pr ivate dwel l ings (no. of dwel l ings), medium scenar io
10,064
(2,932)
1,259
8,447
(5,000)
-
5,000
10,000
15,000
20,000
Separate house Semi-detached, townhouse
Flat / unit / apartment
Total Private Dwellings
Housing demand, 2006 - 2031 (medium)
Source: SGS estimates (2009)
Figure 5. Projected demand pr ivate dwel l ings (no. of dwel l ings) , 2 mil l ion by 2050 scenar io
16,842
-2,360
2,286
16,857
-5,000
0
5,000
10,000
15,000
20,000
Separate house Semi-detached, townhouse
Flat / unit / apartment
Total Private Dwellings
Housing demand, 2006 - 2031 (2 mill)
Source: SGS estimates (2009)
-2,932

City of Charles Sturt Residential Growth + Character Study - Report No 2: Opportunities and Constraints 13
4 Constraints - Infrastructure
4.1 General Infrastructure
4.1.1 Roads and Traffic
As a matter of principle, it is important that any future development areas be integrated with
alternative transport modes. While the existing road networks might have adequate capacity to
sustain the additional traffic generated by the developments, it is fundamental that any new
concentrated residential development be supported by sustainable alterative transport modes.
Alternative modes include rail, light rail (tram), bus, cycling and walking routes. The current local
road network may not be suitable for increases in density. Redevelopment of larger areas provides
an opportunity to reconfigure the road network, an example of this is the Woodville West
Neighbourhood Renewal of the Housing SA area. The road design should reduce vehicle speed
through design and promote shared use between pedestrians and vehicles in appropriate areas.
As many of the proposed sites are located along the existing rail corridor, and the State
Government has announced plans to upgrade services along this corridor, there is already a good
relationship between most of the proposed sites and alternative transport modes.
The light rail network has recently been extended from City West to the Adelaide Entertainment
Centre and there are plans to extend the network to Port Adelaide and Semaphore. There is also a
proposed extension of mass transit from Port Adelaide to Cheltenham, and along Henley Beach
Road and Grange Road (refer to Map D14, 30 Year Plan for Greater Adelaide, p115).
Each of the potential development areas is adjacent to the arterial road network which generally
has adequate capacity.
Increased densities may impact on capacity, design and layout of the local street networks. Where
existing roads are planned for reconstruction within growth corridors, it is recommended that
consideration be given to these factors in designing the roads and where possible defer works
where development is planned or likely within a five to ten year period. Recent examples are
Woodville West – where the development has provided an opportunity to review the local street
layout.
Locations of potential concern in the existing road network include:
Port Road
§ Intersection of Port Road / Cheltenham Parade / West Lakes Boulevard. This intersection is
known to have limited capacity and we understand that the Department Transport, Energy
and Infrastructure (DTEI) have identified the need to potentially upgrade the intersection
at some time in the future. The Cheltenham, Albert Park, Woodville West, and West Lakes
development areas will have the greatest impact on this intersection.
City of Charles Sturt Residential Growth + Character Study - Report No 2: Opportunities and Constraints 14
West Lakes
§ West Lakes Boulevard between Clark Terrace and Port Road. This section of road is only
one lane in either direction and connects West Lakes Boulevard to Port Road. It has
significant capacity limitations. The Albert Park and West Lakes development areas will
have the greatest impact on this road section.
Woodville Road
§ The capacity of Woodville Road is limited due to its functionality in providing access to the
adjacent business and shopping precinct. The train level crossing disrupts traffic flow.
Further consideration should be given to the size of the Woodville development area and
possible increased traffic demands on Woodville Road.
Kilkenny Road/David Terrace
§ The capacity of Kilkenny Road is limited due to its functionality in providing access to the
adjacent business and industrial land. Further consideration should be given to the size of
the Kilkenny development area and possible increased traffic demands on Kilkenny Road.
4.1.2 Car Parking
While TODs aim to increase use of public transport and reduce dependence on motor vehicles, this
could be encouraged through planning policy by reducing the number of off-street parking spaces
that are provided for in private properties (for example detailing maximum car parking numbers),
the likelihood is that this goal may not be achieved in the short term so consequently, there will be
a demand for vehicles to be parked on street. This is an issue that may require short, medium and
long term responses until culture changes occur.
Shared car parking arrangements should be encouraged. Consideration should be given to the
establishment of car parking funds in strategic locations to facilitate shared facilities. Options for
promoting shared car use through car pooling schemes should also be explored and promoted in
TODs.
4.1.3 Cycling and Walking
The development of higher density residential sites should also encourage cycling and walking as
alternative transport modes. Council has developed a Strategic Cycling Plan ("Active Living: Plan
to Cycle" – May 2008). The Plan outlines a strategic cycling network for the region, including on
and off road cycle lanes and paths. There does not appear to be any significant impediments to
the development sites relative to the cycling network, although each site should be designed and
developed to encourage cycling and walking with connectivity to Council’s overarching network.
There is opportunity to develop specific dedicated cycling and walking routes through the
Greenways policy initiative announced in the 30 Year Plan. This is anticipated to be a series of
connected linear routes primarily alongside rail networks which meets open space and biodiversity
objectives.
There is scope to increase open space in Charles Sturt whilst also providing dedicating cycling and
walking paths through the Greenways policy which suggests that a minimum of 12.5% of open
City of Charles Sturt Residential Growth + Character Study - Report No 2: Opportunities and Constraints 15
space should be provided in all new development, and that greenways should be incorporated into
all new corridor developments and transit oriented developments.
4.2 Rail
On the basis of the State Strategic Plan and Greater Adelaide Plan Target of increasing the use of
public transport to 10% of metropolitan weekday passenger vehicle kilometres travelled by 2018,
the State Government has planned investment to extend the tramline from coast-to-coast to
provide a service that runs from Glenelg through the city, to West Lakes and to Semaphore
through Port Adelaide. The tramline has been extended along North Terrace to the Entertainment
Centre and is proposed to join the Outer Harbor line. It also proposes a new connection from the
Grange line, via a spur line to AAMI Stadium and the West Lakes District Centre. The extension is
proposed to be complete by 2017.
The extension of the light rail and train network will improve access and provide an opportunity to
rezone land alongside the lines to higher density. The existing Outer Harbor and Grange rail line
networks are proposed to be electrified.
A key issue for many of the areas is how the interface between the rail/tram line and dwellings will
be treated. The 30 Year Plan promotes Greenways along the lines which will be designated open
spaces for cycling and walking. However in many areas houses may back on to the rail/tram lines
and it will be important to address public safety issues.
4.3 Stormwater Management
An extensive stormwater drainage network extends across the City of Charles Sturt to drain the
existing developed areas to a range of destinations including:
§ River Torrens
§ Coast
§ West Lakes; and
§ Gillman basins
Council has previously identified that the network can be divided into 32 stormwater catchments,
each with its own unique characteristics and outfall.
In general, investment in the development of these stormwater networks occurred at around the
time of the development of the surrounding suburbs. In some locations, significant further
investment was made, particularly during the period between 1960-1980 to provide an improved
performance standard to serve the future development of these areas, as was expected at that
time.
Council is currently in the early stage of completing a series of strategic reviews (catchment-based
Stormwater Management Plans) to assess current performance standards and to identify strategies
that address not only issues of flood protection and likely future development, but also to consider
opportunities for water quality improvement (through Water Sensitive Urban Design) and
stormwater harvesting and reuse.

City of Charles Sturt Residential Growth + Character Study - Report No 2: Opportunities and Constraints 16
In addition, Council has also recently developed a concept for the broad-scale capture and reuse of
stormwater for non-potable purposes such as irrigation of Council parks, school reserves and golf
courses.
The Water Proofing the West -Stage One Project is creating the first stage of a region wide system
that harvests, treats and stores stormwater and distributes recycled water through western
Adelaide, sustaining a growing economy and enhancing the natural environment.
The Project will result in sound water management and will treat and inject approximately 2,400
megalitres of recycled water each year (this represents approximately 1,000 Olympic size
swimming pools).
The stormwater collected would otherwise drain untreated to West Lakes, Port River Estuary,
Barker Inlet and the metropolitan Adelaide coast further degrading seagrass meadows and
polluting Gulf St Vincent’s coastal marine environment.
Potential users of the recycled water include ovals and reserves managed by the City of Charles
Sturt Council, West Lakes (formerly Riverside) Golf Course, and new developments including St
Clair, Cheltenham and Woodville West.
Key elements for the project include:
1. Old Port Road; wetlands and Aquifer Storage and Recovery (ASR) improving water quality, the
environment and reducing flood risk.
2. Cooke Reserve and West Lakes (formerly Riverside) Golf Course; wetlands and ASR
components.
3. Cheltenham Wetlands; ASR and supplying recycled water.
4. River Torrens Transfer System; diverting river water and providing additional water to harvest at
the wetlands.
5. Linking and Distribution Mains; connecting Cheltenham, Old Port Road and Riverside/Cooke
Reserve areas and distributing recycled water.
The project is supported by the Australian Government’s Water for the Future Initiative and the
Government of South Australia through the City of Charles Sturt, with contributions from other
funding partners. Funding of over $63 million has been allocated to Stage One.
Section 6 provides details of specific locations where stormwater harvesting and management is
seen as an opportunity or constraint.
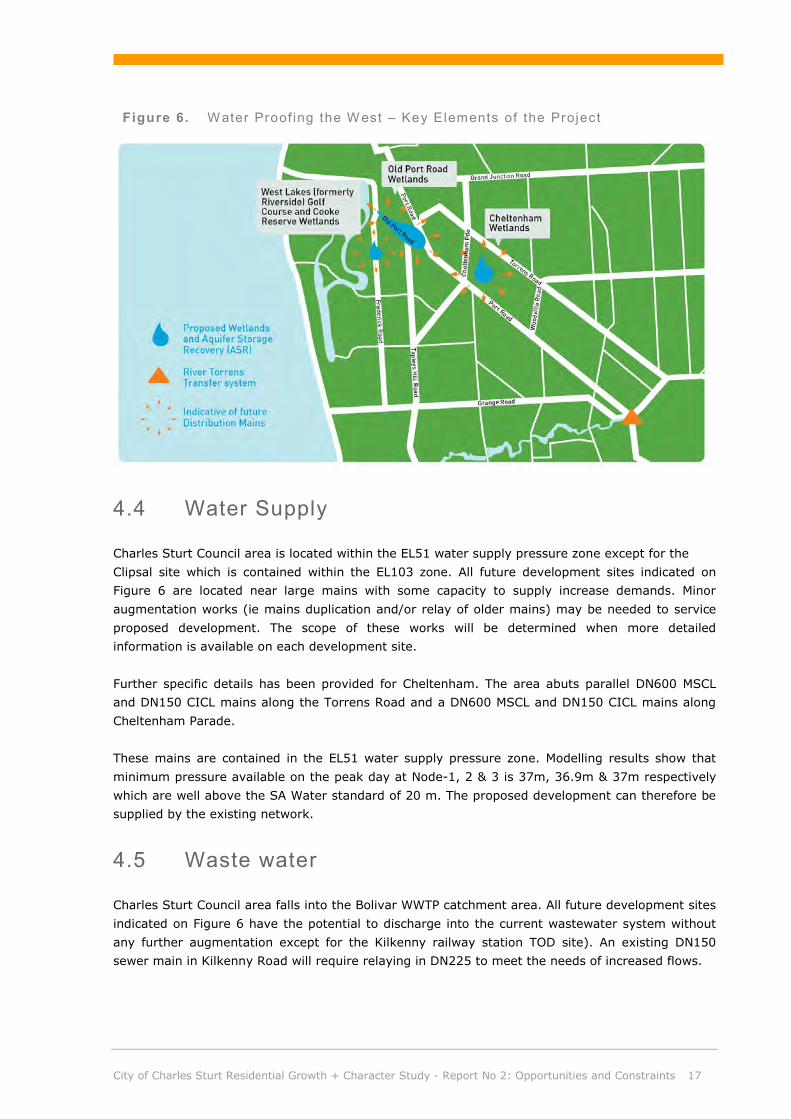
City of Charles Sturt Residential Growth + Character Study - Report No 2: Opportunities and Constraints 17
Figure 6. Water Proof ing the West – Key Elements of the Projec t
4.4 Water Supply
Charles Sturt Council area is located within the EL51 water supply pressure zone except for the
Clipsal site which is contained within the EL103 zone. All future development sites indicated on
Figure 6 are located near large mains with some capacity to supply increase demands. Minor
augmentation works (ie mains duplication and/or relay of older mains) may be needed to service
proposed development. The scope of these works will be determined when more detailed
information is available on each development site.
Further specific details has been provided for Cheltenham. The area abuts parallel DN600 MSCL
and DN150 CICL mains along the Torrens Road and a DN600 MSCL and DN150 CICL mains along
Cheltenham Parade.
These mains are contained in the EL51 water supply pressure zone. Modelling results show that
minimum pressure available on the peak day at Node-1, 2 & 3 is 37m, 36.9m & 37m respectively
which are well above the SA Water standard of 20 m. The proposed development can therefore be
supplied by the existing network.
4.5 Waste water
Charles Sturt Council area falls into the Bolivar WWTP catchment area. All future development sites
indicated on Figure 6 have the potential to discharge into the current wastewater system without
any further augmentation except for the Kilkenny railway station TOD site). An existing DN150
sewer main in Kilkenny Road will require relaying in DN225 to meet the needs of increased flows.

City of Charles Sturt Residential Growth + Character Study - Report No 2: Opportunities and Constraints 18
With regard to the Bowden Urban Village (Clipsal site) – preliminary investigations indicate that
significant lengths of pumping mains may be required to service the site. Further information will
be available upon completion of the investigation.
With specific regards to Cheltenham, the BP058 pumping station and DN525 pumping main will
have to be abandoned and a new smaller station within the proposed development and a new
pumping main to discharge into the DN600 in Regency Road will be required.
Figure 7. Waste and Water Augmentat ion Requirements
* Note population and site coverage calculations undertaken by SA Water vary from those used to calculate
future dwelling requirements in this report due to the earlier timing of SA Water’s calculations. However in
general they anticipate a significant population increase and therefore are useful as a guide.

City of Charles Sturt Residential Growth + Character Study - Report No 2: Opportunities and Constraints 19
Figure 8. Water Supply Capac i ty at Cheltenham
4.6 Electricity
ETSA has stated generally there should not be many issues with network capacity and
augmentation in these areas. Augmentation rates for these sites are expected to be standard but
will be subject to the density of each residential development. There may also be changes as the
system develops. In terms of capacity, there is currently insufficient information provided for ETSA
to undertake meaningful assessment in each case and so each site is to be investigated on an
individual basis at project commencement.
Communications with City of Charles Sturt indicate that there is perceived limited spare electricity
capacity in a range of areas including the West Lakes area and any significant development will be
likely to require a new substation and/or upgrades of the substation and/or lines in the region.
4.7 Gas
APA has undertaken an assessment of gas opportunities and constraints across the Charles Sturt
Council Area. APA Group is Australia’s largest natural gas infrastructure business, owning and/or
operating more than $8 billion of gas transmission and distribution assets including across
Adelaide. Their advice is that the Charles Sturt gas infrastructure assets are ‘very mixed’ with
respect to the age and remaining capacity of the assets, and it is not possible to give a more
detailed picture about residential growth implications on gas assets at this stage.
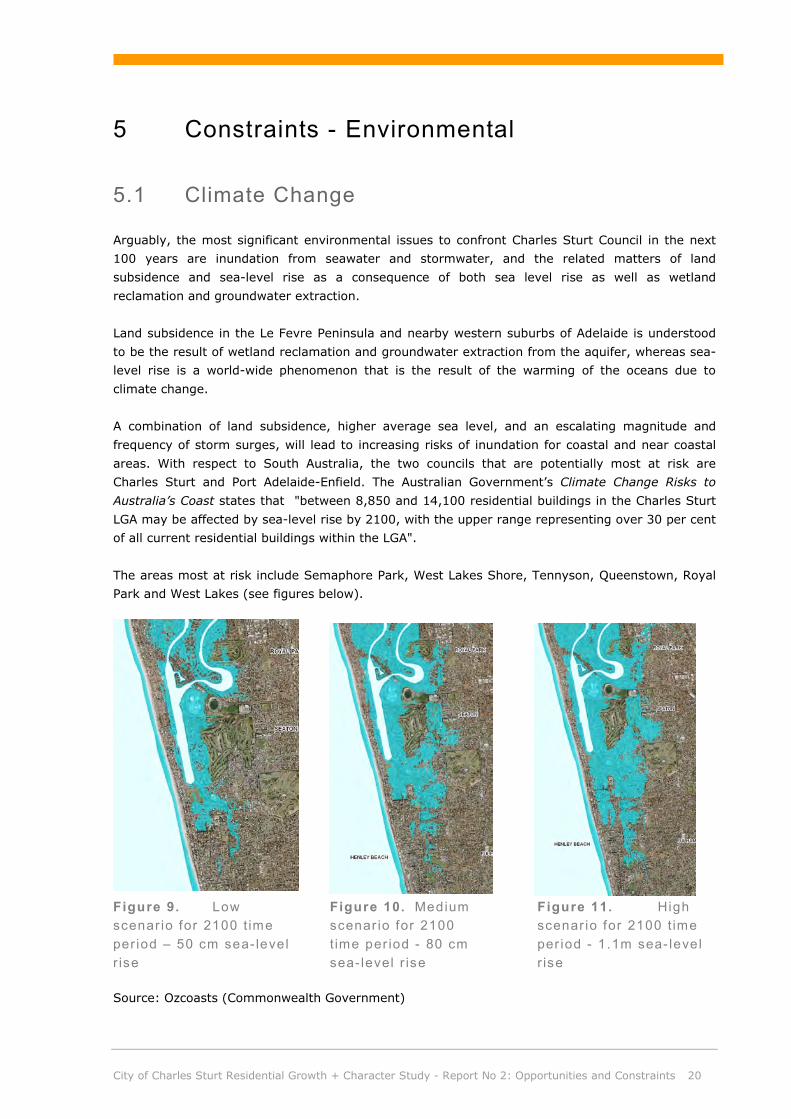
City of Charles Sturt Residential Growth + Character Study - Report No 2: Opportunities and Constraints 20
5 Constraints - Environmental
5.1 Climate Change
Arguably, the most significant environmental issues to confront Charles Sturt Council in the next
100 years are inundation from seawater and stormwater, and the related matters of land
subsidence and sea-level rise as a consequence of both sea level rise as well as wetland
reclamation and groundwater extraction.
Land subsidence in the Le Fevre Peninsula and nearby western suburbs of Adelaide is understood
to be the result of wetland reclamation and groundwater extraction from the aquifer, whereas sea-
level rise is a world-wide phenomenon that is the result of the warming of the oceans due to
climate change.
A combination of land subsidence, higher average sea level, and an escalating magnitude and
frequency of storm surges, will lead to increasing risks of inundation for coastal and near coastal
areas. With respect to South Australia, the two councils that are potentially most at risk are
Charles Sturt and Port Adelaide-Enfield. The Australian Government’s Climate Change Risks to
Australia’s Coast states that "between 8,850 and 14,100 residential buildings in the Charles Sturt
LGA may be affected by sea-level rise by 2100, with the upper range representing over 30 per cent
of all current residential buildings within the LGA".
The areas most at risk include Semaphore Park, West Lakes Shore, Tennyson, Queenstown, Royal
Park and West Lakes (see figures below).
Figure 9. Low scenar io for 2100 t ime per iod – 50 cm sea- level r ise
Figure 10. Medium scenar io for 2100 t ime per iod - 80 cm sea- level r ise
Figure 11. High scenar io for 2100 t ime per iod - 1.1m sea- level r ise
Source: Ozcoasts (Commonwealth Government)
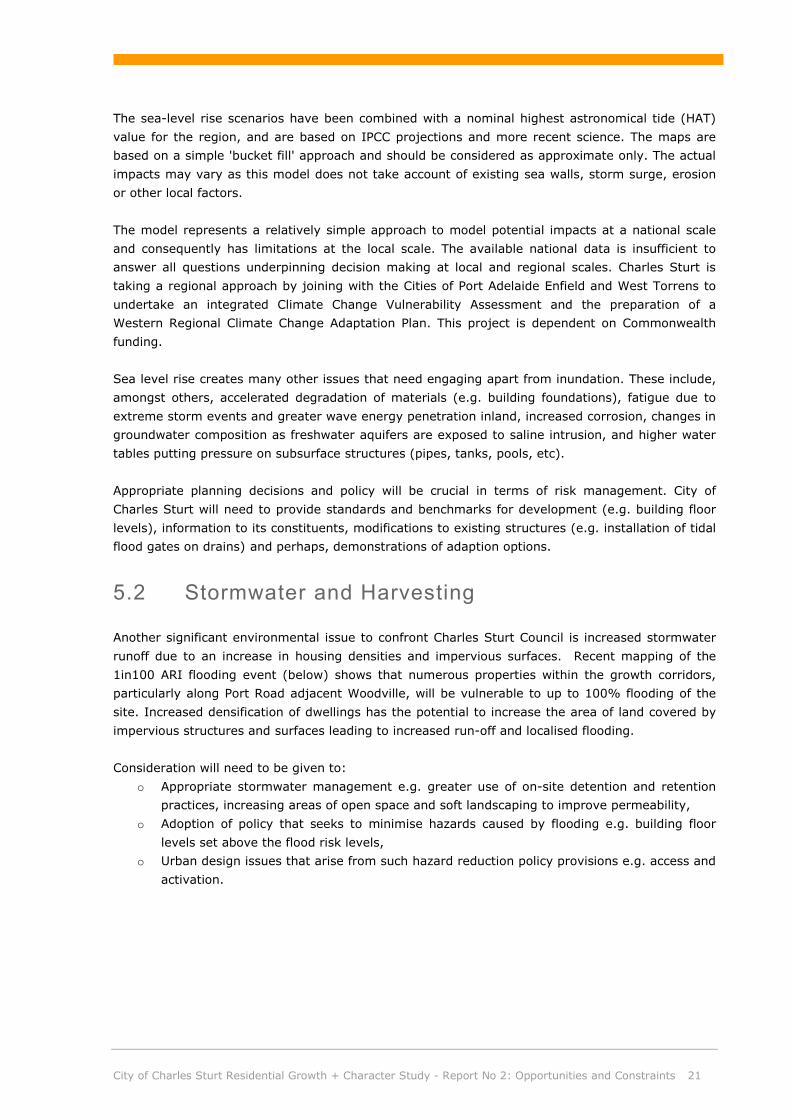
City of Charles Sturt Residential Growth + Character Study - Report No 2: Opportunities and Constraints 21
The sea-level rise scenarios have been combined with a nominal highest astronomical tide (HAT)
value for the region, and are based on IPCC projections and more recent science. The maps are
based on a simple 'bucket fill' approach and should be considered as approximate only. The actual
impacts may vary as this model does not take account of existing sea walls, storm surge, erosion
or other local factors.
The model represents a relatively simple approach to model potential impacts at a national scale
and consequently has limitations at the local scale. The available national data is insufficient to
answer all questions underpinning decision making at local and regional scales. Charles Sturt is
taking a regional approach by joining with the Cities of Port Adelaide Enfield and West Torrens to
undertake an integrated Climate Change Vulnerability Assessment and the preparation of a
Western Regional Climate Change Adaptation Plan. This project is dependent on Commonwealth
funding.
Sea level rise creates many other issues that need engaging apart from inundation. These include,
amongst others, accelerated degradation of materials (e.g. building foundations), fatigue due to
extreme storm events and greater wave energy penetration inland, increased corrosion, changes in
groundwater composition as freshwater aquifers are exposed to saline intrusion, and higher water
tables putting pressure on subsurface structures (pipes, tanks, pools, etc).
Appropriate planning decisions and policy will be crucial in terms of risk management. City of
Charles Sturt will need to provide standards and benchmarks for development (e.g. building floor
levels), information to its constituents, modifications to existing structures (e.g. installation of tidal
flood gates on drains) and perhaps, demonstrations of adaption options.
5.2 Stormwater and Harvesting
Another significant environmental issue to confront Charles Sturt Council is increased stormwater
runoff due to an increase in housing densities and impervious surfaces. Recent mapping of the
1in100 ARI flooding event (below) shows that numerous properties within the growth corridors,
particularly along Port Road adjacent Woodville, will be vulnerable to up to 100% flooding of the
site. Increased densification of dwellings has the potential to increase the area of land covered by
impervious structures and surfaces leading to increased run-off and localised flooding.
Consideration will need to be given to:
o Appropriate stormwater management e.g. greater use of on-site detention and retention
practices, increasing areas of open space and soft landscaping to improve permeability,
o Adoption of policy that seeks to minimise hazards caused by flooding e.g. building floor
levels set above the flood risk levels,
o Urban design issues that arise from such hazard reduction policy provisions e.g. access and
activation.
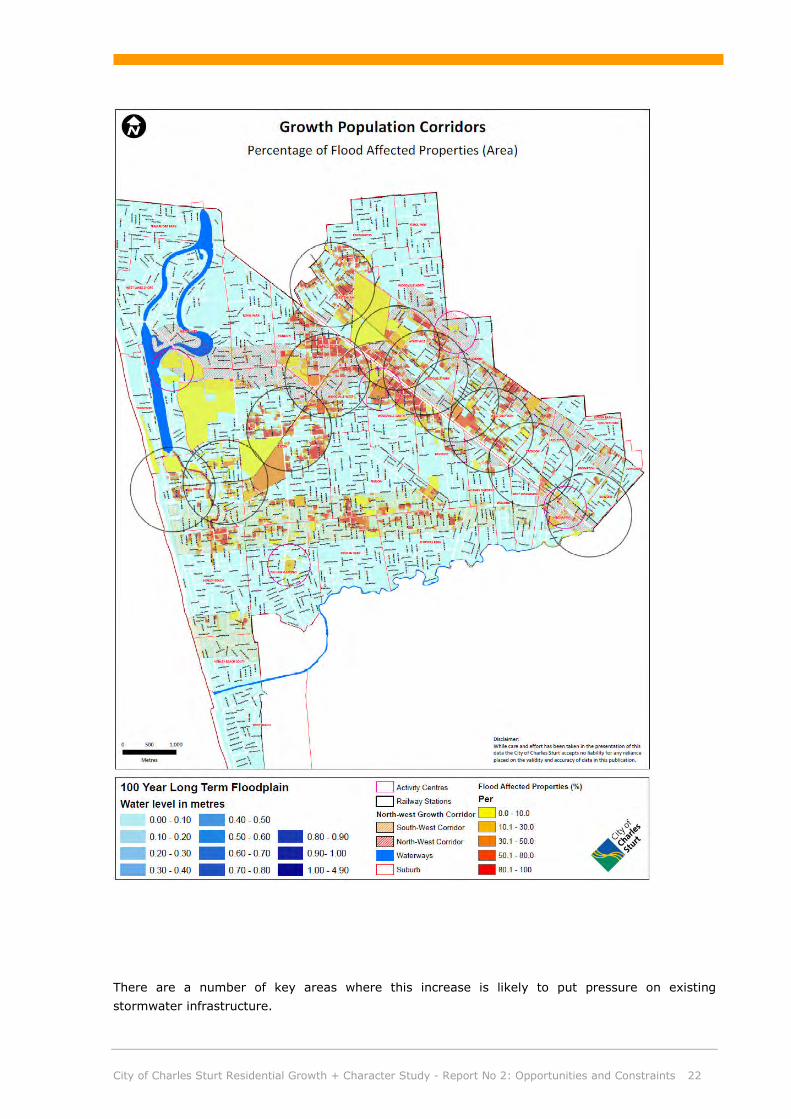
City of Charles Sturt Residential Growth + Character Study - Report No 2: Opportunities and Constraints 22
There are a number of key areas where this increase is likely to put pressure on existing
stormwater infrastructure.

City of Charles Sturt Residential Growth + Character Study - Report No 2: Opportunities and Constraints 23
Bowden Urban Village (Clipsal site)
Existing development has a high level of impervious site coverage however this development is at
the top of the Torrens and Hindmarsh Enfield Prospect stormwater catchments. This together with
the Council detention-based strategies requirements means the development is not likely to result
in any net change in stormwater discharge.
Hanson Road - Athol Park - around SA Housing area
This region is located within the Torrens Road Catchment which currently has stormwater
infrastructure with a good performance standard, and is likely to have the capacity to absorb
increases in flows in combination with some detention-based strategies.
Albert Park/Woodville West Housing SA land
The Woodville West Housing SA land is located within the Trimmer Parade catchment, which
together with the adjoining Meakin Trimmer catchment has severe infrastructure capacity
constraints. While a catchment-based strategy to resolve this issue has yet to be determined,
previous studies have identified upgrade works in excess of $10m to provide an adequate
performance standard based on existing development. Provided that sufficient ownership through
the area has been retained by Housing SA, a strategy that provides for increased development
density within the site is likely to be feasible but would be require sufficient land to be set aside for
significant mitigation of flows.
The former SABCO site is not part of the Trimmer Parade catchment and hence is likely to be
achievable with less stringent requirements.
West Lakes and Seaton Railway Station
The Seaton Park TOD is located within the Trimmer Parade catchment, which together with the
adjoining Meakin Trimmer catchment has severe infrastructure capacity constraints. While a
catchment-based strategy to resolve this issue has yet to determined, previous studies have
identified upgrade works in excess of $10m to provide an adequate performance standard based
on existing development. Increased development densities would need to carefully consider what
impacts this may have on existing levels of flood risk, and what strategies would be appropriate.
The Seaton Housing SA land is located in a different catchment and hence is not subject to the
above issues. Provided that sufficient ownership through the area has been retained by Housing
SA, a strategy that provides for increased development density within the site is likely to be
feasible.
Torrens Road Precinct (Cheltenham Racecourse / Former Sheridan Site / St Clair Reserve)
The former Cheltenham Racecourse is a site comprising 49 hectares of land which is currently
vacant. Over 8 years the land will be developed to include densities of 24 dwellings per hectare,
resulting in approximately 1200 new dwellings. Buildings on individual allotments will be allowed to
cover 60-70% of the site. Furthermore, there are some sections where higher density
developments are envisaged that will only require 25 square metres of private open space.
However, 35% of the Cheltenham site will be allocated to public open space and wetland areas.
While the reuse of stormwater at the Cheltenham Racecourse site is still being determined, there
will nonetheless be a very significant increase in the amount of run-off and the impacts. Under
Council’s development requirements the developer has a responsibility to ensure this does not
adversely impact upon the downstream Torrens Road Catchment. These sites have the capacity to
be developed in a way such that not only site generated flows can be retained but some minor

City of Charles Sturt Residential Growth + Character Study - Report No 2: Opportunities and Constraints 24
flows from surrounding Council drainage systems can be directed into stormwater harvesting
schemes integrated within the developments. It is understood that this water reuse harvesting will
occur on a significant scale within the Cheltenham site, to the extent that reuse opportunities can
extend beyond the development site.
Figure 12. Runof f Coef f ic ient Increase (10 year t ime hor izon)
Approximately 200 new housing lots are proposed for the Sheridan site. This residential
development replaces an industrial site in which the industrial buildings and associated car parking
area covered the majority of the site. Consequently, the new residential development proposed on
this site will represent a decreased amount of impervious surface area in comparison to the
previous use.
A TOD is proposed on land adjacent to the Woodville Railway station with medium-high density
development. This area would link into the Sheridan and Cheltenham sites through the inclusion of
open space areas through the southern central section of the Sheridan and Cheltenham land and
create additional stormwater pressures upon the Torrens Road Catchment. Stormwater
management will need to be addressed as part of any redevelopment.
Westwood
The Westwood redevelopment project is currently being undertaken with an expected completion
date in approximately 1-2 years. This is a large project that includes land in Athol Park, along the
central and eastern side of the Torrens Road catchment area. Precinct 6 is located within the City
of Charles Sturt and has released sites for 406 new dwellings which replace 301 existing dwellings.
The Westwood project has two detention basins located within or just outside of the catchment.
One is to be located along the Gateshead Street corridor which will become a passive recreation
area, and the other detention basin is proposed within the Cambridge Reserve. The stormwater
that is stored in these detention basins will be re-used on the open space areas.
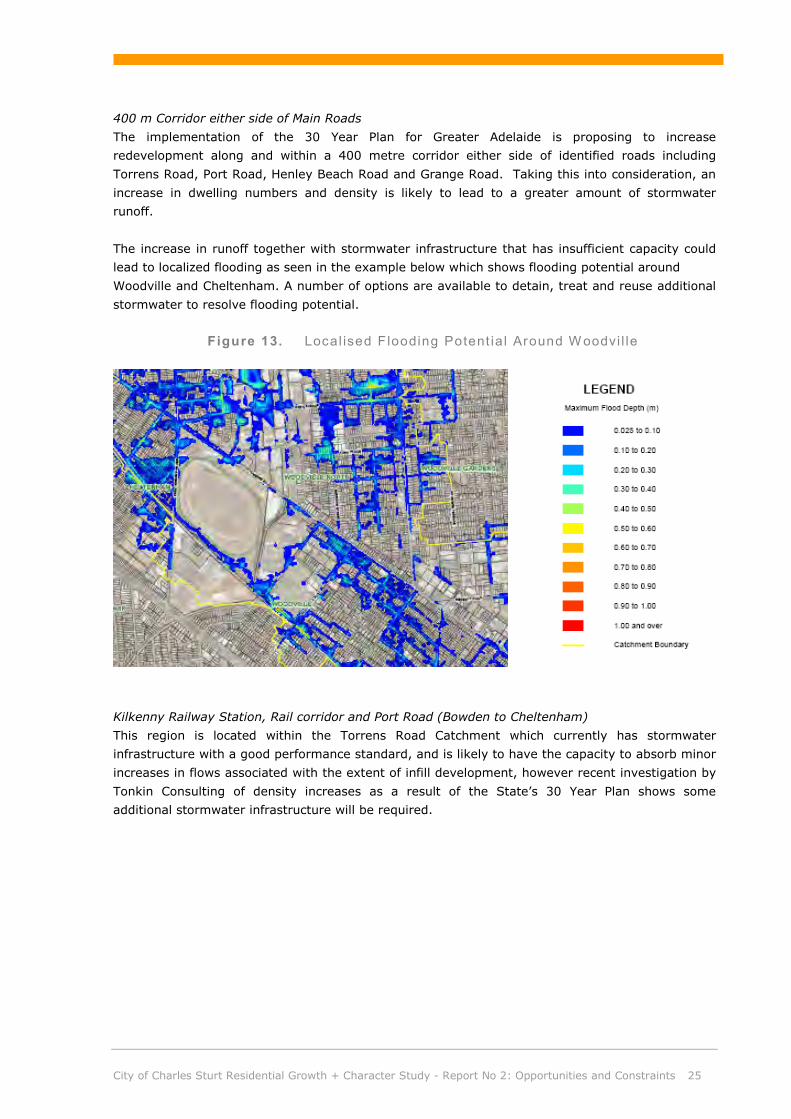
City of Charles Sturt Residential Growth + Character Study - Report No 2: Opportunities and Constraints 25
400 m Corridor either side of Main Roads
The implementation of the 30 Year Plan for Greater Adelaide is proposing to increase
redevelopment along and within a 400 metre corridor either side of identified roads including
Torrens Road, Port Road, Henley Beach Road and Grange Road. Taking this into consideration, an
increase in dwelling numbers and density is likely to lead to a greater amount of stormwater
runoff.
The increase in runoff together with stormwater infrastructure that has insufficient capacity could
lead to localized flooding as seen in the example below which shows flooding potential around
Woodville and Cheltenham. A number of options are available to detain, treat and reuse additional
stormwater to resolve flooding potential.
Figure 13. Local ised F looding Potent ia l Around Woodvi l le
Kilkenny Railway Station, Rail corridor and Port Road (Bowden to Cheltenham)
This region is located within the Torrens Road Catchment which currently has stormwater
infrastructure with a good performance standard, and is likely to have the capacity to absorb minor
increases in flows associated with the extent of infill development, however recent investigation by
Tonkin Consulting of density increases as a result of the State’s 30 Year Plan shows some
additional stormwater infrastructure will be required.

City of Charles Sturt Residential Growth + Character Study - Report No 2: Opportunities and Constraints 26
5.3 Water Sensitive Urban Design (WSUD)
The City of Charles Sturt current Development Plan (consolidated 10 June 2010) currently has one
reference to WSUD and both are in relation to a residential infill site, Residential Zone (Cheltenham
Park Policy Area 22), where it is stated that open space should incorporate “water sensitive urban
design features and sustainable landscapes to enhance biodiversity”, and development in the area
should address environmental sustainability through the provision of ”water sensitive urban design,
including stormwater harvesting and re-use”. The Water Sensitive Design Better Development Plan
policy module can be incorporated into the Development Plan in future Development Plan
Amendments.
This limited acknowledgement of WSUD is countered in the City of Charles Sturt’s Corporate Plan -
Shaping the Western Suburbs 2008-2012, which has broader objectives. Objective 2.4 seeks “to
create attractive, well maintained streetscapes”, and one of the two key actions proposed is to
“implement streetscape upgrades using WSUD principles where feasible”. Similarly, Objective 3.3
seeks to” promote ecologically sustainable urban development within the City” and again, the key
action is building “WSUD into new developments”. From the above, it is clear that WSUD principles
are to be incorporated in new and existing streetscapes.
The Relationship between WSUD and Character
Vegetation plays a strong role in respect to streetscapes, as seen in numerous Desired Future
Character statements. The retention and maintenance of existing vegetation is a consistently cited
principle. This principle is not at odds with WSUD. Nonetheless, it needs to be remembered that
streetscapes are renewed periodically as infrastructure ages and needs repair or replacement.
Drainage and street tree renewal are both parts of that process, and this process provides an
opportunity to retrofit the built environment in an ecologically sustainable manner.
Indeed, such opportunities can significantly improve the streetscape without detracting from its
character. Raingardens can be configured to suit the existing environment. For example, garden
beds that remove stormwater pollution through natural vegetation can be set around existing
street trees and within traffic calming devices.
5.4 Open Space
There are some gaps in provision of open space as highlighted in Figure 13 below. Some areas
such as Fulham Gardens, Kidman Park and West Lakes Shore have a high level of open space
provision. There are also issues with the quality of a large number of reserves, including
facility/asset and landscape quality.
In general, an increase in residential densities around Seaton, Albert Park and Cheltenham are
likely to further exacerbate the current gap in open space provision in those areas. Affordable
housing will create greater pressure on public open space.
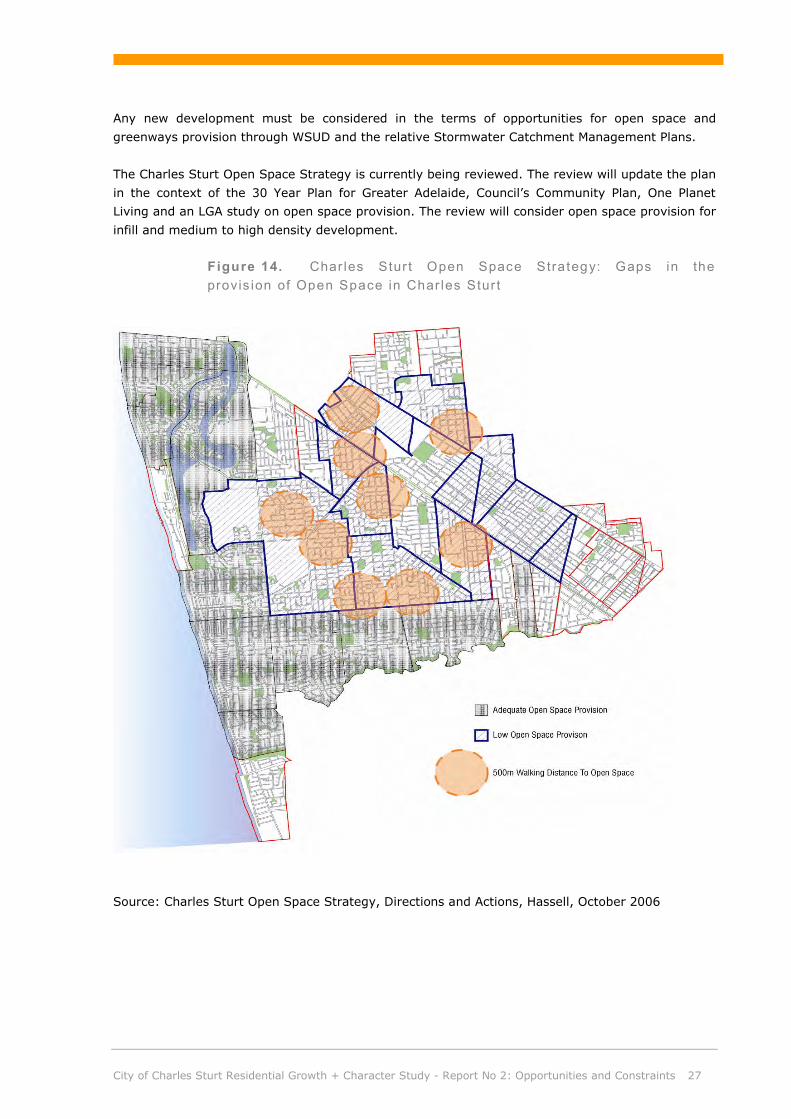
City of Charles Sturt Residential Growth + Character Study - Report No 2: Opportunities and Constraints 27
Any new development must be considered in the terms of opportunities for open space and
greenways provision through WSUD and the relative Stormwater Catchment Management Plans.
The Charles Sturt Open Space Strategy is currently being reviewed. The review will update the plan
in the context of the 30 Year Plan for Greater Adelaide, Council’s Community Plan, One Planet
Living and an LGA study on open space provision. The review will consider open space provision for
infill and medium to high density development.
Figure 14. Char les Stur t Open Space Strategy: Gaps in the provis ion of Open Space in Char les Stur t
Source: Charles Sturt Open Space Strategy, Directions and Actions, Hassell, October 2006
City of Charles Sturt Residential Growth + Character Study - Report No 2: Opportunities and Constraints 28
6 Constraints - Heritage + Character
There are a number of areas which have a strong and highly valued character or heritage assets as
shown in Figure 14. Many of these are along the Outer Harbor line and around railway stations.
In general, it is anticipated that the broader community would not wish to see Historic
Conservation Areas significantly change to accommodate higher density dwellings. Indeed, the
State Government has recognised that character or heritage in these areas are significant
constraints to achieving greater residential densities and have lowered their residential growth
targets accordingly.
There may be some opportunities to sensitively design dwellings around these areas on a case by
case basis. For example, there are some locations adjacent to Grange Road where increased
residential density is considered appropriate.
However at this stage the heritage and character areas presented in Cheltenham, Woodville,
Kilkenny environs, Henley Beach and Brompton are seen as areas where it is not appropriate to
change the character of the built form in order to achieve higher residential densities.
Character areas are show as yellow in figure 14. These areas have been identified as having a
consistent character with a predominant built form constructed before 1940 and are excluded from
the Residential Development Code. The Residential Development Code is a State Government
initiative aimed at streamlining development applications for residential dwellings, alterations and
minor structures. The Residential Development Code came into operation in March 2009.
It is suggested that there are significant opportunities elsewhere across the City of Charles Sturt to
achieving higher residential densities, and the costs of losing built form that is highly valued by the
community does not outweigh the benefits that would be gained from relatively minor increases in
dwelling numbers if these areas were developed.
The Historic Conservation Areas are shown as brown shaded areas in Figure 14 on the following
page.

City of Charles Sturt Residential Growth + Character Study - Report No 2: Opportunities and Constraints 29
Figure 15. City of Char les Sturt 's Draf t Def ined areas of Neighbourhood Character and Her itage
City of Charles Sturt Residential Growth + Character Study - Report No 2: Opportunities and Constraints 30
7 Spaces for Places – How Many Additional Dwellings will be Required?
7.1 Anticipated Dwelling Demand to 2031 in Relation to the 30 Year Plan
In considering the additional dwelling requirements for Charles Sturt, the highest growth scenario
(the 30 Year Plan) has been selected to provide anticipated growth numbers.
Table 2 identifies the anticipated dwelling and population numbers required in Charles Sturt if the
30 Year Plan growth targets are met.
The 30 Year Plan has provided estimated growth estimates for the Western Region; and has broken
the growth objectives into "Centres and Corridors", and "Areas Outside Centres and Corridors".
Assumptions
Our translation of these growth objectives into approximate future dwelling figures for Charles
Sturt assumes that:
Household Size
§ There is an average household size of 2.1 (30 Year Plan uses 1.9 persons for TOD's areas and
2.2 persons in areas outside TOD's areas)
Estimated Portion of Total Anticipated Population Growth in the Western Area received
by Charles Sturt
§ Charles Sturt receives 75% of the anticipated growth in TOD's as it contains three out of the
four nominated TOD's sites being Bowden, Woodville and West Lakes;
§ Charles Sturt receives 50% of the anticipated growth in Centres + Corridors as it contains
approximately 50% of the likely centre site/corridors being Seaton, Albert Park, Kilkenny, Port
Road, Grange Road, West Lakes Boulevard;
§ Charles Sturt receives 40% of the anticipated growth in areas not in Corridors and Centres as it
is estimated to contain approximately 40% of the areas where densification may be possible
given the existence of heritage, character and other "constraint" areas.
Estimated Densities in Centres/TOD's
§ Densities in Centres/TOD’s + Corridors have been calculated at a net dwelling density of 60
dwellings per ha (recognised as high density). This means that after allowances for roads,
open space and public spaces, the expected number of dwellings that would be achieved on 1
hectare of land is 60 dwellings.

City of Charles Sturt Residential Growth + Character Study - Report No 2: Opportunities and Constraints 31
Table 2. Ant ic ipated Dwel l ing and Populat ion requirements for Char les Stur t based upon The 30 Year Plan for Greater Adela ide Object ives
CENTRES +
CORRIDORS
WESTERN
REGION
GOAL
CHARLES
STURT
GOAL
CORE AREAS
(KNOWN TO BE
CURRENTLY
VACANT OR
UNDERUTILISED)
WIDER
AREAS
AROUND
CORE AREAS
(800 m
RADIUS)
High order TODs
(Clipsal, Cheltenham/
Woodville, West Lakes)
19,820
persons
14,860
persons
(75%)
6,390 persons 8,470 persons
(4,035
dwellings)
Centres (Seaton, Albert
Park, Kilkenny,) +
Corridors
38,820
persons
19,410
persons
(50%)
2,400 persons 17,010
persons
(8,100
dwellings)
Other 5,080
persons
2,030
persons
(40%)
SUB TOTAL 63,720
persons
36,300
Persons
(17,290
dwellings)
8,790 persons
(4,185
dwellings)
25,480
persons
(12,135
dwellings)
AREAS NOT IN
CORRIDORS AND
CENTRES
Key Regeneration
Areas (Housing SA
Areas, Findon, Kidman
Park, Ridleyton)
5,080
persons
2,030
persons
(40%)
Minor Redevelopment 14,200
persons
5,680
persons
(40%)
SUB TOTAL 19,280
persons
7,710
persons
(40%)
(3,670
dwellings)
TOTAL 83,000
persons
44,010
persons
(20,960
dwellings)

City of Charles Sturt Residential Growth + Character Study - Report No 2: Opportunities and Constraints 32
Table 2 shows that in total an additional (approximate) 20,960 dwellings will be required in Charles
Sturt by 2038 if the 30 Year Plan targets are to be met.
Of these, approximately 82% will be located in TOD's (which are located on the Main Transit
Corridors – Outer Harbor, Grange and the West Lakes Transit Corridor), Centres, and 400 metres
either side of "other" transit corridors (ie Port Road, Torrens Road, Henley Beach Road and Grange
Road Transit Corridor).
However of this 82%, only about a quarter will be located in the "core" areas of TOD's and Centres
with the remaining three quarters being located in the 400 - 800 metres surrounding the "core"
areas and generally within the 400 - 800 metre wide corridor.
To summarise:
In total
An additional (approximately) 20,960 dwellings should be provided in Charles Sturt by 2039 to
meet the 30 Year Plan population growth targets.
Residential Growth Within Centres and Corridors
Approximately 82% of this growth (17,290 dwellings) will be located in "Centres" and "Corridors".
25% of the "Centres and Corridor" growth (4,035 dwellings) will be within the "core areas" of
these TOD's/Centres (the core areas are the areas immediately adjacent to Centres and Corridors
which are currently vacated, non residential or underutilised. This portion of the growth does not
necessarily extend to the 800 metre radius around the centres and corridors as currently proposed
by the State Government). These areas should be relatively easily converted to housing.
75% of the "Centres and Corridor" growth (13,978 dwellings) will need to be located along
corridors and in the wider (800m) radius around the Centres. This is likely to be a challenge.
Residential Growth Outside Centres and Corridors - in the Remaining Residential Areas
Only 3,670 dwellings need to be located in the "areas not in Centres and Corridors". This means
that the ongoing development of approximately 120 dwellings per annum distributed generally
across the suburbs but not located in the centres or along train/tram lines or corridors). Based on
previous development trends this should be achievable.

City of Charles Sturt Residential Growth + Character Study - Report No 2: Opportunities and Constraints 33
8 Spaces for Places – Potential Locations for New Dwellings
This section of the Report gives an approximate guide to the potential dwelling numbers that could
be accommodated at various sites that have potential growth opportunities. It is intended to be
indicative only, in order to show what the 30 Year Plan growth targets means for the suburbs of
the City of Charles Sturt. The calculations are approximate, and based on information available to
the consultants at the time of preparation. It is acknowledged that continued refinement will
improve their accuracy. They have informed further analysis of character and form of growth that
is detailed in Report 4 - Character and Form of Potential Residential Growth in the City of Charles
Sturt.
8.1 Train Stations/TOD’s + Centres
8.1.1 West Lakes Boulevard and Grange Corridor: 2400 dwellings
There is significant potential at West Lakes for increased densities, particularly as a consequence of
the proposed extension of the rail line and the potential AAMI Stadium Redevelopment. This area
therefore provides excellent potential for further exploration, although the age of building stock at
West Lakes would suggest that many of the dwellings are still structurally sound and have high
capital to site value ratios, which makes redevelopment less economically viable. It is estimated
that there is a potential total of additional 2400 dwellings in this area.
On the basis that West Lakes Boulevard becomes a transport corridor for light rail, the areas within
Seaton and Royal Park within approximately 400m* each side of the Boulevard, and AAMI Stadium
Precinct have the potential for future reinvestment and redevelopment in line with this concept at
higher densities. It would be unlikely that there will be significant redevelopment outside the
Housing SA and AAMI Precinct area as West Lakes has a relatively high capital to site value ratio,
and it is not an old suburb compared to other redevelopment opportunities.
For the calculations in this report, an assumption was made that:
§ The AAMI Stadium Precinct in West Lakes (between West Lakes Boulevard, Turner Drive,
Frederick Road and Brebner Drive) could potentially generate an additional 1300 - 1500
dwellings,
§ Seaton Park Railway Station TOD development potential (core site) 4.1 ha @65
dwellings/hectare, 266 dwellings.
* Note: the potential development area could be extended 800m either side of the corridor, this
will provide additional yield.
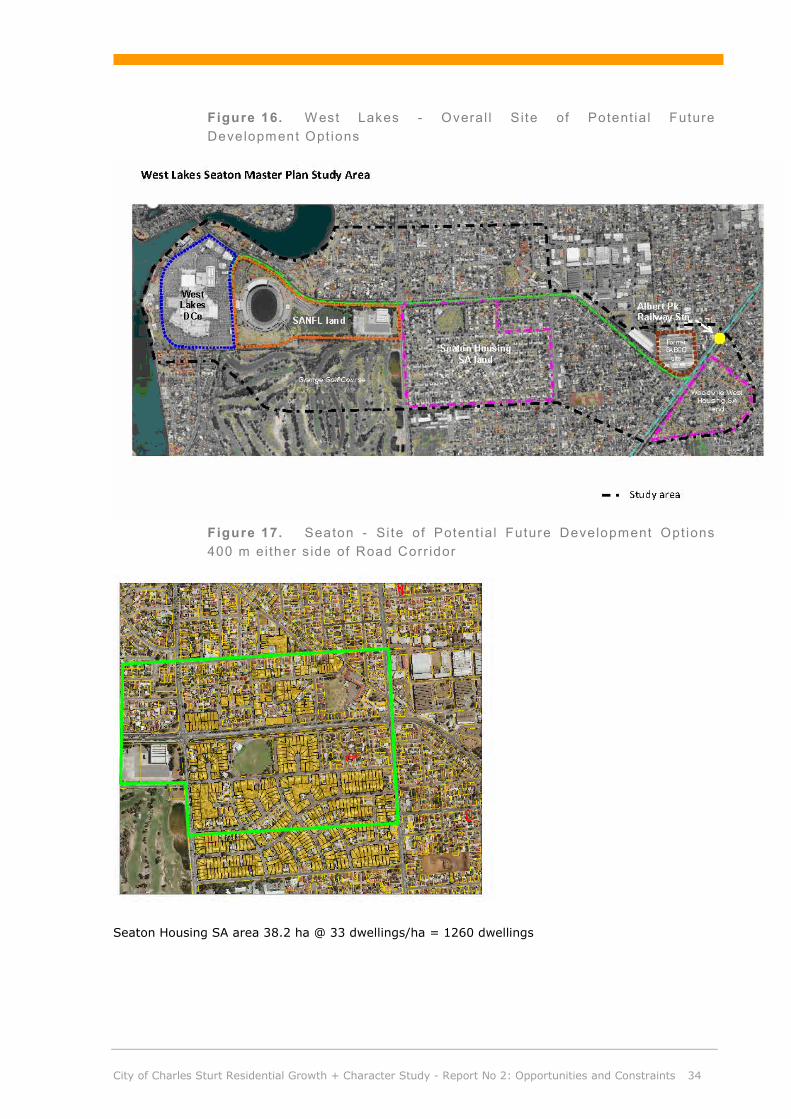
City of Charles Sturt Residential Growth + Character Study - Report No 2: Opportunities and Constraints 34
Figure 16. West Lakes - Overal l Site of Potent ia l Future Development Opt ions
Figure 17. Seaton - Si te of Potent ia l Future Development Opt ions 400 m ei ther s ide of Road Corr idor
Seaton Housing SA area 38.2 ha @ 33 dwellings/ha = 1260 dwellings

City of Charles Sturt Residential Growth + Character Study - Report No 2: Opportunities and Constraints 35
Figure 18. Seaton Park Rai lway Stat ion - Site of Ident i f ied TOD
Source: Kilkenny and Seaton TOD Scoping Study, PB, 2010
Seaton Park Station potential TOD 4.1ha @ 65 dwellings/hectare = 266 dwellings

City of Charles Sturt Residential Growth + Character Study - Report No 2: Opportunities and Constraints 36
8.1.2 Albert Park TOD/Woodville West Housing SA land: 700 dwellings
Current calculations for the Albert Park TOD site has been based on an anticipated 300 dwellings.
Calculations for Woodville West has been based on an anticipated 400 dwellings (as identified by
Housing SA).
Figure 19. Alber t Park Rai lway Stat ion - Si te of Potent ia l Growth
Woodville West Housing SA Redevelopment has a site area of 13.2ha @35 dwellings/ha = 425
dwellings.
Former SABCO site 4.1ha @ 35 dwellings/ha = 135 dwellings.
8.1.3 Kilkenny Railway Station, Rail corridor and Port Road (Bowden to Cheltenham): 260 dwellings
The potential redevelopment area around Kilkenny is located on the Bianco site approximately 7km
north west of Adelaide CBD along the Outer Harbor line. This area has been the subject of a more
detailed design investigation, documented in the Kilkenny and Seaton TOD Scoping Study, Parsons
Brikerhoff, 2010. Estimated development potential is 260 dwellings.
For the calculations in this report, an assumption was made that:
§ There is a site area of 4.0 ha @ 65dw/ha=260 dwellings. There is an opportunity to further
examine site potential based on an 800 m radius around the station, and through consideration
of the more detailed analysis undertaken in the 2010 TOD Scoping Study.

City of Charles Sturt Residential Growth + Character Study - Report No 2: Opportunities and Constraints 37
Figure 20. Ki lkenny Railway Stat ion - Si te of Current ly Ident i f ied Potent ia l Future Development Opt ions
Figure 21.
Source: Kilkenny and Seaton TOD Scoping Study, PB, 2010

City of Charles Sturt Residential Growth + Character Study - Report No 2: Opportunities and Constraints 38
8.1.4 Cheltenham/St Clair and Woodville Village TOD: 1750 dwellings
Current calculations for the Cheltenham/St Clair + Woodville Village TOD site potential has been
based on 1400 dwellings (Cheltenham) + 350 dwellings (@ 75 dwellings/ha) (Woodville TOD) =
1750 dwellings.
Figure 21. Cheltenham/Woodvi l le Train Stat ion Site - Current ly Ident i f ied Future Development Options

City of Charles Sturt Residential Growth + Character Study - Report No 2: Opportunities and Constraints 39
8.1.5 Bowden Urban Village (TOD): 1880 dwellings
This is located between Port Road, Park Terrace, Chief Street and Second/Seventh Street. Current
calculations for the Clipsal site 10.25 ha plus the Origin 6.5 ha site (total 16.75 ha) are 2200
dwellings (based on 135 dwellings/ha). The site is being redeveloped by the Land Management
Corporation and is subject to a master planning process.
Figure 22: Bowden Urban Vi l lage Master Plan Study Area

City of Charles Sturt Residential Growth + Character Study - Report No 2: Opportunities and Constraints 40
8.1.6 Findon: 117 dwellings
Current calculations for the Findon Village potential has been based on 1 .8 ha @65 dw/ha = 117
dwellings. There is an opportunity to further examine site potential based on an 800 m radius
around the local shopping village which will be considered in the next stage of this project.

City of Charles Sturt Residential Growth + Character Study - Report No 2: Opportunities and Constraints 41
8.2 Road Corridors
8.2.1 Grange Road and Henley Beach Road
Potential densification could exist along either side of the road something similar to the upper end
of Henley Beach Road and Findon Shopping Centre (corner Findon and Grange Road).
8.2.2 Woodville Road
Woodville Road has some opportunities for increased densities however it has significant road
capacity limitations. The biggest opportunity is for TOD around the Woodville Railway Station,
however this will only likely achieve an additional 350 odd dwellings (in addition to the 1400
dwellings at Cheltenham). A Master Plan has been developed on behalf of the LMC and City of
Charles Sturt for Woodville Road and Woodville TOD with the Study Area identified below. Through
the process of the Master Plan, character, land use and density were examined.
Figure 23. Woodvi l le Vi l lage Master Plan Study Area
8.2.3 Port Road/Torrens Road
Port Road has the greatest potential to be further densified with varied and complimentary land
uses (residential, retail, commercial) as it is the major boulevard linking the City to the Port and
has an existing rail network. It will experience significant infrastructure investment into the future.

City of Charles Sturt Residential Growth + Character Study - Report No 2: Opportunities and Constraints 42
8.3 Existing Suburbs Outside the TOD’s/Centres
The 30 Year Plan states that the large majority of future development and increasing densities
should be located around train stations, centres and corridors, and it does not anticipate significant
change to the "suburban" nature of the existing suburbs.
There are some locations scattered amongst existing suburbs that are likely to yield increased
dwelling numbers, however in general they will make a minimal contribution to achieving the
target yields. The areas in existing suburbs which may experience increased yields are as follows:
8.3.1 Future Public Housing Yields: 400+ dwellings
The focus of regeneration is currently on the final stages of the Westwood project including Athol
Park. Small scale redevelopment activity continues through Better Neighbourhood Projects at
densities allowed for by the existing Development Plans. In general, substantial increases in yield
are not proposed in the short term:
§ Pennington currently has 116 dwellings, not likely to gain a significant increase
§ Semaphore Park currently has 498 dwellings, not likely to gain a significant increase in the
next 10 - 15 years
§ West Lakes currently has 55 dwelling, not likely to gain a significant increase
§ Kidman Park
In the medium term there is recognised potential for redevelopment:
§ Seaton currently has 463 dwellings, anticipated increase in the order of 32 to 36 dwellings per
ha
§ Woodville West currently has 143 Housing SA homes, 41 privately owned dwellings, anticipated
increase in the order of 32 to 36 dwellings per ha. Expected yield of 425 dwellings.
8.3.2 Ridleyton: 100 dwellings
This public housing area has been identified in the 30 Year Growth Plan as having redevelopment
potential (refer Map E3). It is not currently identified as having such potential by Housing SA. The
next phase of this project will further investigate the potential of this site although it is not
expected for there to be any potential for a significant contribution to achieving the dwelling yield
goals required to meet the 30 Year Growth Plan. Current calculations are based on a dwelling yield
of 100 dwellings, with a site area of approximately 1.8 ha.

This report has been prepared by:
SGS Economic and Planning and
Jensen Planning + Design
Cit y of Charles St urtCit y of Charles St urtCit y of Charles St urtCit y of Charles St urt
RRRResident ial esident ial esident ial esident ial GGGGrowt hrowt hrowt hrowt h ++++ CCCCharact er haract er haract er haract er SSSSt udyt udyt udyt udy
Report 3 Summary of Future Social
Infrastructure Requirements May 2011

Table of Contents
1 Executive Summary.................................. ............................. 1
2 Context............................................ .................................... 3
2.1 Spatial Socio Economic Trends Influencing the Future Supply of Social Infrastructure .......... 3 2.2 Key Policy and Demographic Trends Influencing the Supply of Human Service Infrastructure 5
2.2.1 The Greater Adelaide 30 Year Plan ................................................................... 5 2.2.2 Population Growth and Ageing of our Population ................................................ 5 2.2.3 Migration ...................................................................................................... 7 2.2.4 Overseas Students ......................................................................................... 8 2.2.5 Current Supply .............................................................................................. 8
3 Social Infrastructure Needs Assessment ............................... 10
3.1.1 Childrens and Youth Facilities ........................................................................ 13 3.1.2 Residential Aged Care................................................................................... 13 3.1.3 Multi Purpose Community Centre ................................................................... 14 3.1.4 Land Requirements ...................................................................................... 14

City of Charles Sturt Residential Growth + Character Study
Report No 3 Summary of Future Social Infrastructure Requirements
P. 1
1 Executive Summary
This report is the third report prepared for the Residential Growth and Character Study. The study
is examining future residential growth and character issues across the City of Charles Sturt.
This report provides a broad overview of the context and supply requirements of future social
infrastructure needs across Charles Sturt. In particular it will provide a general understanding of the
regional needs for:
§ Child care centre
§ Community centre / multipurpose hall
§ Primary + secondary school – public
§ Youth centre
§ Nursing home for residential aged care and respite care (District facility)
§ Branch library (District facility)
Once there is a more detailed understanding of the exact population growth targets and of the
localities and centres of growth across the whole of the Western Region, it would be important to
make a more detailed assessment of specific needs. Such an assessment would take existing
infrastructure and their capacities into account (i.e. how much growth can be accommodated for by
existing facilities?), government policy related to individual service infrastructure provision, growth
quotas, service delivery models, population make up, cultural influences, and also the availability of
facilities in adjacent residential communities (sharing of facilities).
Although we may be in a position to identify general population increases in particular areas, the
relationship between population numbers and the other regional, policy, cultural, demographic and
funding factors is complex. Therefore future human services provision will require a regional and
collaborative approach between the large number of government and non government service
providers.
The first report prepared for this project - the Strategic Context Report , provides a more detailed
analysis of population trends and policy approaches within the State Government and the City of
Charles Sturt.
The second report - Opportunities and Constraints, examines potential opportunities and
constraints for future residential growth in the City of Charles Sturt. It summarises future
population and housing projections specific to Charles Sturt based on a range of population
scenarios, and examines how many additional dwellings will be required in the City of Charles Sturt
to 2031 to meet the Greater Adelaide 30 Year Plan Growth targets.
The forth report – Form and Character of Potential Residential Growth Opportunities, provides
recommendations about the future character, form and extent of residential growth areas in the
City of Charles Sturt.
The fifth report - Development Plan Policy Analysis for Growth Areas assesses current Development
Policy relating to the identified residential growth areas. It proposes new residential design policy

City of Charles Sturt Residential Growth + Character Study
Report No 3 Summary of Future Social Infrastructure Requirements
P. 2
and zoning changes for the identified residential growth areas that will inform a forthcoming
Residential Development Plan Amendment.
The sixth report - Review of Certain Historic Conservation Areas, reviews the zone boundaries and
policies for a number of existing Residential Character Zones, Historic Conservation Areas. It
identifies opportunities for the refinement of the zone boundaries.

City of Charles Sturt Residential Growth + Character Study
Report No 3 Summary of Future Social Infrastructure Requirements
P. 3
2 Context
The adequacy of social infrastructure is related to many factors. This includes current supply levels,
quality of service, location and accessibility, design, relationship to the socio-spatial elements of
demand, cultural influences, and government policy.
Recently the Draft City of Charles Sturt Community Health Report (Kath Moore and Associates,
2009) reported on the state of health of the Charles Sturt communities. Whilst this report did not
provide a detailed analysis of social infrastructure supply issues, it provided a good context of
physical, social and emotional need related to different regions within Charles Sturt. This provides
an understanding of social infrastructure need in differing local regions.
Analysis undertaken for the Bowden Urban Village development has also provided an indication of
future social infrastructure requirements in that region. This is referred to in Section 3 of this
report.
The key findings of the Charles Sturt Community Health Report are detailed below.
2.1 Spatial Socio Economic Trends Influencing the Future Supply of Social Infrastructure
There is differing socio-economic disadvantage amongst different regions with the City of Charles
Sturt. The Coastal region rates on many of the factors analysed indicated relative advantage,
whereas the other three regions were quite the opposite. The Coastal data could be said to skew
the overall City of Charles Sturt data toward a more positive light. Refer to Report 1 – Strategic
Context – for a further discussion on SLAs and Regions.
Residents of North East, Inner West and Inner East indicated relative disadvantage in a range of
factors including mortgage and rental stress (see Figure 1). The North East showed the greatest
relative disadvantage. People that have higher rates of socio-economic disadvantage often have
higher rates of indicators of health disadvantage.
Other key findings of the Community Health Report (Draft, 2009) are that:
§ Inactivity and the rate of obese/overweight people in City of Charles Sturt is greater than
the South Australian average.
§ The City of Charles Sturt’s rate for the estimated number of current smokers, 18 years
and over was greater than the figure for South Australia.
§ The Inner East and Inner West regions also ranked higher than the South Australian
average for some incidences of lung cancer and Chronic Obstructive Pulmonary Disease.
§ The Coastal region had the greatest rate of asthma and respiratory issues.
§ Rates of psychological distress, behavioural disorders and deaths from suicide were higher
in Charles Sturt in comparison to the South Australian average.

City of Charles Sturt Residential Growth + Character Study
Report No 3 Summary of Future Social Infrastructure Requirements
P. 4
§ Charles Sturt has a greater percentage of persons with a profound or severe disability
living in either long-term accommodation or in the community in comparison to the South
Australian average.
§ There is a lower offering of residential aged facility places in Charles Sturt in comparison to
the South Australian average.
Figure 1. Regions in City of Char les Stur t that are d isplaying h igher than average indicators of health or soc io economic d isadvantage (Source: Draf t Community Health Report , 2009)

City of Charles Sturt Residential Growth + Character Study
Report No 3 Summary of Future Social Infrastructure Requirements
P. 5
2.2 Key Policy and Demographic Trends Influencing the Supply of Human Service Infrastructure
2.2.1 The 30 Year Plan for Greater Adelaide
The 30 Year Plan for Greater Adelaide identifies locations for substantial new residential growth
alongside road and train corridors, Transit Oriented Developments (TOD's) and activity centres. It
also nominates new greenfield growth areas of Roseworthy, Concordia, Buckland Park and others.
For the City of Charles Sturt, some areas alongside Port Road, Woodville Road and Torrens Road
may experience substantial increases in density, as well as the nominated high order TOD's sites of
Woodville/Cheltenham, Bowden and West Lakes, and lower order TODs/Centre Sites at Seaton,
Albert Park, Kilkenny and others.
Significant increases in population in these areas will lead to increased localised and possibly
regional demand in a range of social infrastructure facilities. The nature of the facilities demanded
will depend on a range of factors including existing levels of supply, the demographic makeup
(particularly age and household formation), and the function of the local area (whether district
activity centre, TOD etc).
However, the 30 Year Plan does not at this stage have an implementation arm or provide any
guide to how, where or when human service infrastructure planning should be provided alongside
the nominated new growth areas.
Nor is there an up to date guide to human service planning provision - the previous well respected
and widely utilised Human Service Planning Kit from the 1990's has dealt with only greenfield sites
and is not applicable to infill or regeneration areas that will be the focus of Charles Sturt Human
Services Planning.
2.2.2 Population Growth and Ageing of our Population
Population growth in Charles Sturt will increase the need for local social and community services.
A range of population scenarios and their underlying assumptions have been detailed in Report 1 -
Strategic Context and Report 2 - Residential Growth Opportunities.
The Scenarios used in this social infrastructure analysis to assist in identifying future social
infrastructure requirements are based on medium population projections, and on the government
growth target scenario '2 million by 2050'. They do not consider the population projections outlined in
the 30 Year Plan as this was released after the social infrastructure analysis was undertaken. However
as a broad guide for future need, the scenarios used in this report are still relevant.

City of Charles Sturt Residential Growth + Character Study
Report No 3 Summary of Future Social Infrastructure Requirements
P. 6
Population projections for Charles Sturt show that from 2006 to 2031 population will expand by
13,404 according to the 'medium scenario' and 37,602 according to the growth target scenario ‘2
million by 2050’. An assessment of the 30 Year Plan Growth Targets indicates that Charles Sturt will
need to provide an additional approximate 22,730 dwellings within the next 30 years (see discussion
in Report No 2 - Residential Growth and Character Study, Opportunities and Constraints).
As a consequence, demand for social and community facilities is expected to increase.
We know that the numbers of people aged 65+ will double, the characteristics of older population
will change, and where older people live will change.
We also know that the degree, timing and speed of ageing varies greatly across regions so there
are different human services planning implications between areas. For example there are high
levels of ageing in coastal regional areas fuelled by retirement migration.
The ageing of population will have a marked impact on the demographic structure of Charles Sturt.
Under the medium scenario, there will be a real drop in the number of persons aged 5 to 19 years.
Both scenarios anticipate strong growth in the number of persons aged 70 years and over. The figures
below reflect the anticipated change in population by broad age group according to the two scenarios.
Figure 2. Populat ion change by broad age group in Char les Sturt , Medium Scenar io (2006 - 2031)
2006-2021 2006-2031
0-4 340 159
05-14 -948 -622
15-19 -253 -153
20-70 6,062 4,295
70+ 3,632 9,724
all ages 8833 13404
-2,000
0
2,000
4,000
6,000
8,000
10,000
12,000
14,000
16,000
Population change (persons)

City of Charles Sturt Residential Growth + Character Study
Report No 3 Summary of Future Social Infrastructure Requirements
P. 7
Figure 3. Populat ion change by broad age group in Char les Sturt , 2 mil l ion by 2050 Scenar io (2006 - 2031)
2006-2021 2006-2031
0-4 524 910
05-14 -289 1,328
15-19 -394 -209
20-70 7,287 10,475
70+ 6,555 25,098
all ages 13684 37602
-5,000
0
5,000
10,000
15,000
20,000
25,000
30,000
35,000
40,000
Population change (persons)
Also critical is that approximately 60% of future households are anticipated to be smaller,
comprising lone persons and couples without children.
2.2.3 Migration
South Australia continues to experience strong increases in overseas migrants - made up of
"skilled", "business" and "humanitarian" migrants. This is primarily due to increased migrant
quotas for the Australian migration program and changes to immigration policy. Migration strongly
contributed to the continued goal of the State Government to achieve 2 million people in SA by
2050. Charles Sturt has experienced strong increases in migration. The varying nationalities and
cultural mixes across the different regions of Charles Sturt will strongly influence the provision of
human services into the future.

City of Charles Sturt Residential Growth + Character Study
Report No 3 Summary of Future Social Infrastructure Requirements
P. 8
2.2.4 Overseas Students
South Australia's share of overseas students, primarily from Asia, continues to grow. Most overseas
students live in and near the CBD, and are not strongly represented in the City of Charles Sturt.
2.2.5 Current Supply
This report does not detail the current supply of key human service agencies as it has just considered
demand requirements based on broad population projections. As a preliminary guide, the current
provision and distribution of education facilities, library facilities, child care centres and community
centres is shown in Figure 4.

City of Charles Sturt Residential Growth + Character Study
Report No 3 Summary of Future Social Infrastructure Requirements
P. 9
Figure 4. Distr ibut ion of Schools , L ibrar ies and Community Services (Source: Community Health Repor t , 2009)
City of Charles Sturt Residential Growth + Character Study
Report No 3 Summary of Future Social Infrastructure Requirements
P. 10
3 Social Infrastructure Needs Assessment
Social infrastructure needs change with population growth and with changes in the composition of the
population. SGS has developed the Social Infrastructure Needs Assessment Model. The model uses a
set of benchmarks (one benchmark per type of facility) that reflect the number of residents to be
serviced by one facility. The benchmarks are based on experience throughout Australia. The
assumptions used in the population modelling have been outlined in Report 1 - Strategic Context, and
are of course subject to change.
Key local infrastructure facilities that have been assessed for Charles Sturt are:
§ Community Cultural Infrastructure (Child Care Centre, Community Centre / Multipurpose
Hall, Youth Centre, District Facility Branch Library)
§ Education Infrastructure (Primary School + Secondary School – public)
Other higher level facilities such as TAFE, SES services and performing arts have not been included. At
a higher geographical level, the district and regional level, the anticipated population growth in
Charles Sturt will drive up demand for State Emergency Services, police, primary health care and
community and arts venues as well. It should be noted that many of these services are State or
Commonwealth Government provided or funded.
Also not considered is the need for health facilities such as aged care supported accommodation,
independent seniors living units, nursing accommodation, GP Plus, health research and
development services; and allied health and services.
3.1.1 Assessing Social Needs Infrastructure in Charles Sturt
In the past, social infrastructure requirements have been based on fairly standardised figures
which imply a 'norm’. Typically these standards have related to greenfield sites, and were
documented in the past in the widely used Human Services Planning Kit developed by the SA
Urban Lands Trust. However for at least the last ten years, this kit has been out of date as
greenfield provision has significantly different infrastructure requirements to infill provision in
existing urban areas. As a general guide, Figure 5 provides an estimation of facility requirements
based on estimated population numbers in a greenfield site.
Alternatively, other ways of assessing rates of facility provision includes using:
§ benchmarks, which often imply ‘adequacy’; and
§ targets, which can indicate a goal to be achieved.
In Charles Sturt, we consider that the rapid ageing of population in South Australia is one of the most
significant influences on the need and type of social infrastructure. Therefore this analysis has

City of Charles Sturt Residential Growth + Character Study
Report No 3 Summary of Future Social Infrastructure Requirements
P. 11
assessed future need using an age specific approach instead, whilst having reference to existing
standards that exist within government or other agencies.
Figure 5. Est imated soc ia l inf rastruc ture requirements per populat ion in a greenf ie ld s i te
Adapted from the Draft Bowden Village Master Plan Stage 1 Report, 2008
Below is an overview of the expected social infrastructure needs for Charles Sturt between 2006 and
2031, with Figure 6 to the Medium Scenario and Figure 7 referring to the ‘Two Million’ Scenario.

City of Charles Sturt Residential Growth + Character Study
Report No 3 Summary of Future Social Infrastructure Requirements
P. 12
Figure 6. Socia l Inf rastruc ture Needs in Char les Sturt , Medium Populat ion Scenar io (2006 - 2031)
Social infrastructure needs according to the ‘Two Million’ Scenario are more substantial and are also
expected to occur earlier (see table below).
Figure 7. Socia l Inf rastruc ture Needs in Char les Sturt , 2 mi l l ion by 2050 Populat ion Scenar io (2006 - 2031)
These specific infrastructure needs are expanded in the next section.
Level Facility Facilities by 2021
Facilities by 2031
Land area (max
estimate)
Local Childcare Centre (long day care) & Kindergarten 1 1 5,000 Community Centre/Multipurpose Hall 1 2 10,000 Primary and Secondary School - Public 0 0 - Youth Centre 0 0 -
District Aged Care Service/ Respite 36 beds 93 beds, 1 nursing home
5,000
Branch Library 0 1 5,000
Medium scenario - additional requirements
Level Facility Facilities by 2021
Facilities by 2031
Land area (max estimate)
Local Childcare Centre (long day care) & Kindergarten 1 2 10,000 Community Centre/Multipurpose Hall 2 4 20,000 Primary and Secondary School - Public 0 1 70,000 Youth Centre 0 1 10,000
District Aged Care Service/ Respite 66 beds, 1 small nursing
home
251 beds, 2 nursing homes
10,000
Branch Library 1 2 10,000
High scenario - additional requirements

City of Charles Sturt Residential Growth + Character Study
Report No 3 Summary of Future Social Infrastructure Requirements
P. 13
3.1.2 Children’s and Youth Facilities
Due to the ageing of population there will be a lesser need for children’s and youth facilities,
especially according to the medium scenario. The medium scenario identifies the requirement of an
extra child care centre and of one to two community centres. No additional needs are anticipated
for the age groups of five to 19 years. According to the 2 million by 2050 scenario one to two
additional child care centres would be needed and two to four community centres. In case these
growth targets are realised by 2031 a need would arise for an additional primary school and a
youth centre.
Aside from actual population increases, it is also acknowledged that child care facilities are a draw
card for future employees as well as residents. If TOD's and other higher density local mixed used
centres are to be attractive to potential purchasers, and are to vibrant, healthy and active areas,
consideration should be given to supporting business/employers and agencies to increase the number
of child care facilities associated with these growth areas.
There are no specific education provision benchmarks for new regeneration areas within existing
suburbs. As a guide, when planning for schools in greenfield sites, the Department of Education
and Children's Services (DECS) applies generic benchmark of one primary school for a community
of between 6,000 to 6,500 persons where the proportion of school aged children is between 12-
14%. Secondary schools should be planned with an enrolment capacity of at least 1,000 students
and a catchment of at least 4 primary schools. It would be expected that one secondary school
would be provided for approximately 15,000 - 25,000 people. The new model of super schools
which applies to existing urban areas means that these figures are only useful as a guide.
The DECS also advised that future planning of education services will consider primary education
as 0 to 12 years and ultimately education campuses are also considering whole of school life from
Preschool to Year 12 formats. Given this, plus the uncertainty about locations of future growth,
future education facility considerations will change from current methods of education provision
(Reference: Draft Bowden Village Master Plan Stage 1 Report, 2008).
Best practice now suggests that youth facilities should be co-located with other community facilities.
3.1.3 Residential Aged Care
There will be a substantial need for residential aged care services (nursing homes or aged care
supported accommodation). The optimal size of a nursing home is between 80 and 120 beds1.
According to the medium scenario demand for an additional nursing home will occur between 2021
and 2031, around 2026.
1 Recent SGS research

City of Charles Sturt Residential Growth + Character Study
Report No 3 Summary of Future Social Infrastructure Requirements
P. 14
In the '2 million by 2050' scenario, due to the ageing of population there is a need for a small nursing
home by 2021. The need for aged care will grow more rapidly after 2021 to 251 nursing beds in 2031.
This need can be met by two nursing homes or one very large nursing home (although nursing homes
are run most efficiently at a scale of 80 to 120 beds).
In addition to nursing homes, it is recognised that increasingly trends are showing that many older
people would prefer to be part of the general community and do not wish to live in identified
seniors accommodation. Therefore aged accommodation should also be provided through diverse
housing choice in accessible locations.
3.1.4 Multi Purpose Community Centre
There will be a need for an additional community centre by 2021, and possibly an additional 2
centres by 2031. Whilst this analysis has not considered specific location or regional catchment
issues, the centre would need to be located where it is easily accessible by public transport,
pedestrians and bikes, be in a prominent location, be flexible in design and form so that it can
adapt to changing local community needs.
3.1.5 Land Requirements
The land area required to sustain these services can vary considerably, depending on a range of
parameters including urban design principles, opportunities for co-location, land costs and availability
of land.
The maximum expected need for land to sustain the anticipated services by 2031 is 25,000 sqm (2.5
ha) for the medium scenario (table 2).
To meet '2 million by 2050' population requirements, the maximum requirement for land by 2031 is
130,000 sqm (13 hectares). The majority of this total is taken up by land for a primary school (7
hectares).
Master Planning for specific growth locations such as Cheltenham/Woodville, along key corridors and
smaller TOD's will need to incorporate land either on site, or ensure there are linkages to areas off
site, where these facilities will be located.
Whilst this report has not discussed the need for green space, it is also recognised that this is an
important component of future social infrastructure need to meet health and well being active living
goals. Open Space Requirements have been discussed separately in Report 1 - Strategic Context.
This report has been prepared by:
Jensen Planning + Design
Cit y of Charles St urtCit y of Charles St urtCit y of Charles St urtCit y of Charles St urt
RRRResident ial esident ial esident ial esident ial GGGGrowt hrowt hrowt hrowt h ++++ CCCCharact er haract er haract er haract er SSSSt udyt udyt udyt udy
Report 4 Form and Character of Potential
Residential Growth Opportunities May 2011

Table of Contents
Report 4 - Character and Form of Potential Residential Growth 27 May 2011
1 Executive Summary.................................. ............................. 1
2 The Extent and Form of Growth .............................................. 2
2.1 Transit Oriented Developments – Woodville, West Lakes and Bowden................................ 4 2.1.1 Extent and Form of Transit Oriented Developments............................................ 4 2.1.2 West Lakes ................................................................................................... 5 2.1.3 Woodville ...................................................................................................... 6 2.1.4 Bowden Village .............................................................................................. 6
2.2 Major Transit Corridors – Outer Harbour, Grange, and West Lakes .................................... 7 2.2.1 Extent and Form of Major Transit Corridors ....................................................... 7
2.3 Road Corridors – Torrens Road, Port Road, Henley Beach Road and Grange Road................ 8 2.3.1 Extent and Form of Road Corridors................................................................. 10
2.4 Activity Centres ........................................................................................................ 11 2.4.1 Major District Centres - Arndale .................................................................... 12 2.4.2 District Centres - Fulham and Henley Beach .................................................... 13 2.4.3 Other Centres (Neighbourhood and Local Centres) ........................................... 13 2.4.4 Specialist Centres ........................................................................................ 14
3 The Character Elements of the Growth Areas......................... 15
3.1 Character Element - Mixture of Land Uses .................................................................... 15 3.1.1 Benefits of Mixed Land Uses .......................................................................... 15 3.1.2 Best Mixed Land Use Relationships ................................................................. 16
3.2 Character Element - Built Form .............................................................................. 17 3.2.1 Densities..................................................................................................... 17 3.2.2 Setbacks..................................................................................................... 18 3.2.3 Built Form Design Techniques........................................................................ 18 3.2.4 TOD's ......................................................................................................... 19 3.2.5 Transit Corridor Stations ............................................................................... 20 3.2.6 Road Corridors............................................................................................. 20 3.2.7 Activity Centres ........................................................................................... 21
3.3 Character Element - Ease of Movement........................................................................ 22 3.3.1 Parking ....................................................................................................... 22 3.3.2 TODs, Activity Centres, Road Corridors (<60m) and Transit corridor Stations
(<100m)..................................................................................................... 23 3.3.3 Road Corridors (60-200 metres), Transit corridors (100-200 metres) ................. 24
3.4 Character Element - High Quality Public Realm ............................................................. 24 3.4.1 Safety ........................................................................................................ 24 3.4.2 Comfort and Sociability................................................................................. 25 3.4.3 Landscaping ................................................................................................ 25 3.4.4 TODs, Activity Centres, Road Corridors (<60 metres) and Transit Corridor stations
(<100 metres)............................................................................................. 25 3.5 Character Element - Residential Amenity...................................................................... 26
3.5.1 Sunlight and Ventilation................................................................................ 26

Table of Contents
Report 4 - Character and Form of Potential Residential Growth 27 May 2011
3.5.2 Views ......................................................................................................... 26 3.5.3 Outdoor Living Areas .................................................................................... 26 3.5.4 Interface..................................................................................................... 26 3.5.5 Multi Storey Buildings................................................................................... 27
4 Visualising Increased Growth .............................................. 28
4.1 Resident Focus Group Research .................................................................................. 28 4.1.1 Positives ..................................................................................................... 29 4.1.2 Negatives.................................................................................................... 29
4.2 Visualising Higher Densities along Corridors.................................................................. 31
5 Determining Priorities for Growth ........................................ 38
5.1 General Work Programme .......................................................................................... 38 5.1.1 Development Plan Amendments..................................................................... 38 5.1.2 Design Guidelines and Development Plan Policy ............................................... 41 5.1.3 Structure Plans and Precinct Plans.................................................................. 41

City of Charles Sturt Residential Growth + Character Study - Report 4 - Character and Form of Potential
Residential Growth 27 May 2011
P. 1
1 Executive Summary
This report is the fourth report prepared for the Residential Growth and Character Study. This
Study has been undertaken by Jensen Planning + Design for the City of Charles Sturt. The study is
examining future residential growth and character issues across the City of Charles Sturt.
This report provides recommendations about the form of future character and extent of primarily
residential growth in areas that have been identified as having potential for increased residential
density in the City of Charles Sturt.
It builds upon the previous research undertaken and documented in three previous reports.
This report was prepared prior to further detailed work about the form and character of the growth
opportunities undertaken by DPLG, included Structure Plnanning, Precinct Planning, and BDP
modules relating to housing form and densities around activities areas, transport corridors and
TODs.
The first report prepared for this project - the Strategic Context Report analyses population trends
and policy approaches from the State Government and within the City of Charles Sturt.
The second report - Opportunities and Constraints, examines potential opportunities and
constraints for future residential growth in the City of Charles Sturt. It summarises future
population and housing projections specific to Charles Sturt based on a range of population
scenarios. It also summarises major environmental, infrastructure and other constraints to
achieving future housing growth, and examines how many additional dwellings will be required in
the City of Charles Sturt to 2031 to meet the 30 Year-Plan for Greater Adelaide growth targets.
The third report - Future Social Infrastructure Requirements provides a broad overview of the
context and supply requirements of future social infrastructure needs across Charles Sturt.
The fifth report - Development Plan Policy Analysis for Growth Areas assesses current Development
Policy relating to the identified residential growth areas. It proposes new residential design policy
and zoning changes for the identified residential growth areas that will inform a future Residential
Development Plan Amendment.
The sixth report - Review of Certain Historic Conservation Areas, reviews the zone boundaries and
policies for a number of existing Residential Character Zones. It identifies opportunities for the
refinement of the zone boundaries.

City of Charles Sturt Residential Growth + Character Study - Report 4 - Character and Form of Potential
Residential Growth 27 May 2011
P. 2
2 The Extent and Form of Growth
This section describes the extent and form of growth around the TOD's, Major Transit Corridors,
other transit corridors, and key activity centres. It provides a general guide to the distances around
the growth areas that may experience increased growth and changes to built form.
Each site will require further localised investigations as part of a Development Plan Amendment
process to more accurately identify exact boundaries and density and building height opportunities.
Section 5 in this Report identifies the further investigations and processes required that are related
to the required Development Plan Amendments.
The general extent of the main residential growth opportunities till 2024 is indicated in the
following diagram:
The general locations of key residential growth opportunities which are located around train
stations (TOD's), activity centres and along road corridors are indicated on the following plan:

City of Charles Sturt Residential Growth + Character Study - Report No 4: Character and Form of Potential Residential
Growth in the City of Charles Sturt
P. 3
Charles Sturt Indicative Residential Growth Opportunities
Note: This map gives a broad overview of
potential growth opportunities. It does not
provide accurate detail about local
opportunities. Further research is required
in local areas.

City of Charles Sturt Residential Growth + Character Study - Report No 4: Form and Character of Potential
Residential Growth
P. 4
2.1 Transit Oriented Developments – Woodville, West Lakes and Bowden
The 30-Year Plan identifies 14 new Transit Oriented Developments (TODs) to be located across
Metropolitan Adelaide. These comprise "mixed-use, higher-density development centred on a
major public transport access point. They accommodate residential, high-order retail services and
employment activities as well as high quality open space. They will be attractive, self-contained,
accessible and walkable communities in which people can live, work, shop and recreate." The Plan
identifies three TODs within the City of Charles Sturt - namely West Lakes, Woodville and Bowden.
2.1.1 Extent and Form of Transit Oriented Developments
The extent and form of growth around transit oriented developments is of high density and higher
rise buildings, largely comprising residential but incorporating retail, commercial and community
uses on ground and lower floors. Development may have heights of up to 10 storeys (in inner city
locations), building heights will depend on the specific location of the TOD, its surrounding context
and market conditions.
Generally residential built form closest to the centre/rail station will comprise apartments, either
with lifts or walk-up.
Higher density townhouse forms will also form part of the TODs, particularly as distance from the
rail or tram station increases.
TODs will also be designed with a built form interface scaling down in height adjacent to existing,
lower-rise neighbourhoods.
Generally the extent of a TOD will have an 800 metres walking catchment distance to the
train/tram stop, subject to localised physical constraints and barriers which may restrict access to
the stop or limit potential increased residential densities.
Constraints include Historic Conservation Areas as identified in the current Development Plan’s
Residential Character Zones around Bowden and Woodville and other areas in the Port Road /
Torrens Road corridor - Brompton, Ovingham, Croydon, West Croydon, Kilkenny, Woodville Park.
Other areas of Character that have been identified include Henley Beach South, Pennington and
Flinders Park. Other constraints are industrial areas and special use areas (such as a cemetery or
golf course) as identified in the Development Plan’s Industrial Zones and the Special Use Zone.

City of Charles Sturt Residential Growth + Character Study - Report No 4: Form and Character of Potential
Residential Growth
P. 5
Key elements of TOD's are:
• Higher order retail (that serve weekly convenience and comparison goods needs), commercial,
employment, educational, institutional, civic and community land uses within TODs that create
activation with the public realm and extend hours of activity will be provided at street levels
• Retail (that serve weekly convenience and comparison goods needs), commercial, employment
and community land uses within activity centres that create activation with the public realm
and extend hours of activity will be provided at street levels
• Other non residential land uses will be provided above street level up to the third storey
• Residential development should be provided either above street level or from above the third
storey
• Single use buildings should generally be avoided (i.e. large scale office or retail over numerous
levels without residential development).
• Activities that require large floor plates or do not activate with the public realm in a meaningful
manner (such as bulky goods outlets or inward looking shopping malls) should not be
established within TODs or activity centres
Summary of Extent of Dens it ies around TOD's
Note: Recently, DPLG has released Planning Policy Reforms - Proposed zone modules and related
general provisions, February 2011, Draft for Consultation that addresses the issue of building
heights in these areas. We note that DPLG’s proposed building heights vary from the
recommendations in this report. Consequently, this report’s recommended building heights are
shown in orange textboxes and DPLG’s proposed building heights for the equivalent zones are
shown underneath in green text boxes.
<200m from rail station/centre: medium rise 5-10 storeys, high density
200-400m from rail station/centre: low-medium rise 2-4 storeys, medium density
400-800m from rail station/centre: low rise up to 2 storeys, low-medium density
DPLG’s proposed Urban Core Zone Better Development Plan (BDP) Module
<400m from rail station/centre: 4-10 storeys (Core Area)
400-800m from rail station/centre: 2-4 storeys (Transition Area)
2.1.2 West Lakes
The full extent of the proposed West Lakes TOD is somewhat dependent on whether or not mass
transit is extended from the Grange line through to West Lakes. It also depends on the future use
of the AAMI stadium site and on whether or not high density housing can be retrofitted within the
existing retail centre site. Higher density development is already being developed at West Lakes
along Brebner Drive and at Island Point.

City of Charles Sturt Residential Growth + Character Study - Report No 4: Form and Character of Potential
Residential Growth
P. 6
The State Government is proposing redevelopment of some of its Housing Trust properties in the
Royal Park/Seaton areas adjacent to West Lakes Boulevard.
The current drivers of high density development at West Lakes focus on proximity to and views
over the West Lakes and to the West Lakes Mixed Use Activity Centre (Major District Level).
It is envisaged that higher density development will decrease with distance from the Lakes and the
shopping precinct, and will then focus in areas close to West Lakes Boulevard. Outside of these
areas development is more likely to be in the order of 2-3 storeys in height, whereas closer to the
centre of activity building heights may increase to 4-8 storeys, depending on the size of the site.
2.1.3 Woodville
The Woodville TOD has been identified as a priority area in the 30 Year Plan, and was subject to
further detailed planning and design as part of the Woodville Village Master Plan project (to be
undertaken during April - September 2010).
Key development opportunities exist on the land either side of the Woodville Station, residential
areas close to the station within the St Clair housing project, mixed use development along
Woodville Road and within the residential areas between Port Road and the rail line either side of
Woodville Road. The Vision for Woodville Village is "an exciting destination for both the locals and
the broader community. It is an area framed by a mixture of mostly medium to higher density
housing, offices, shops, health and education facilities, and an expansive green open parkland. At
its heart is a bustling train station, community plazas, civic facilities, cafes and shops. It celebrates
its proud heritage and embraces its diversity with food, colour, art, greenery and activity on the
street, in the community markets, in the open spaces and recreation areas. A community that is
thriving, diverse, proud, robust and active. A place that is a destination for the Western suburbs".
2.1.4 Bowden Urban Village
Bowden Urban Village is another TOD priority development area identified in the 30 Year Plan. The
Land Management Corporation on behalf of the State Government is currently finalising the Master
Plan with Council which will see a major transformation of this Precinct. The vision for the site
developed by the Principal Stakeholder group states that “Bowden Village will be a world class
medium and high-density, mixed use development - a flagship project for subsequent
developments across Metropolitan Adelaide. Bowden Village will exhibit leading edge application in
urban design and energy and water use in the context of sustainable transit oriented development
(TOD) and infill.” The Master Plan for the site proposes a mix of land uses including residential,
retail and commercial. The retail and commercial development will be focused around the railway
station(s). Open space will be provided throughout the site including a community garden. The site
is proposed to be linked with the parklands via a land bridge across Park Terrace. The high density
development is focused along Park Terrace and Port Road.

City of Charles Sturt Residential Growth + Character Study - Report No 4: Form and Character of Potential
Residential Growth
P. 7
2.2 Major Transit Corridors – Outer Harbour, Grange, and West Lakes
Major Transit Corridors are the major fixed line mass transit routes including rail and light rail.
Transit oriented developments comprise mixed-use, higher density development centred on a
major public transport access points.
They accommodate residential, high order retail services and employment activities as well as high
quality open space. They will be attractive, self contained, accessible and walkable communities in
which people can live, work, shop and recreate.
The 30-Year Plan identifies two existing and one potential major transit corridor within the City of
Charles Sturt - the Outer Harbour line, the Grange line and the West Lakes extension (potential).
The 30-Year Plan expects that over 50% of the growth in dwellings in Adelaide will occur along
corridors (inclusive of TODs located within these corridors), as well as approximately 35% of new
jobs.
It is expected that this residential growth will be located within 800 metres of current or extended
transit corridors, while it can also be expected that the majority of growth will be concentrated in
closer proximity to rail and light rail stations along these major transit corridors.
Density of development will vary throughout the corridor but is expected to increase from an
average of 15 dw/ha to a future 25-35 dwellings per hectare. Indicative heights of development at
differing distances from the corridors are given below as an indication, although they have not
been factored into any calculations that determine approximate dwelling yields.
2.2.1 Extent and Form of Major Transit Corridors
High density and medium rise residential development (4-5 storeys) is most likely within 100
metres of the rail station/tram stop, with low-rise (2-3 storeys) and medium density more common
between 100-400 metres of the actual stop.
Beyond 200 metres and out to approximately 800 metres it is envisaged that low-rise (2 storeys)
and low-medium density development, predominantly in the form of townhouses, row dwellings,
will occur. Development further than 800 metres of the actual stop is less likely as the
attractiveness to households to live close to transit corridors relates specifically to walking
accessibility to the transit station or stop, and not to the line itself.
Residential Character Zones, Industrial Zones and the Special Use Zone significantly constrain the
extent of "growth areas" along the Major Transit Corridors, particularly along the Outer Harbour
Line. Changes to zoning will be required in order to facilitate growth along major transit corridors.

City of Charles Sturt Residential Growth + Character Study - Report No 4: Form and Character of Potential
Residential Growth
P. 8
Key elements of the transit corridor stations (<100m) are:
• Small scale retail (that serve day to day retail needs) land uses that create activation with the
public realm and extend hours of activity will be provided at street level directly adjacent
station
• Residential development should be provided above retail land uses or at ground level
surrounding the station.
Major Trans it Corr idor - Indicat ive Extent of Bui ld ing Height (not incorporated into any model l ing)
<100m of rail stations/transit shops: medium rise 4-5 storeys, high density
100-200m from rail stations/transit shops: low-medium rise 2-3 storeys, medium density
200-800m from rail stations/transit shops: low rise 2 storeys, low-medium density
DPLG’s proposed Suburban Activity Node Zone BDP Module
<400m from rail station/centre: 3-6 storeys (Core Area)
400-800m from rail station/centre: 2-3 storeys (Transition Area)
2.3 Road Corridors – Torrens Road, Port Road, Henley Beach Road and Grange Road
The 30-Year Plan identifies major transit corridors as well as "other transit corridors". These are
characterised by main road access and either have, or are earmarked to have, mass transit such as
frequent bus or light rail services.

City of Charles Sturt Residential Growth + Character Study - Report No 4: Form and Character of Potential
Residential Growth
P. 9
Road corridors within the City of Charles Sturt identified in the 30-Year Plan include Torrens Road,
Port Road, Grange Road and a small section of Henley Beach Road, while we have also identified
parts of Woodville Road within this category.

City of Charles Sturt Residential Growth + Character Study - Report No 4: Form and Character of Potential
Residential Growth
P. 10
2.3.1 Extent and Form of Road Corridors
Public transport services along these road corridors are likely to revolve around frequent bus
services, or potentially a tram/light rail service. Most of these corridors are currently characterised
by a mix of retail/commercial strip development interrupted with sections of low and/or medium
residential development.
Assuming an increase in the quality and frequency of public transport and a significant
improvement in the physical amenity of these road corridors, it is envisaged that the form of
development could comprise high density buildings of up to 5 storeys in height within 60 metres of
the road frontage, incorporating non-residential usage at ground level. Development between 60-
400 metres of the road will decrease in scale and density as distance from the road increases.
Naturally the potential to redevelop sites along these road corridors will have a lot to do with
market conditions, particularly the value of existing developments within these corridors.
Underutilised and large sites are likely to be the first to be redeveloped, subject to their location.
Similarly, sites closest to the Adelaide CBD and/or to other facilities (eg Activity Centres) are likely
to be developed first and to higher densities.
As indicated in the figure on the following page, although a 400 metre wide corridor either side of
the roadways can be considered as the "growth area", higher densities are expected on or close to
the roadway itself.
Residential Character Zones, Industrial Zones and the Special Use Zone constrain the extent of the
"growth area".
Indicative heights of development at differing distances from the corridors are given below as an
indication, although they have not been factored into any calculations that determine approximate
dwelling yields.
Key elements of road corridors (<60m) are:
• Retail (that serve weekly convenience and some comparison goods needs), commercial and
community land uses that create activation with the public realm and extend hours of activity
will be provided at street level, particularly where they interact with community facilities and
public transport nodes (such as libraries, community centres, open space areas, bus stops and
trains stations)
• Other non residential land uses that do not generate the same level of pedestrian activity (such
as offices and gymnasiums) will be provided above street level up to the second storey
• Residential development should be provided above street level.
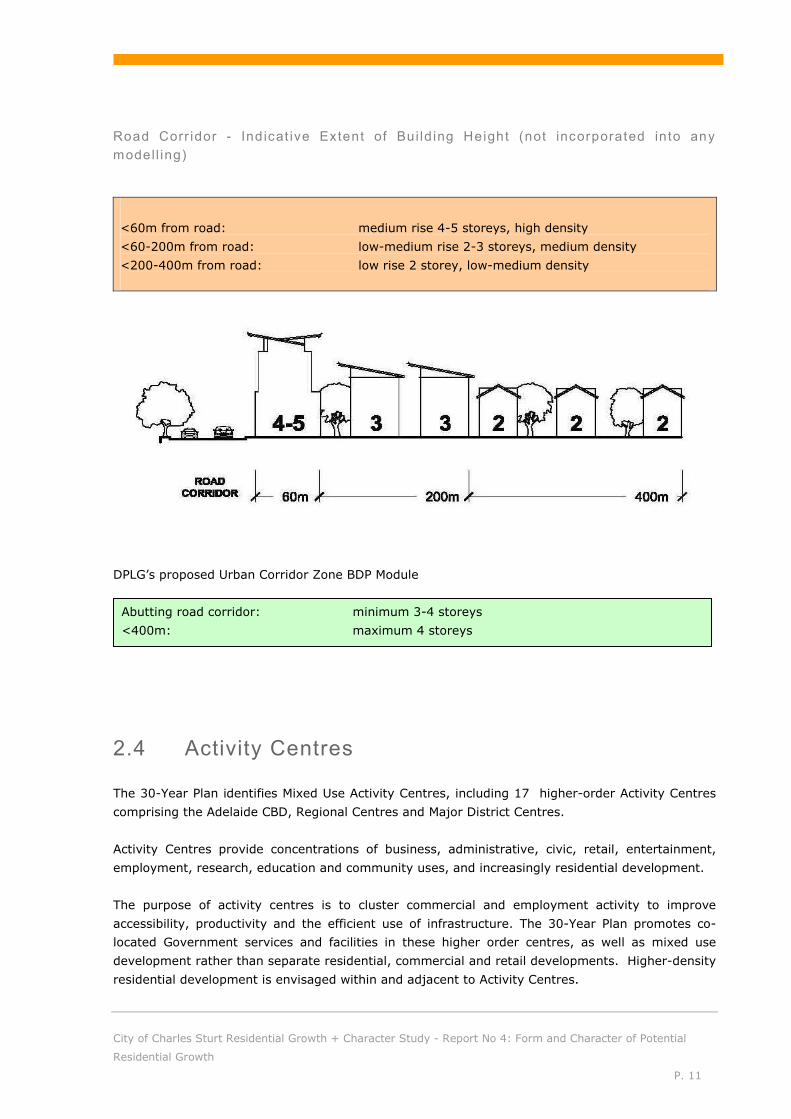
City of Charles Sturt Residential Growth + Character Study - Report No 4: Form and Character of Potential
Residential Growth
P. 11
Road Corr idor - Ind icat ive Extent of Bui ld ing Height (not incorporated into any modell ing)
<60m from road: medium rise 4-5 storeys, high density
<60-200m from road: low-medium rise 2-3 storeys, medium density
<200-400m from road: low rise 2 storey, low-medium density
DPLG’s proposed Urban Corridor Zone BDP Module
Abutting road corridor: minimum 3-4 storeys
<400m: maximum 4 storeys
2.4 Activity Centres
The 30-Year Plan identifies Mixed Use Activity Centres, including 17 higher-order Activity Centres
comprising the Adelaide CBD, Regional Centres and Major District Centres.
Activity Centres provide concentrations of business, administrative, civic, retail, entertainment,
employment, research, education and community uses, and increasingly residential development.
The purpose of activity centres is to cluster commercial and employment activity to improve
accessibility, productivity and the efficient use of infrastructure. The 30-Year Plan promotes co-
located Government services and facilities in these higher order centres, as well as mixed use
development rather than separate residential, commercial and retail developments. Higher-density
residential development is envisaged within and adjacent to Activity Centres.

City of Charles Sturt Residential Growth + Character Study - Report No 4: Form and Character of Potential
Residential Growth
P. 12
The 30 Year - Plan establishes a "typology" for Activity Centres, identifying the following additional
types of Centres:
§ Regional Centres - major strategic centres that provide a full range of retail, commercial,
administrative, entertainment, recreational and regional community facilities.
§ Major District Centres - major shopping and business centres serving immediate subregional
residential population.
§ District Centres - large centres that provide a range of retail, office, community and
entertainment facilities. Shopping usually provides the most significant role.
§ Bulky Goods Centres - Centres usually containing larger stores selling DIY and household
goods (such as carpets, furniture and electrical items). Located on main roads and cater
mainly for car borne customers.
§ Specialist Centres - include major airports, ports, hospitals, universities and research centres.
The Charles Sturt Development Plan also designates the following centres:
§ Neighbourhood Centres
§ Local Centres
High Order Act ivi t y Centres - Indicat ive Extent of Bui ld ing Height
Within and <200m from Centre: medium rise 3-5 storeys, medium-high density
200-400m from Centre: low-medium rise 2-3 storeys, medium density
DPLG’s proposed Urban Core Zone BDP Module
<400m from rail station/centre: 4-10 storeys (Core Area)
400-800m from rail station/centre: 2-4 storeys (Transition Area)
2.4.1 Major District Centres - Arndale
Arndale is one of the 17 higher-order Activity Centres, nominated as a Major District Centre.
Currently there is a significant bus interchange located at Arndale shopping centre, and a wide
range of services available. It can therefore be anticipated that land surrounding the Activity
Centre, and potentially sites within the Centre, should be developed at high densities.
There are other non-residential land uses surrounding the shopping precinct, with potential for
future mixed use development.

City of Charles Sturt Residential Growth + Character Study - Report No 4: Form and Character of Potential
Residential Growth
P. 13
While it may be possible for residential development up to 5 storeys in height, at this location
lower scale medium-rise (3-5 storeys) may be more likely. The scale and density of residential
development would reduce beyond, say, a 200 metre distance from the Activity Centre, with
apartments giving way to 2 storey townhouses forming an appropriate interface with surrounding
lower density development.
Arndale will continue to provide a wide range of retail facilities, and will service a catchment
population of 100,000+. It is also a significant employment destination serving the surrounding
region, provide a range of retail, office, community and entertainment facilities.
The retail floor space will range from 60,000 - 100,000m2.
2.4.2 District Centres - Fulham Gardens and Hindmarsh
Fulham Gardens and Hindmarsh will function as a District Centres, providing a range of retail
services that meet the community's need for weekly grocery shopping and some comparison
shopping. Stores will include discount department stores, supermarkets, speciality stores and
convenience stores.
The catchment population ranges from 30,000 -60,000 people.
The retail floor space ranges from 200 - 10,000m2.
The centres also represent important local employment nodes comprising mixture of retail,
professional services, education, health and community services,
2.4.3 Other Centres (Neighbourhood and Local Centres)
Most of the other Neighbourhood and Local Centres located within the Council area are located
along road corridors. However, as discussed above, the potential for growth within road corridors
increases surrounding these Centres, with higher densities and taller buildings resulting.
It is also considered more feasible for apartments to be constructed within Centres (vertical mixed
use) that fall within the local and neighbourhood level in the hierarchy, most likely as part of any
redevelopment of such Centres.
Neighbourhood and local centres will continue to service local residential communities, generally
incorporating a mix of services and community facilities serving the daily to weekly needs of the
neighbourhood, and generally anchored by a supermarket or convenience store.
The catchment population of a neighbourhood centres ranges from 1500 - 15,000 people, and the
retail floor space ranges from 2000 - 10,000m2.
The catchment population of a local centre ranges from 200 - 2,000 people and the retail floor
space ranges from 250 - 2000m2.

City of Charles Sturt Residential Growth + Character Study - Report No 4: Form and Character of Potential
Residential Growth
P. 14
2.4.4 Specialist Centres
The 30 Year Plan designates ‘specialist’ centres that contain clusters of key economic and service
activities, including airports, ports, hospitals, universities, and research and business centres that
perform vital economic and employment roles.
The Queen Elizabeth Hospital Precinct falls within this category given its significant employment
base. Excluding allotments within the Residential Character Zone, land within 400 metres of the
Hospital Precinct should be earmarked for growth in the form of low-rise (2-4 storeys)
development at medium densities (eg townhouses, row dwellings and low-rise apartments). It is
also noted that the Hospital Precinct is located close to the Port Road corridor and not far from the
Woodville TOD.
Any retailing space in this specialist centre should relate to the number of workers and visitors in
order to provide daily needs. It is not intended that this area becomes a major shopping precinct
that competes against identified activity centres.
Specia l is t Centres - Indicat ive Extent of Bui ld ing Height
<400m of QEH: low rise 2-4 storeys, medium density

City of Charles Sturt Residential Growth + Character Study - Report No 4: Form and Character of Potential
Residential Growth
P. 15
3 The Character Elements of the Growth Areas
The success of achieving high quality development within the identified growth areas requires
careful consideration of a number of design matters relating to the location, type and form of
development. Adequate consideration of the following matters during Structure Planning, Precinct
Planning and Development Plan Amendment stage will ensure that Development Plan policy,
together with supporting Concept Plans and Structure Plans provide suitable guidance for the
development of the growth areas to their full potential without compromising the amenity of
pedestrians, workers and residents within and surrounding the areas.
3.1 Character Element - Mixture of Land Uses
A mixture of land uses is important in revitalising centres and road corridors (being Port, Torrens
Henley Beach and Grange Roads). Typically, existing centres are dominated by retail land uses,
with some minor commercial activities in support. They rarely comprise solely residential
development as the predominant land use. However there will need to be an element of residential
development along Port, Torrens and Grange Roads that may consist of active commercial ground
floor uses, with residential above.
Within the main road corridors, the historic settlement of land uses has been more ad-hoc over
time and as such there is more of a mixture of land uses, driven by the increased exposure to non-
residential activities by passing traffic along the main thoroughfares. Residential development in
these locations is typically in the form of original housing fronting the main roads (together with
the occasional medium density walk-up flats built in the 1960’s and early 1970’s) scattered
between retail and commercial activities. The true mixture of land uses needs to be improved
through both activity centres and the corridors, largely through a residential led regeneration of
areas.
3.1.1 Benefits of Mixed Land Uses
Mixed use developments have the benefits of increasing the vibrancy of centres by bringing
together a range of activities throughout a larger spread of hours throughout the day and week.
Successful mixed use developments can increase housing, employment, business and investment
choice and represent a more efficient use of land and infrastructure. When integrated with public
transport services mixed use development can reduce car dependency through providing for multi-
purpose trips (ACC, 2008). The provision of housing, typically in forms that differ from other areas,
also provides opportunities to diversify the housing stock within an area and provide for affordable
housing opportunities.

City of Charles Sturt Residential Growth + Character Study - Report No 4: Form and Character of Potential
Residential Growth
P. 16
3.1.2 Best Mixed Land Use Relationships
Getting the right mix of land uses, together with other design issues, is important in achieving
successful mixed use development, as well as healthy places. The ambition of redevelopment of
activity centres and corridors should be that residents can meet most daily needs within walking or
cycling distance to where they live. Successful mixed use developments feature proximity to
economic activity and employment, high amenity areas and key attractors such as retail,
recreation and public transport services. (ACC, 2008).
The variety of land uses within easy walking distances generates high levels of street activity along
building edges and public spaces (Ziebots, 2008). Retail tenancies, particularly in the form of
restaurants, cafés and entertainment facilities have the greatest ability to encourage an active
streetscape and a vibrant atmosphere as hours of operation tend to be longer than those of
commercial uses. For this reason, they should be encouraged at the street level and required to
activate to the street. However, community facilities also play an important part in mixed use
areas as they also assist in spreading the activity over a larger portion of the day, and into
weekends (Thompson, 2009).
There is a need to ensure that these activities, while providing vitality and activity at street level,
do not impact negatively on the amenity of the location as a place to reside. The Adelaide City
Council’s Guide to Mixed Use Development has researched the economic and amenity synergies
between different land uses to determine the best land use relationships. As a guide the following
uses have strong and weak synergies:
Notwithstanding this, consideration needs to be given to the characteristics of each site, the
market , together with appropriate design and construction techniques which can reduce amenity
impacts between land uses.
The preferred format for residential development in mixed use areas would be to locate residential
development above the non-residential uses in central locations, providing passive surveillance to
public spaces and maximising the benefits of accessibility to public transport services. This form of

City of Charles Sturt Residential Growth + Character Study - Report No 4: Form and Character of Potential
Residential Growth
P. 17
development will allow for an increase in diversity in housing stock throughout the Council area,
providing greater housing choice to an increasing numbers of lone and couple only households.
This form of development also provides an ideal opportunity for residential development to be
provided in a variety of sizes to meet the different needs of the community and provide a greater
number of options for people seeking to live in close proximity to services, employment or public
transport services. Reduced land areas and dwelling sizes will also contribute to the provision of
more affordable housing (as well as affordable housing as defined) with access to a range of
facilities and services.
3.2 Character Element - Built Form
The new urban form desired by the 30-Year Plan for Greater Adelaide requires a substantial change
to the built form from what has previously been established within activity centres and along the
road corridors, which have typically been low rise and low density in nature (both retail,
commercial and residential).
A compact urban form, together with mixture of land uses, is important in facilitating a walkable
environment (Cotton, 2008). This is reflective of transit oriented development principles where the
focus on automobile related travel is transformed to more sustainable transport modes such as
public transport, bicycles and walking. A compact, high density urban form also takes advantage of
the accessibility to public transport facilities in these locations, improving the viability for these
services.
3.2.1 Densities
It is envisaged that the highest densities will be established within the TODs, as expected within
the Bowden Village TOD being developed (although this is deemed as an “urban TOD” within the
30-Year Plan warranting higher densities and building heights than expected in other TODs
throughout the metropolitan area). Buildings of up to 12 storeys in height are proposed in the
Bowden Urban Village Master Plan. Peak densities would also be expected within activity centres,
immediately surrounding stations along the transit corridors (train line), and along the road
corridors being Port Road, Torrens Road and Grange Road. Buildings envisaged within these
locations will be of medium rise (up to 5 storeys) with net residential densities of over 70 dwellings
per hectare.
Beyond these immediate locations, densities will need to reduce to lower levels so that there is an
appropriate transition between the growth areas and the established residential form. This is
particularly important within the City of Charles Sturt where there are large numbers of Residential
Character Zones (Historic Conservation Areas) along the rail line and the Port Road, Torrens Road
and eastern section of the Grange Road corridors. Within these locations, built form should
typically be in the form of low rise development (two to three storeys) with dwelling densities of
between 35 and 70 dwellings per hectare. It may be necessary to provide additional policy
guidance (including lower densities) for those areas at the immediate interface between the growth

City of Charles Sturt Residential Growth + Character Study - Report No 4: Form and Character of Potential
Residential Growth
P. 18
areas and Residential Character Areas, which limit dwelling types, forms and height to be more
complimentary to the low density and low rise forms that exist.
To facilitate the increased densities, it is necessary to consolidate development sites so that areas
are large enough to accommodate larger building forms. This will enable a more coordinated form
of development to occur throughout these areas. However, the extent of consolidation should avoid
the creation of “massive” developments that chock entire blocks and threaten the scale and
diversity sought within TODs, activity centres, transit corridors and the road corridors.
3.2.2 Setbacks
It is important that buildings have no or minimal setbacks to public roads and public spaces so that
they frame these spaces as a continuous and cohesive built form edge. Retaining a degree of
human scale is important in maintaining pedestrian comfort and building form should define lower
and higher land use elements through the introduction of a base podium for non-residential land
uses. Residential land uses on the higher levels should be transitioned by stepping the building
back slightly, as well as utilising different materials and finishes. To the sides and rear, buildings
will be stepped in height as required to complement the desire lower built forms within adjacent
areas, as well as appropriately manage the extent of shadowing that may occur, depending on the
orientation of the site.
There should be sufficient setbacks between buildings to provide usable semi-private space as an
outlook for occupants. In particular, adequate separation should be provided between buildings
containing dwellings that face each other, so that outlook and an adequate degree of privacy are
maintained. As such, it will be necessary for the taller elements of buildings comprising residential
development to be stepped inwards to the sides of the buildings as well.
3.2.3 Built Form Design Techniques
Facilitating larger buildings requires additional attention to the building design and form. It will be
necessary to utilising a range of design techniques to break down building massing and bulk.
Attaining an appropriate rhythm in the building design can be achieved through a continuity of
building heights roof lines, proportion and scale of walls and windows. Buildings should accentuate
the vertical rhythm to the street scene through articulation, modulation, variation in materials and
colours and avoidance of large blank walls. This is important in breaking down the length and mass
of buildings.
With comprehensive redevelopment to occur in certain locations, there is an opportunity to
establish a new character through architectural style. There is scope for a range of contemporary
and bold building designs, particularly within landmark locations, which can facilitate the
achievement of an identity to TODs, activity centres and particular corridors. This needs to be
considered in the context of surroundings and may need to be toned down in locations where an
established character is characterised by heritage places, proximity of Residential Character Zones
or other identified residential character areas.

City of Charles Sturt Residential Growth + Character Study - Report No 4: Form and Character of Potential
Residential Growth
P. 19
3.2.4 TOD's
<200 metres
• Amalgamations of allotments to create larger, coordinated development sites
• Medium rise buildings (5 to 10 storeys) located within central locations around train station for
TODs (within 200 metres) at high densities (over 70 dwellings per hectare / max 145m²
average per dwelling site). Dwellings principally in the form of apartments in mixed use
buildings.
• Zero or minimal setback from public roads and public spaces so that these areas are framed
with a cohesive and continuous built form edge.
• Transition between non-residential and residential levels through podium treatment with a
small setback to the residential levels
• Building form broken up through appropriate articulation, modulation variety in materials and
colours
• Buildings separated sufficient distance to provide for meaningful landscaping
• Residential balconies setback at least 10 metres from an opposing residential balcony in
another building
• Balconies incorporated into building design to add visual interest, provide additional separation
from non-residential activities and provide outdoor living space contiguous with internal living
areas.
200-400 metres
• Amalgamations of allotments to create larger, coordinated development sites
• Medium rise buildings (2-4 storeys) at medium densities (35-70 dwellings per hectare / 150-
285m² average per dwelling site). Dwellings principally in the form of apartments in mixed use
buildings, but also with some residential flat buildings, group dwellings and row dwellings.
• Zero or minimal setback from public roads and public spaces so that these areas are framed
with a cohesive and continuous built form edge.
• Building form broken up through appropriate articulation, modulation variety in materials and
colours
• Buildings separated sufficient distance to provide for meaningful landscaping
• Residential balconies setback at least 10 metres from an opposing residential balcony in
another building
• Balconies incorporated into building design to add visual interest and provide outdoor living
space contiguous with internal living areas.
400-800 metres
• Low rise (up to 2 storeys) at medium densities (35-70 dwellings per hectare / 150-285m²
average per dwelling site). Dwellings comprising a mixture of residential flat buildings, group
dwellings, row dwellings, semi-detached dwellings and detached dwellings.
• Reduced front setbacks to maximise use of smaller allotments and frame streets
• Building form broken up through appropriate articulation, modulation variety in materials and
colours
• Side and rear setbacks to accommodate shadowing of adjacent buildings and open space areas
• Reduced site coverage ratio to provide for smaller building footprints

City of Charles Sturt Residential Growth + Character Study - Report No 4: Form and Character of Potential
Residential Growth
P. 20
3.2.5 Transit Corridor Stations
<100 metres
• Medium rise buildings (4 to 5 storeys) located adjacent train stations along Transit Corridors
(within 100m) at high densities (over 70 dwellings per hectare / max 145m² average per
dwelling site). Dwellings principally in the form of apartments in mixed use buildings, but also
with some residential flat buildings, group dwellings and row dwellings.
• Zero or minimal setback from public roads and public spaces so that these areas are framed
with a cohesive and continuous built form edge.
• Transition between non-residential and residential levels through podium treatment with a
small setback to the residential levels
• Building form broken up through appropriate articulation, modulation variety in materials and
colours
• Buildings separated sufficient distance to provide for meaningful landscaping
• Residential balconies setback at least 10 metres from an opposing residential balcony in
another building
• Balconies incorporated into building design to add visual interest, provide additional separation
from non-residential activities and provide outdoor living space contiguous with internal living
areas.
100-200 metres
• Low rise (2-3 storeys) at medium densities (35-70 dwellings per hectare / 150-285m² average
per dwelling site). Dwellings comprising a mixture of residential flat buildings, group dwellings,
row dwellings, semi-detached dwellings and detached dwellings.
• Reduced front setbacks to maximise use of smaller allotments and frame streets
• building form broken up through appropriate articulation, modulation variety in materials and
colours
• Side and rear setbacks to accommodate shadowing of adjacent buildings and open space areas
• Reduced site coverage ratio to provide for smaller building footprints
200-800 metres
• Low rise (up to 2 storeys) at low densities (25-35 dwellings per hectare / 300-400m² average
dwelling site area). Dwellings comprising a mixture of residential flat buildings, group
dwellings, row dwellings, semi-detached dwellings and detached dwellings.
3.2.6 Road Corridors
<60 metres
• Medium rise buildings (4 to 5 storeys) located adjacent road within Road Corridors (<60m) at
high densities (over 70 dwellings per hectare / max 145m² average per dwelling site).
Dwellings principally in the form of apartments within mixed use buildings.
• Amalgamations of allotments to create larger development sites (approximately 40 metres in
width and 60 metres in depth)
• Zero or minimal setback from public roads and public spaces so that these areas are framed
with a cohesive and continuous built form edge.
City of Charles Sturt Residential Growth + Character Study - Report No 4: Form and Character of Potential
Residential Growth
P. 21
• Transition between non-residential and residential levels through podium treatment with a
small setback to the residential levels
• Building form broken up through appropriate articulation, modulation variety in materials and
colours
• Buildings separated sufficient distance to provide for meaningful landscaping
• Residential balconies setback at least 10 metres from an opposing residential balcony in
another building
• Balconies incorporated into building design to add visual interest, provide additional separation
from the main road frontage and provide outdoor living space contiguous with internal living
areas.
60-200 metres
§ Low rise (2-3 storeys) buildings at medium densities (35-70 dwellings per hectare / 150-
285m² average per dwelling site). Dwellings comprising a mixture of residential flat buildings,
group dwellings, row dwellings, semi-detached dwellings and detached dwellings.
§ Reduced front setbacks to maximise use of smaller allotments and frame streets
§ Building form broken up through appropriate articulation, modulation variety in materials and
colours
§ Side and rear setbacks to accommodate shadowing of adjacent buildings and open space
areas
§ Reduced site coverage ratio to provide for smaller building footprints
200-400 metres
• Low rise (up to 2 storeys) at low densities (25-35 dwellings per hectare / 300-400m² average
dwelling site area). Dwellings comprising a mixture of residential flat buildings, group
dwellings, row dwellings, semi-detached dwellings and detached dwellings.
• Reduced front setbacks to maximise use of smaller allotments and frame streets
• Building form broken up through appropriate articulation, modulation variety in materials and
colours
• Side and rear setbacks to accommodate shadowing of adjacent buildings and open space
areas
• Reduced site coverage ratio to provide for smaller building footprints
3.2.7 Activity Centres
<200 metres
• Medium rise buildings (3 to 5 storeys) located centrally within activity centres (within 200
metres) at medium to high densities (35-70+ dwellings per hectare / <150-285m² average
per dwelling site). Dwellings principally in the form of apartments in mixed use buildings, but
also with some residential flat buildings, group dwellings and row dwellings.
• Amalgamations of allotments to create larger development sites (approximately 40 metres in
width and 60 metres in depth)
• Zero or minimal setback from public roads and public spaces so that these areas are framed
with a cohesive and continuous built form edge.
• Transition between non-residential and residential levels through podium treatment with a
small setback to the residential levels

City of Charles Sturt Residential Growth + Character Study - Report No 4: Form and Character of Potential
Residential Growth
P. 22
• Building form broken up through appropriate articulation, modulation variety in materials and
colours
• Buildings separated sufficient distance to provide for meaningful landscaping
• Residential balconies setback at least 10 metres from an opposing residential balcony in
another building
• Balconies incorporated into building design to add visual interest, provide additional separation
from the main road frontage and provide outdoor living space contiguous with internal living
areas.
200-400 metres
• Low rise buildings (2-3 storeys) located centrally within activity centres (within 200 metres) at
low densities (25-35 dwellings per hectare / 300-400m² average per dwelling site). Dwellings
comprising a mixture of residential flat buildings, group dwellings, row dwellings, semi-
detached dwellings and detached dwellings.
• Reduced front setbacks to maximise use of smaller allotments and frame streets
• Building form broken up through appropriate articulation, modulation variety in materials and
colours
• Side and rear setbacks to accommodate shadowing of adjacent buildings and open space
areas
• Reduced site coverage ratio to provide for smaller building footprints
3.3 Character Element - Ease of Movement
The integration of transport infrastructure with the residential growth areas is essential to
achieving the new urban form desired by the 30-Year Plan for Greater Adelaide. Access to
affordable and accessible public transport is a critical factor for many people, particularly the
elderly as it can assist in maintaining independence and gain easy access to key services. Making
movements through our urban environment easier and more efficient also has substantial
economic benefits with improvements in the movement of people and goods reducing running
costs generally.
Transit oriented development has a principal focus on alternative modes of transport to private
vehicles. This requires a move away from the car dominated models of inward focussed, single use,
low rise centres surrounded with large areas of at grade car parking. Access to a frequent reliable
public transport system for the desired centre will, together with reductions in the supply of
parking for employment based (such as office) and residential land uses help strengthen the
attractiveness of public transport. Legible and permeable road and pedestrian networks within
TODs and activity centres will also encourage the attractiveness of walking for short trips instead of
driving. Both walking and cycling will be further facilitated by the development of greenways along
the transit corridors, linking stations, activity centres and TODs.
3.3.1 Parking
Accommodating vehicles is still important in the success of a vibrant mixed use TOD or activity
centre, particularly with regard to convenient shopper parking and drop-off zones adjacent public
City of Charles Sturt Residential Growth + Character Study - Report No 4: Form and Character of Potential
Residential Growth
P. 23
transport stops/stations. At grade parking within streets should be maximised where possible to
provide a buffer between pedestrian movements and passing traffic, as well as providing potential
short-term convenient parking directly in front of businesses.
Notwithstanding this, at-grade parking and the visual impact of large surface parking lots should be
avoided. Rather, parking areas should be located in underground, multi-storey decks or at the rear
of buildings to avoid dominating the urban form and freeing up areas for landscaping and public
spaces for interaction. Within existing centres, it may be possible over time to progressively
redevelop the at-grade car park areas with buildings that add to the mix of activities occurring in
the centre, converting aisles to pedestrian paths catering for pedestrian activity rather than vehicle
movements.
The provision of bicycle parking facilities is important in encouraging this form of transport within
and around the growth areas. It is important that sufficient levels of bicycle parking are provided in
safe and convenient locations within and adjacent to buildings to which they are associated or in a
central location for multi-building developments. Facilities should be secure and accompanied by
facilities that encourage usage, such as lockers and showers.
Improved pedestrian and bicycle activity, together with improved access to public transport
warrants some degree of relaxation on car parking provision for development within the TODs and
stations along transit corridors. This may also be the case for those activity centres and road
corridors with excellent levels of public transport service.
Access to development needs to be consolidated as much as possible, facilitate by shared parking
areas between developments and land uses. Key access points need to be located away from key
pedestrian movement paths, ideally to the sides and rear of developments to that valuable street
level activation is not sacrificed. Within residential areas, the same principles apply, although to
prevent negative impacts on vehicle garaging and driveways to streetscapes and on-street parking.
The consolidation of sites and coordination of development will facilitate the provision of rear
loaded developments, maximising building frontage and presentations to the street and improving
the streetscape.
The increased importance of pedestrian movement and networks within activity centres and road
corridors requires more careful management of possible conflicts between pedestrian and vehicle
activities, particularly in regard to servicing areas for the larger scale retail and commercial
tenancies. It is important that the location of these service areas do not compromise pedestrian
safety or the quality of the streetscape activation through the creation of large areas of blank
walls. Servicing areas will need to be located away from street frontages and designed to minimise
the conflict with pedestrian activity and residential amenity.
3.3.2 TODs, Activity Centres, Road Corridors (<60m) and Transit corridor Stations (<100m)
• Integration of public transport stops within key development areas of TODs and centrally
located and connected within Activity Centres
• Pedestrian and cycle paths connect key attractor land uses and have primacy over vehicle
manoeuvring areas

City of Charles Sturt Residential Growth + Character Study - Report No 4: Form and Character of Potential
Residential Growth
P. 24
• Excellent facilities at public transport stops (including shelter, lighting, seating and
landscaping)
• Inclusion of bicycle parking requirements and facilities within developments
• Reduced parking requirements for development
• Minimise at grade parking within developments
• Underground or multi-deck parking encouraged
• Consolidation of access points
• Service areas are located away from pedestrian routes
3.3.3 Road Corridors (60-200 metres), Transit corridors (100-200 metres)
• Reduced parking requirement for residential development
• Consolidation of access points
• Rear loading of consolidated dwellings sites to reduce visual impact on streetscape
• Provision of bicycle storage facilities for residential flat buildings and other coordinated
developments involving numerous dwellings on one site
3.4 Character Element - High Quality Public Realm
The public realm, be it in the form of an open space, plaza, footpath or shared use area, plays a
critical role in ensuring an active and vibrant activity centre. Ideally, the public realm should
facilitate a range of functions and activities, catering for a wide variety of users and times of the
day.
3.4.1 Safety
Increasing safety, particularly outside of retail and office hours is another aim and challenge of
revitalising activity centres and road corridors. The mixture of land uses will assist in drawing
activity in the area across a broader range of operating hours, however, this will be limited in
success if the public realm is not perceived to be comfortable or safe at night.
Safety is increased with activity and the presence of people, highlighting the importance of
activation of building frontages adjacent public spaces, pedestrian routes, train stations and bus
stops. Land uses that have high interactivity with pedestrians should be located in key positions,
particularly where they extend the nature of activity beyond normal business hours.
The form of buildings should be utilised to frame public spaces and streetscapes so that they
provide passive surveillance over these spaces which, together with activity, appropriate lighting
and clear sight lines, contribute to creating a safer environment.

City of Charles Sturt Residential Growth + Character Study - Report No 4: Form and Character of Potential
Residential Growth
P. 25
3.4.2 Comfort and Sociability
Use of public areas will also require the provision of comfortable areas for pedestrians to walk,
shop, socialise and relax. The form of buildings and street furniture play an important part in
providing this comfort, particularly for all year weather protection. Canopies should be encouraged
along street frontages to provide a continuous cover for pedestrians from rain and summer sun.
The height and setback of taller elements of buildings can impact on access to daylight along
certain sections of footpath. Taller buildings can also impact on wind flows, creating tunnelling
effects which reduce comfort levels on footpaths, discouraging people to sit or stay. It is important
that building forms also take into account the potential shadowing and wind impacts on
surrounding areas. Street furniture such as seats and water fountains, as well as trees for shade
encourage people to stay and provide opportunities for people to rest.
3.4.3 Landscaping
Landscaping across the entire activity centre is important in providing an attractive and unified
identity to the centre as well as softening the hard edges created by built form. As the desire is for
a compact urban form, with reduced setbacks, opportunities for additional landscaping can be
limited. This places greater importance on creating boulevards, laneways and malls with high
quality landscaping finishes, particularly street trees, linked with water sensitive urban design
techniques for irrigation. Development should take advantage of existing site features with regard
to landscaping elements, such as mature trees and watercourses.
An improvement to the streetscape treatments within growth areas is particularly important along
the Road corridors, where much of the public realm is adjacent busy multi lane roads. These
corridors already incorporate mature vegetation, however, improvements will need to make this
harsh environment more welcoming for pedestrians.
3.4.4 TODs, Activity Centres, Road Corridors (<60 metres) and Transit Corridor stations (<100 metres)
• Forced activation of street level building frontages, particularly at key locations, through
fenestration (clear), door openings, outdoor dining and other activities that promote
interactivity.
• Provision of pedestrian comfort by protecting from elements such as wind, sun and rain
through the provision of canopies, trees and appropriate building designs
• Maintain a degree of human scale through retaining openness to sky and access to daylight
through stepping of taller elements centrally within sites behind base podiums
• Maintain safety through activation, clear sight lines, preventing entrapment spots and
appropriate levels of lighting, together with passive surveillance through building design and
siting
• Provide amenities to encourage people to rest, meet and socialise including public seating,
public art, drink fountains, landscaped areas and a range of open spaces
• Improve landscaping within the public realm (including streetscape) to create attractive
boulevards and add identity to activity centres or specific locations

City of Charles Sturt Residential Growth + Character Study - Report No 4: Form and Character of Potential
Residential Growth
P. 26
3.5 Character Element - Residential Amenity
The quality of accommodation within residential growth areas is important to ensure an adequate
level of amenity is provided to occupants. Dwellings within multi-storey buildings can present some
design challenges, however this should not equate to reductions in adaptability, thermal comfort
and outlook to its occupants.
3.5.1 Sunlight and Ventilation
Both access to natural sunlight and natural ventilation assist with maintaining a reasonable degree
of thermal comfort without reliance on mechanical systems. Use of borrowed light may be
appropriate in limited circumstances, however should not be relied upon for achieving access to
sunlight, particularly for living areas of dwellings (use of light wells should be avoided). Dwelling
layouts should enable for the free flow of air ideally by achieving cross ventilation, or through an
open floor plan layout.
3.5.2 Views
The increased height of buildings within growth areas provides opportunities to take advantage of
views. However, this will not be possible for all dwellings and consideration needs to be given to
appropriate outlooks from living areas of dwellings. This is not only important to providing an
interesting view, but also in ensuring an adequate level of privacy. Separation between dwellings
that face each other needs to be maintained so that a reasonable degree of privacy is maintained,
particularly when living rooms face each other.
3.5.3 Outdoor Living Areas
The improvements in vitality and activity within the public realm provide an alternative recreation
and entertainment forum for occupants of dwellings within the core areas of the growth corridors.
This, coupled with the desire for more compact urban form, facilitates the reduction in the extent
of open space area provided per dwelling within multi-storey buildings where they are largely in
the form of balconies. There are however opportunities for communal roof top gardens or other
communal facilities such as swimming pools and gymnasiums which assist in encouraging
community interaction and recreation.
3.5.4 Interface
Given the number and mixture of uses desired within TODs, activity centres and Road Corridors,
the management of the interface between these uses is important, not only to provide a suitable
level of amenity for sensitive uses, such as residential development, but also to secure the more
intensive activities that are likely to have noise, odour or traffic impacts. Many of these issues can
be appropriately managed through the careful placement and design of development itself. Likely
interface issues will be in the form of noise from these sources, together with odour and air quality

City of Charles Sturt Residential Growth + Character Study - Report No 4: Form and Character of Potential
Residential Growth
P. 27
from nearby industry or traffic (it is noted that the switch to an electric rail system will improve air
quality and noise issues associated with the rail line).
3.5.5 Multi Storey Buildings
• Reduced private open space requirements
• Encouragement of communal open space facilities such as a community/complex garden
• Ensure adequate natural light within living areas by avoiding over reliance on borrowed light or
light wells
• Provide for natural ventilation through cross ventilation or open plan design which facilitate
airflow
• Maximise views out over public spaces and other attractive features of a site or locality
• Maintain sufficient setbacks between residential components of two buildings (no less than 10
metres to maintain outlook and privacy
• Ensure appropriate design treatments to prevent sound transfer between dwellings and
entry/foyer areas internally within building
• Ensure building treatments are suitable to the anticipated noise from desired activities within
the growth corridor (land uses and traffic)
• Ensure non-residential land uses within mixed use buildings are provided with adequate
servicing risers to prevent extraction of odours to dwellings above

City of Charles Sturt Residential Growth + Character Study - Report No 4: Form and Character of Potential
Residential Growth
P. 28
4 Visualising Increased Growth
Increased built form growth may relate to both density as well as height. Typically, people perceive
increased density to equate to "high rise". There are clearly many built form alternatives that are
not necessarily high rise buildings. There are strong and increasingly mobilised community
perceptions about these sorts of issues which are related to increased growth.
4.1 Resident Focus Group Research
The City of Charles Sturt engaged a consultant to gather information from a cross section of the
community, seeking people’s views on increasing residential densities with a focus on growth
corridors and Transit Oriented Development (TOD) areas (Harrison Research, 2010). The
information gathered from the focus groups has informed this Residential Growth Strategy and
Character Study.
The methodology selected was to conduct 8 group discussions, of 2 hours duration each, across
different locations within the City of Charles Sturt but particularly focused on areas which have
been identified as potential areas for redevelopment to higher density.
The groups comprised residents randomly selected (except where identified) from within the
immediate catchment area surrounding the transit corridor, as follows:
§ Findon Library – residents within the Grange Railway Corridor catchment area.
§ Hindmarsh Library – residents from the catchment area surrounding the Brompton / Croydon
Corridors.
§ Findon Library – residents from the catchment area surrounding the Grange Road Corridor.
§ Civic Centre, Woodville – participants were invited to send two representatives from each of the
known Residents’ Interest Groups. A total of 22 were invited, although only 12 representatives
attended the discussion.
§ Woodville North Community Hall – residents from the catchment area surrounding the Kilkenny /
Arndale TOD’s.
§ West Lakes Library – residents from the catchment area surrounding the West Lakes Corridor.
§ Henley Beach Library – random selection of residents living within the catchment area around the
Henley Beach Road Corridor.
§ Civic Centre, Woodville – residents from other residential areas, not immediately impacted by
living within one of the proposed corridors and TOD’s, but live near to them and are likely to
access services or egress along these corridors. The research identified some common themes regarding positive and negative perceptions about
increased residential growth and TOD's.

City of Charles Sturt Residential Growth + Character Study - Report No 4: Form and Character of Potential
Residential Growth
P. 29
4.1.1 Positives
There was a high level of loyalty and pride associated with living in the Western suburbs. Across
all groups, the valued attributes of the western suburbs which residents wish to retain and enhance
were:
§ Proximity to city and sea
§ Character and history of the area
§ Good public transport system – in particular the railway line is highly valued, but there was a
perception that public transport lacks interconnectivity across suburbs
§ Open spaces, trees and green areas
§ Easy access to a wide range of services and social infrastructure
§ Cultural and demographic diversity
Positive aspects of the TOD concept were as follows:
§ The proposed extension of the light rail line to West Lakes was identified as being a valuable
asset.
§ The potential for the growth strategy to ensure that their children could be living nearby once
they become independent rather than having to move further out in the outer suburbs or
interstate.
§ Linking of open spaces to interconnect areas was perceived as a positive outcome of the TOD
concept, encouraging both reduced reliance on motor vehicles and more physical activity
§ Residents involved in the group discussions were pleased to have been involved and wished to
continue to be kept informed (at the least) as the Strategy develops
§ Residents revealed a strong interest in how their area develops into the future and a varying
level of understanding about a range of social and environmental issues and concerns
surrounding the concept of higher density development.
4.1.2 Negatives
Residents expressed common concerns across the group discussions about higher density (in
particular focused on infill through sub-division of properties). They key issues raised were:
§ Retaining the existing character of the areas, not just in terms of the specific character zones but
also other “character” built form outside of those zones, was of paramount concern to many
residents.
§ Open spaces were perceived as either less usable than in the past due to loss, or partial loss, of larger open spaces which left small and unlinked open space. And also that the allocation of
open space in some areas, such as in Cheltenham, Woodville and in the catchment surrounding
Grange Road, was very low and fragmented into small, pocket parks.

City of Charles Sturt Residential Growth + Character Study - Report No 4: Form and Character of Potential
Residential Growth
P. 30
§ Many residents across the Western suburbs felt that much of the contemporary built form of 1 or
2 storey, detached houses, large enough to take up most of the land do not fit within the
character of the area and therefore detract from the whole.
§ Along the same lines as concerns regarding contemporary design, were issues surrounding the
trend towards smaller housing blocks with large built form and little allocation for outdoor areas.
§ Residents felt that TOD’s would impact negatively on vehicle traffic, which they perceived would
be congested, perhaps forced into back streets and residents would have to park long distances
from home.
§ There were concerns raised with regard to future water proofing, stormwater catchment, supplies
and replenishing the aquifer.
§ The majority of participants across all areas perceived that energy consumption of higher density
dwellings was considerably higher than single storey houses.
§ There was limited support for eco-friendly developments, with local examples such as Lochiel
Park and Christie Walk being mentioned only among the representatives of the residents’ interest
groups.
§ Almost all participants saw themselves as still living in the same house in the same area in ten
years time, regardless of whether participants were currently in the older age groups, middle or
mature families or young and unattached.
§ It was believed that the type of accommodation would mean it was relatively expensive for many
older residents and, therefore, they would not be able to buy back into the community they are
familiar with.
§ The other commonly raised barrier which was thought likely to influence potential older buyers of
higher density, low maintenance living was the number of storeys and the fact that stairs in a 3
or 4 storey building would detract from the ability to attract older purchasers.
§ There was very limited knowledge about the TOD concept and its implications and even less was
known about the Greater Adelaide 30 Year Plan.
These findings highlight that a major public education and consultation programme will be
required over a long period of time before the South Australian communities begin to better
understand, and start to more fully embrace, increased residential densities.
Case studies and highly visual examples that illustrate great design and energetic, vibrant and
sustainable living areas is an important part of this process.
The following illustrations may be helpful to this process.

City of Charles Sturt Residential Growth + Character Study - Report No 4: Form and Character of Potential
Residential Growth
P. 31
4.2 Visualising Higher Densities along Corridors
Current
Potential
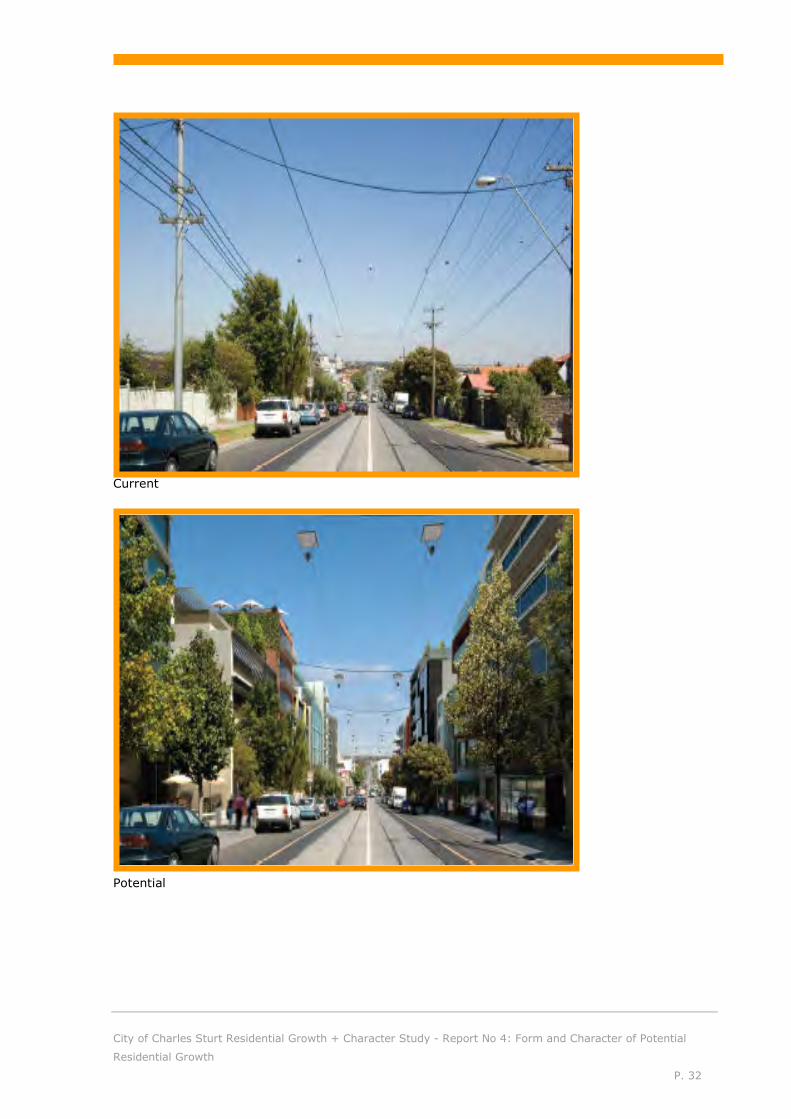
City of Charles Sturt Residential Growth + Character Study - Report No 4: Form and Character of Potential
Residential Growth
P. 32
Current
Potential

City of Charles Sturt Residential Growth + Character Study - Report No 4: Form and Character of Potential
Residential Growth
P. 33
Current
Potential
Images above courtesy of City of Melbourne and Victorian Department
of Transport, 2009

City of Charles Sturt Residential Growth + Character Study - Report No 4: Form and Character of Potential
Residential Growth
P. 34

City of Charles Sturt Residential Growth + Character Study - Report No 4: Form and Character of Potential
Residential Growth
P. 35
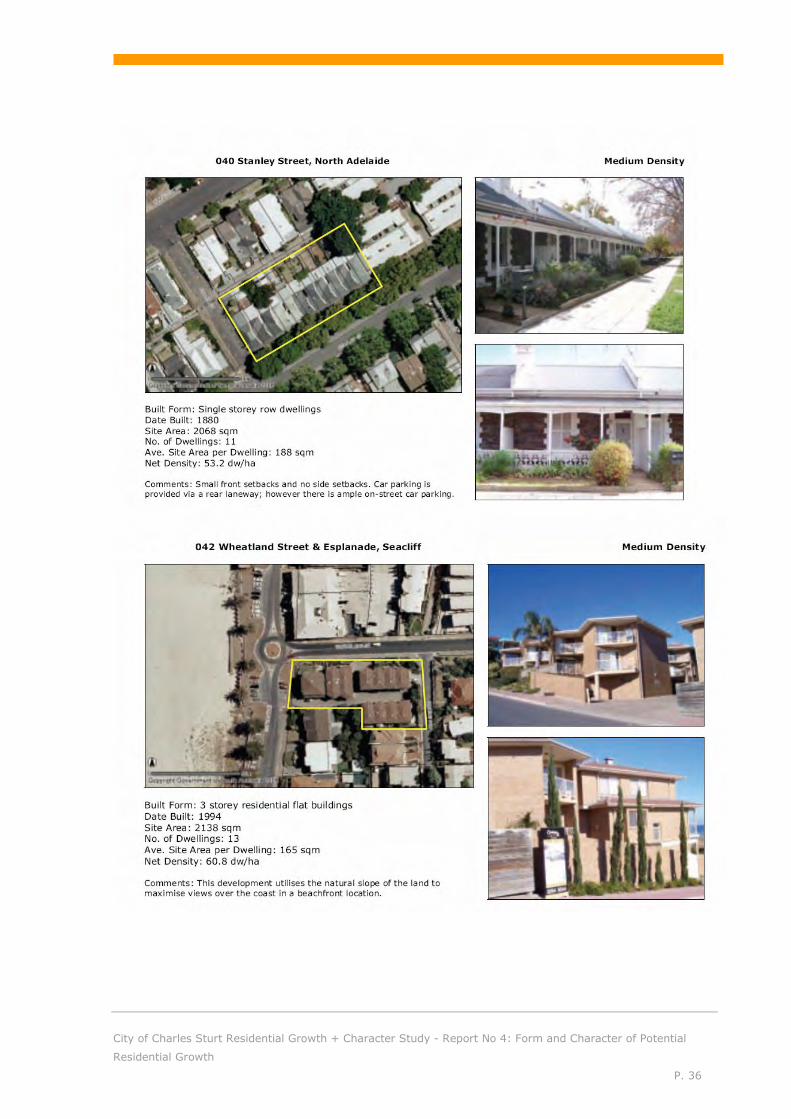
City of Charles Sturt Residential Growth + Character Study - Report No 4: Form and Character of Potential
Residential Growth
P. 36
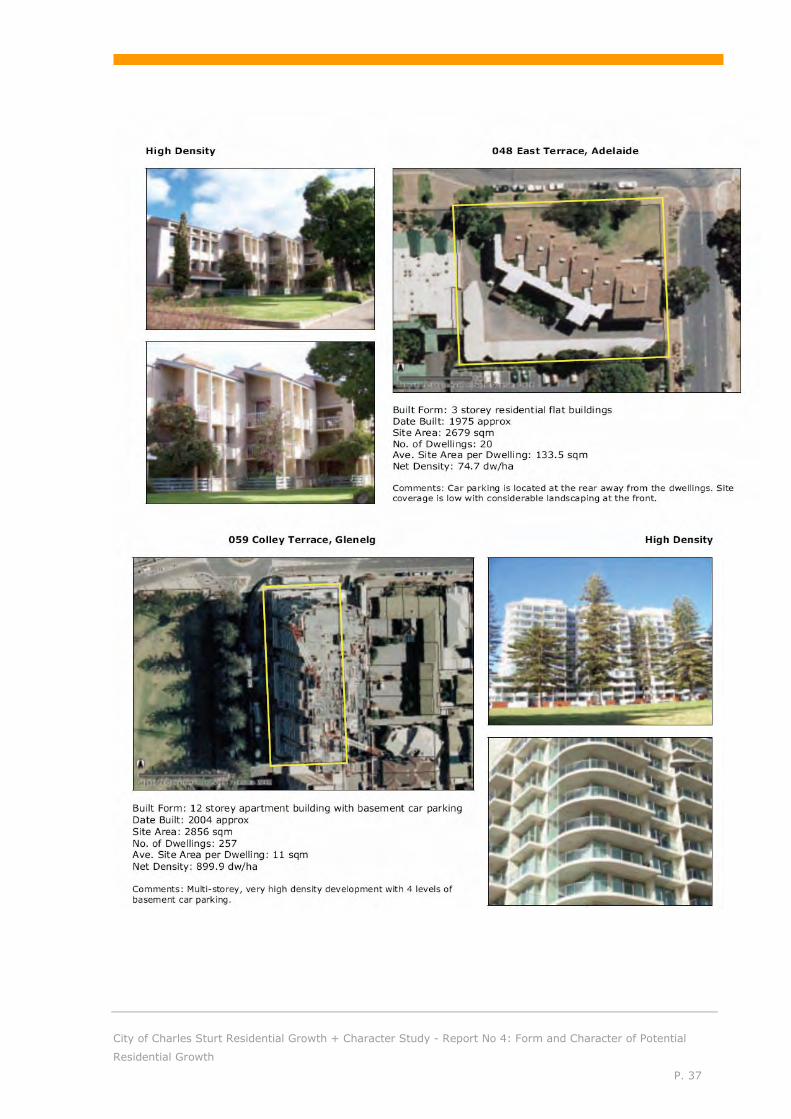
City of Charles Sturt Residential Growth + Character Study - Report No 4: Form and Character of Potential
Residential Growth
P. 37

City of Charles Sturt Residential Growth + Character Study - Report No 4: Form and Character of Potential
Residential Growth
P. 38
5 Determining Priorities for Growth
As identified in this report, there are many areas that have potential to accommodate increased
growth. Some areas will contribute more significantly to meeting the Greater Adelaide 30 Year Plan
growth targets (eg: around Activity Centres, TOD's and Major Transit Corridors) than other areas
(eg: haphazard and small scale infill scattered throughout the suburbs).
The growth priorities will be primarily determined by:
1. The 30-Year Plan for Greater Adelaide (which has already identified and commenced work on
Bowden Village, and Woodville Village)
2. Government commitment towards infrastructure initiatives (including DTEI's rail electrification
initiative, and Housing SA's initiatives such as Woodville West)
3. Inner Metropolitan Rim Structure Plan, DPLG
4. Planned private investment that is already known by Council
5. Infrastructure capacity and costings
6. Land size and/or ability to amalgamate sites
5.1 General Work Programme
The general work programme associated with each growth "area" is suggested to be as follows:
5.1.1 Development Plan Amendments
DPA's will be undertaken for corridor and major growth area. The recommended DPA's are in order
of priority:
DPAs Current
§ Woodville West Neighbourhood Renewal (Ministerial) DPA – Housing SA Area adjacent to the Albert Park Railway Station
§ Bowden Urban Village (Ministerial) DPA – Former Clipsal and Origin Energy sites
§ Woodville Village and Environs DPA – Woodville Road, Woodville
§ Devon Park Residential DPA – rezoning industrial site corner Exeter Terrace and Alexander Avenue, Devon Park. Identified in the Charles Sturt Industrial Land Study 2008 as being appropriate for an alternative use.
Short term priority DPAs, Structure and Precinct Plans (1 to 3 years)
§ Inner West Structure and Precinct Plan and DPA – Bowden, Brompton, Hindmarsh area. Includes the Bowden Urban Village study area excluding the area rezoned by the Bowden Urban Village Ministerial DPA.
§ Woodville TOD (Ministerial) DPA, LMC site adjacent Woodville Station
West Lakes and Grange Railway Line Precinct
§ AAMI Stadium and SANFL Land (Ministerial) DPA
§ West Lakes Precinct Structure and Precinct Plan and DPA – investigate the rezoning potential of the land along the light rail corridor adjacent to the SANFL land.

City of Charles Sturt Residential Growth + Character Study - Report No 4: Form and Character of Potential
Residential Growth
P. 39
§ Grange Railway line Corridor Structure and Precinct Plan and DPA
§ Seaton TOD Structure and Precinct Plan and DPA
Henley Precinct
§ Henley Precinct Master Plan, Structure and Precinct Plan and DPA
§ Henley Beach Road Corridor Structure and Precinct Plan and DPA
Medium term priority DPAs and Master Plans (4 to 10 years)
Outer Harbor Line Precinct
§ Kilkenny TOD Structure and Precinct Plan and DPA
§ Arndale Activity Centre Structure and Precinct Plan and DPA
§ Port Road and Torrens Road Corridors Structure and Precinct Plan and DPA
§ Grange Road Corridor Structure and Precinct Plan and DPA
Long term priority DPAs and Master Plans (11+ years)
§ Fulham Gardens Activity Centre Structure and Precinct Plan and DPA
§ SA Water Site West Lakes – Rezone from Special Uses to Residential. Identified in the Housing and Employment Land Study 2010.
DPA's will be informed by Design Guideline recommendations, Development Plan Policy
recommendations and DPLG Structure Plans/Precinct Plans.
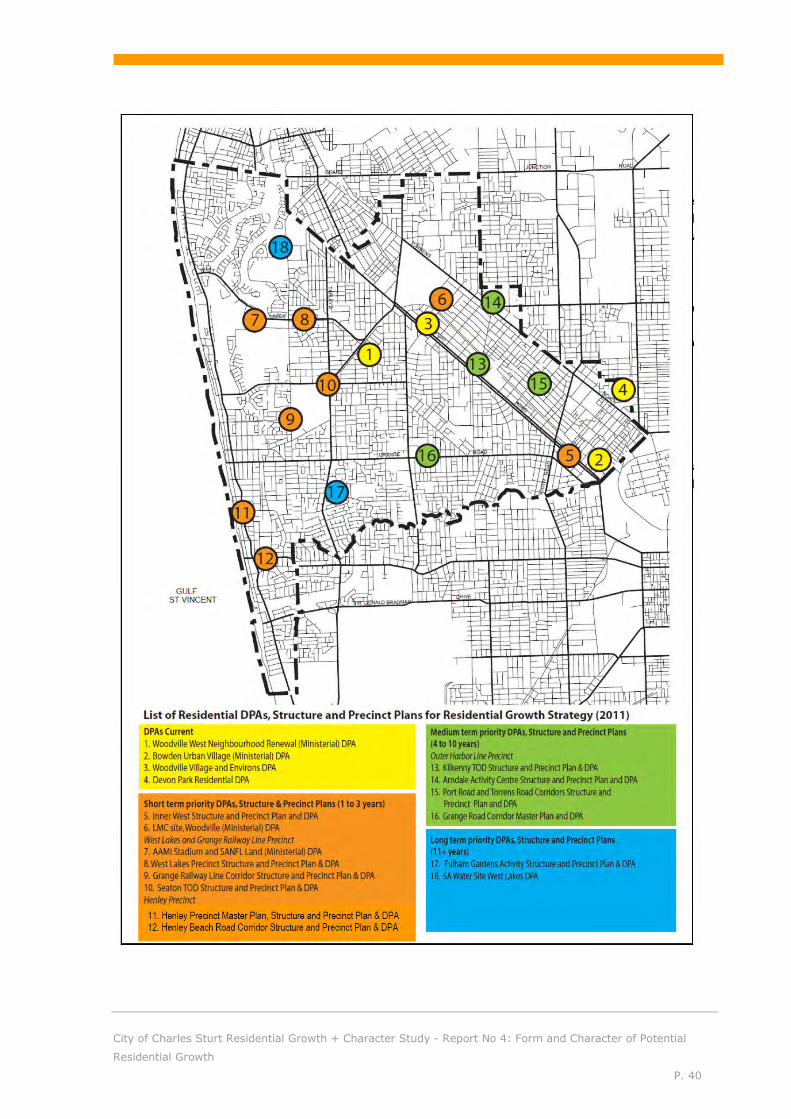
City of Charles Sturt Residential Growth + Character Study - Report No 4: Form and Character of Potential
Residential Growth
P. 40
City of Charles Sturt Residential Growth + Character Study - Report No 4: Form and Character of Potential
Residential Growth
P. 41
5.1.2 Design Guidelines and Development Plan Policy
Design Guidelines that build on the character statements detailed in this report for the corridors
and major growth areas have been provided in Report 5 - Development Plan Policy Analysis for
Growth Areas.
Recommendations for policy content and zoning boundaries are also detailed in Report 5 -
Development Plan Policy Analysis for Growth Areas.
It should also be noted that DPLG has recently prepared a suite of guidelines relating to form and
density of residential development in the key growth areas. These include guidelines relating to
Urban Core Zones which will be established to provide a flexible policy framework for master
planned precincts around high order tram and train stations. This zone will be divided into various
areas (e.g. Core and Transition) with differing density and height provisions.
These provisions will also inform future DPA's around TOD's, activity areas and other nominated
residential growth areas.
5.1.3 Structure Plans and Precinct Plans
The 30-Year Plan for Greater Adelaide identifies that Structure Plans for corridors and other major
growth areas should be developed. These will identify desired land uses, development outcomes,
complying developments and design principles. They will be undertaken collaboratively between
DPLG and local government.
This report has been prepared by:
Jensen Planning + Design
Cit y of Charles St urtCit y of Charles St urtCit y of Charles St urtCit y of Charles St urt
RRRResident ial esident ial esident ial esident ial GGGGrowt hrowt hrowt hrowt h ++++ C C C Charact er haract er haract er haract er SSSSt udyt udyt udyt udy
Report 5 Development Plan Policy
Analysis for Growth Areas May 2011

Table of Contents
1 Executive Summary.................................. ............................. 1
2 Policy Issues...................................... .................................. 2
2.1 Areas within Targeted Residential Growth Areas.............................................................. 2 2.1.1 Clipsal Site and Environs ...................................................................................... 2 2.1.2 Kilkenny Station Environs..................................................................................... 3 2.1.3 Railway and Port Road Corridor (Bowden to Cheltenham)......................................... 3 2.1.4 Hanson Road, Athol Park...................................................................................... 4 2.1.5 Cheltenham / Sheridan Sites and Woodville Station Environs .................................... 4 2.1.6 Albert Park Station Environs / Woodville West Housing SA Land ................................ 5 2.1.7 West Lakes and Seaton........................................................................................ 6 2.1.8 Seaton Park Station Environs................................................................................ 6 2.1.9 Grange Road Corridor and Findon Shopping Centre Environs .................................... 7
2.2 Areas Outside Targeted Growth Areas............................................................................ 8
3 Policy Recommendations ..................................................... 10
3.1 Zone Boundaries for Targeted Residential Growth Areas................................................. 10 3.1.1 Assumptions Made Influencing Recommended Zone Boundaries.............................. 10 3.1.2 Zone Names ..................................................................................................... 11
3.2 Residential Design Policy Coverage.............................................................................. 32 3.2.1 Parking ............................................................................................................ 33 3.2.2 Open Space...................................................................................................... 33 3.2.3 Aircraft ............................................................................................................ 33 3.2.4 Interface .......................................................................................................... 34 3.2.5 Sustainability.................................................................................................... 34 3.2.6 Dwelling Sites in Residential Character Zones with Historic Conservation Area Overlay34 3.2.7 Fencing............................................................................................................ 36 3.2.8 Hammerhead Development ................................................................................ 36 3.2.9 Multi Storey Apartments..................................................................................... 37 3.2.10 Affordable Housing....................................................................................... 37 3.2.11 Walking and Cycling ..................................................................................... 38 3.2.12 WSUD......................................................................................................... 38 3.2.13 Coastal Development.................................................................................... 38 3.2.14 Flooding...................................................................................................... 39

City of Charles Sturt Residential Growth + Character Study - Report No 5: Development Plan Policy Analysis
P. 1
1 Executive Summary
This report is the fifth report prepared for the Residential Growth and Character Study. This Study
has been undertaken by Jensen Planning + Design for the City of Charles Sturt. The study
examines future residential growth and character issues across the City of Charles Sturt.
This report:
§ describes the assessment of current policy for the targeted residential growth areas based
on a desktop analysis and workshop with development assessment and policy staff.
§ identifies proposed residential design policy applicable to the targeted residential
growth areas that will inform a series of forthcoming Residential DPAs
§ contains the proposed zoning changes around the targeted growth areas and describes the
assumptions and justification for this approach
§ describes potential policy approaches for the areas located outside the targeted
residential growth areas
§ builds upon the previous research undertaken and documented in previous reports.
The first report prepared for this project - the Strategic Context Report, analyses population
trends and policy approaches within the State Government and the City of Charles Sturt.
The second report - Opportunities and Constraints, examines potential opportunities and
constraints for future residential growth in the City of Charles Sturt. It summarises future
population and housing projections specific to Charles Sturt based on a range of population
scenarios. It also summarises major environmental, infrastructure and other constraints to
achieving future housing growth, and examines how many additional dwellings will be required in
the City of Charles Sturt to 2031 to meet the 30 Year-Plan for Greater Adelaide Growth targets.
The third report - Future Social Infrastructure Requirements, provides a broad overview of the
context and supply requirements of future social infrastructure needs across Charles Sturt.
The fourth report – Form and Character of Potential Growth Opportunities, provides
recommendations about the future character, form and extent of primarily residential growth in
areas that have been identified as having potential for increased residential density in the City of
Charles Sturt.
The sixth report - Review of Certain Historic Conservation Areas, reviews the zone boundaries and
policies for a number of existing Residential Historic Conservation Areas. It identifies opportunities
for the refinement of the zone boundaries.

City of Charles Sturt Residential Growth + Character Study - Report No 5: Development Plan Policy Analysis
P. 2
2 Policy Issues
2.1 Areas within Targeted Residential Growth Areas
As outlined in Section 7 of Report 2, in order to achieve the residential targets outlined in the 30
Year Plan for Greater Adelaide, a significant proportion of the expected future residential growth
within the Council area will occur in targeted growth areas (e.g. corridors, TODs and other infill
sites). These sites have been identified in detail in the previous report Character and Form of
Potential Growth Opportunities.
An analysis of zoning issues relating primarily to the existing zoning for these sites follows. The
analysis is based on the zoning found in the existing Charles Sturt Council Development Plan. The
analysis highlights where policies for particular areas that have been identified as having future
residential growth opportunities may require a re-evaluation if residential intensification strategies
are to be pursued.
Other work informing policy issues in targeted residential growth areas
It should be noted that the new suite of DPLG BDP modules relating to nominated growth areas will
be a key influence on the direction of policy relating to these areas. These modules were released
after the development of this Residential Growth Strategy, therefore they have not been
considered in detail.
Additionally, separate to this Residential Growth Strategy research, the City of Charles Sturt has
undertaken a range of studies and concept plans specifically relating to some of the targeted
residential growth areas. These should also inform further policy development for the residential
growth areas. These studies include the Woodville Village Master Plan, Seaton and Kilkenny TOD
Scoping Study and Woodville West Neighbourhood Renewal Master Plan.
2.1.1 Clipsal Site and Environs
The Clipsal site and Origin site (north of the railway corridor) and surrounding land (south of the
railway corridor and north of Port Road) are currently contained within the Industry Zone and
District Centre Zone - Policy Area 2 (Hindmarsh). The area is also affected by the Airport Building
Height limitations - Zone D (structures should not exceed 45 metres above existing ground level).
Any comprehensive residential development project within this area would require wide-scale
changes to the Development Plan, with particular attention to the Industry Zone. While residential
development is anticipated within the District Centre Zone, a 3 storey limit currently applies.
This area is currently being reviewed as part of a Ministerial DPA process.
City of Charles Sturt Residential Growth + Character Study - Report No 5: Development Plan Policy Analysis
P. 3
2.1.2 Kilkenny Station Environs
An 800 metre radius of the Kilkenny Station includes land contained within the Industry Zone,
Mixed Use Zone (either side of Kilkenny Terrace), Residential Character Zone and Residential Zone
- Policy Area 16 (Mid Suburban). The area is also affected by the Airport Building Height
limitations - Zone D (45 metre height limit) and Zone E (100 metre height limit).
Again, changes to policies within the station catchment would be required to encourage residential
redevelopment with particular attention to parts of the Industry Zone.
The current Residential Zone - Policy Area 16 provisions allow low-medium density forms of
residential development (i.e. 250 - 400 square metre site areas for attached and attached housing
forms), which would also necessitate a review if it was intended to encourage residential
intensification. Similarly, the Residential Character Zone provisions allow low-medium density
housing at slightly lower densities (i.e. 350 - 450 square metre site area requirements). However,
as discussed elsewhere, the review of the heritage character of this area concluded that it is still
intact and that it warranted ongoing protection. A strategy to encourage residential intensification
of the southern parts of the Kilkenny Character Area would be at the expense of maintaining this
historic character.
A scoping study for the Kilkenny and Seaton Park TODs has been undertaken.
2.1.3 Railway and Port Road Corridor (Bowden to Cheltenham)
This vast area (defined for the purpose of this analysis as 800 metres either side of Port Road and
an 800m radius surrounding stations on the rail line) includes land contained within the following
Zones/Policy Areas (with estimated proportions):
Zone Policy Area Estimated
Proportions
Industry Zone 20%
District Centre Zone Hindmarsh PA 2
Woodville PA 5
10%
Residential Character Zone 35%
Residential Zone Inner Suburban PA 15
Mid Suburban PA 16
Integrated Medium Density PA 20
20%
Mixed Use Zone 5%
Neighbourhood Centre Zone Welland PA 14 <5%
Local Centre Zone <5%
Parts of the area are also affected by the Airport Building Height limitations - Zones C (15 metre
height limit), D (45 metre height limit) and E (100 metre height limit).

City of Charles Sturt Residential Growth + Character Study - Report No 5: Development Plan Policy Analysis
P. 4
Any residential intensification strategy within this corridor would need to consider the following
possible policy changes and issues:
§ Whether any of the existing Industry Zone areas are underutilised and would warrant
rezoning to accommodate residential redevelopment (Note: this could only occur in
accordance with the assessment framework contained within the Metropolitan Adelaide
Industrial Land Strategy (2007) and the City of Charles Sturt Industrial Land Study 2008);
§ The current Residential Zone - Policy Areas 15 and 16 provisions allow low-medium
density residential development forms (albeit at slightly different densities). This will
require further evaluation if higher residential densities are to be encouraged;
§ In contrast, the Residential Zone - Policy Area 20 does not prescribe maximum site areas
and effectively encourages a wide range of dwelling types at 'medium to high densities'.
However, the Desired Character Statement does encourage two storey development, with
"three storey buildings appropriate in the middle of the policy area", suggesting the need
for amended policy to provide for taller buildings;
§ As discussed above, the Residential Character Zone density provisions would impose
limitations on residential intensification objectives for parts of this area. The analysis of
some Historic Conservation Areas (reported elsewhere) suggested that there may be some
justification in reconsidering the Historic Conservation Area designation of the Brompton
Park area, which lies within this corridor.
2.1.4 Hanson Road, Athol Park
This area is mostly contained within the Residential Zone - Policy Areas 16 (Mid suburban) and 20
(Integrated Medium Density). The area is also affected by the Airport Building Height limitations -
Zone E (100 metres height limit).
The Residential Zone - Policy Area 20 (Integrated Medium Density) parts of this area correspond to
concentrations of Housing SA properties. As mentioned, the current policies are encouraging of
residential redevelopment at "medium to high densities". The remaining areas are contained
within Policy Area 16 (Mid Suburban), which imposes density/site area limits of between 250 and
400 square metres per dwelling (for detached and attached housing forms). This will warrant a re-
evaluation if higher residential densities are anticipated.
2.1.5 Cheltenham / Sheridan Sites and Woodville Station Environs
The former Cheltenham Racecourse and Sheridan sites are contained within the Residential Zone -
Policy Areas 22 (Cheltenham Park) and 21 (Woodville Medium Density). Woodville Road (within a
400 metre radius of the Woodville Railway Station) is mostly contained within the District Centre
Zone - Policy Area 5 (Woodville); Residential Zone - Policy Area 16 (Mid Suburban); and the
Residential Character Zone. The area is also affected by the Airport Building Height limitations -
Zone E (100 metre height limit).
City of Charles Sturt Residential Growth + Character Study - Report No 5: Development Plan Policy Analysis
P. 5
Both the former Sheridan/Actil and Cheltenham Racecourse sites have been the subject of
relatively recent new policy provisions and therefore do not warrant any further attention for now.
The District Centre Zone - Policy Area 5 (Woodville) is further differentiated into two Precincts - 20
Civic and 21 Recreation / Education. The former essentially relates to the mix of uses either side
of Woodville Road, between the train line and Port Road; while the latter relates to the St Clair
recreation facilities and the Woodville High School site. While the District Centre Zone provisions
allow medium to high density residential development, the Desired Character Statements and
Policy Area provisions are somewhat less encouraging and ambiguous. This would necessitate
changes if, for example, forms of higher density residential development were to be encouraged
within Precinct 21, subject to the Woodville Village and Environs DPA.
Similarly, a significant part of the station catchment is currently contained within the Residential
Character Zone (in particular east of Woodville Road and predominantly north of the railway line).
As discussed previously, the site area provisions are more conservative than most other residential
areas. This area was not reviewed as part of the assessment of particular Historic Conservation
Areas (reported elsewhere). Any intentions to encourage higher residential densities within this
area would be at the expense of maintaining the acknowledged historic character of the area.
These considerations have been taken into account as part of the Woodville Village Master Plan for
this precinct.
2.1.6 Albert Park Station Environs / Woodville West Housing SA Land
This area (400 metre radius of the Albert Park Train Station) is contained within the Residential
Zone - Policy Area 16 (Mid Suburban); Industry Zone and a Local Centre Zone. The area is also
affected by the Airport Building Height limitations - Zone E (100 metre height limit).
Consideration would need to be given to changing the current Industry Zone designation of parts of
the station catchment (subject to the assessment framework contained within the Metropolitan
Adelaide Industrial Land Strategy (2007) and recommendations from City of Charles Sturt
Industrial Land Study 2008).
The remaining areas are contained within Policy Area 16 (Mid Suburban), which imposes
density/site area limits of between 250 and 400 square metres per dwelling (for detached and
attached housing forms). This will warrant a re-evaluation if higher residential densities are
anticipated.
A Ministerial DPA is soon to be completed for the Woodville West Housing SA regeneration which
will create a mixed use neighbourhood node, and accommodate a mix of medium density housing.
City of Charles Sturt Residential Growth + Character Study - Report No 5: Development Plan Policy Analysis
P. 6
2.1.7 West Lakes and Seaton
This area, extending from West Lakes to Tapleys Hill Road, south of West Lakes Boulevard, is
contained within the District Centre Zone - Policy Area 4 (West Lakes); Stadium Zone; Industry
Zone; and Residential Zone - Policy Area 20 (Integrated Medium Density). The area is also
affected by the Airport Building Height limitations - Zone E (100 metre height limit).
The District Centre Zone consists of 2 Precincts (Retail Core West Lakes and Lakefront). The
Lakefront Precinct provisions allow medium to high density residential development with some
qualifications. Assuming mixed use development (including shop-top housing) is a form of
development to be encouraged within and immediately adjacent to the District Centre there would
be some justification in reviewing the provisions of the District Centre, Stadium and Industry Zones
within this area.
The concentration of Housing SA land located south of West Lakes Boulevard and west of Tapleys
Hill Road is contained within the Integrated Medium Density Policy Area 20, which imposes no
housing density limitations but does limit building heights to 2 - 3 storeys. This will require re-
evaluation if higher forms are to be encouraged.
A small pocket of residential land (the south-west corner of the West Lakes Boulevard / Tapleys Hill
Road intersection) is contained within Mid Suburban Policy Area 16, which imposes density/site
area limits of between 250 and 400 square metres per dwelling (for detached and attached housing
forms). This will warrant a re-evaluation if higher residential densities are anticipated.
A Ministerial DPA for the redevelopment of the AAMI Stadium site and surrounds is soon to be
commenced.
2.1.8 Seaton Park Station Environs
This area (400 metre radius of the Seaton Park Railway Station) is contained within the Residential
Zone - Policy Area 16 (Mid Suburban); Industry Zone; and Special Use Zone (i.e. Grange Golf
Course). The area is also affected by the Airport Building Height limitations - Zone D (45 metre
height limit) and Zone E (100 metre height limit).
Consideration would need to be given to changing the current Industry Zone designation of parts of
the station catchment (subject to the assessment framework contained within the Metropolitan
Adelaide Industrial Land Strategy (2007) and recommendations from City of Charles Sturt
Industrial Land Study (2008).
The Local Centre Zone provisions do allow various forms and densities of residential development,
subject to not compromising the primary intent of the zone.
A significant part of the station catchment is contained within the Mid Suburban Policy Area 16,
which imposes density/site area limits of between 250 and 400 square metres per dwelling (for
detached and attached housing forms). This will warrant a re-evaluation if higher residential
densities are anticipated.

City of Charles Sturt Residential Growth + Character Study - Report No 5: Development Plan Policy Analysis
P. 7
A scoping study for the Kilkenny and Seaton Park TODs has been undertaken.
2.1.9 Grange Road Corridor and Findon Shopping Centre Environs
This area extends approximately 400 metres either side of the length of Grange Road (including
the Findon Shopping Centre) and includes land contained within the following Zones/Policy Areas
(with estimated proportions):
Zone Policy Area Estimated
Proportions
Residential Zone Mid Suburban PA 16
Western Edge PA 17
Integrated Medium Density PA 20
75%
Residential Character Zone 5%
Local Centre Zone Local Shopping PA 7 <5%
Mixed Use Zone Urban Village Findon 9
Mixed Use PA 47
10%
Industry Zone 5%
Neighbourhood Centre Zone Findon PA 10 <5%
The area is also affected by the Airport Building Height limitations - Zone C (15 metre height limit).
The majority of this area is contained within the Mid Suburban Policy Area 16, which imposes
density/site area limits of between 250 and 400 square metres per dwelling (for detached and
attached housing forms). This will warrant a re-evaluation if higher residential densities are
anticipated.
Two relatively small pockets, adjacent to the Findon Shopping Centre and in West Hindmarsh are
contained within the Integrated Medium Density Policy Area 20. This imposes no housing density
limitations but does limit buildings heights to 2 - 3 storeys. This will require re evaluation if higher
forms are to be encouraged.

City of Charles Sturt Residential Growth + Character Study - Report No 5: Development Plan Policy Analysis
P. 8
2.2 Areas Outside Targeted Growth Areas
As outlined in Section 7 of Report 2 and in the preceding Section 2.1, in order to achieve the
residential targets outlined in the 30 Year Plan for Greater Adelaide, a significant proportion of the
expected future residential growth within the Council area will occur in targeted growth areas (e.g.
corridors, TODs and other infill sites). In order to achieve these targets, rezoning will be required
of much of the lower density Residential Zones in the Council area (other than the Character Area
Zones which are proposed to remain intact).
The State Government, through the 30 Year Plan for Greater Adelaide, has put forward the
proposal that 80% of the existing metropolitan area will remain largely unchanged as a result of
the Plan (page 72). This is reinforced by Policy 3 on page 71 of the Plan which states that new
growth should be concentrated … "so that the urban character of the majority of neighbourhoods
remains largely unchanged." The targeted growth applies to the remaining 20%. Importantly, the
Plan has not yet been made clear whether keeping the character of those areas "largely
unchanged" is intended to mean that existing densities will be retained or the existing zoning
regime will be retained.
There are therefore two main policy approaches that could be applied within the Council area that
are not part of the targeted growth areas:
1. Retain the Existing Policy Intent of these Areas
The main existing Policy Areas within the Residential Zone that will not be affected by the targeted
growth areas are the Mid Suburban, Western Edge and West Lakes General Policy Areas. These
Policy Areas provide for limited growth, which is currently generally taking place in the form of
demolitions and replacement with one house for two or sometimes one house for three (semi-
detached and group dwellings). This is generally seeing replacement of a medium size house on a
large block with two large houses on two smaller blocks.
The policy implication of this is that, over the long term, the vast majority of the Council area,
apart from the Residential Character Area Zones, will be replaced by new homes on generally small
(or smaller) allotments. The Character Area Zones will provide for generally slightly larger
allotments (family housing), while high densities will be located in all of the growth areas.
2. Restrict Increasing Densities in Areas Outside the Growth Areas
An alternative policy approach would see a further restriction of urban infill in the areas outside of
the growth areas (or part thereof), largely affecting parts of the Mid Suburban and West Lakes
General Policy Areas. It is suggested that the Western Edge Policy Area provisions could be
retained given that this Policy Area is promoting new housing in areas close to the coast.

City of Charles Sturt Residential Growth + Character Study - Report No 5: Development Plan Policy Analysis
P. 9
In order to protect family housing, apart from family homes in the Character Area Zones, new
policies could be developed that, for example, require infill housing sites to be of a larger size in
order that more comprehensive and better designed new housing can result. This would largely
require site amalgamation (other than for existing larger sites), and would therefore dampen
redevelopment activity in these areas. However, it would result in both the protection of family
housing and limited higher quality infill development on larger sites.
In the context that so much of the Council area lies within the growth areas (due to the number of
corridors, TOD sites and other infill development sites within the Council area), such a policy
approach could be justified and would be more consistent with the 30 Year Plan for Greater
Adelaide policy that the neighbourhood character of 80% of the metropolitan area will remain
unchanged.
Once a new policy approach has been determined, changes to Policy Areas and Desired Character
Statements would be required to reflect such a change.

City of Charles Sturt Residential Growth + Character Study - Report No 5: Development Plan Policy Analysis
P. 10
3 Policy Recommendations
3.1 Zone Boundaries for Targeted Residential Growth Areas
A broad desktop assessment (supported by some limited field work that has not covered every
location) has been made to identify potential rezoning of residential growth areas. The
purpose of identifying these areas is to:
§ Inform the scope of a future Residential DPA. It is understood that further local
analysis will be undertaken during the Residential DPA to fine tune the zoning
boundaries. The recommended zone boundary changes have been determined at a
strategic scale and generally do not reflect detailed local circumstances such as
streetscapes , land uses, character, vegetation and so forth.
§ Facilitate residential growth opportunities as identified in the previous Report 4
The potential rezoning as shown in the following figures.
3.1.1 Assumptions Made Influencing Recommended Zone Boundaries
In determining recommended zone boundaries, a number of broad assumptions have been made
so that the zoning boundaries reflect local circumstances and development potential. These
assumptions are:
§ Historic Conservation Areas are retained. With significant growth opportunities throughout
much of the City of Charles Sturt, it is considered that there is no justification for requiring
highly valued historic conservation areas to be nominated as growth areas.
§ Industry Zoning is retained, except for industry zoning relating to the nominated growth
areas (Kilkenny, Bowden/Clipsal, West Lakes SANFL land, Devon Park, Seaton Park). The
retention of land for industry is important in order to provide continued opportunities for
employment areas closer to residential regions.
§ Local Shopping or Local Commercial Areas have generally been included in the general
growth areas as these provide excellent opportunities for mixed use development close to
areas of activity
§ Growth areas broadly include 400m either side of the main road corridors, and an 800m
radius around train stations. Instead of a generic straight line or circle, the zone boundary
generally follows a more logical boundary around roads.
§ In some areas, there is evidence of more recent development (e.g. high capital to site
value ratios, cul de sac street pattern, minimal residential infill opportunity). In these areas
an assumption has been made that new residential development will be unlikely and the
zoning boundary has been adjusted to exclude these areas.

City of Charles Sturt Residential Growth + Character Study - Report No 5: Development Plan Policy Analysis
P. 11
3.1.2 Zone Names
No recommendation has been made as to the name or content of the areas nominated for
rezoning. Broadly, they are residential and mixed use growth areas. The zoning description and
policy coverage relevant to these areas have been provided by DPLG in their new suite of BDP
policy modules that cover TOD's, nominated activity areas and nominated growth corridors.
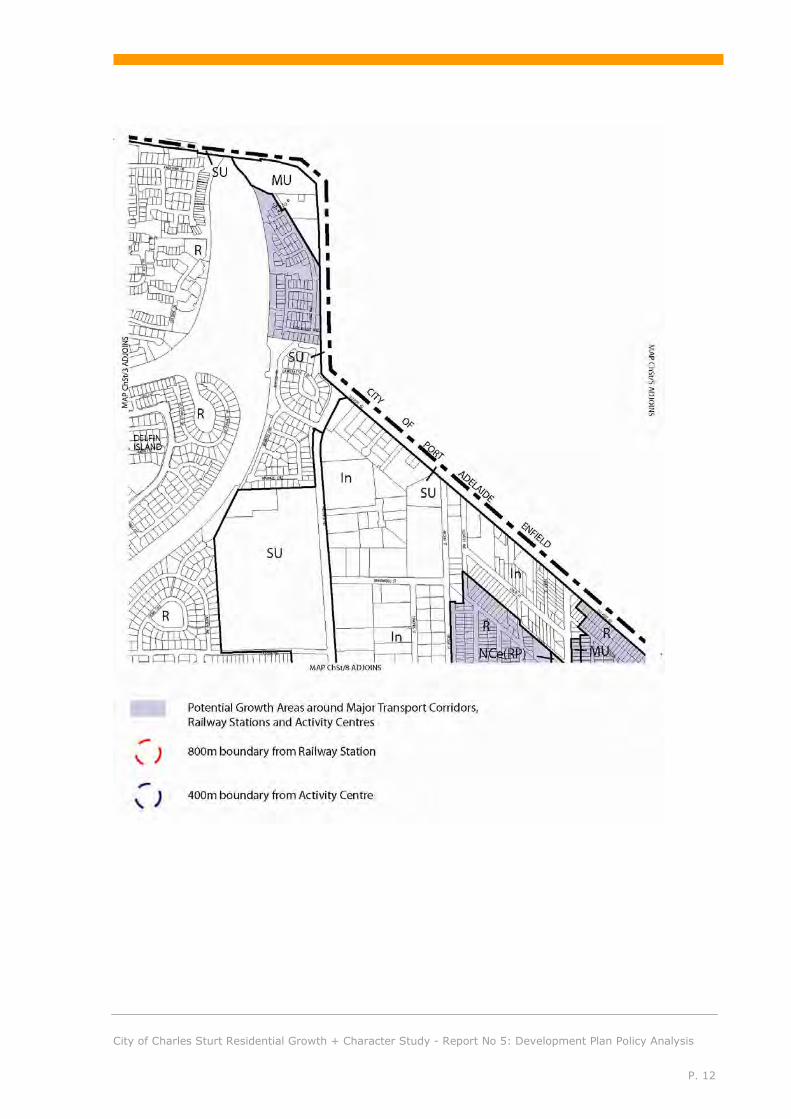
City of Charles Sturt Residential Growth + Character Study - Report No 5: Development Plan Policy Analysis
P. 12

City of Charles Sturt Residential Growth + Character Study - Report No 5: Development Plan Policy Analysis
P. 13

City of Charles Sturt Residential Growth + Character Study - Report No 5: Development Plan Policy Analysis
P. 14

City of Charles Sturt Residential Growth + Character Study - Report No 5: Development Plan Policy Analysis
P. 15
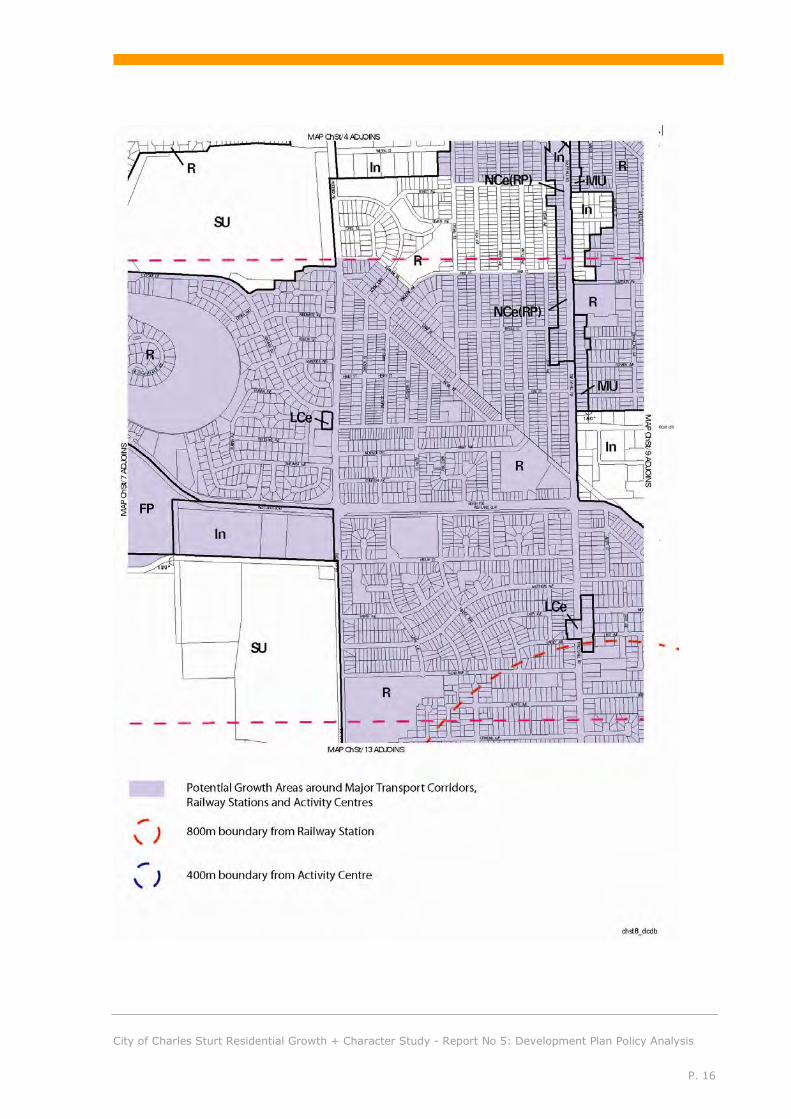
City of Charles Sturt Residential Growth + Character Study - Report No 5: Development Plan Policy Analysis
P. 16

City of Charles Sturt Residential Growth + Character Study - Report No 5: Development Plan Policy Analysis
P. 17

City of Charles Sturt Residential Growth + Character Study - Report No 5: Development Plan Policy Analysis
P. 18

City of Charles Sturt Residential Growth + Character Study - Report No 5: Development Plan Policy Analysis
P. 19

City of Charles Sturt Residential Growth + Character Study - Report No 5: Development Plan Policy Analysis
P. 20

City of Charles Sturt Residential Growth + Character Study - Report No 5: Development Plan Policy Analysis
P. 21

City of Charles Sturt Residential Growth + Character Study - Report No 5: Development Plan Policy Analysis
P. 22

City of Charles Sturt Residential Growth + Character Study - Report No 5: Development Plan Policy Analysis
P. 23

City of Charles Sturt Residential Growth + Character Study - Report No 5: Development Plan Policy Analysis
P. 24

City of Charles Sturt Residential Growth + Character Study - Report No 5: Development Plan Policy Analysis
P. 25

City of Charles Sturt Residential Growth + Character Study - Report No 5: Development Plan Policy Analysis
P. 26

City of Charles Sturt Residential Growth + Character Study - Report No 5: Development Plan Policy Analysis
P. 27
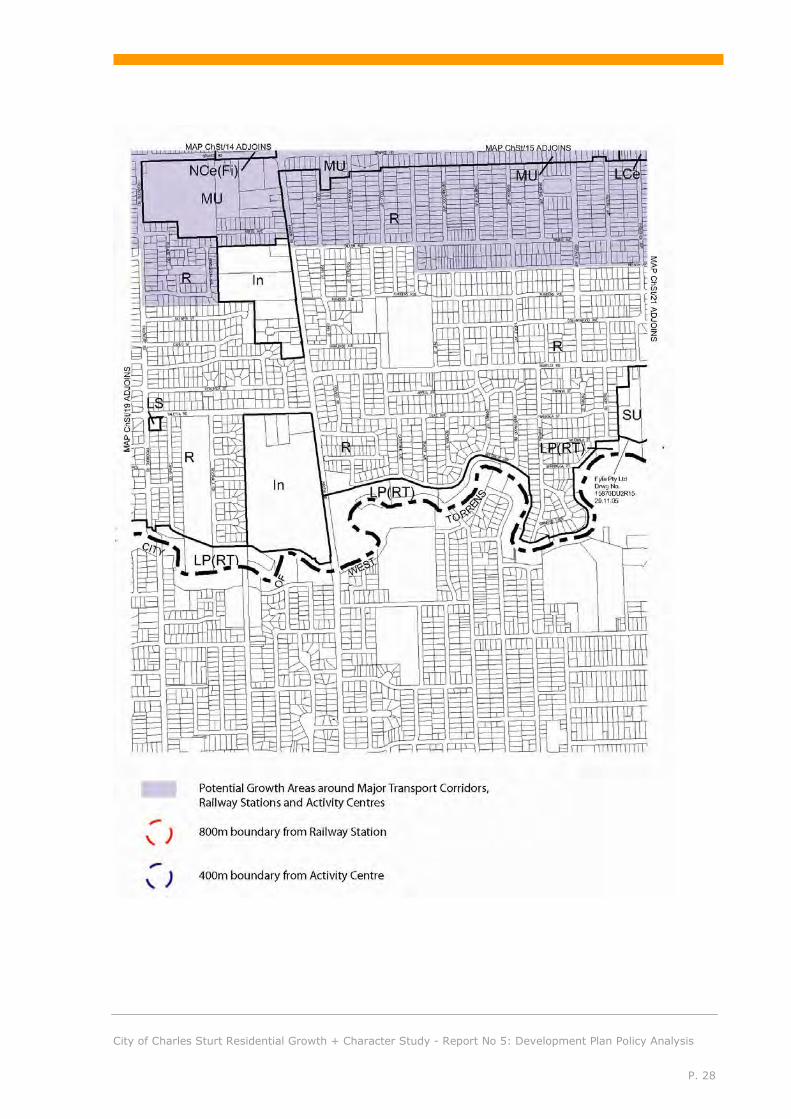
City of Charles Sturt Residential Growth + Character Study - Report No 5: Development Plan Policy Analysis
P. 28

City of Charles Sturt Residential Growth + Character Study - Report No 5: Development Plan Policy Analysis
P. 29
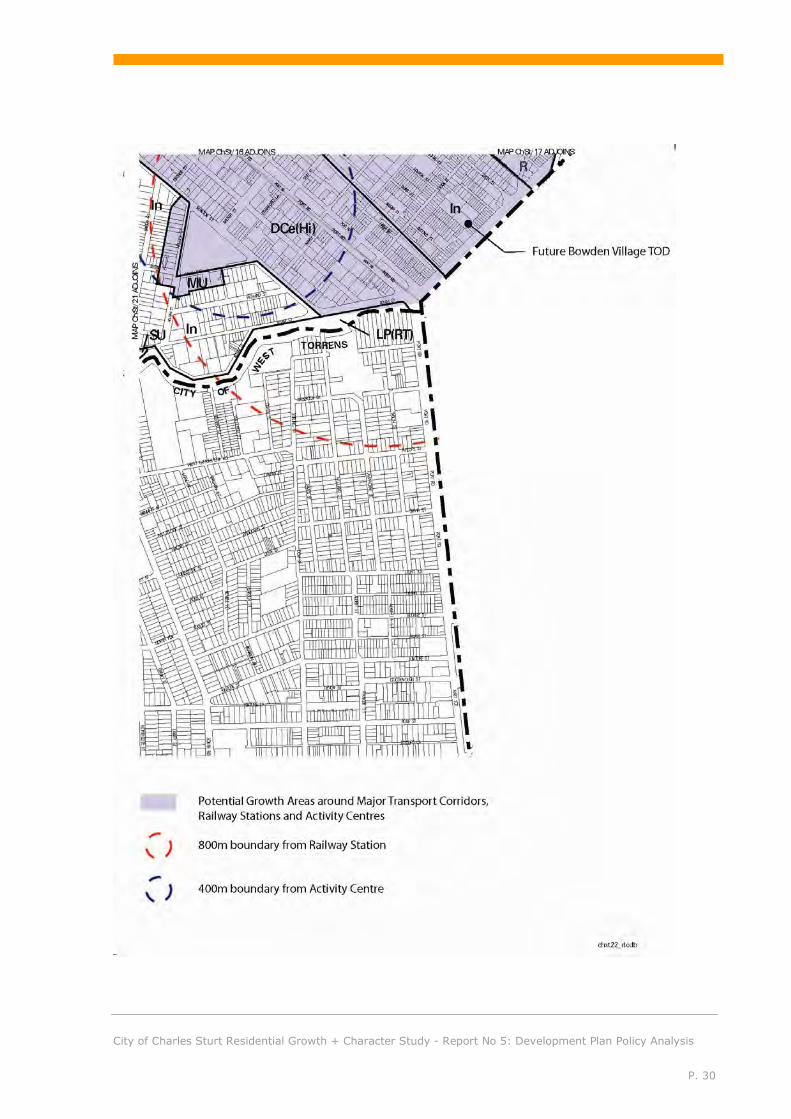
City of Charles Sturt Residential Growth + Character Study - Report No 5: Development Plan Policy Analysis
P. 30

City of Charles Sturt Residential Growth + Character Study - Report No 5: Development Plan Policy Analysis
P. 31

City of Charles Sturt Residential Growth + Character Study - Report No 5: Development Plan Policy Analysis
P. 32
3.2 Residential Design Policy Coverage
The following recommendations relate to a variety of issues that have been identified that currently
inhibit, or are at odds with, the general objectives for residential growth, form and character that
have been described in this study and detailed in the previous Report 4 Character and Form of
Potential Growth Opportunities.
These issues have been identified through:
§ Desktop review of current zoning and policy
§ Desktop review of BDP zoning options
§ Research into the residential market relating to current and predicted supply and demand
trends
§ State Government and Local Government policy directions (i.e. 30 Year Plan, City of
Charles Sturt Strategic Planning documents)
§ A workshop held with Development Assessment, Policy and Strategy staff to identify
current Development Plan constraints and opportunities
These recommended design approaches specifically relate to:
§ Parking
§ Open Space
§ Aircraft
§ Interface
§ Fencing
§ Sustainability
§ Dwelling Sites in Residential Character Zones with Historic Conservation Area Overlay
§ Hammerhead Development
§ Multistorey Housing
§ Affordable Housing
§ WSUD
§ Walking and Cycling
§ Coastal Development
§ Flooding
The purpose of these recommendations relating to policy coverage is to provide general direction
for the investigations and policy development stages of a future Residential DPA which will address
issues of form and character in the residential growth areas. Most of these recommendations
relate to Council wide provisions and some will also be applicable to local policy area context. They
should be further explored during the DPA process.

City of Charles Sturt Residential Growth + Character Study - Report No 5: Development Plan Policy Analysis
P. 33
3.2.1 Parking
Concerns have been raised about the impact of an increased number of driveways created by
semi-detached and row-dwellings in particular, and the consequent loss of on-street parking. It
would appear that in some cases Council is depending on available on-street spaces across the
road from new semi-detached and row-dwelling developments, which means that if development
occurs on the other side of the road in the future these spaces will be lost.
The intention is that visitor parking is available on the same side of the street and either directly in
front of dwellings or immediately adjacent, and this would need to be enforced. Typically,
driveways for row dwellings in Charles Sturt should be via rear lanes or rear shared driveways
only. In the case of semi-detached dwellings, there should be sufficient space between the two
driveways to ensure one on-street vehicle space. It is not considered sound practice to assume
visitors will park in the driveways of the people they are visiting (as often these areas are used by
residents), and therefore visitor spaces for Torrens Title lots should be on-street.
For group dwellings and residential flat buildings, visitor spaces should be on-site in separately
marked spaces, not in front of the garages of individual dwellings. The only time spaces in front of
individual garages should be counted for visitors is where a double garage exists (ie, residents
have 2 undercover spaces). Street spaces in front of group dwellings and residential flat building
sites can also be counted, particularly where there is a dwelling or dwellings facing that street.
3.2.2 Open Space
Council staff members have suggested that the Development Plan provisions for private open
space should be reduced to be consistent with the Residential Code Standards. This raises the
whole issue of whether all Residential Code Standards should now be reflected as consent use
standards in the Development Plan. The problem with the Residential Code Standards is that they
are in effect "complying use" standards, which traditionally were more conservative than those in
the Development Plan for consent use applications. That is, the open space requirement for
complying development might be, for example 80m2 per dwelling, but for consent use applications
the number might be 60m2. The Residential Code Standards have reversed this, as it has
introduced lower numbers than the consent use provisions.
Council's existing policies in PDC 25 in the Residential Development section are appropriate,
although it is not recommended to go above 20% of site area. The requirements for group
dwellings and residential flat buildings are considered too high.
3.2.3 Aircraft
Council should identify, amend and incorporate appropriate policy provisions from West Torrens
Council’s Adelaide Airport Zone.

City of Charles Sturt Residential Growth + Character Study - Report No 5: Development Plan Policy Analysis
P. 34
3.2.4 Interface
The targeted growth areas will be located such that there will be interfaces between lower density
Residential Zones and Residential Character Zones. As outlined earlier in this Report, it is intended
to ensure that residential development decreases in height / scale as it approaches the interface
with lower density zones. Generally this reduction in height should be such that the height at the
boundary should be similar to or only slightly above (maximum 3 metres) the maximum height
permissible within the adjoining lower density zone.
Apart from height of buildings there are a number of other design techniques available to improve
compatibility between higher density and lower density zones, including location of landscaping /
tree planting, building articulation, selection of building materials and compatibility of roof form.
Council's existing Plan has a section called "Interface Between Land Uses" in the General Council
Wide section.
With respect to the residential development adjacent to noise sources such as arterial roads / rail
lines, it is recommended that PDCs be incorporated that link Design Standards to the Australian
Standards which are included in several other Council Development Plans as well as in the Good
Residential Design Guide originally produced by the government.
With respect to interface between residential and non-residential within the same building or in
developments that are adjacent non-residential uses, a standard set of Council Conditions of
Approval can be developed and used to control impacts, including limiting hours of operation,
licensing, etc.
3.2.5 Sustainability
There were no issues raised by Council officers with respect to this matter that were able to be
incorporated into Council's Development Plan, other than where, in lower density areas in
particular, the focus could be placed on ensuring that gardens are sized to have scope for tree
planting as well as other vegetation. With higher densities, great emphasis is placed on street tree
planting and that this should be dealt with during evaluation of streetscape impacts of new
development and in Council's Engineering Standards for street design.
Building orientation and noise issues are already adequately dealt with.
3.2.6 Dwelling Sites in Residential Character Zones with Historic Conservation Area Overlay
The intent of policy is to ensure retention of all contributory places / heritage places within the
area.

City of Charles Sturt Residential Growth + Character Study - Report No 5: Development Plan Policy Analysis
P. 35
The issue is that semi-detached / detached dwellings are allowed, as well as group dwellings and
residential flat buildings. However, staff believed that the minimum lot frontages encourage
demolition and subdivision into detached / semi-detached (apart from the policies that discourage
demolition of contributory places).
Because the policies state a requirement for an 18m frontage before one can develop a battle-axe
lot (refer PDC 10 of Character Zone), on lots with less than an 18m frontage, applicants seek to
increase density through other means (i.e. via semi-detached development). However, staff agree
that semi-detached dwellings are a form of development that is inconsistent with the character that
is being sought.
The policy is clear that contributory places are to be kept (Historic Conservation Area Objectives
and PDC 3 and 4). The confusion arises because the policies do "allow" for detached, semi-
detached and row dwellings on narrow allotments.
This is further exacerbated by PDC 4(c) in the Historic Conservation Area, which suggests that a
contributory item can be demolished or removed if a replacement development is erected (which
doesn't diminish the level of contribution to this historic character), and the replacement building is
approved at the same time as the demolition. PDC 4(c) basically means that contributory items
may be demolished and replaced with new development provided that it does not diminish the
level of contribution to the historic character. However, this is often considered impossible to
administer, as it is asking the planning authority to assess whether a new building diminishes the
level of contribution of the existing building to the historic character of the locality. This difficulty is
exacerbated elsewhere in the Plan by the Policy which states that "it is not intended to create new
buildings which look old in the Historic Conservation Area. New building design should be
complementary to the heritage character of adjoining buildings and the surrounding area by
relating sympathetically to the established character of the street.".
The key issue here is the cumulative impact of demolitions of contributory items over time.
If the policy intent is to retain the contributory items, then the grounds for demolition should be
restricted to only PDCs 4(a) and (b) of the Historic Conservation Area. Where an applicant seeks to
pursue the use of PDC 4(c), an independent report from a heritage architect that assesses the level
of contribution and supports the development should be provided.
In terms of new development which includes new development behind contributory places or
redevelopment of non-contributory items, it is suggested that policy should not encourage higher
densities than those consistent with the predominant built form character. For example, if the
existing typical allotment frontages are 12 metres, then new Torrens Title allotments facing the
street should have frontages of 12 metres. This would mean that if a contributory item was in an
unsound condition, then it could be replaced with another dwelling. If the allotment frontage was
greater than 18 metres and there was sufficient driveway width, etc (refer to existing PDC 10 in
the Residential Character Zone), then it could also have a new dwelling to the rear.
The context for this policy approach is that a very large part of the Council area is identified for
urban infill / growth areas. In this context it is considered reasonable to assume that future
development outside of these growth areas should focus on the retention of lower densities with
family accommodation, larger gardens, increased opportunities for vegetation, etc. This is

City of Charles Sturt Residential Growth + Character Study - Report No 5: Development Plan Policy Analysis
P. 36
particularly the case given the Residential Character Zone Objectives and those of the Historic
Conservation Area, where it is reasonable to expect that, over time, the general built form is
retained, with new development limited and in character with the older buildings. It is futile having
policy that results, over time, in the replacement of many or most of the existing older buildings in
the Residential Character Zone that it seeks to protect.
Yet, there should be potential to develop some additional dwellings in these areas, provided that
the main parts of contributory items are retained as part of the process and that garaging /
driveways do not dominate the streetscape.
3.2.7 Fencing
The main issue with fencing controls lies in West Lakes Policy Area 18. The original encumbrances
were transferred into Council’s Development Plan and now need to be simplified.
The key policy intentions still required are: (a) Maintain control of fencing between:
§ homes and the lake § homes and streets
That is, Council doesn't need to deal with fences: § along the sides of homes § to the rear of homes where homes don't back (or front) the lake
(b) Define the meaning of "front" fencing for homes that abut the lake so that it is clear if
it is fencing between the home and the street, or the home and the lake.
(c) Ensure no front fencing is constructed on street boundaries (i.e. only courtyard walls set
back from street boundary, screened with landscaping, and no longer than 50% of the allotment frontage (or 6 metres, whichever is the lesser) are allowed).
3.2.8 Hammerhead Development
Council needs to decide whether it wants to allow hammerhead allotments in the lower density
(non-"growth area" parts of Council) and the character areas (HCA) given so much of the Council
area may be rezoned to higher densities.
One option is to only allow them in growth areas in order to better protect future "family housing"
areas (i.e. over time there will be a smaller proportion of homes with larger gardens left in City of
Charles Sturt given the extensive areas identified for growth).
Recommendations for development on the rear hammerhead allotments:
(a) in low density and character areas:
§ only single storey dwellings should be allowed
(b) In growth areas:

City of Charles Sturt Residential Growth + Character Study - Report No 5: Development Plan Policy Analysis
P. 37
§ two storey dwellings allowed subject to design controls (overlooking,
overshadowing, design and articulation to improve character, screen landscaping,
etc)
§ Category 1A (neighbours notified)
(c) In all situations:
§ driveway ("handle" of the battleaxe allotment) excluded from area calculation
§ minimum driveway width of 3m for driveway and 1m each side for landscaping
§ limit the site coverage of rear dwellings to encourage smaller, more affordable
homes in rear with increased opportunities for separation from neighbours,
protection of privacy and landscaping
§ provide for increased side and rear boundary setbacks to avoid visual impact on
neighbours and complement site coverage controls
3.2.9 Multi Storey Apartments
Issues to be addressed in new policies:
(a) Investigate how best to introduce waste servicing guidelines into the Development
Plan (review ACC controls).
(b) Need to insert a control that the minimum apartment floor area is 50m2, excluding
any balcony area.
(c) Identify design principles relating to mixed use issues, in particular noise and odour
(review ACC Development Plan and ACC Guidelines).
Overall, the BDP provisions in the existing Library plus new modules dealing with Activity Areas,
TOD's etc will need to be followed.
3.2.10 Affordable Housing
One of the main factors governing the cost of new housing is the size of the dwelling. The average
house size has grown considerably over the past 50 years, notwithstanding the fact that the
average household size has decreased. Concurrently, the average size of a residential allotment
has decreased, resulting in a much greater average site coverage for new dwelling construction.
This has two outcomes, one of which greatly affects housing affordability. The other outcome is
that less space on a residential allotment is available for landscaping and tree planting, as well as
less space being provided between buildings. This has been a common complaint by many
residents, particularly the change in residential landscape resulting.
However, there are planning controls that can be put in place to limit both site coverage and floor
space of new dwelling construction. Such Development Plan policies were incorporated into the
City of Marion's Development Plan some years ago, with the dual purpose of increasing housing

City of Charles Sturt Residential Growth + Character Study - Report No 5: Development Plan Policy Analysis
P. 38
affordability by ensuring that when a single dwelling was replaced by more than one dwelling, the
new dwellings were generally smaller in floor space and provided opportunities for significantly
more site landscaping (although this is more difficult to ensure).
While such policies do deliver more affordable housing, they do somewhat go against the market
trend for new homes to be larger, and may result in some developer / market resistance.
However, it is fair to say that, if a purchaser is looking for a larger home, there are many
alternatives in the form of larger homes on larger allotments or larger existing homes on smaller
allotments, thereby leaving the opportunity for new medium density housing to be constructed
utilising smaller dwellings.
3.2.11 Walking and Cycling
One of the Council officers indicated that it would be important to include separate pedestrian
paths in laneways if there are houses that directly front on to the laneway. This is considered
unnecessary as these laneways are designed as "shared spaces" with slow moving traffic. As long
as they are appropriately designed with street trees to break up the streetscape and provide shade
and visual amenity, even if some houses face on to these laneways (e.g. mews houses),
pedestrians should be able to walk along the laneway itself. If separate footpaths are provided
then the width of the laneway becomes similar to a street and the purpose of having laneways is
dissipated.
There is a BDP Module on Transportation and Access that incorporates a section on Walking and
Cycling that can be incorporated into Council's Development Plan during the DPA.
3.2.12 Water Sensitive Urban Design (WSUD)
There is a BDP Module on Natural Resources including a section on Water Sensitive Design that can
be incorporated into Council's Development Plan. There is also a wealth of material available,
including a new Guide / Code prepared by DPLG, that can be used as the basis for preparing
material for inclusion in the Development Plan.
This can be done as part of the DPA.
3.2.13 Coastal Development
Western Edge Policy Area 17 covers the coastal areas and includes the Desired Character
Statement promoting a "seaside" character. However, there is limited guidance about what such a
"seaside" character comprises, other than words such as "interesting roof forms and parapets,
building articulation, use of light colours and coloured materials".
It is considered that, if desirable, more detailed guidance could be provided as to what a "seaside"
character comprises in the context of suburban Adelaide and this coastal location in particular. The
guidance should not only be in the form of words. Sketches will be required if this approach is to be
undertaken. However, the value of such an approach is questionable given the extent and variety
City of Charles Sturt Residential Growth + Character Study - Report No 5: Development Plan Policy Analysis
P. 39
of coastal development in recent years. This additional work should be undertaken as part of the
DPA.
3.2.14 Flooding
Flooding is a critical area that needs addressing within the Development Plan in order to protect
the communities assets and people’s well-being, and prevent potential litigation. Flooding is
covered in various sections of the BDP modules including Coastal Areas and Hazards. Given the
intensification of housing in growth areas and the consequent potential increase in impermeable
surfaces, policy provisions covering a suite of matters will be necessary. These include stormwater
management requirements such as rainwater tanks, development controls over minimum unpaved
private open space areas (difficult to control / administer over time), finished floor levels for
buildings, etc. This additional work should also be undertaken as part of the DPA.

This report has been prepared by:
Jensen Planning + Design
Cit y of Charles St urt Cit y of Charles St urt Cit y of Charles St urt Cit y of Charles St urt
RRRResident ial esident ial esident ial esident ial GGGGrowt hrowt hrowt hrowt h ++++ C C C Charact er haract er haract er haract er SSSSt udyt udyt udyt udy
Report 6
Review of Identified Residential Historic Conservation Areas
May 2011

1 Executive Summary .................................. ............................ 1
2 Overview ........................................... .................................. 2
3 Bowden/Brompton Precinct 66 .............................................. 4
4 Brompton Park Precinct 67 .................................................... 7
5 Early SA Housing Trust Precinct 68 ........................................ 9
6 Pre World War One Precinct 71 ............................................ 11
7 Kilkenny Precinct 74 ........................................................... 12
8 Cheltenham East Precinct 77 ............................................... 13
9 Cheltenham West Precinct 78 .............................................. 14
10 Henley Beach Precinct 79 .................................................... 15
11 Grange Precinct 80 ............................................................. 16
12 Figure 1 and Figure 2: Conservation Zone Recommendations .. 19

City of Charles Sturt Residential Growth + Character Study - Report No 6: Review of
Identified Residential Historic Conservation Areas
P. 1
1 Executive Summary
This report is the sixth report prepared for the Residential Growth and Character
Study. This Study has been undertaken by Jensen Planning + Design for the City
of Charles Sturt. The study is examining future residential growth and character
issues across the City of Charles Sturt. This report reviews the zone boundaries
and policies for a number of existing Residential Character Zones (Historic
Conservation Areas). It identifies opportunities for the refinement of the zone
boundaries.
Report 1 - the Strategic Context Report, analyses population trends and policy
approaches within the State Government and the City of Charles Sturt.
Report 2 - Opportunities and Constraints, examines potential opportunities and
constraints for future residential growth in the City of Charles Sturt. It summarises
future population and housing projections specific to Charles Sturt based on a
range of population scenarios and suggests how many additional dwellings will be
required in the City of Charles Sturt to 2031 to meet the 30 Year-Plan for Greater
Adelaide Growth targets.
Report 3 - Future Social Infrastructure Requirements, provides a broad overview of
the context and supply requirements of future social infrastructure needs across
Charles Sturt.
Report 4 – Form and Character of Potential Residential Growth Opportunities,
provides recommendations about the future character, form and extent of
residential growth areas in the City of Charles Sturt.
Report 5 - Development Plan Policy Analysis for Growth Areas assesses current
Development Policy relating to the identified residential growth areas. It proposes
new residential design policy and zoning changes for the identified residential
growth areas that will inform a forthcoming Residential Development Plan
Amendment.
City of Charles Sturt Residential Growth + Character Study - Report No 6: Review of
Identified Residential Historic Conservation Areas
P. 2
2 Overview
A requirement of the City of Charles Sturt Residential Growth Strategy and
Character Study Brief was to review a number of existing Residential Character
Zone (RCZ) Historic, Conservation Areas (HCA). Council introduced the current
RCZs in September 2003 based on extensive investigations undertaken on behalf
of Council by Mark Butcher Architects (1994) and McDougall & Vines (1997). Since
the introduction of these zones and accompanying policies there have been some
concerns expressed regarding the legitimacy of some of the zone boundaries and
the onerous nature of some of the policies.
Council officers identified the following areas for review:
§ Bowden/Brompton Precinct 66 (encompasses parts of Ovingham, Bowden and Brompton);
§ Brompton Park Precinct 67;
§ Early SA Housing Trust Precinct 68 (located in Pennington)
§ Pre World War One Precinct 71 (located in Pennington);
§ Kilkenny Precinct 74;
§ Cheltenham East Precinct 77;
§ Cheltenham West Precinct 78;
§ Henley Beach Precinct 79; and
§ Grange Precinct 80.
The purpose of the review was to identify opportunities for the refinement of the
zone boundaries and whether some consideration should be given to removing the
RCZ HCA in particular locations. It did not include an analysis of the effectiveness
or otherwise of the current policies.
The review consisted of a desk-top analysis of the existing zones, the extent of
contributory items, the era and housing style of adjacent areas, and site visits to
each area. The analysis included the consideration of the following:
§ Identification of the extent of 'non-conforming' items, either comprising
residential development which did not contribute to the historic character of
the locality, principally because of the age of the development, or non-
residential forms of development, which similarly did not contribute to the

City of Charles Sturt Residential Growth + Character Study - Report No 6: Review of
Identified Residential Historic Conservation Areas
P. 3
historic character of the locality (typically more recent industrial, warehouse
or other non-residential development);
§ Identification of the extent of change that has occurred since the inception of
the RCZ, HCA provisions (i.e. whether a significant number of contributory
places have been demolished since September 2003);
§ The identification of other changes in circumstances (e.g. significant more
recent infill development which changed the character of a particular area),
which would warrant a reappraisal of the justification for a RCZ, HCA; and
§ Whether there was some justification in expanding the extent of the RCZ to
encompass adjacent areas considered to be of sufficient historic character and
quality to warrant some form of policy protection.
Each of the following assessments for each of the areas reviewed, commences with
extracts of the Character Statement from the existing Development Plan (as of the
date of this review which was undertaken in 2008).
Figure 1 and Figure 2 at the end of this report detail the overall summary of the
key recommendations.

City of Charles Sturt Residential Growth + Character Study - Report No 6: Review of
Identified Residential Historic Conservation Areas
P. 4
3 Bowden/Brompton Precinct 66
Existing Character Statement The Bowden Brompton Precinct accommodates some of the City of Charles Sturt’s oldest houses and buildings, dating to the earliest years of European Settlement in the region. The subdivision pattern, dating from 1839 in Bowden and 1849 in Brompton, is one of small, narrow allotments designed for typically early inner-city residential living. The existing significant buildings are primarily small, single-storey, detached and attached, single and double fronted workers’ cottages dating from the 1850’s-1900 period. They are characterised by red brick and bluestone walls, gable and hipped corrugated iron roofs and small setbacks from the street. The predominant urban character remains that of the Victorian era, with an intimate and small-scale character which has considerable charm and interest. Ovingham is unique in that it incorporates strongly sloping sites and retains many dominating stone and iron front walls. Some 1930s - 40s bungalows and austerity houses, together with more recent SA Housing Trust 1970s–1980s townhouses are also located in Ovingham. This precinct also includes a significant proportion of more recent commercial and industrial premises which detract from the older Victorian character of the area.
This area consists of two major parts:
§ The area bound by Torrens road to the north and Park Terrace to the west,
and which straddles the Adelaide - Gawler Railway line and Hawker Street
(referred to below as Bowden/Brompton East); and
§ The area encompassing parts of Coglin, Green and West Streets and
extending approximately from Torrens Road to Second Street (referred to
below as Bowden/Brompton West).

City of Charles Sturt Residential Growth + Character Study - Report No 6: Review of
Identified Residential Historic Conservation Areas
P. 5
Bowden/Brompton East
The Development Plan indicates the existence of a significant number of
Contributory Places and four State Heritage Places within this area.
The analysis confirmed the existence of a significant number of non-conforming
places (i.e. buildings which were generally built in more recent times and do not
necessarily contribute to the historic character of the area). The analysis suggests
that approximately 40-50% of the existing building stock is non-conforming.
However, it is also evident that only a small number of contributory places have
been demolished since the introduction of the RCZ policies in 2003 (i.e. the
majority of the non-contributory items existed at the time of the establishment of
the HCA).
It was also evident that an adjacent area to the west, extending approximately
either side of Chief and East Streets, between Fifth and Hawker Streets, contained
a significant number of quality pre 1940's housing to warrant some consideration
of its inclusion within a RCZ HCA.
One pockets of the HCA located to the north (south of the junction of the railway
line and Torrens Road), was dominated by non-contributory items and land uses.
There would appear to be some justification in rationalising the RCZ HCA to
exclude this area.
Bowden/Brompton West
Similar to the Bowden/Brompton East area, this area also contains a significant
number of non-conforming places. However, it is also evident that little change
has occurred since the establishment of the RCZ HCA Zone and that the significant
number of non-conforming places was in existence at that time.
It would appear that a decision was made during the formulation of this RCZ HCA
Zone to include significant areas of 'vacant' land (former pugholes) at the southern
end of Green Street with a view to bringing a group of contributory buildings
located along West Street into the RCZ HCA. The former pughole land has since
either been developed or is in the process of being developed for housing.
Removing this recently redeveloped area from the ambit of the RCZ HCA would
appear to be a reasonable strategy. However, this will result in a relatively small
'island' of contributory places located along the north-western side of West Street.
The quality and upkeep of these houses, some of which are attached single storey
row houses, is relatively good and it is considered unlikely that they would
necessarily be demolished and redeveloped if they were not included within a RCZ
HCA.

City of Charles Sturt Residential Growth + Character Study - Report No 6: Review of
Identified Residential Historic Conservation Areas
P. 6
Recommendations Bowden/Brompton East
1 That Council considers the exclusion of one area from the Residential Character Zone Historic Conservation Area - Precinct 66 (see Figure 1). The area recommended for removal is located near the Ovingham Station and is considered to warrant further attention for its potential to accommodate higher density residential development (along with other adjacent sites) as part of this Strategy. 2 Should the above recommendation be adopted, policies should be formulated to ensure that any infill development within this area is respectful of the historic character of adjoining areas. 3 That Council considers the inclusion of the area around Chief and East Streets, north of Hawker Street within the existing Residential Character Zone – Precinct 66 (see Figure 1). Bowden/Brompton West
4 That Council considers the exclusion of the area indicated in Figure 1 from the Residential Character Zone Historic Conservation Area– Precinct 66 and that policies be formulated to encourage the retention of the existing contributory places located within West Street upon their removal from the Residential Character Zone Historic Conservation Area.
City of Charles Sturt Residential Growth + Character Study - Report No 6: Review of
Identified Residential Historic Conservation Areas
P. 7
4 Brompton Park Precinct 67
Existing Character Statement The Brompton Park precinct accommodates some of the City of Charles Sturt’s oldest houses and buildings, dating to the earliest years of European Settlement in the region. The Brompton Park subdivision pattern, dating from 1876, is one of very small, narrow allotments designed for typically early inner-city residential living. The existing significant buildings are primarily small, single-storey, detached and attached, single and double fronted workers’ cottages dating from the 1870’s-1890’s period. They are characterised by red brick and bluestone walls, gable and hipped corrugated iron roofs and small setbacks from the street. The predominant urban character remains that of the Victorian era, with an intimate and small-scale character which has considerable charm and interest. This precinct also includes more recent commercial and industrial premises which detract from the older Victorian character of the area.
It is estimated that over 60% of this area does not contain buildings which
contribute to the historic character of the area. It contains a former pughole,
north of the Brompton Park Hotel, which is also earmarked for residential
development, as well as a number of commercial premises along Coglin, Hocking
and Taylor Streets, and significant more recent infill residential development (e.g.
SAHT, Housing Co-op), and special needs housing.
The extent of contributory places indicated within the Development Plan along
Coglin Street does not accurately represent the current circumstances (this may be
an error rather than indicate changed circumstances since the establishment of the
RCZ HCA given that the commercial properties have existed for a considerable
period of time).
Notwithstanding the unique pattern of subdivision within this area, as referred to in
the Existing Character Statement, it is considered that the area has undergone
significant transformation and that this process will continue with the forthcoming
infill development of the former pughole site. Furthermore, the quality of some of
the remaining contributory places is poor and the amenity of the area continues to
be compromised by some of the existing non-conforming land uses.

City of Charles Sturt Residential Growth + Character Study - Report No 6: Review of
Identified Residential Historic Conservation Areas
P. 8
Accordingly, it is considered that there is justification in further reviewing the
legitimacy of retaining all or parts of this area within the RCZ HCA.
Recommendation 5 That Council engages heritage consultants to undertake an assessment of Brompton Park Precinct 67 in conjunction with planning advice to determine whether parts or all of Precinct 67 should be removed from the Residential Character Zone Historic Conservation Area (see Figure 1).

City of Charles Sturt Residential Growth + Character Study - Report No 6: Review of
Identified Residential Historic Conservation Areas
P. 9
5 Early SA Housing Trust Precinct 68
Existing Character Statement Bell Street, Pennington This area accommodates some very early SAHT housing dating from early 1938.
The original layout and subdivision reflects “Garden Suburb” urban design concepts
popular at the time. This layout still exists and provides strong urban focal points
in Sinclair Square and Tulloch Avenue. The housing consists of semi-detached
single-storey dwellings constructed of red brick with hipped and gable corrugated
iron roofs.
The housing in Bell Street has terracotta tile roofing, indicating a refinement of the
original design. Some brickwork has protruding courses to give a horizontal-
banded effect.
The styling is austere, with late-modern overtones, as seen in the occasional
horizontal banding and in the concrete entrance porch canopies. Overall, the area
has a very uniform and austere character with little planting or street trees.
The analysis confirmed that this area remains 'intact' with very few non-
conforming or vacant sites. The Development Plan identifies the vast majority of
dwellings as being contributory places.
The land ownership data also suggests that the majority of houses/sites remain in
the ownership of Housing SA. A small number of dwellings have been demolished
and the sites are currently being redeveloped by Housing SA.
The overall appearance and level of maintenance of the area is poor. Generally the
allotments are not well maintained, and streetscaping is minimal. The internal
layout of the housing stock and the large rear yards do not generally meet current
public housing client's needs or good residential design objectives.
Overall improvement of the area is required to meet the needs of public housing
clients, as well as to meet state and federal government objectives relating to
increasing diversity of demographics, tenure and residential built form within a
local area.

City of Charles Sturt Residential Growth + Character Study - Report No 6: Review of
Identified Residential Historic Conservation Areas
P. 10
Whilst the original layout and Garden Design principles should be maintained and
protected, it is the areas of Bell Street, some parts of Tulloch Street and Sinclair
Square that are considered to be most worthy of retention in their existing form.
The other areas are not considered worthy of retaining RCZ HCA status.
Recommendation 6 That the boundary of the SA Housing Trust Precinct 68 changes to incorporate the areas considered to be most worthy of retention in their existing form as a Residential Character Zone Historic Conservation Area. The areas to be retained are generally Sinclair Reserve, the properties fronting on to Sinclair Reserve, and the Northern ends of Tullock Avenue and Bell Street as shown in Figure 2. This recommendation should inform a Development Plan Amendment however further consideration of this area by a Heritage Consultant, and in conjunction with Housing SA, is advised.

City of Charles Sturt Residential Growth + Character Study - Report No 6: Review of
Identified Residential Historic Conservation Areas
P. 11
6 Pre World War One Precinct 71
Existing Character Statement Pennington West This area accommodates a mixture of 1900s–1920s housing, comprising typically detached single storey Edwardian/Federation/early bungalow houses, together with some 1940s–1950s houses on the eastern side. The housing is characterised by red brick, sandstone and render walling, terracotta tile and corrugated iron roofing and verandahs, and hipped, gable and Dutch-gable roof forms. Some of the villas in this area are particularly fine examples of Edwardian houses, with pressed-metal wall cladding on the fronts, corrugated iron or small-fluted iron cladding on the sides and corrugated iron roofs. The housing is of good quality and this, together with the uniform allotment size and street layout, gives the area an interesting character. Pennington Terrace is the dominant street in the area with the school and church providing key civic focal points. The analysis indicates that this area continues to contain a high proportion (90%+)
of contributory places. There is no evidence to suggest that the original reasons
for including this area within a RCZ HCA have changed.
Recommendation 7 That Pre World War One Precinct 71 remains as a Residential Character Zone Historic Conservation Area.

City of Charles Sturt Residential Growth + Character Study - Report No 6: Review of
Identified Residential Historic Conservation Areas
P. 12
7 Kilkenny Precinct 74
Existing Character Statement This area accommodates a wide range of single-storey detached houses dating from the 1850s through to the 1950s. However, the predominant era is 1920–1930 in the north of the area and 1910–1920 in the south. Edwardian and post-Edwardian cottages and houses are found in the south, while Federation and bungalow houses, together with a number of 1940s and 1950s houses are found in the north. Housing is characterised by freestone front walls, red brick side walls and corrugated iron and terracotta tile roofs. There is a small proportion of more recent residential development in the area. A small group of Victorian commercial premises is located at the southern end of Wilpena Terrace which, together with the older housing at this end, give it a strong Victorian character reflecting the original village of Kilkenny. Of note are a number of large, high-quality 1930s houses on large allotments at the northern end of the area. The area as a whole is focused on Wilpena Terrace.
The analysis indicates that this area continues to contain a high proportion (80%+)
of contributory places. The site survey revealed that a small number (around 20)
of formerly identified contributory places have been demolished and replaced with
non-conforming buildings (note that this may in fact be over enumerated if the
Atlas South Australia data, which identifies contributory places, is not entirely
accurate). Notwithstanding this change, the area is still characterised by a
majority of buildings which contribute to the historic character of the area.
Recommendation 8 That the Kilkenny Precinct 74 remains as a Residential Character Zone Historic Conservation Area.

City of Charles Sturt Residential Growth + Character Study - Report No 6: Review of
Identified Residential Historic Conservation Areas
P. 13
8 Cheltenham East Precinct 77
Existing Character Statement The housing in this area is similar in style to that in the Cheltenham West Precinct, but is of a slightly smaller scale. This reflects the smaller allotment sizes which creates a more intimate character in this area. The subdivision here is also slightly earlier than in the Cheltenham West Precinct, with part being divided in 1880.
The current Development Plan indicates that approximately 80 -90% of the
existing housing stock within this Precinct comprises contributory places. The
analysis revealed little change with the vast majority of allotments still
accommodating dwellings that make a positive contribution to the historic
character of this area. Accordingly, there is considered to be little justification in
changing the current Precinct boundaries.
Recommendation 9 That Cheltenham East Precinct 77 remains as a Residential Character Zone Historic Conservation Area.
City of Charles Sturt Residential Growth + Character Study - Report No 6: Review of
Identified Residential Historic Conservation Areas
P. 14
9 Cheltenham West Precinct 78
Existing Character Statement This large residential area accommodates a range of housing, particularly historic north of the railway line where there are areas of sandstone and brick villas. West of Stroud Street are 1910-1930 era detached houses, styled in the Post-Edwardian/Federation/Bungalow manner with an occasional Tudor or 1940s dwelling. Housing close to Torrens Road and south of the railway line tends to be more ‘mixed’ in character, including a number of non-contributory buildings. The area contains a significant number of dwellings with pressed metal, “stone” front walls and corrugated iron clad side walls. However, houses are generally characterised by red brick and sandstone walls, corrugated iron and terracotta tiled roofs, hipped, gable, Dutch-gable roof forms and verandahs. Overall, the area has a fairly uniform character. The main streets in the area are Stroud Street (north and south), with its residual shops and community facilities centred around the station, Buller Terrace and Railway Terrace. Street trees are generally limited, with little advantage taken of the wide streets for avenue plantings.
The circumstances for this Precinct are similar to those for the adjoining
Cheltenham East Precinct 77 - approximately 80-90% of existing contributory
places designated within the Development Plan and very little change over the
intervening period. Accordingly, there is considered to be little justification in
changing the current Precinct boundaries.
Recommendation 10 That Cheltenham West Precinct 78 remains as a Residential Character Zone Historic Conservation Area.
City of Charles Sturt Residential Growth + Character Study - Report No 6: Review of
Identified Residential Historic Conservation Areas
P. 15
10 Henley Beach Precinct 79
Existing Character Statement The area around Marlborough Street and Crewe Street, south to Clarence Street/Durham Street generally features smaller villas and bungalows in the narrower streets. This is also the case south of the Bowling Club to Atkin Street, where small setbacks of 2 to 4 metres (with the exception of Main Street), add to the intimate nature of the area. Larger, grand villas, cottages and bungalows characterise Marlborough Street and East Terrace. South of Atkin Street, bungalows and Tudor homes of more recent vintage feature and allotments tend to be larger, incorporating setbacks of 5-8 metres. The presence of mature Norfolk Island pines along most of East Terrace contributes to the streetscape. This also serves to link the East Terrace to other tree lined streets to the west.
The circumstances for this Precinct are similar to those described for the preceding
two Precincts - approximately 80-90% of existing contributory places designated
within the Development Plan and very little change over the intervening period.
There is one cluster of non-contributory places on the southern side of
Marlborough Street and northern side of Crewe Street, west and east of Military
Road. However, contributory places are located opposite these sites and there is
considered to be little benefit in removing this small area from the RCZ HCA.
Recommendation 11 That Henley Beach Precinct 79 remains as a Residential Character Zone Historic Conservation Area.

City of Charles Sturt Residential Growth + Character Study - Report No 6: Review of
Identified Residential Historic Conservation Areas
P. 16
11 Grange Precinct 80
Existing Character Statement Grange Road The area along Grange Road from Military Road in the west to Surrey Street in the east is comprised of mainly bungalow and Tudor homes of moderate size, dating from 1920 to 1940. Allotments in this area range from about 600 square metres to 800 square metres. Setbacks of 4 to 6 metres makes development more intimate and dense than surrounding areas. Beach Street This area extends from Grange Uniting Church and Charles Sturt Avenue, westward to the foreshore at the Esplanade. The area is characterised by single storey Victorian houses and Federation bungalows. The Grange Institute, Grange Uniting Church and an early corner store form what would have been a focal point for social and community activity in Grange. A group of houses opposite the Uniting Church display consistent styling and use of materials, with gabled roofs clad with corrugated sheeting, use of bricks and similar verandah detailing with masonry piers and balustrades. The two largest houses in the area are located on the Esplanade and represent the development of Grange as a seaside resort. Setbacks on the south side of Beach Street are consistent, while set-backs on the northern side are more variable. Beach Street rises gradually toward the west and the houses set above the street. Small retaining walls border the footpath, forming the fence line. Elsewhere, fencing is kept simple and low, and is constructed either of masonry or iron sheeting. Norfolk Island Pines comprise part of the streetscape in the area. Jetty Street This area comprises bungalows, cottages, Tudor and villas, dating from the late 1800s in the west, to the 1920s in the east. Jetty Street itself features Norfolk Island Pines which act as a connecting feature to Grange Esplanade in the west. Allotments range in size from 600 - 800 square metres. A significant concentration of Tudor homes on Jetty Street (from Charles Sturt Avenue to High Street), forms the most consistent character of the area.

City of Charles Sturt Residential Growth + Character Study - Report No 6: Review of
Identified Residential Historic Conservation Areas
P. 17
Grange Esplanade This area is bounded by the Esplanade, Jetty Street and the houses on the eastern side of Seaview Road up to and including The Marines. The Marines is an imposing group of eight, three-storeyed attached terrace houses which are an example of some of the few remaining three-storey terraces in South Australia. The dominant building type in the area is multi-storey, characterised by the three storey Marines terrace houses and the two-storey Grange Hotel, both of which are built to the footpath. Detached dwellings of consistent scale and style occupy the east side of Seaview Road. The use of stone and brick is common to the majority of the buildings in the area with corrugated iron and terra cotta tiles as roofing material. The Esplanade and Seaview Road run parallel through the area giving it a strong linear character. The line of Seaview Road is emphasised by the Norfolk Island Pines, which also appear on other streets in the area. Building set-backs from the Esplanade and Seaview Road are reasonably consistent, being approximately three to four metres. Given that many houses are also set up from the road, Seaview Road is dominated by rendered retaining walls of varying heights between one to two metres, topped by a variety of fencing styles or remaining unfenced. Garages are of a mixed age and construction. The Grange Esplanade area should primarily accommodate residential development, the Grange Hotel and a small group of shops. Development on the Esplanade should have a maximum height of three storeys, be built to the street frontage to reflect The Marines and comprise attached dwellings to create a strong continuous built form element along the frontage. Development to the rear of these properties, on the western frontage to Seaview Road should have a maximum height of two storeys where compatible with adjacent development with regard to scale and siting. To the east of Seaview Road, given the retaining wall in this location, low or no fencing is appropriate. A maximum height of two stories along Seaview Road is appropriate where compatible with adjacent development with regard to scale, siting and character. Again, similar circumstances to the preceding Precincts - the majority of allotments
are designated as contributory places within the Development Plan and very little
change during the intervening period. No opportunities for rationalisation of the
Precinct boundaries were identified.
Accordingly, there is considered to be little justification in changing the current
Precinct boundaries.

City of Charles Sturt Residential Growth + Character Study - Report No 6: Review of
Identified Residential Historic Conservation Areas
P. 18
Recommendation 12 That Grange Policy Area 21 remains as a Residential Character Zone Historic Conservation Area.

City of Charles Sturt Residential Growth + Character Study - Report No 6: Review of
Identified Residential Historic Conservation Areas
P. 19
12 Figure 1 and Figure 2: Conservation Zone Recommendations
Remove from Residential Character Zone, Precinct 66 Bowden Brompton (see recommendation 1 & 2)
Include in Residential Character Zone, Historic Conservation Area (see recommendation 3)
Remove from Residential Character Zone, Precinct 66 Bowden Brompton (see recommendation 4)
Remove from Residential Character Zone, Precinct 67 Bowden Park (see recommendation 5)

City of Charles Sturt Residential Growth + Character Study - Report No 2 Opportunities and Constraints
P. 1
Top Related