


Languages
Pages
Legal


Institute of International Finance
China’s Economic and Financial Outlook
Highlights
China Macro-economic Climate Index
Source: Institute of International Finance, BOC
BOC Institute of International Finance
China Economic and Financial Research
Team
Leaders: Chen Weidong
Deputy leaders: Cao Yuanzheng
Zong Liang
Zhong Hong
Members: Zhou Jingtong
Li Jianjun
Li Peijia
Gao Yuwei
Li Yan
Liang Jing
Wang Min
(Global Trade Services Dept)
Chen Zhihua
(BOCIM)
Contact: Zhou Jingtong
Tel: 86-10-66592779
Email: [email protected]
● China’s economy continued to slow down in 2014 under the downward pressure from a deceleration in growth, painful economic restructuring
Annual Report 2015 (Issue 21) December 2, 2014
● China’s economy continued to slow in 2014 under the downward pressure from a deceleration in growth, painful economic restructuring and the hangover of previous stimulus policies. China’s GDP is expected to grow at around 7.4% in 2014 on an annualized basis, significantly lower than the annual average of 9.9% since the country launched its economic reform and opening-up policy in 1978. Overall, the Chinese economy remains within a reasonable range, accompanied by some positive changes in trend terms. ● China’s economy is shifting into a “new normal” with new engines of growth taking shape. In 2015, China's economy will move ahead steadily backed by the stable external environment with an uptrend, further release of reform dividends and emerging engines of growth, yet still under a downward pressure from the growth engine switchover, industrial capacity cuts, property market corrections and elevated debt ratios. China’s GDP is estimated to grow at about 7.2% and CPI to increase by approximately 2.4% in 2015 on an annualized basis, still showing a combination of slow growth and low inflation. ● Against such a backdrop, macroeconomic policy easing is expected. China’s fiscal policy will be more proactive, focused on optimizing structure and accelerating the fiscal system reform to promote inclusive growth. China’s monetary policy will be more flexible and pertinent while remaining prudent, with interest rates and reserve requirements expected to be lowered and RMB exchange rate to fluctuate more widely in both directions.

Global Economic and Financial Outlook
Institute of International Finance BOC 1 Year 2015
Explore New Growth Engines for the “New Normal” Economy
-- China's Economic and Financial Outlook (2015)
China’s economy continues to slow down in 2014 under the downward pressure from a
deceleration in growth, painful economic restructuring and the hangover of previous stimulus
policies. China’s GDP is expected to grow at around 7.4% in 2014 on an annualized basis,
significantly lower than the annual average of 9.9% since the country launched the economic
reform and opening-up policy in 1978. Generally speaking, however, the Chinese economy
remains within a reasonable range, and shows some positive trends. The tertiary industry,
principally service sectors, is growing swiftly and has a bigger proportion in the economy.
Emerging industries like E-commerce and mobile Internet are speeding development. Employment
and energy conservation indicators have beaten expectations. In 2015, China's economy will move
ahead steadily backed by a stable and upbeat external environment, further release of reform
dividends and emerging engines of growth, yet still under a downward pressure from growth
engine change over policies, industrial capacity cuts, property market corrections and elevated debt
ratios. In 2015, China’s GDP is estimated to grow at about 7.2% and CPI to increase by
approximately 2.4% on an annualized basis, still showing a combination of slow growth and low
inflation. China’s economy will embrace further optimized structure, higher efficiency and stronger
sustainability of development.
I. Economic Review and Outlook
I.1 Steady growth amid the switchover of growth engines, prices to remain at low levels
I.1.1 With growth “slow but improving”, GDP to grow by about 7.2% in 2015
In 2014, China’s economy has continued to slow, under the downward pressure from a deceleration
in growth, painful economic restructuring and the hangover of previous economic stimulus policies,
coupled by weakening demand, industrial overcapacity and property market adjustment. China’s
GDP is expected to grow at around 7.4% in 2014 on an annualized basis, significantly lower than
the annual average of 9.9% since the country launched its economic reform and opening-up policy
in 1978, and the lowest since 1990.
Firstly, why growth is slowing? The root cause for China’s economic deceleration in recent years
lies in the ongoing changes in its external environment and internal conditions. Globally, the
faltering global recovery, the long and bumpy road to rebalancing and the notable slowdown of
global market expansion suggest an increasingly tighter environment for China’s economic
development. Locally, China sees economic and financial risks gathering and increasing amid the
rising costs of production factors, heavier pressure on resources and environments, diminishing
comparative advantages, huge industrial overcapacity, elevated leverage ratio and weakening
profitability of enterprises. According to international experience, an economy will slow down
notably when its GDP per capita is in the range of USD4000 – USD12,500, falling into the
so-called “middle income trap”. China’s GDP per capita will break the USD7000 this year, staying
in a critical stage of getting away from the trap. The current deceleration and “gear shift” of the
Chinese economy are partially due to weakening demand and policy adjustments, and also the
combined effect of structural and long-term factors.

Global Economic and Financial Outlook
Institute of International Finance BOC 2 Year 2015
Figure 1: China’s Quarterly GDP Growth Figure 2: China Macro-economic Climate Index
Source: Wind; Institute of International Finance, BOC
Secondly, is structure optimized? In addition to the improved employment as analyzed in the last
quarter report, the economic bright spots in 2014 include notable structural optimization showing
continuous improvements in sustainability and balance of growth. Firstly, consumption contributes
markedly more to economic growth. In the first three quarters, final consumption contributed to
48.5% of economic growth, up 2.6 percentage points year-on-year, compared with 41.3% for
capital formation, down 14.5 percentage points from a year ago. Secondly, the tertiary industry is
growing more swiftly and gaining substantial weight, standing as a stronger pillar for economic
growth and employment. In the first three quarters, tertiary industry grew by 7.9%, 0.5 percentage
points higher than the GDP growth rate in the same period, and also 0.5 percentage points higher
than the growth rate of value added in secondary industries. Thirdly, emerging industries and new
business models are developing rapidly, with fast growth seen in such sectors as major
technologies and equipment, Internet, robots, e-commerce, energy conservation and environmental
protection (please see Special Analysis I). Those facts indicate that China is shifting its primary
growth engine from export-led manufacturing and infrastructure development to consumption and
innovation, shifting into a new normal of moderate growth, optimized structure and better quality.
Looking into 2015, the world economy will continue to struggle, mired in the recovery process
with still-weak engines of growth. Major economies will continue to vary in performance and
become further divergent in monetary policy, posing greater uncertainties to the global economy.
China is embracing a new normal featuring a change of growth engines and transformation of its
development model, with risks, challenges and opportunities coexisting. In 2015, China’s GDP is
expected to grow by about 7.2% as industrial overcapacity, high leverage ratio and ongoing shift to
new growth engines will further weigh on growth. We expect the government to set the target GDP
growth rate at about 7% for 2015, down 0.5 percentage point from 2014. Meanwhile, the tertiary
industry will account for about 48% of GDP, expected to contribute more to growth stabilization
and job creation. Consumption will contribute to about 50% of growth, 1 percentage point higher
than in 2014, with hot spots continuing. Central and western areas will remain the primary regional
engines of growth. In particular, the “One Belt and One Road” and Beijing-Tianjin-Hebei
integration will bring good development opportunities to provinces, municipalities and regions
involved. The sprouting of a new round of technological revolutions, including new energy
revolution, new-generation mobile Internet, robots and Big Data, will shape a new trend of
low-cost, smart and IT-driven growth.

Global Economic and Financial Outlook
Institute of International Finance BOC 3 Year 2015
It should be pointed out that China’s economy is gathering strength for the next boom cycle as the
new growth engines are beginning to take up and reform dividends are gradually released.
Probably 2015 will be near or at the bottom of China’s ongoing downturn.
I.1.2 CPI to rise by about 2.4% under mild inflation pressure
In 2014, prices have mainly showed the following three characteristics: Firstly, inflation is mild.
CPI rose by 2.1% cumulatively in the first ten months, down 0.5 percentage points from a year ago,
representing the lowest year-on-year growth since 2009. Secondly, price movements are irregular
and reverse-U shaped (high in the middle and low on ends) on an annualized basis, partially
attributable to the carryover effect of CPI growth in 2014. The carryover effect was 1.06, 1.51, 1.0
and 0.17 in the first to fourth quarters of 2014, respectively. Third, PPI growth was negative for 32
consecutive months. PPI declined by 1.7% cumulatively in the first ten months of 2014, with
quarter-on-quarter growth negative for ten consecutive months. The negative PPI growth was
mainly due to cheaper capital goods and zero price growth of consumption goods. In capital goods
price decline was seen in the mining industry (-5.4%), raw material industry (-2.5%) and
processing industry (-1.7%). As for consumption goods, except consumer durables (-0.9%), foods,
clothing and daily necessities saw price inflation. In 2014, the slower CPI growth and the negative
PPI growth bore close relations to economic downturn, weakening demand and industrial
overcapacity.
Figure 3: Reverse U-Shaped CPI Curve Figure 4: PPI Negative for 32 Consecutive Months
Source: Wind; Institute of International Finance, BOC
In 2015, prices will remain at low levels. Firstly, economic growth will slow down further. The
overall supply-demand relationship will pull inflation low. We expect GDP to grow by about 7.2%,
slightly down 0.2 percentage points from 2014. Secondly, food and housing prices will not rise
sharply. The two categories of consumer goods together have a weight of about 50% in the CPI
basket, coming as the biggest contributor to price movements. Thirdly, prices of crude oil and other
international commodities will remain at low levels amid mild global growth and US energy
revolution. Crude oil prices are estimated to be USD80 to USD90 in 2015. Fourthly, the overall
money and credit environment will be stable. Fifthly, industrial overcapacity will remain a serious
problem and it is difficult for PPI to turn positive in the short term. However, the price reform of
public utilities and population structure changes will lead to price inflation in some service sectors
and likely drive up the CPI.
According to a preliminary estimation, the CPI will be about 2.4% in 2015, up 0.4 percentage
Global Economic and Financial Outlook
Institute of International Finance BOC 4 Year 2015
points from 2014; PPI will drop 0.5%, representing an improvement of 1.3 percentage points
compared with this year.
I.2 Demand structure to be further optimized, consumption to contribute more
I.2.1 Infrastructure projects continues to grow fast as the major stabilizer of investment
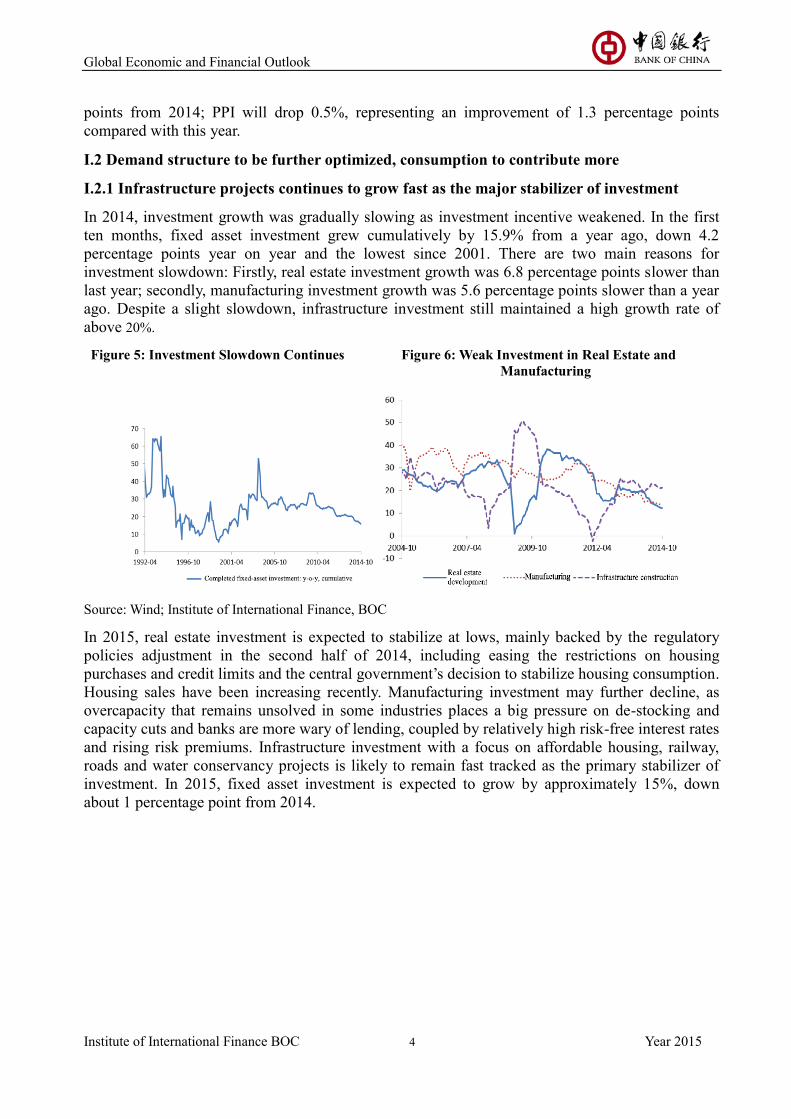
In 2014, investment growth was gradually slowing as investment incentive weakened. In the first
ten months, fixed asset investment grew cumulatively by 15.9% from a year ago, down 4.2
percentage points year on year and the lowest since 2001. There are two main reasons for
investment slowdown: Firstly, real estate investment growth was 6.8 percentage points slower than
last year; secondly, manufacturing investment growth was 5.6 percentage points slower than a year
ago. Despite a slight slowdown, infrastructure investment still maintained a high growth rate of
above 20%.
Figure 5: Investment Slowdown Continues Figure 6: Weak Investment in Real Estate and
Manufacturing
Source: Wind; Institute of International Finance, BOC
In 2015, real estate investment is expected to stabilize at lows, mainly backed by the regulatory
policies adjustment in the second half of 2014, including easing the restrictions on housing
purchases and credit limits and the central government’s decision to stabilize housing consumption.
Housing sales have been increasing recently. Manufacturing investment may further decline, as
overcapacity that remains unsolved in some industries places a big pressure on de-stocking and
capacity cuts and banks are more wary of lending, coupled by relatively high risk-free interest rates
and rising risk premiums. Infrastructure investment with a focus on affordable housing, railway,
roads and water conservancy projects is likely to remain fast tracked as the primary stabilizer of
investment. In 2015, fixed asset investment is expected to grow by approximately 15%, down
about 1 percentage point from 2014.

Global Economic and Financial Outlook
Institute of International Finance BOC 5 Year 2015
Figure 7: Property Sales Start to Pick Up Figure 8: Risk-free Interest Rates Remain High
Source: Wind; Institute of International Finance, BOC
I.2.2 Consumption growth remains stable, but hard to pick up notably
Overall consumption growth has been stable in 2014. In the first ten months, total retail sales of
consumer goods grew by 12% year-on-year cumulatively, 1 percentage point slower than a year
ago. Furthermore, it is also stable after adjusting for inflation. Consumption growth slowed slightly,
mainly due to sluggish growth in food, beverage and tobacco, automobile, petroleum and its
products as well as household appliances and audio-visual equipment. The rapid growth of
telecoms equipment and furniture and building and decoration materials offset some of the
consumption downturn.
Figure 9: Stepwise Decline in Consumption Growth Figure 10: Consumption Growth by Sub-sectors
Source: Wind; Institute of International Finance, BOC
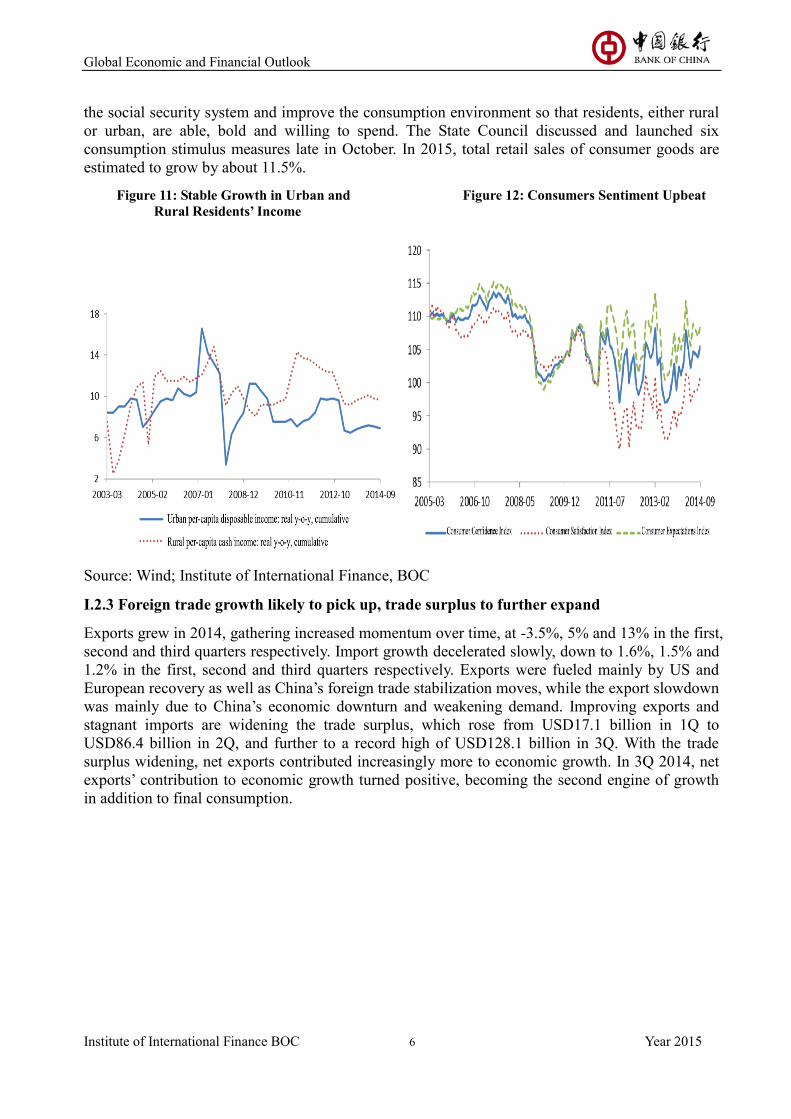
In the first nine months of 2014, urban per-capita disposable income and rural per-capita cash
income grew by 6.9% and 9.7% cumulatively, both up 0.1 percentage points year-on-year.
Consumers are upbeat about future income and consumption prospects, which is also a strong
stabilizer of consumption growth. The Consumer Confidence Index for September 2014 was 105.4,
higher than 100 for the ten consecutive month and representing a half-year high. With respect to
government policy, the central government clearly stated to increase residents’ income, improve
Global Economic and Financial Outlook
Institute of International Finance BOC 6 Year 2015
the social security system and improve the consumption environment so that residents, either rural
or urban, are able, bold and willing to spend. The State Council discussed and launched six
consumption stimulus measures late in October. In 2015, total retail sales of consumer goods are
estimated to grow by about 11.5%.
Figure 11: Stable Growth in Urban and Figure 12: Consumers Sentiment Upbeat
Rural Residents’ Income
Source: Wind; Institute of International Finance, BOC
I.2.3 Foreign trade growth likely to pick up, trade surplus to further expand
Exports grew in 2014, gathering increased momentum over time, at -3.5%, 5% and 13% in the first,
second and third quarters respectively. Import growth decelerated slowly, down to 1.6%, 1.5% and
1.2% in the first, second and third quarters respectively. Exports were fueled mainly by US and
European recovery as well as China’s foreign trade stabilization moves, while the export slowdown
was mainly due to China’s economic downturn and weakening demand. Improving exports and
stagnant imports are widening the trade surplus, which rose from USD17.1 billion in 1Q to
USD86.4 billion in 2Q, and further to a record high of USD128.1 billion in 3Q. With the trade
surplus widening, net exports contributed increasingly more to economic growth. In 3Q 2014, net
exports’ contribution to economic growth turned positive, becoming the second engine of growth
in addition to final consumption.

Global Economic and Financial Outlook
Institute of International Finance BOC 7 Year 2015
Figure 13: Better Exports & Bigger Surplus Figure 14: Changes in Contributors to
Economic Growth
\
Source: Wind; Institute of International Finance, BOC
In 2015, the US economy is expected to continue a strong recovery, while the euro zone will
continue its monetary easing and maintain a growing demand for exports from China. Driven by
the setup of China-South Korea Free Trade Area (FTA), the upgrade of China-ASEAN FTA and
the further implementation of the “One Belt and One Road” strategy, China will see rapid growth
in its exports to South Korea, ASEAN, India and Russia. Also, the central government’s policies to
strengthen imports and encourage importing of cutting-edge technologies and equipment as well as
critical parts and components will increase the level of trade facilitation. In 2015, exports are
estimated to grow by about 8%, up 2 percentage points from 2014, imports to grow by about 5%,
up 2 percentage points from 2014 and trade surplus to exceed USD390 billion, an increase of more
than USD60 billion when compared with 2014.
Figure 15: US, Europe and Japan Figure 16: China Manufacturing PMI
Manufacturing PMI – New Export Orders
Global Economic and Financial Outlook
Institute of International Finance BOC 8 Year 2015
Source: Wind; Institute of International Finance, BOC
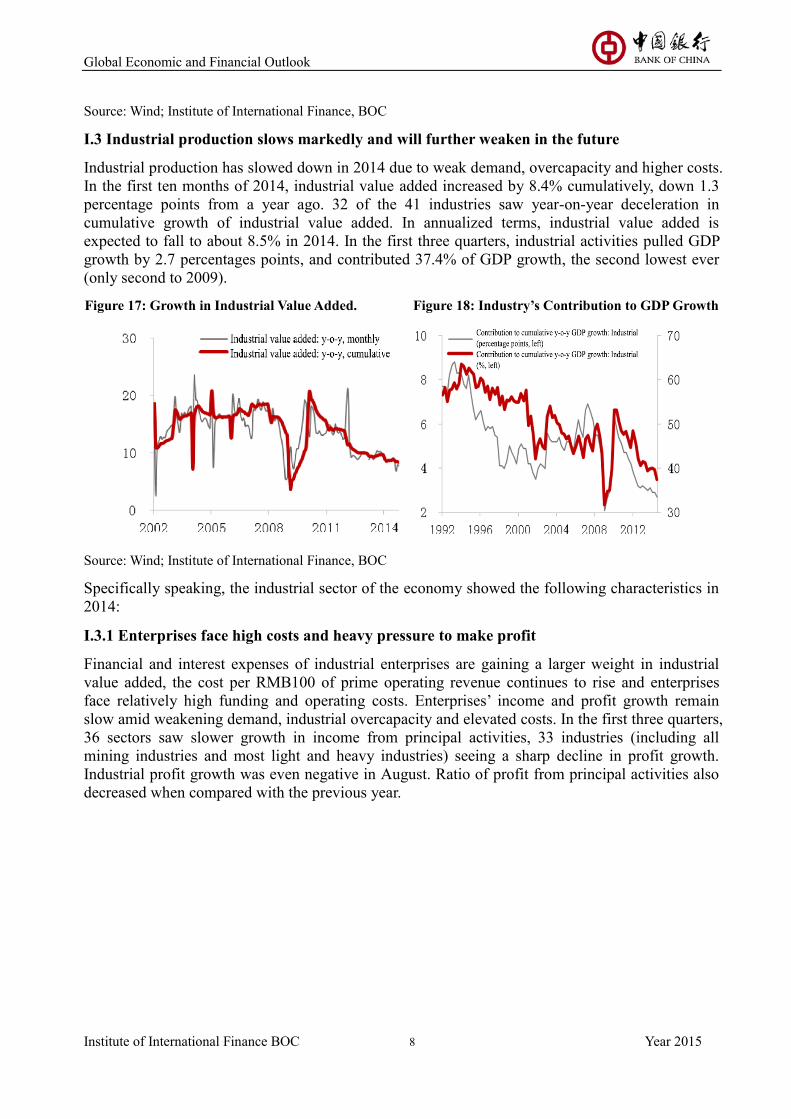
I.3 Industrial production slows markedly and will further weaken in the future
Industrial production has slowed down in 2014 due to weak demand, overcapacity and higher costs.
In the first ten months of 2014, industrial value added increased by 8.4% cumulatively, down 1.3
percentage points from a year ago. 32 of the 41 industries saw year-on-year deceleration in
cumulative growth of industrial value added. In annualized terms, industrial value added is
expected to fall to about 8.5% in 2014. In the first three quarters, industrial activities pulled GDP
growth by 2.7 percentages points, and contributed 37.4% of GDP growth, the second lowest ever
(only second to 2009).
Figure 17: Growth in Industrial Value Added. Figure 18: Industry’s Contribution to GDP Growth
Source: Wind; Institute of International Finance, BOC
Specifically speaking, the industrial sector of the economy showed the following characteristics in
2014:
I.3.1 Enterprises face high costs and heavy pressure to make profit
Financial and interest expenses of industrial enterprises are gaining a larger weight in industrial
value added, the cost per RMB100 of prime operating revenue continues to rise and enterprises
face relatively high funding and operating costs. Enterprises’ income and profit growth remain
slow amid weakening demand, industrial overcapacity and elevated costs. In the first three quarters,
36 sectors saw slower growth in income from principal activities, 33 industries (including all
mining industries and most light and heavy industries) seeing a sharp decline in profit growth.
Industrial profit growth was even negative in August. Ratio of profit from principal activities also
decreased when compared with the previous year.

Global Economic and Financial Outlook
Institute of International Finance BOC 9 Year 2015
Figure 19: Changes in Costs of Enterprises Figure 20: Income and Profit Curves of Enterprises
Source: Wind; Institute of International Finance, BOC
I.3.2. Most sectors are in the stage of passive restocking
In 2014, industrial value added declined continuously year-on-year, but inventory showed
substantial cumulative growth year-on-year. Industrial sectors were in the stage of passive
restocking. By sectors, in the first three quarters, ten sectors (i.e. petroleum and natural gas
extraction, tobacco products, textile and apparel, manufacture of furniture, manufacture of
general-purpose equipment, manufacture of special-purpose equipment, manufacture of railway
and other transport equipment, manufacture of communication equipment, computers and other
electronic equipment, gas production and supply and other manufacturing) were in the stage of
active restocking characterized by increase in industrial value added and increase in inventory.
Four sectors (i.e. nonferrous metals mining and dressing, manufacture of alcohol, beverages and
refined tea, manufacture of cultural, educational and sports goods and manufacture of chemical
fibers) are in the stage of active de-stocking characterized by a decline in industrial value added
and increase in inventory, two sectors (e.g. reuse of waste resources and water production and
supply) were in the stage of passive de-stocking characterized by an increase in industrial value
added and decline in inventory, and the other 25 sectors (including most mining and heavy
industries) were in the stage of passive restocking characterized by a decline in industrial value
added and an increase in inventory.
I.3.3 Industrial overcapacity is eased, but de-capacity remains challenging
Due to weak demand and industrial over capacities, the production of steel, electrolytic aluminum,
cement and flat glass fell year-on-year; in particular, steel, cement and flat glass dropped
substantially. Industrial value added, income and ratio of profit from principal activities in relevant
industries declined year-on-year. Since 2012, driven by the government policy to step up
overcapacity cuts, fixed asset investment in relevant industries has fallen significantly, the
objective of outdated capacity elimination has been met to schedule and the capacity utilization
ratio has been increased for steel, cement, electrolytic aluminum and flat glass. Taking into
consideration the fact that most industries are experiencing passive restocking and over capacities
are still building up, “de-capacity” remains a significant challenge.

Global Economic and Financial Outlook
Institute of International Finance BOC 10 Year 2015
Figure 21: Inventory of Industrial Enterprises Figure 22: Capacity Utilization Rate of Industries
with Overcapacities
Source: Wind; Institute of International Finance, BOC
In 2015, contributors to industrial production growth will include the following: Firstly, the gradual
recovery of the global economy, in particular the US economy, the ongoing regional economic
integration, the interconnections with Asian Pacific, European and other neighboring nations that
are turning from plan to reality. In addition, China’s deepening economic and financial cooperation
with neighboring countries will increase exports and fuel industrial production, especially, the
growth in infrastructure, telecommunications and equipment manufacturing. Secondly, China’s
expanding investment in urban infrastructure, railways in central and western parts of the country,
and dilapidated shantytown redevelopment will drive up relevant industrial production.
Meanwhile, barriers to industrial production growth include the following: macro-economy is
under heavy downward pressure and domestic demand is weakening; industries with over
capacities have a low capacity utilization rate and will adjust continuously in the “new normal”
economy. Enterprises' profitability is weakening due to rising costs of labor, land, environment and
funds; industrial enterprises are much less willing to invest, which means less potential of
industrial capacity in the future. Based on the above analysis, industrial value added is estimated to
grow by about 8.3% in 2015.
I.4 Property market
I.4.1 Real estate investment to see the biggest decline ever
Real estate investment continues a downturn movement amid weak investor confidence, sluggish
sales and tight financing environment. In the first ten months of 2014, real estate investment stood
at RMB7.7 trillion cumulatively, representing a year-on-year growth of 12.4%, 6.8 percentage
points slower than a year ago. Real estate investment is estimated to expand by 12% in 2014 in
annualized terms, the lowest since the housing reform started in 1998. In 2015, real estate
investment is likely to bottom out as new construction areas expand continuously, availability of
funding sources increases and confidence gets stronger on both demand and supply sides.

Global Economic and Financial Outlook
Institute of International Finance BOC 11 Year 2015
Figure 23: Real Estate Investment Growth Hits All-time Low
Source: Wind; Institute of International Finance, BOC
I.4.2 Decline in property sales continued but moderated
In the first ten months of 2014, the commercial housing sales area nationwide stood at 880 million
m2, down 7.8%, compared with a 21.8% increase a year ago. In 2014, property sales are estimated
to drop by 7% year-on-year in annualized terms, a decline only second to the biggest one recorded
in 2008. In spite of continuous negative growth in property sales, the property market has been
improving in 4Q. The rate of property sales in the first ten months indicated a decline of 0.8
percentage points less than in the first three quarters.
Figure 24: Sold Floor Area on the Decline
Source: Wind; Institute of International Finance, BOC
Decline in property prices continued but moderated. In October, residential housing prices in 100
monitored cities dipped 0.4% quarter-on-quarter, representing a decline for the sixth consecutive
month, but 0.52 percentage points less than the first three quarters. Residential housing prices in
tier-one cities fell the least, by only 0.07% quarter-on-quarter, 0.81% percentage points less than
the first three quarters. In addition, a smaller number of cities saw property price falls. In October,
73 of the 100 monitored cities recorded a quarter-on-quarter decline in residential property prices,
six fewer than the first three quarters.

Global Economic and Financial Outlook
Institute of International Finance BOC 12 Year 2015
Table 1: Housing Price Changes in 100 Cities in 2014 (y-o-y and q-o-q, %)
Source: Wind; Institute of International Finance, BOC
I.4.3 Funding of real estate development hit historical low, yet improving recently
In the first ten months, funding made available to property developers grew by only 3.1%, 24.1%
percentage points lower than a year ago. In 2014, funding made available to property developers is
estimated to grow by 4% year-on-year in annualized terms, the lowest since 1998. The contributors
to insufficiency of real estate development funding include; property developers’ lack of
investment confidence, sluggish sales, slow cash recovery and tight financing environment. It is
noteworthy that this indicator has being showing improvement since the 4Q. In October, funding of
real estate development accelerated by 0.8 percentage points when compared with the first three
quarters.
Figure 25: Funding Available to Property Developers Hit All-time Low
Source: Wind; Institute of International Finance, BOC
I.4.4. Some leading indicators including land purchases continue improving
Since the 4Q, property developers have had their investment confidence restored as local
governments lifted restrictions on housing purchases and lending, providing stronger tax supports
and real estate credits which became more available. In the first ten months, purchased land area
expanded by 1.2% cumulatively year on year, putting an end to seven-month run of negative
growth. New construction areas fell by 5.5% cumulatively, 3.8 percentage points less than the first
three quarters; floor space under development grew by 12.3%, 0.8 percentage points higher than
the first three quarters.

Global Economic and Financial Outlook
Institute of International Finance BOC 13 Year 2015
I.4.5 Real estate policy is more counter-cyclical and market-based
As the property market started adjustments nationwide, the central and local governments modified
property curb policy in the 2H 2014. Firstly, such administrative measures as restrictions on
housing purchases and lending were lifted. Currently only a few tier-one cities, including Beijing
and Shanghai, maintain purchase and lending restrictions. Secondly, strong credit supports have
been provided for home purchases. PBOC and other authorities issued policies to expedite housing
loan approval, relax the standard for identification of first housing buyers and lower interest rate of
housing loans in May and September. Thirdly, tax cuts relating to housing purchase were
introduced and more subsidies were granted to home buyers. Such policies have played a positive
role in steadily releasing housing demand and stabilizing the property market.
Figure 26: Moderating Declines in Purchased Land Area and Floor Space Newly Started
Source: Wind; Institute of International Finance, BOC
In 2015, some large cities will take the lead in property market recovery and drive the entire
property market to bottom out, as local governments further relax housing purchases and
strengthen personal mortgage supports. However, this round of property market adjustments will
continue, for such adjustments are triggered more by fundamental factors, including the speed and
focus of macroeconomic growth, changes in the demand-supply relationship of property market
and aging population. Overall, China's property market will bottom out in 2015, albeit modestly.
Specifically speaking, firstly, real estate investment will see a modest decline while maintaining
overall stability. Real estate investment is estimated to grow by approximately 10% year-on-year in
2015. Secondly, property sales will fall before starting an upturn in the second half of the year. As
local governments’ easing policies further take effect, housing loans become available more easily,
the decline in property sales will moderate gradually, and property sales are expected to record a
positive year-on-year growth in 2H 2015. Thirdly, property prices will become divergent again.
Tier-three and tier-four cities will continue to see property price adjustment due to excessive stock,
while some regions like tier-one cities (Beijing, Shanghai, Guangzhou and Shenzhen) will be the
first to see a mild pickup in property prices as sales improve. Most cities will likely find their
property prices flat with the current level.
II. Financial Review and Outlook
In 2014, the financial market maintained overall stability, money supply and RMB credits grew
moderately, the expansion of aggregate financing to the real economy slowed down,

Global Economic and Financial Outlook
Institute of International Finance BOC 14 Year 2015
off-balance-sheet financing shrank, the stock market recovered and the RMB exchange rate
fluctuated notably in both directions. In 2015, we expect M2 and RMB loans to remain on track for
stable growth, direct financing to further gain a bigger weight, market liquidity to be eased
moderately, capital market to continue recovery and RMB exchange rate to fluctuate more widely.
II.1 Money and credit: stable growth in a sound overall situation
II.1.1 Money supply growth moderated, but still within the expected range
As at the end of October 2014, the balance of broad money supply (M2) was RMB119.92 trillion,
representing a year-on-year increase of 12.6%, 1 percentage points lower when compared with the
end of the prior year. The balance of narrow money supply (M1) stood at RMB32.96 trillion,
representing a year-on-year increase of 3.2%, 6.1 percentage points lower when compared with the
end of prior year. The deceleration of M2 growth is attributable mainly to economic restructuring
and tightening regulatory measures. M1 growth has hit a low in recent years, reflecting enterprises’
current weak business activities and unwillingness to hold too many demand deposits with banks.
M2 is expected to grow by about 13% in 2014.
In 2015, M2 is estimated to grow by around 12.5% as economic growth moderates, inflation
remains low and money supply declines.
Figure 27: Moderating Growth in Money Supply
Source: Wind; Institute of International Finance, BOC
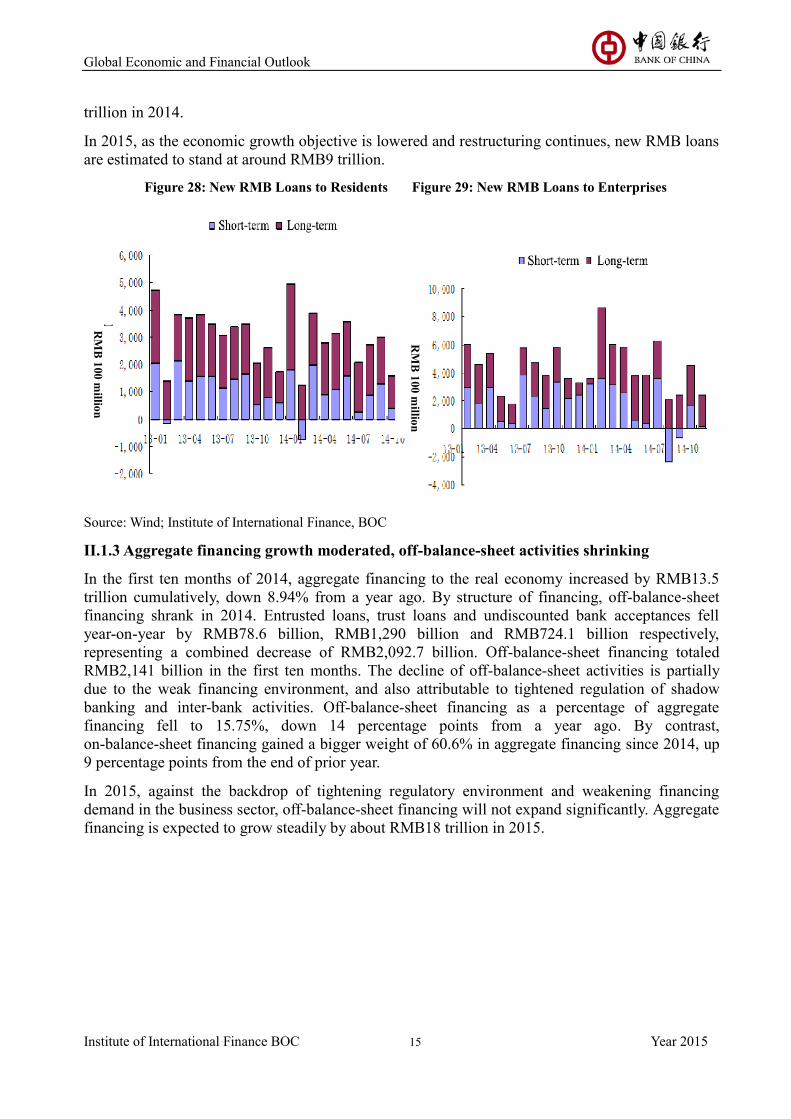
II.1.2 Overall credit growth was stable, medium- and long-term loans growing faster
New RMB lending by financial institutions was RMB8.23 trillion in the first ten months of 2014,
an increase of 5.8% year-on-year. In October, RMB loans added by RMB548.3 billion, RMB42.3
billion more than a year ago. Except notes financing, loans to all sectors in October showed
declines, yet varying in degree. In October, short-term and long-term loans to residents dropped by
RMB12.4 billion and RMB34 billion respectively year-on-year, both continuing a downtrend
through the year and suggesting still-weak demand for consumption and home purchases. In
October, short-term loans to enterprises only added by RMB17.9 billion, RMB196.9 billion less
than a year ago, representing a six-month year-on-year decline in a row and suggesting weak
business activities of enterprises. Medium- and long-term loans to enterprises rose by RMB79.2
billion, continuing year-on-year growth through the year and reflecting the supports of monetary
easing for medium- and long-term financing. New RMB loans are expected to be about RMB9
Global Economic and Financial Outlook
Institute of International Finance BOC 15 Year 2015
trillion in 2014.
In 2015, as the economic growth objective is lowered and restructuring continues, new RMB loans
are estimated to stand at around RMB9 trillion.
Figure 28: New RMB Loans to Residents Figure 29: New RMB Loans to Enterprises
Source: Wind; Institute of International Finance, BOC
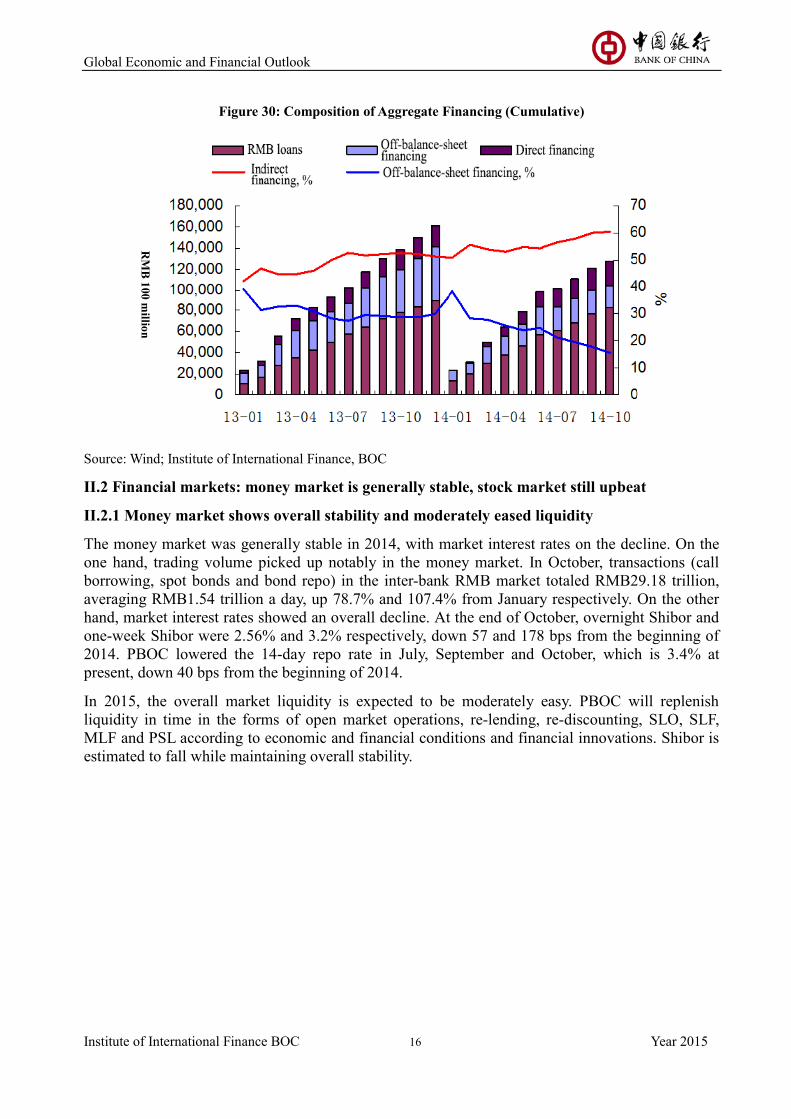
II.1.3 Aggregate financing growth moderated, off-balance-sheet activities shrinking
In the first ten months of 2014, aggregate financing to the real economy increased by RMB13.5
trillion cumulatively, down 8.94% from a year ago. By structure of financing, off-balance-sheet
financing shrank in 2014. Entrusted loans, trust loans and undiscounted bank acceptances fell
year-on-year by RMB78.6 billion, RMB1,290 billion and RMB724.1 billion respectively,
representing a combined decrease of RMB2,092.7 billion. Off-balance-sheet financing totaled
RMB2,141 billion in the first ten months. The decline of off-balance-sheet activities is partially
due to the weak financing environment, and also attributable to tightened regulation of shadow
banking and inter-bank activities. Off-balance-sheet financing as a percentage of aggregate
financing fell to 15.75%, down 14 percentage points from a year ago. By contrast,
on-balance-sheet financing gained a bigger weight of 60.6% in aggregate financing since 2014, up
9 percentage points from the end of prior year.
In 2015, against the backdrop of tightening regulatory environment and weakening financing
demand in the business sector, off-balance-sheet financing will not expand significantly. Aggregate
financing is expected to grow steadily by about RMB18 trillion in 2015.
RM
B 1
00
millio
n
RM
B 1
00
millio
n
Global Economic and Financial Outlook
Institute of International Finance BOC 16 Year 2015
Figure 30: Composition of Aggregate Financing (Cumulative)
Source: Wind; Institute of International Finance, BOC
II.2 Financial markets: money market is generally stable, stock market still upbeat
II.2.1 Money market shows overall stability and moderately eased liquidity
The money market was generally stable in 2014, with market interest rates on the decline. On the
one hand, trading volume picked up notably in the money market. In October, transactions (call
borrowing, spot bonds and bond repo) in the inter-bank RMB market totaled RMB29.18 trillion,
averaging RMB1.54 trillion a day, up 78.7% and 107.4% from January respectively. On the other
hand, market interest rates showed an overall decline. At the end of October, overnight Shibor and
one-week Shibor were 2.56% and 3.2% respectively, down 57 and 178 bps from the beginning of
2014. PBOC lowered the 14-day repo rate in July, September and October, which is 3.4% at
present, down 40 bps from the beginning of 2014.
In 2015, the overall market liquidity is expected to be moderately easy. PBOC will replenish
liquidity in time in the forms of open market operations, re-lending, re-discounting, SLO, SLF,
MLF and PSL according to economic and financial conditions and financial innovations. Shibor is
estimated to fall while maintaining overall stability.
RM
B 1
00
millio
n

Global Economic and Financial Outlook
Institute of International Finance BOC 17 Year 2015
Figure 31: Shibor Movements
Source: Wind; Institute of International Finance, BOC
II.2.2 Shanghai-Hong Kong Stock Connect further liberalizes capital market, stock market
still upbeat
The stock market is in an uptrend in 2014. The Shanghai Stock Exchange (SSE) Composite Index
closed at 2533 in November 24, up 20.1% from 2109 in the beginning of the year. Meanwhile, both
SSE and Shenzhen Stock Exchange (SZSE) saw a substantial increase in trading volume, in
particular in 3Q when daily trades averaged RMB293.3 billion, up 39.5% from RMB210.2 billion
in 1Q. The overall stock upturn is attributable to foreign capital influx, moderate liquidity easing
and the Shanghai-Hong Kong Stock Connect scheme.
In 2015, the stock market will be driven by the government’s stronger effort in reform and
innovation and acceleration of the multi-level capital market drive. However, the capital market
faces uncertainties posed by the weak global economy, geopolitical risk on the rise and China’s
economy still under downside pressure. The acceleration of cross-border capital flows may also
make the stock market more volatile.

Global Economic and Financial Outlook
Institute of International Finance BOC 18 Year 2015
Figure 32: Movements of SSE and SZSE Stock Indices
Source: Wind; Institute of International Finance, BOC
II.2.3 RMB exchange rate likely to pick up slightly, swinging more widely in both directions
Up to the end of October 2014, the middle exchange rate of RMB against USD was 6.1461,
representing a mild depreciation of 0.77% when compared with the beginning of 2014. Overall,
RMB exchange rate against USD experienced two phases in 2014: The first phase was the period
from January through May when the RMB fell in value continuously against USD, by 1.16%
cumulatively. The second phase started from June, featuring an overall increase and notable
two-way fluctuations of RMB exchange rate against USD. At the end of October, the middle
exchange rate of RMB against USD rose slightly by 0.38% from the end of May.
In 2015, RMB exchange rate against USD is estimated to further rise slightly while fluctuating
more widely in both directions. At present, China’s relatively high growth rate, coupled by
expanding trade surplus and attractiveness to global capital, will push the RMB to appreciate
slightly. Also, the RMB exchange rate is backed by the acceleration of China’s financial reform
and RMB internationalization. On the other hand, the two-way movement of RMB exchange rate
against USD will be more notable: Firstly, China’s current account surplus as a percentage of GDP
fell from the 2007 peak of 10% to 2.1% in 2013. As the current account balance is moving
increasingly closer to zero, RMB exchange rate is near its equilibrium level and unlikely to rise or
fall continuously. Secondly, the trading range of the RMB against the USD widened from 1% to
2% on March 17, 2014, and is expected to further expand in the future. Thirdly, the US Federal
Reserve officially announced the end of QE in late October, expected to start rate rises in 2015, and
PBOC announced rate cuts on November 21. As the interest rate spread between China and the US
narrows, two-way movements of international capital will become normal.

Global Economic and Financial Outlook
Institute of International Finance BOC 19 Year 2015
Figure 33: Movements of RMB Exchange Rate against US Dollar
Source: Wind; Institute of International Finance, BOC
II.3 BOC Cross-border RMB Index
The BOC Cross-border RMB Index (CRI) published recently for September 2015 was 243. CRI
movements showed the following characteristics in 2014: Firstly, showing an overall trend of
stable growth, CRI hit a peak in the 1Q before starting a slow downturn, which gained speed
notably in July and August, and returned to an upward trend in September. Secondly, RMB use
became more active under direct investment, standing as the main contributor to CRI rises in the
year. Thirdly, net cross-border RMB flows remain outgoing, yet in a downtrend, representing
increasingly balanced use of RMB in cross-border payments. Fourthly, overseas RMB use became
broader and more active. With use of RMB expanding fast in Asia, Europe, the US and Australia,
RMB remains the world’s seventh largest payment currency.
Source: Wind; Global Trade Services Department of BOC
BOC Cross-border RMB Index (CRI)
Figure 34: BOC Cross-border RMB Index (CRI)

Global Economic and Financial Outlook
Institute of International Finance BOC 20 Year 2015
According to the White Paper on RMB Internationalization Business (2014) published by the BOC
on November 4, 2014, compared with 2013, domestic and overseas enterprises were more upbeat
about the international status of the RMB, laying a stronger foundation for cross-border RMB use.
RMB use in payments among overseas third parties improved notably, suggesting a further boost in
the international pricing function.
With regard to financial products, overseas RMB financial services became available more broadly,
with a wider range of products offered after one year of development. Settlement products, as the
most commonly used cross-border RMB products, contributed most to the convenience of
cross-border RMB use. Fortune 500 companies participated more in the RMB internationalization,
taking a more mature attitude towards RMB exchange rate fluctuations.
The BOC has received positive comments on its cross-border RMB products and services from the
majority of surveyed enterprises. In particular, the integrated domestic and overseas services of the
BOC are mostly recognized among corporate customers.
Table 2: Forecasts on China’s Main Economic and Financial Indicators in 2014-15 (%)
Indicator 2010
(R)
2011
(R)
2012
(R)
2013
(R)
2014
(E)
2015
(F)
GDP 10.4 9.3 7.7 7.7 7.4 7.2
Added value of industrial
enterprises with annual
revenue of RMB20
million or more from their
main business operations
15.7 13.9 10 9.7 8.5 8.3
Fixed asset investment 24.5 23.8 20.6 19.6 16.0 15.0
Total retail sales of
consumer goods 18.4 17.1 14.3 13.1 12.1 11.5
Export 31.3 20.3 7.9 7.9 6.0 8.0
Import 38.3 24.9 4.3 7.2 3.0 5.0
Consumer Price Index
(CPI) 3.3 5.4 2.6 2.6 2.0 2.4
Producer Price Index
(PPI) 5.5 6.0 -1.7 -1.9 -1.8 -0.5
Broad money supply (M2,
end of period) 19.7 13.6 13.8 13.6 13.0 12.5
Source: Institute of International Finance, BOC

Global Economic and Financial Outlook
Institute of International Finance BOC 21 Year 2015
III. Direction of Macro Policies
III.1 Fiscal policy to be more proactive to energize the market with innovation and reform
In 2015, the fiscal policy will be more proactive, likely to push up government deficits. Meanwhile,
focus will be placed on optimizing public spending structure, innovating financing methods,
improving structural tax cuts and further deepening the fiscal and taxation system reform.
Firstly, optimize the structure of fiscal expenditure and innovation with investment and
financing mechanisms in key fields. Against the backdrop of an economic downturn, government
revenue growth slowed while inflexible spending on people’s livelihood is not cut, indicating
sharper contradictions between fiscal revenue and expenditure. Therefore, the government will
further cut general spending in 2015 and allocate more funds for agriculture-related activities,
social security, small and micro businesses, technological innovation, strategic emerging industries
and water conservancy. Also, the government will introduce innovative investment and financing
mechanisms, promote the public-private partnership (PPP), allow social capital, in particular
private capital, to invest in hydro-power, nuclear power, railways, ports, inland navigation facilities
and hub airports, trunk airports, urban water supply and heating, treatment of waste-water and
municipal solid wastes and public transportation, provide a larger arena for effective social
investment and further stimulate the activity and development potential of market participants.
Secondly, improve the structural tax cut policy and further tax reforms in key fields. The
government will further implement preferential tax policies, including those for small and micro
businesses, and continue to consider and issue relevant supporting policies according to economic
situation developments. In 2015, tax reforms are expected to go further in the fields of value added
tax (VAT), consumption tax, resource tax, environmental protection tax, real estate tax and
personal income tax. The business tax-to-VAT” reform, which was extended to railway transport,
postal services and telecommunications in 2014, will be further expanded to life services,
construction, real estate and financial services to achieve full coverage in 2015. In addition, the
consumption tax reform will likely proceed to the deployment stage in 2015, the resource tax
reform may be extended to major mineral products in addition to coals, the legislation of real estate
tax and environmental protection tax will be accelerated and an “integrated” new mechanism will
be gradually created for personal income tax.
Thirdly, deepen the fiscal and taxation system reform to prevent and mitigate public finance
risk. China will expand the pilot program on local government bond issuance to replace LGFVs,
promote the PPP model and speed up the effort to establish a disciplined borrowing and financing
mechanism for local governments to prevent and mitigate public finance risk. Also, with the aim of
implementing the Overall Plan for Deepening Fiscal and Taxation System Reform and accelerate
the establishment of a modern public financial system, the Chinese government will move ahead
with urgency regarding tax reform, reallocation of expenditure responsibilities between central and
local governments and local tax system development.
III.2 Monetary policy to remain prudent with greater flexibility and pertinence
In 2015, from the perspective of keeping policy continuous and stable, PBOC will continue its
prudent monetary policy to provide a moderately neutral monetary and financial environment for
economic restructuring, transformation and upgrading. Meanwhile, the monetary policy may
become more flexible and pertinent according to changes in then macroeconomic and financial
environments.
Firstly, Money supply will remain stable while its structure will be optimized. The monetary
policy will remain prudent and stable in aggregate money supply, taking into consideration the

Global Economic and Financial Outlook
Institute of International Finance BOC 22 Year 2015
economic downturn and low price levels in 2015. We expect the government to set the M2 growth
rate at 12% for 2015. Also, the current monetary policy also shoulders the responsibility for
economic restructuring. PBOC is expected to continue to use and innovate in structural policy
instruments and continue to adopt target-specific control policies.
Secondly, the likelihood of further rate cuts is on the rise. PBOC lowered the benchmark rates
of deposits and loans in late November 2014. The benchmark rate of one-year lending was reduced
by 0.4 percentage points to 5.6%; the benchmark rate of one-year deposit was lowered by 0.25
percentage point to 2.75%. These rate cuts were intended mainly to mitigate the elevated costs of
enterprises and ensure the healthiness of economic growth. Overall, the rate cuts were neutral in
nature and did not indicate any directional change in monetary policy.
The likelihood of further rate cuts in 2015 depends principally on the effectiveness of current
policy in lowering financing costs in the real economic sector. We expect that relevant authorities
will continue to lead interest rates downwards in the inter-bank market to bring down loan prices.
Benchmark rates of deposits and loans will be further lowered if enterprises’ financing costs
remain elevated and, in particular, economic downturn worsens and employment deteriorates. We
predict a high likelihood of further benchmark rate cuts in 2015.
Thirdly, the probability of lowering reserve requirements to replenish monetary base is high.
In 2015, the incremental funds outstanding for foreign exchange will not be massive as PBOC
stops routine intervention in the RMB exchange rate and the US is likely to raise interest rates.
According to its reservoir theory, the PBOC raised reserve requirements earlier to offset the
liquidity pressure from international capital influxes. Now as the funds outstanding for foreign
exchange falls, the PBOC is more likely to lower reserve requirements to replenish the monetary
base. In addition, since the PBOC has lowered interest rates to improve availability and lower the
price of funds to enterprises, from the perspective of stabilizing growth and restructuring the
economy, the PBOC will use quantitative tools while continuing the use of price tools. We expect
reserve requirements to be lowered once or twice in 2015.
III.3 Accelerate reforms in investment and financing systems
With regard to investment policy in 2015: Firstly, China will further cancel and reduce approval
requirements, grant more discretionary decision power to enterprises, in particular state-owned
enterprises and those directly controlled by central government, to emphasize the investor status of
enterprises in the course of deepening institutional reforms. Secondly, private capital will be
allowed to play a larger role in infrastructure and public utilities investment and operation, PPP and
other franchise modes will be piloted in selected provinces or projects and explorations will be
made in setting up policy financial institutions for urban infrastructure and residential properties to
step up financing supports for infrastructure investment. Thirdly, China will take the opportunity of
the “One Belt and One Road” program to step up infrastructure development in transport, logistics,
warehousing, telecommunications and electricity in inland and border areas and also increase the
transshipment and customs clearance capacity of coastal ports.
III.4 New consumption policy to fuel rapid growth of new consumption models
Firstly, China will continue to encourage new consumption models, further carry out the
“Broadband China” and “Smart Cities” programs, encourage information consumption including
mobile Internet and Internet of Things and further establish or improve urban and rural logistics
systems. Secondly, China will give further play to affordable housing projects, relax conditions on
lending against and withdrawal of housing provident funds and stabilize consumption regarding
housing and related furniture, home appliance, building materials and decoration materials. Thirdly,
China will strictly implement the employees’ paid leave system, create a favorable environment for

Global Economic and Financial Outlook
Institute of International Finance BOC 23 Year 2015
leisure and travel consumption, encourage private investment in schools, hospitals and elderly care
organizations and enhance consumption in the educational, cultural, sports, health and elderly care
fields.
III.5 Foreign trade policy to stress transformation and upgrading of trade structure
Firstly, China will stabilize exports of transport, electromechanical and other conventionally strong
products and cut over capacities in steel, electrolytic aluminum and flat class. Secondly, China will
adjust the processing trade policy to restrict and prohibit energy-intensive, heavy-polluting foreign
investment projects and promote transformation and upgrading of coastal areas, orderly industrial
transfer from coastal to inland areas and continuous expansion of border trade. Thirdly, China will
encourage and support exporting of high value added, high-yield products with proprietary
intellectual property rights and brands. Fourthly, China will expand importing of digital,
intellectual and other cutting-edge technologies and equipment, critical parts and components and
resource-stabilizing commodities to increase the reserve of strategic commodities. Fifthly, China
will continue to carry out the pilot program on trade facilitation in Shanghai FTZ and extend
proven policies and measures to broader areas.
III.6 Real estate control policy to stress implementation and accelerate housing finance
reform
Firstly, the differentiated credit policy will be continued for the real estate industry. Secondly,
stronger funding supports will be provided for China Development Bank’s affordable housing
projects. Thirdly, mortgage-backed securitization (MBS) will be accelerated to improve the
housing finance system.
IV. Topical Analysis
Topic 1: Explore new engines of economic growth – what will drive China’s economy in the
future?
We expect China’s GDP growth to remain above 7% in 2015, the last year of China’s 12th
Five-year Plan. That means China’s GDP will grow by around 7.8% annually on average during
the 12th
Five-year Plan period (2011-2015). China boasts the strongest growth rate of the world’s
major economies during this period. At present, however, China’s potential growth rate is starting
to fall. So, what are China’s new engines of growth in the foreseeable future? How to maintain the
annual GDP growth rate at around 7%? They are major issues to be studied and addressed with
respect to China’s economy.
1. Strategic emerging industries: new locomotive of economic growth
Building on major technological breakthroughs and development needs, strategic emerging
industries (SEIs) play a material leading role in driving the overall, long-term economic and social
development, characterized by knowledge and technology intensiveness, less consumption of
physical resources, great potential for growth and strong overall benefits.
For rapid and healthy development of SEIs, China developed and issued detailed plans and
guidelines. The State Council announced to accelerate the effort to foster and develop the seven
SEIs in July 2012. The National Development and Reform Commission (NDRC) published the
Guiding Catalogue on Key Products and Services in Strategic Emerging Industries in March 2013,
with 3,100 products and services identified are under 125 sub-categories, 24 categories in the seven
SEIs.
With investments expanded and supporting policies issued in recent years, China has begun laying

Global Economic and Financial Outlook
Institute of International Finance BOC 24 Year 2015
a solid foundation for SEIs, which started to shape new core competitive edge industries.
Innovation in SEIs accelerated in the first three quarters of 2014, with smooth progress seen in
“core electronic devices, high-end generic chips and basic software”, new-generation broadband
wireless mobile communication networks, high-end numerical control machines, large aircraft and
other major scientific and technological programs of China. Industrial value added in high-tech
manufacturing grew by 12%, faster than the average of all industries. Take new energy vehicles for
example, 38,500 vehicles were manufactured in the first three quarters of 2014, up 2.9 times
year-on-year. China’s SEIs are likely to grow by around 20% a year on average in coming years,
thereby gradually becoming a major driver of economic growth. In 2020, the value added in SEIs
will account for about 15% of GDP, with some industries and key technologies ranking among the
world’s leading ones.
Table 3: Seven Strategic Emerging Industries Identified by China
Plan
objective Industry Sub-sector
Products and
services
Pillar
industries in
2020
Energy conservation and
environmental protection
High efficiency and energy saving
740 items Advanced environmental protection
Recycling and re-use of resources
New-generation information
technology
Next-generation information network
950 items Core and basic electronics
High-end software and emerging
information services
Biotechnology
Bio-pharmaceuticals
500 items Bio-medical engineering
Bio-agriculture
Bio-manufacturing
High-end equipment
manufacturing
Aerospace
270 items
Satellite and related applications
Rail transport equipment
Marine engineering equipment
Intelligent manufacturing equipment
Leading
industries in
2020
New energy
Nuclear power technology
300 items Wind energy
Solar energy
Biomass energy
New materials
New functional materials
280 items Advanced structural materials
High-performance composite materials
New energy vehicles 60 items
Source: State Council; National Development and Reform Commission; Institute of International Finance, BOC
2. Modern service sectors: New areas of economic development
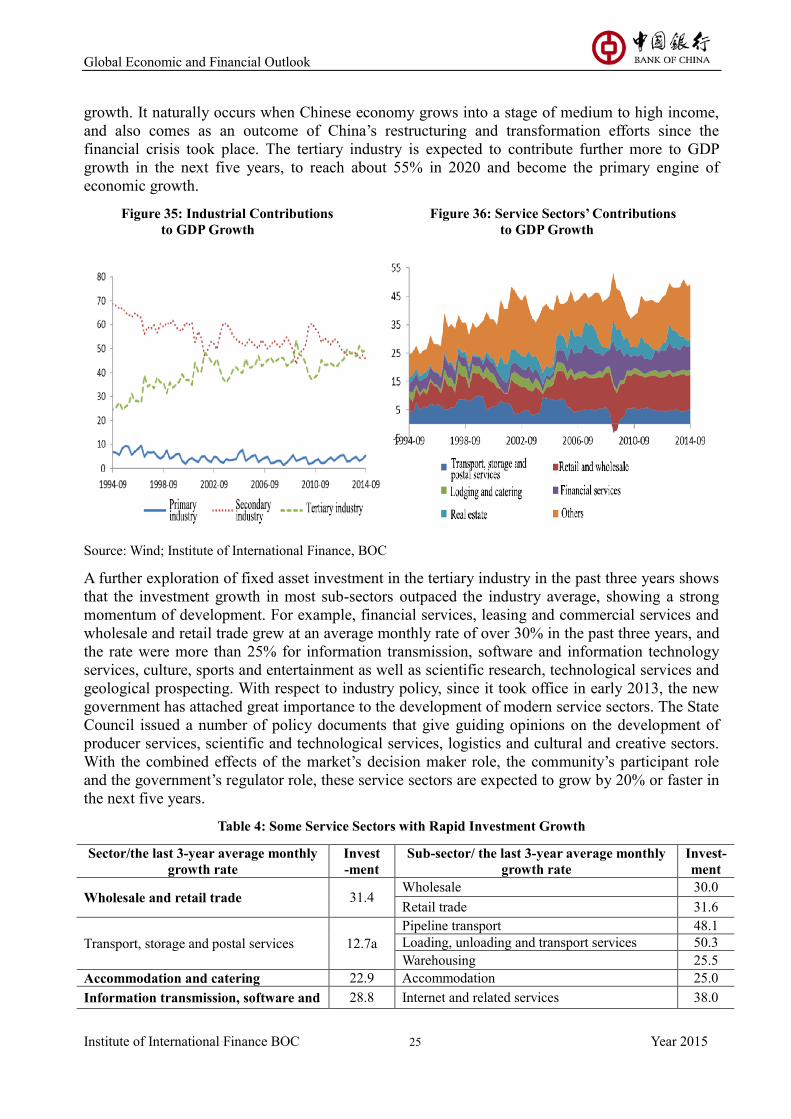
The tertiary industry with a focus on modern service sectors has been contributing more and more
to China’s economic growth in recent years, even more than the secondary industry. The tertiary
industry contributed 49.1% of GDP growth in the first three quarters of 2014, 3.4 percentage points
more than the secondary industry, suggesting that the tertiary industry is gaining a bigger weight in
national economy. The tertiary industry not only plays an increasingly important role in creating
jobs (for details, please see the report for 3Q), but is also playing a fundamental role in stabilizing
Global Economic and Financial Outlook
Institute of International Finance BOC 25 Year 2015
growth. It naturally occurs when Chinese economy grows into a stage of medium to high income,
and also comes as an outcome of China’s restructuring and transformation efforts since the
financial crisis took place. The tertiary industry is expected to contribute further more to GDP
growth in the next five years, to reach about 55% in 2020 and become the primary engine of
economic growth.
Figure 35: Industrial Contributions Figure 36: Service Sectors’ Contributions
to GDP Growth to GDP Growth
Source: Wind; Institute of International Finance, BOC
A further exploration of fixed asset investment in the tertiary industry in the past three years shows
that the investment growth in most sub-sectors outpaced the industry average, showing a strong
momentum of development. For example, financial services, leasing and commercial services and
wholesale and retail trade grew at an average monthly rate of over 30% in the past three years, and
the rate were more than 25% for information transmission, software and information technology
services, culture, sports and entertainment as well as scientific research, technological services and
geological prospecting. With respect to industry policy, since it took office in early 2013, the new
government has attached great importance to the development of modern service sectors. The State
Council issued a number of policy documents that give guiding opinions on the development of
producer services, scientific and technological services, logistics and cultural and creative sectors.
With the combined effects of the market’s decision maker role, the community’s participant role
and the government’s regulator role, these service sectors are expected to grow by 20% or faster in
the next five years.
Table 4: Some Service Sectors with Rapid Investment Growth
Sector/the last 3-year average monthly
growth rate
Invest
-ment
Sub-sector/ the last 3-year average monthly
growth rate
Invest-
ment
Wholesale and retail trade 31.4 Wholesale 30.0
Retail trade 31.6
Transport, storage and postal services 12.7a
Pipeline transport 48.1
Loading, unloading and transport services 50.3
Warehousing 25.5
Accommodation and catering 22.9 Accommodation 25.0
Information transmission, software and 28.8 Internet and related services 38.0

Global Economic and Financial Outlook
Institute of International Finance BOC 26 Year 2015
information technology services Software and information technology services 53.6
Financial services 46.0
Monetary and financial services 22.8
Capital markets services 118.2
Insurance 55.7
Other financial services 191.1
Real estate 21.9
Leasing and commercial services 34.2 Leasing 49.1
Commercial services 34
Scientific research, technological
services and geological prospecting 26.8
Research and experimental development 22.4
Professional technological services 35.4
Science and technology promotion and
application 33.6
Water, environment and public
facilities administration 22.1a
Water conservancy management 23.7a
Public facilities management 22.1a
Resident, repair and other services 19.7 Resident services 24.1
Health care and social work 22.6a Social work 41.2
Culture, sports and entertainment 27a
News and publishing 23.5
Radio, television, film, and television recording
and production 28.4
Culture and arts 33.2
Entertainment 33.6
Public administration, social security and
social organizations 5.4a
People's Political Consultative Conference and
democratic parties 274
Social security 26.3
Mass and social organizations, and other
membership organizations 58.8
Overall 19.9
Note: Data suffixed with the letter “a” are for the period from November 2011 to October 2014, while other data
are for the period from October 2011 to September 2014.
Source: Wind; Institute of International Finance, BOC
Table 5: Government Highly Values Development of Modern Service Sectors
Sector Title of document Reference number Date of
issue
Scientific and
technological
services
Opinions of the State Council on Accelerating
Development of the Scientific and Technological
Services Sector
Guofa [2014] No. 49 2014-10-28
Sports
Opinions of the State Council on Accelerating
the Sports Sector Development and Promoting
Sports Consumption
Guofa [2014] No. 46 2014-10-20
Logistics
Notice of the State Council on Issuing the
Medium- and Long-term Development Plan for
the Logistics Sector (2014-2020)
Guofa [2014] No. 42 2014-10-4
Marine shipping
Opinions of the State Council on Promoting
Healthy Development of the Marine Shipping
Sector
Guofa [2014] No. 32 2014-9-3
Tourism Opinions of the State Council on Promoting
Reform and Development of the Tourism Sector Guofa [2014] No. 31 2014-8-21
Modern insurance
services
Opinions of the State Council on Accelerating
Development of the Modern Insurance Services
Sector
Guofa [2014] No. 29 2014-8-13

Global Economic and Financial Outlook
Institute of International Finance BOC 27 Year 2015
Producer services
Guidelines of the State Council on Accelerating
Development of the Producer Sector and
Promoting Industrial Restructuring and
Upgrading
Guofa [2014] No. 26 2014-8-6
Capital markets
Opinions of the State Council on Further
Promoting Healthy Development of Capital
Markets
Guofa [2014] No. 17 2014-5-9
Cultural, creative
and design services
and related sectors
Opinions of the State Council on Promoting
Integrated Development of Cultural, Creative
and Design Services and Related Sectors
Guofa [2014] No. 10 2014-3-14
Health services
Opinions of the State Council on Promoting
Healthy Development of the Health Services
Sector
Guofa [2013] No. 40 2013-10-18
Elderly care
services
Opinions of the State Council on Accelerating
Development of the Elderly Care Services Sector Guofa [2013] No. 35 2013-9-13
Rail transport
Opinions of the State Council on Reforming the
Railway Investment and Financing System and
Accelerating Railway Construction
Guofa [2013] No. 33 2013-8-16
Broadband network
Notice of the State Council on Issuing the
“Broadband China” Strategy and Implementation
Plan
Guofa [2013] No. 31 2013-8-16
Information
consumption
Opinions of the State Council on Promoting
Information Consumption and Expanding
Domestic Demand
Guofa [2013] No. 32 2013-8-14
Energy conservation
and environmental
protection
Opinions of the State Council on Accelerating
Development of the Energy Conservation and
Environmental Protection Industry
Guofa [2013] No. 30 2013-8-12
Source: State Council; Institute of International Finance, BOC
3. Selected industrial sectors: important drivers of growth
In spite of the industrial sectors’ reduced contribution to economic growth as substantial progress
in economic restructuring has driven up service sectors’ contribution to economic growth, the
secondary industry remains a major engine of economic growth. In the first three quarters of 2014,
the contribution ratio of secondary industry was 37.4%, and increased 2.7 percentage points of,
GDP growth rate. The secondary industry’s contribution to economic growth is expected to further
fall in coming years, but it will remain a major driver of economic growth.
Table 6: 13 Industrial Sectors with Strong Growth
Sector/ the last 3-year average monthly growth rate Total
profit
Industrial
value
added
Fixed asset
investment
Timber processing and bamboo, cane, palm fiber and straw
products 24.8 12.1 27.1a
Food manufacturing 24.7 10.9 24.8
Gas production and supply 18.7 14.6 28.1a
Nonmetal minerals mining and dressing 18.3 11.0 22.4
Cultural, educational and sports goods 18.2 12.9 26.0
Medical and pharmaceutical products 17.2 13.9 31.4
Manufacture of automobiles 17.0 11.0 20.0
Manufacture of furniture 16.9 10.8 27.1a

Global Economic and Financial Outlook
Institute of International Finance BOC 28 Year 2015
Manufacture of alcohol, beverages, and refined tea 16.8 11.0 32.2a
Processing of food from agricultural products 14.6 11.1 28.6
Manufacture of measuring instruments 11.7 11.6 21.7a
Printing and reproduction of recorded media 11.7 10.7 21.2a
Reuse of waste resources 11.2 16.1 38.3a
Overall 8.6 9.9 19.9
Note: (1) The data regarding total profit and industrial value added are year-on-year monthly growth rates; the
data regarding fixed asset investment are year-on-year cumulative growth rates; (2) total profit data and fixed
asset investment data suffixed with letter “a” are for the period from October 2011 to September 2014, while
industrial value added and other fixed asset investment data are for the period from November 2011 to October
2014.
Source: Wind; Institute of International Finance, BOC
An exploration of monthly data regarding the profit, value added and fixed asset investment by
sub-sectors shows that 13 sectors outperformed the industry average in terms of the above three
indicators, which can be considered direct evidence of strong growth. These sectors are expected to
remain major drivers of growth in the coming five years. Specifically speaking, firstly, food
manufacturing, processing of food from agricultural products and manufacture of alcohol,
beverages, and refined tea will remain on the fast track. Secondly, as residents’ consumption is
upgrading from food and clothing to housing, travel, culture, education and entertainment, timber
processing and bamboo, cane, palm fiber and straw products, manufacture of furniture, gas
production and supply, manufacture of automobiles, manufacture of measuring instruments,
cultural, educational and sports goods as well as printing and reproduction of recorded media will
continue to grow rapidly. Thirdly, taking into consideration the aging population, improving
standard of living and rising demand for medical services, health care and environmental
protection, the manufacture of medical and pharmaceutical products and reuse of waste resources
will continue to grow fast. Lastly, nonmetal mine is broadly applied in various sectors of national
economy, and its mining and dressing sector is expected to continue rapidly.
Taking into consideration of the current situation, prospects and policy factors of all industries and
sectors, we predict that, in the next five years, China’s economy will be led and driven mainly by
the seven SEIs, some of which will become pillars of the economy in 2020, while modern service
sectors will become the primary engine of growth and contribute more than half of GDP growth. In
addition, some industrial sectors will remain strong contributors to rapid economic growth.
Topic 2: China’s economic leverage ratio measurement and potential risks
The movements of leverage ratio (debt ratio) are usually related closely to economic cycles and
monetary and credit environments. Leverage is helpful but also has its negative effect. If an
economy uses debts properly, a moderate rise in leverage ratio helps increase its financing capacity,
improve efficiency of fund allocation and promote steady, rapid economic growth. However,
over-leveraging may lead to overheated economy, bubble inflation and debt risk rises. Currently as
China is shifting into a new normal of slower growth and better structure, the debt risk has become
a cause for close concern. How the leverage ratio of China’s economic sectors changes, what risks
are there and how to respond in the future? These will be discussed below.
1. Measurement and evolvement of China’s leverage ratios
Since the eruption of the Financial Crisis in 2008, China's overall leverage ratio has increased amid
massive stimulus packages. In 2013, China’s overall leverage ratio (covering governmental,

Global Economic and Financial Outlook
Institute of International Finance BOC 29 Year 2015
resident and business sectors) reached 265.5%, up 70.8 percentage points from 2006. Leverage
ratio rose in all economic sectors, of which the financial sector and non-financial enterprises saw a
high and fast-growing leverage ratio. The financial sector’s leverage ratio was 77.8% up 26.6
percentage points from 2006, mainly due to the substantial increase in liabilities to other depository
corporations, other liabilities and bond issues, whose percent weights in GDP rose by 12.4, 13.7
and 6.3 percentage points from 2006 respectively. The non-financial enterprise sector’s leverage
ratio was 113.4%, up 19.1 percentage points from 2006, mainly due to the sharp rise in corporate
bonds. The resident and governmental sectors had a relatively low leverage ratio. The resident
sector's leverage ratio was 34.9%, up 17.2 percentage points from 2006; the governmental sector’s
leverage ratio was 39.4%, up 7.9 percentage points from 2006.
Figure 37: Changes in China’s Leverage Ratios by Economic Sector in the Past Decade
Note: Leverage ratio of residents = residents’ loans/GDP; leverage ratio of non-financial enterprises = (loans to
non-financial enterprises and other sectors + debts of enterprises)/GDP; leverage ratio of financial sector = (total
liabilities – liabilities to non-financial institutions and households – deposits in liabilities to other financial
corporation that are counted in M1 calculation)/GDP; leverage ratio of government is from IMF, only including
liabilities of central government.
Source: Institute of International Finance, BOC
2. Potential risks derived from leverage ratio changes
Currently the leverage ratios in China’s economy mainly show the following problems:
(1) Local government debt risk rises in spite of relatively low overall leverage ratio
Compared with other countries, China’s overall debt ratio is relatively low. In particular, the
leverage level of central government and residents is much lower than most countries. China's
overall leverage ratio was 236.1% in 2010, lower than Japan (515.8%) and the US (298%) in the
same period. In particular, the relatively low leverage ratios in central government and residents
create conditions for reallocation and optimization of leverages among economic sectors to prevent
“hard landing” of the economy.
It is noteworthy that the government debts mentioned above do not include local government debts,
leading to an underestimation of Chinese governments’ leverage level. According to a report of the
National Audit Office (NAO) of China, local government debts (including contingent debts)
totaled RMB17.9 trillion at June 2013, representing 31.5% of GDP. Against the backdrop of
greater downside pressure, property market adjustments and de-capacity, local governments face a
bigger pressure on fiscal revenue and expenditure. Due to regional disparities in economic
development and debt management capability, some local governments have had trouble in

Global Economic and Financial Outlook
Institute of International Finance BOC 30 Year 2015
repaying debts. Meanwhile, as regulators have strengthened monitoring over financing platforms
and shadow banking in recent years, local governments rely increasingly more on trust loans and
other new financing channels, which has been driving up the implicit debt risk.
Table 7: Debt Structure and Overall Leverage Ratio by Country (% of GDP)
Financial sector Public sector Business enterprise
sector Resident sector
Overall
leverage Ratio
Japan 120 229.8 99 67 515.8
UK 219 84.3 109 98 510.3
Spain 76 70.4 134 82 362.4
France 97 84.4 111 48 340.4
Italy 76 120.7 82 45 323.7
South Korea 93 31.7 107 81 312.7
US 40 99 72 87 298.0
Germany 87 83 49 60 279.0
Australia 91 73 59 105 328.0
Canada 63 85.9 53 91 292.9
China 65.7 36.6 105.8 28 236.1
Source: Governmental debt data are from IMF; non-China data are from the Debt and Deleveraging: Uneven Progress on the Path to Growth released by McKinsey in 2012.
(2) Financial system vulnerability worsen by non-financial corporations’ higher leverage
ratio than global average
By economic sector, the leverage ratio of China’s non-financial corporations was not only higher
than other sectors of the Chinese economy, but also higher than developed economies like the US,
Japan and Germany. For example, the leverage ratio of Chinese corporations was about 105.8% in
2010 (113.4% in 2013), compared with 49%, 72% and 99% of German, US and Japanese
respectively. The rising costs and over-leveraging of enterprises will not only add to the financial
burden of businesses, but also worsen the risk of overcapacity and the vulnerability of the
economic and financial systems. In particular, as over capacities will remain amid the future
economic downturn, some enterprises with excessive debt burden and weak profitability will face
the risk of collapse of fund chains.
(3) Coal industry and most heavy industries have a higher leverage ratio
Among industrial enterprises, mining and heavy industries saw a rise in leverage ratio and a
decline in return on assets, posing a high debt risk. Of mining industries, the coal mining and
dressing industry has a debts/assets ratio higher than industry average and other mining industries
and a return on assets much lower than average and other mining industries. Heavy industries,
except non-metal mineral products and metalwork, showed weak performance, with the
debts/assets ratio on the rise and higher than industry average and the return on assets staying a
relatively low levels. Light industry and emerging manufacturing saw the debts/assets ratio on the
decline and lower than industry average, with relatively high return on assets, posing a relatively
low risk.

Global Economic and Financial Outlook
Institute of International Finance BOC 31 Year 2015
Fig. 38: Debts/Assets Ratio by Industry Fig. 39: Return on Assets by Industry
Source: Wind; Institute of International Finance, BOC
3. Countermeasures
Currently China’s debt risk and de-leveraging pressure are concentrated in local governments and
non-financial corporations. Future macro controls should respect the inherent laws of economic
de-leveraging and control overall leverage ratio at reasonable levels by a proper combination of
encouragements and discouragements. China needs control buildup in over capacities and inflation
of asset bubbles arising from the ongoing de-leveraging of enterprises and financial institutions on
the one hand and also prevent the rise in financial risk due to drastic de-leveraging on the other
hand. In particular, focus should be placed on addressing the fundamental contradictions in
economic operation to prevent intensification of conflicts due to simple curbs on credit expansion.
The leverage distribution among central government, local governments and enterprises should be
adjusted optimally to increase the leverage ratios of central government and residents appropriately.
At present, to stabilize growth, advance reforms and promote inclusive growth, the central
government funding is expected to play a stronger role, leaving more time for local governments
and enterprises to de-leverage. China may increase the leverage level of shantytown redevelopment,
agriculture-related activities and small and micro businesses by providing more public funding and
financial supports, while de-leveraging local government financing platform, real estate and
industries with over capacities, thereby controlling the overall leverage ratio at reasonable levels.
China should further tap into the consumption potential of residents to strengthen the
self-sustaining growth of the economy. Taking advantage of the new budget law promulgated in
September 2014, China should strengthen the management of local government debts so that local
governments’ borrowing activity will be disciplined and transparent.
A range of measures should be taken to de-leverage enterprises. China should accelerate the
development of equities and other direct financing methods to optimize the financing structure and
lower the debt ratio of enterprises. China also should speed up industrial restructuring, channel
funds into strategic emerging industries, eliminate outdated capacities steadfastly, improve
mechanisms for bankruptcy and reorganization of businesses and increase the efficiency of
investment.

Global Economic and Financial Outlook
Institute of International Finance BOC 32 Year 2015
Disclaimer
This Report was drafted by the Institute of International Finance BOC, and all the information cited in this report
is publicly available.
Any view or estimate contained in this Report only represents the author’s judgments to date, not necessarily
reflects BOC’s views. The Institute of International Finance may change this Report without notice, and shall not
be held liable for update, correction or revision of this Report.
The contents and views contained in this Report are for reference only, which do not constitute any investment
recommendation. BOC will not be liable for any direct or indirect profit/loss on investment caused by the use of
any information provided herein.
The copyright of this Report is exclusively owned by the Institute of International Finance BOC, and shall not be
reprinted, duplicated or published by any institution or individual. In case of any quote for distribution, it shall be
indicated that the source is the Institute of International Finance BOC, and the report shall not be quoted,
abridged and modified contrary to its original intention. The Institute of International Finance BOC reserves
rights to investigate any infringement or quotation contrary to the original intention of this Report.
Top Related