


Languages
Pages
Legal


Capacitors for Energy Storage Technology Applications
William E. Bernier, Binghamton University
Thor Eilertsen, Custom Electronics Inc
1

Energy
• Electrical
• Thermal
• Mechanical
• Chemical
• …
Source Storage Use
Battery
Capacitor
Supercapacitor
2

Why Supercapacitors?
Parameters Battery Capacitor Supercapacitor
Charge Time 0.3 – 3 hrs 10-6 – 10-3 sec 1 – 30 sec
Discharge Time 1 – 5 hrs 10-6 – 10-3 sec 1 – 30 sec
Energy Density (Wh/Kg)
20 - 100 <0.1 1 - 10
Power Density (W/Kg)
50 - 200 > 10 000 1 000 – 2 000
Cycle Life 500 - 2000 >500 000 > 100 000
Charge/Discharge Efficiency
0.7 – 0.85 ≈ 1 0.90 – 0.95
Antiohos, D.; Romano, M.; Chen, J.; Razal, J. M. (2013) Syntheses and Applications of Carbon Nanotubes and Their
Composites. InTech. 3

Bridging the Divide
Inefficiencies of Regular Battery Benefits of the Enhanced Caps
• Better at discharging energy than absorbing it
• Shorter lifespan resulting in high replacement cost
• Made of toxic materials - ecologically unfriendly
• Improved speed and cycle efficiency
• Smaller unit size
• Withstand extreme temperatures
• High power density
• More sustainable and eco-friendly
• Complementary secondary source of power

Bridging the Divide
1) Eliminate the use of batteries and engines completely
2) Use ultracapacitors in tandem with batteries
SUPERCAPACITOR APPLICATIONS
6

Market Overview Market Size and Anticipated Growth of Ultracapacitors
• 2016
– Worldwide sales anticipated to reach $901.3 million
• 2020
– Reach $3.5 billion in revenues
• Ultracapacitors acccount for 5% of the battery energy storage market

Application Categories
1. Consumer Electronics & Professional Instruments
2. Industrial Machinery
3. Automotive & Transportation
4. Green Technology
5. Uninterruptible Power Supplies (UPS)

Consumer Electronics & Professional Instruments

Consumer Electronics & Professional Instruments

Consumer Electronics & Professional Instruments
Current Problems Solutions & Benefits
• Inconsistent power pulses overstress existing battery technologies
• Demand for increasingly smaller and lightweight systems
• Quick charge
• Extend battery life or eliminate batteries
• Optimize size and cost
• Improve safety and reliability
• Enhance efficiency
• Green technology with no toxic materials
• High durability and life time

Consumer Electronics & Professional Instruments
Applications
• Burst-Mode Communications
– Stock keeping, trading, wireless devices
• Quick Charge Hand Tools
– Hand-held power tools
• Multi-Function Pocket Appliances
– Cellphones, PDAs, MP3 players, digital cameras, toys

Consumer Electronics & Professional Instruments
Opportunities Threats
• Many applications of technology
• Always in demand whether for leisure or business
• Steady growth – 2011- $280.1 billion
– 2012- $289.9 billion
– 1.4% growth
• Product- specific customization of technology
• Costly to manufacture
• Short amount of time to produce
• Large volumes to supply and tailor
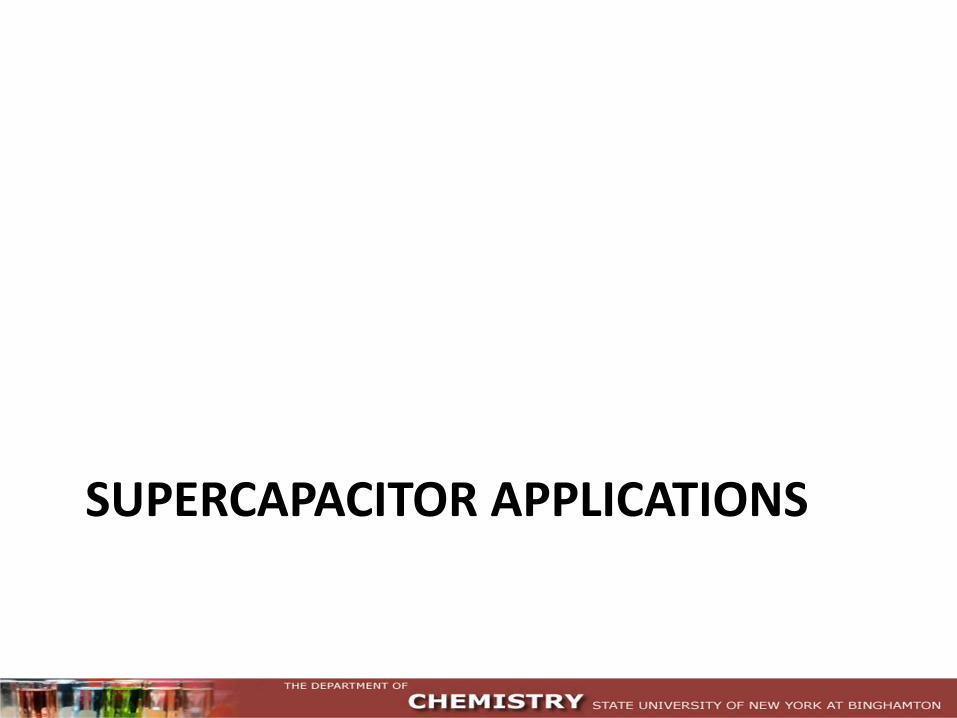
Green Technology
Applications
• Wind – Pitch Control Systems
• Provide burst power to maintain rotor speed or optimize output
• Lowest lifecycle cost and most reliable power backup
– Voltage Regulation
• Recycle cycling and power capability
• Absorb energy keep voltage spikes down
• Release energy prevent dropouts and smooth voltage on grid

Green Technology
Current Problems Solutions & Benefits
• Growing need for renewable energy sources
• Grid instability
• Variability in wind and solar conditions
• Poor utilization of these resources by 30-50%
• High durability and reliability
• Backup power in emergency situations
• Short-term bridge power capability
• Wide operating temperature range
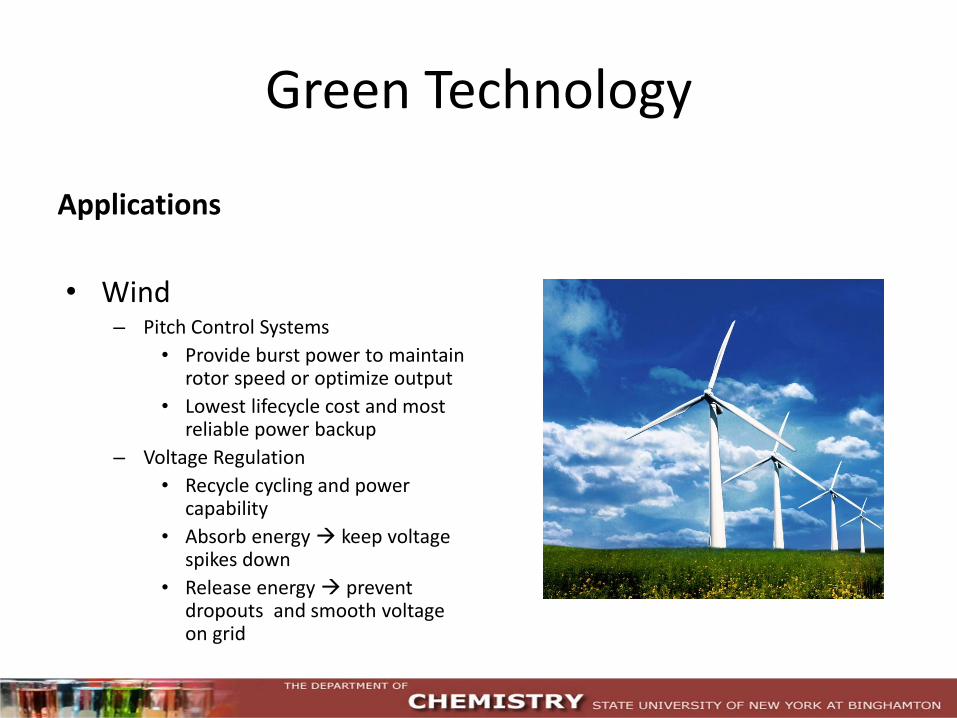
Green Technology
Applications
• Solar – High tolerance in extreme
temperatures
– Store and dispel energy despite varying conditions
– Ability to generate energy to manipulate and move panels

Green Technology

Green Technology
Opportunities Threats
• Large anticipated growth – 2030- Wind will supply 20%
of all US electricity
– 2011 to 2017- $145 billion invested wind turbines in North America
• High development costs
• Not “widely” adopted

Industrial Machinery

Industrial Machinery
Current Problems • Severe energy and environmental limitations
– Ex) Forklift operator- battery depletes, need to battery swap mid-shift
– Exacerbated in refrigerated warehouse environments
– Performance of a lead-acid storage battery degrades with decreasing temperature
• Requires heavy fuel consumption
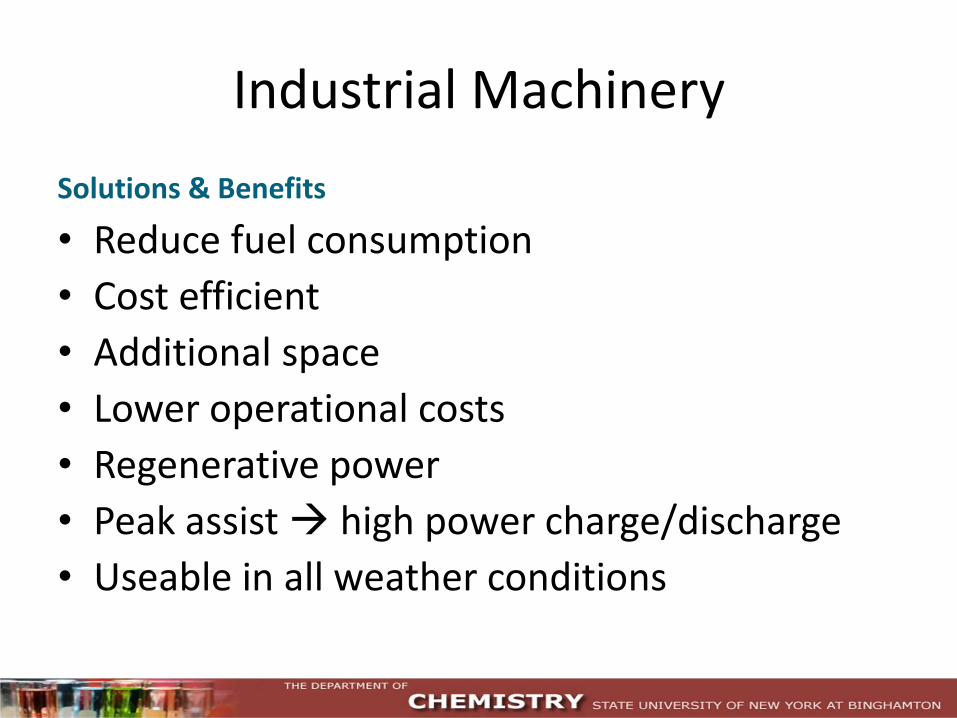
Industrial Machinery
Solutions & Benefits
• Reduce fuel consumption
• Cost efficient
• Additional space
• Lower operational costs
• Regenerative power
• Peak assist high power charge/discharge
• Useable in all weather conditions

Industrial Machinery
Applications
• Port Technology
– Harbor Cranes
• Heavy construction
– Forklifts
– Bulldozers
– Excavators
• Mining
– Oil
– Minerals and Resources

Industrial Machinery
Opportunities – Always in demand and foundational for other industries – Global machinery market grossed $409 billion in 2009 – Steady growth
– 2007-2001- Market growth rate of 1.3%
• Most advantageous sectors are engine and turbine segments – Revenues over $149.3 billion and contributes to 36.5% of markets
current value
Threats – Qualification to commercialization ranges from 1-3 years – Some have even longer design and testing periods – Slow growth
Automotive & Transportation
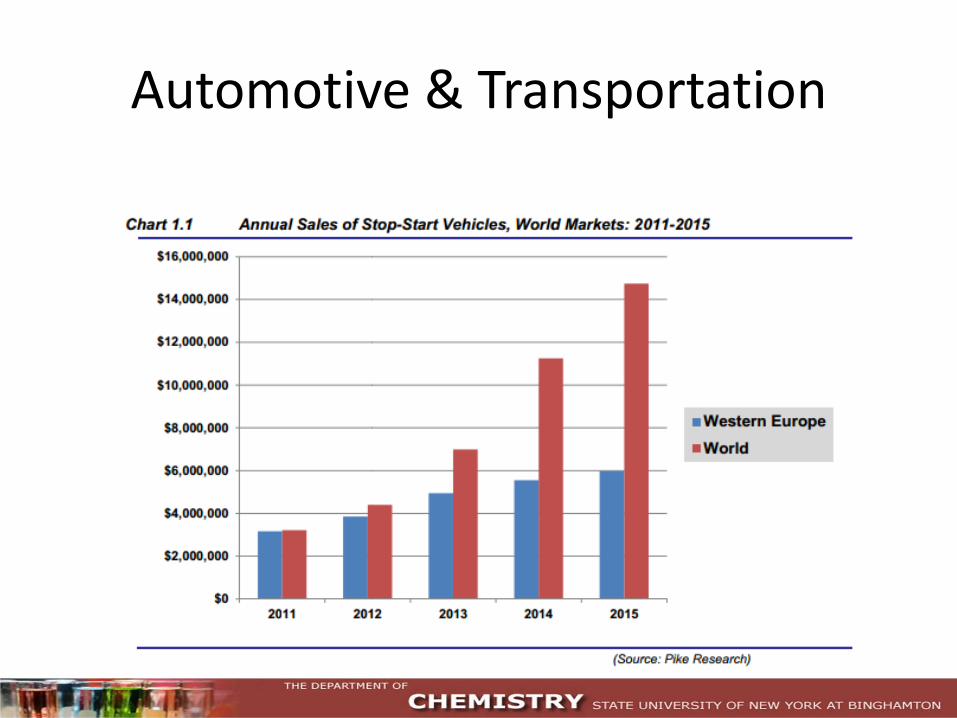
Automotive & Transportation
Automotive & Transportation
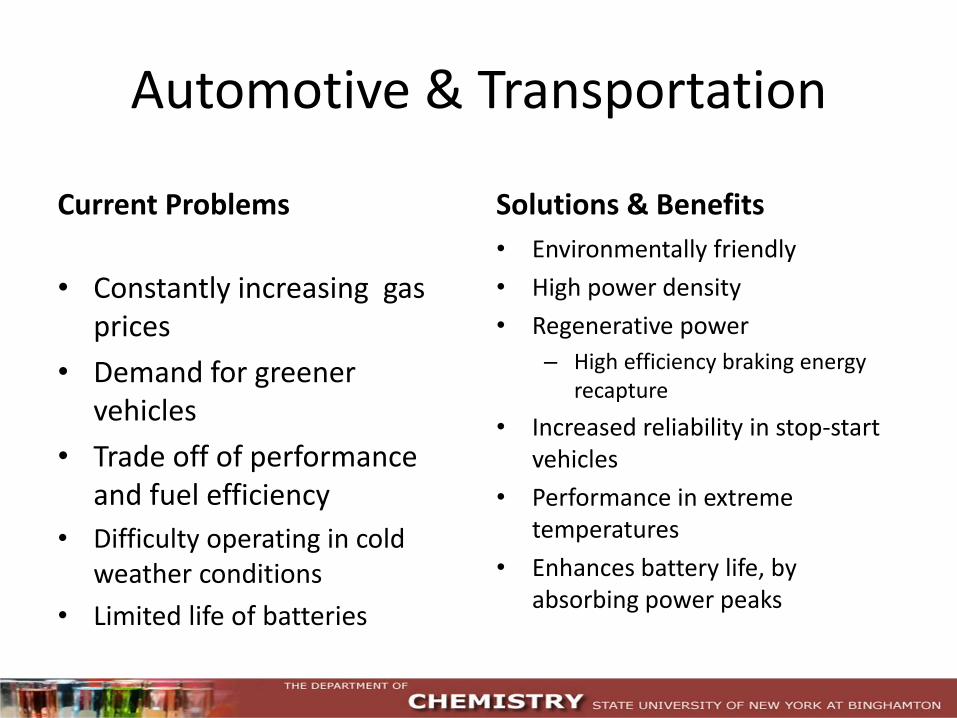
Current Problems Solutions & Benefits
• Constantly increasing gas prices
• Demand for greener vehicles
• Trade off of performance and fuel efficiency
• Difficulty operating in cold weather conditions
• Limited life of batteries
• Environmentally friendly
• High power density
• Regenerative power
– High efficiency braking energy recapture
• Increased reliability in stop-start vehicles
• Performance in extreme temperatures
• Enhances battery life, by absorbing power peaks

Automotive & Transportation
Applications • Regular/Hybrid/Electric Cars
– Boost to Start-Stop Technology
• Provide short bursts of energy to restart motor
– High Power Consumer Support
• Support short-term power demands that lower voltage
• Buffer energy loss with stored energy or supplement peak power demand
– Regenerative Braking Systems
• Absorb and store energy from braking system assist in acceleration
• Takes load off mechanical brakes reduce maintenance and replacement expense

Automotive & Transportation
Applications
• Bus/Tram/Train/ Truck Starter Systems
– Eliminate morning idle heat up and jump starting in cold climates
– Frees up under-hood and step-well space from removing lead acid batteries
– Enable load stabilization and prevent “brown outs”

Automotive & Transportation
Opportunities Threats
• Largest and lucrative market segment
– 2016-Growth of start-stop vehicles to reach $355.5 million
• Wide range of application
• Requires extremely demanding performance, reliability, safety, cycle life and cost
• Long complex development cycles that span numerous years

Uninterruptible Power Supply
30

31
Uninterruptible Power Supply
Current Problems
• Constantly increasing gas prices
• Brown out protection due to slow response time
• Difficulty in predicting battery cell operating life
• Limited life of batteries
• Industrial single-phase controls, power supplies and machinery on the grid, are sensitive to voltage sags and swells and brief interruptions (SS&I) will be more problematic from dirty power
Solutions & Benefits
• Environmentally friendly
• High power density
• Enhanced electrode design can improve brown out performance
• Enhances battery life by absorbing power variances
• Enhances equipment life by cleansing dirty power

Uninterruptible Power Supply
Applications
• Raised floor back up systems
• Cell tower back up systems
• Residential back up systems
• Telecommunications back up systems
• Enable load stabilization and prevent “brown outs” from dirty power on the grid

SUPERCAPACITOR STRUCTURE AND COMPONENTS
33

Supercapacitor Pseudocapacitor Electrochemically (Faradaically)
Double-layer Capacitor Electrostatically (Helmholtz Layer)
34
Hybrid Capacitor
electrode
electrolyte
Uncharged Charged
+ — +
— +
— +
— +
— +
— +
— +
—
_ + _ + _ + _ + _ + _ + _ + _ + _ + _ + _ + _ + _ + _ + _ + _ + _
+ — + — + — + — + — + — + — + —
separator
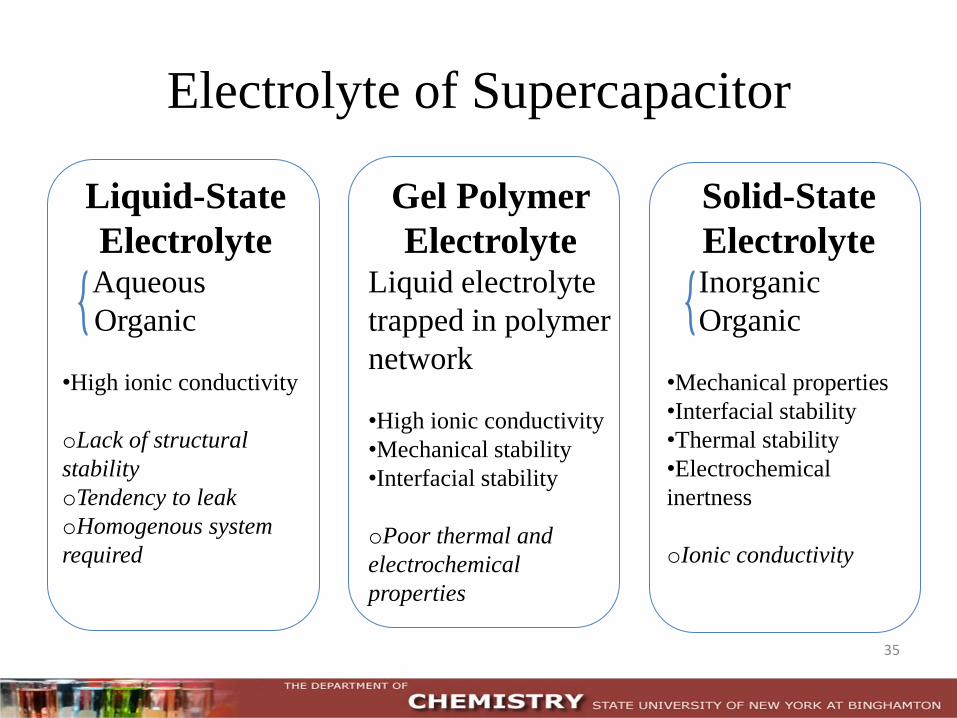
Electrolyte of Supercapacitor
Liquid-State
Electrolyte Aqueous
Organic
•High ionic conductivity
oLack of structural
stability
oTendency to leak
oHomogenous system
required
Gel Polymer
Electrolyte Liquid electrolyte
trapped in polymer
network
•High ionic conductivity
•Mechanical stability
•Interfacial stability
oPoor thermal and
electrochemical
properties
Solid-State
Electrolyte Inorganic
Organic
•Mechanical properties
•Interfacial stability
•Thermal stability
•Electrochemical
inertness
oIonic conductivity
35

36
Graphene
“Graphene is considered a two-dimensional
carbon nanofiller with a one-atom-thick planar
sheet of sp2 bonded carbon atoms that are densely
packed in a honeycomb crystal lattice.”
Preparation:
1. Solution-based reduction of graphene oxide
2. Chemical vapor deposition (CVD)
3. Micromechanical exfoliation of graphite
4. Epitaxial growth on electrically insulating surfaces
Kuilla, T.; Bhadra, S.; Yao, D.; Kim, N. H.; Bose, S.; Lee, J. H. Recent advances in graphene based polymer
composites. Progress in Polymer Science, 2012, 35, 1350 – 1375. 36

Modified Hummers method
0.5 g powdered
flake of graphite
0.5 g NaNO3
24 mL H2SO4
3 g KMnO4 added slowly
Temp. < 20 ℃ 35 ℃, 1h
40 mL DI water
90 ℃
5 mL H2O2 DI water
until pH = 7
yellow-brown
suspension
unexfoliated
precipitation
Graphite Graphene Oxide (GO) Graphene
sonication
centrifugation Remove
GO
solution
Shah, M.; Park, A. P.; Zhang, K.; Park, J. H.; Yoo, P. J. Green Synthesis of Biphasic TiO2-Reduced Graphene Oxide Nanocomposites with
Highly Enhanced Photocatalytic Activity. Appl. Mater. Interfaces, 2012, 4, 3893 – 3901. 37

Preparation methods of
polymer/graphene composites • Nanocomposites: 1. In situ intercalative polymerization
2. Solution intercalation
3. Melt intercalation
• Layer Structure composites 1. Drop coating
2. Spin coating
3. Vapor phase polymerization (VPP) of PEDOT
4. Chemical vapor deposition (CVD) of graphene
38

Chemical Vapor Deposition of Graphene
39
Process Outline •CVD processing supported by Center for Autonomous Solar Power • Selection of metal substrate
•Typical metal substrates are Ni and Cu •Anneal under partial pressure of hydrogen at elevated temperature
•Typical anneal and reaction range 900 C to 1100 C •Expose substrate to gas streams of hydrogen and methane for selected duration
•Deposit of graphene forms •Reduce temperature at controlled rate to room temperature.
Film Characterization •Optical Microscopy •SEM •Raman Spectroscopy
•New Thermo Electron DXR Raman Spectrometer purchased and installed •Confocal microscope with 532 nm laser and XY mapping capability

0.398
2.32
1.35
1.25
1.15
1.05
0.95
0.85
0.75
0.65
0.55
0.45
1.45
1.55
1.65
1.75
1.85
1.95
2.05
2.15
2.25
-10 0 10 20
G band / 2D x-axis [µm]
-10
010
20
y-ax
is [
µm
]Image 1, 4X4 Raman Mapping of CVD Graphene on Copper Foil with
532nm Laser Image 2, Optical Image of CVD graphene on Copper Foil
The mapping area is selected in image 2. In image 1, the color in upper right image is related to the intensity of G/2D
band, which will show us some information about the graphene layers. The upper left 3D image shows the amazing
visual image of the intensity on different locations. The Raman is operated at 532nm laser. Three Raman spectra (Red,
Blue, Green) are selected, which represent the three spots on image 2 with the same color.
Raman Spectroscopy Analysis of CVD Graphene Film

PEDOT-Graphene Nanocomposite Film
0.1 M EDOT
(acetonitrile)
graphene
nanoplatelets
sonication stirring, insert the substrate
0.1 M FeCl3.6H2O
(acetonitrile) rinse in DI water
dry at RT
xGnP Graphene Nanoplatelets
xGnP – M – 15 Micromechanical exfoliation of graphite
≈ 5 – 8 nanometers thick, typical surface area of 120 – 150 m2/g
PEDOT-graphene
composite film
41
PEDOT PEDOT – 0.1 wt% Graphene PEDOT – 1 wt% Graphene
Chiguma, J. Conducting Polymer Nanocomposites Loaded with Nanotubes and Fibers for Electrical and Thermal Applications.
Doctoral dissertation, 2009.

2. Madl, C. M.; Kariuki, P. N.; Gendron, J.; Piper, L. F. J.; Jones Jr. W. E. Vapor Phase Polymerization of Poy(3,4-
ethylenedioxythiophene) on Flexible Substrates for Enhanced Transparent Electrodes. Synthetic Metals, 2011,161, 1159 – 1165.
PEDOT-Graphene Nanocomposite Film
SEM images of in situ PEDOT – 0.1 wt% Graphene nanoplatelets (a)1, in situ PEDOT (b),
VPP PEDOT (c) and PEDOT:PSS (d)2.
42
a
d c
b
1. Chiguma, J. Conducting Polymer Nanocomposites Loaded with Nanotubes and Fibers for Electrical and Thermal Applications.
Doctoral dissertation, 2009.
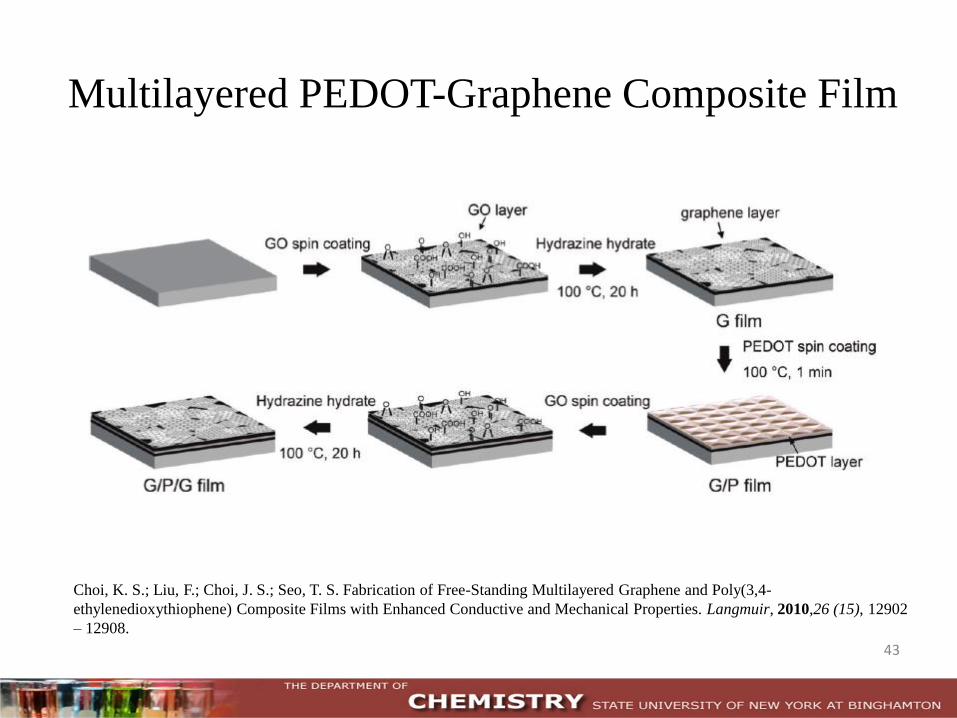
Multilayered PEDOT-Graphene Composite Film
Choi, K. S.; Liu, F.; Choi, J. S.; Seo, T. S. Fabrication of Free-Standing Multilayered Graphene and Poly(3,4-
ethylenedioxythiophene) Composite Films with Enhanced Conductive and Mechanical Properties. Langmuir, 2010,26 (15), 12902
– 12908.
43

Graphene/PEDOT Prototype Cell Design
PEDOT-graphene composite Metal Electrolyte Separator
Factors to study:
•Thickness of composite layers
•Composition of PEDOT/graphene
•Preparation of graphene
•Method of film depositon
44

Experimental Diagram of Double Layer Supercapacitors with BaTiO3 Nanofibers Dielectric Thin Film and Graphene-Coated Al Electrode
Based on the equation of C= εr*ε0*A/d, where C= capacitance between two electrodes, d= distance between two
electrodes, A= surface area, εr= dielectric constant, we can have a higher energy density and capacitance
performance when we introduce BaTiO3 and graphene into our supercapacitors devices.
Graphene/Barium Titanate Prototype Supercapacitor

Why Barium Titanate Nanofibers?
BaTiO3 is a semiconductor, piezoelectric ceramic
– Low production cost
– Porous nanofibers offer higher surface area-to-volume ratio
– High dielectric constant, which is correlated with grain size
*Arit, G.; Hennings D.; deWith G. J. Appl. Phys. 68, 15 August 1985

Sol-Gel (Barium acetate
in acetic acid,
titanium isopropoxide,
polyvinylpyrrolidone in ethanol)
Composite Polymer Nanofibers
Electrospinning at 25 kV Calcination under air
BaTiO3 Nanofibers
Procedure for BaTiO3 Nanofiber Preparation
Barium acetate was allowed to stir and dissolve in glacial acetic acid. Following the complete dissolution of the barium
acetate, titanium isopropoxide was added. The solution was then combined with a solution of polyvinylpyrrolidone (PVP),
and allowed to stir until a uniform, translucent sol-gel was obtained. The sol-gel was then loaded into a glass pipette for
electrospinning. After electrospinning, the polymer fibers were allowed to dry overnight on the foil, and then transferred
into ceramic boats for furnace calcination in air to decompose the polymer structure, leaving only perovskite barium
titanate nanofibers.

Diagram of Electrospinning Apparatus
Nanofibers can be prepared by application of high voltage between a sol-gel solution electrode, and a
collecting surface (aluminum foil). The electrified polymer jet is pulled from the tip of the needle, which
contains the sol-gel solution, onto the collecting Al foil.

a 200nm b 200nm c 200nm
d 200nm e 200nm f 200nm
SEM images of composite polymer nanofibers under different solvent systems (a) 3mL acetic acid; (b) 4mL acetic acid; (c) 3mL acetic
acid + 0.2mL DI water; BaTiO3 nanofibers (b) after calcination at different temperatures (d) 500 °C; (e) 580 °C; (f) 750 °C
Scanning Electron Microscope
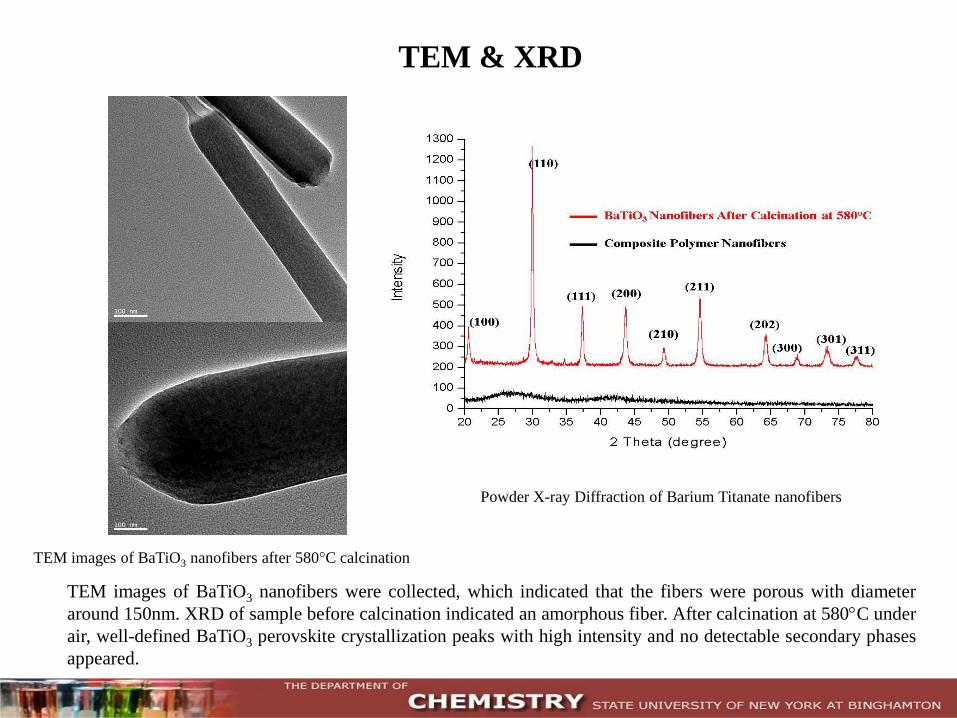
TEM & XRD
TEM images of BaTiO3 nanofibers were collected, which indicated that the fibers were porous with diameter
around 150nm. XRD of sample before calcination indicated an amorphous fiber. After calcination at 580C under
air, well-defined BaTiO3 perovskite crystallization peaks with high intensity and no detectable secondary phases
appeared.
TEM images of BaTiO3 nanofibers after 580°C calcination
Powder X-ray Diffraction of Barium Titanate nanofibers

Spin Coater
Barium Titanate/ Butanol Paste
BaTiO3 Film on Al Foil
To prepare the uniform dielectric BaTiO3 film, 2.0mL of butanol was added to 0.50 grams of crystallized
barium titanate nanofibers in a ceramic mortar. The contents were vigorously ground, forming a viscous
white paste. The paste was then drawn up into a pipette, from where it was dropped onto a spinning
aluminum substrate. The aluminum foil substrate was spinning from 400 to 500 revolutions per minute for
nine seconds. The substrate was then removed from the spin coater and placed in an oven to dry at 90°C for
one hour.
Dielectric BaTiO3 Film Preparation

Acknowledgements Collaborators:
Wayne Jones
Alok Rastogi
Stan Whittingham
Roger Westgate
Jones Research team
Thor Eilertsen
Yang Gao
Funding Resources:
SPIR
NYBEST
NYSERDA
NSF
Custom Electronics, Inc.
52
Top Related