


Languages
Pages
Legal


Basic Optical Concepts
1Oliver Dross, LPI Europe
Basic Optical Concepts

ni
nf
φ
φi
Media Boundary
Refraction- Snell's Law
i
f
f
i
n
n
Sin
Sin =)(
)(
φφ
Snell’s Law:
2
φf
Refractive Medium
0
10
20
30
40
50
60
70
80
90
0 10 20 30 40 50 60 70 80 90
angle of incidence
angl
e of
exi
tanc
e
internal
external

Refraction and TIR
Light ray refracted along boundaryφ
f
φc
= 90°φ
f
φi
ni
nf
Exit light ray
3
Totally Internally Reflected ray
Incident light rays
φi
ci
ni
Critical angle for total internal reflection (TIR):
φc= Arcsin(1/n) = 42°
(For index of refraction ni =1.5,n= 1 (Air))
„Total internal reflection is the only 100% efficient reflection in nature”

Fresnel and Reflection Losses
Reflection:-TIR is the most efficient reflection: An optically smooth interface has 100% reflectivity-Metallization: Al (typical): 85%, Ag (typical): 90%
Refraction:-There are light losses at every optical interface
n1
n2
Fresnel Reflection
4
-There are light losses at every optical interface-For perpendicular incidence:
-For n1 =1 (air) and n2=1.5 (glass): R=(0.5/2.5)^2=4%-Transmission: T=1-R. -For multiple interfaces: T tot =T1 *T2*T3…-For a flat window: T=0.96^2=0.92-For higher angles the reflection losses are higher
2
21
21
+−=
nn
nnR
0
0.1
0.2
0.3
0.4
0.5
0.6
0.7
0.8
0.9
1
0 10 20 30 40 50 60 70 80 90
Incidence Angle [deg]
Ref
lect
ivity
InternalReflection
ExternalReflection

Black body radiation & Visible Range
1
1.5
2
2.5
3
Rad
ianc
e pe
r w
avel
engt
h [a
.u.]
6000 K
5500 K
5000 K
Visible Range
5
• Every hot surface emits radiation• An ideal hot surface behaves like a “black body”• Filaments (incandescent) behave like this. • The sun behaves like a black body
0
0.5
1
300 400 500 600 700 800 900 1000 1100 1200 1300 1400 1500 1600
Wavelength [nm]
Rad
ianc
e pe
r w
avel
engt
h [a
.u.]
5000 K
4500 K
4000 K3500 K
2800 K

CIE 1931 Color Palette
CIE 1931 Color Diagram:-Colors are represented by (x,y) coordinates-Different source spectra can have the same (x,y) point, same color appearance-Two light sources represented as two points in diagram can mix (by varying their intensities) to any color on a straight line between them-Pure Colors (spectrum has only on wavelength) are on “rim” of the color chart-LEDs are almost pure, filtered incandescent is RED ORANGE (AlInGaP)
GREEN (InGaN)
Typical High Flux LED Colors (Chip material)
6
WHITE( InGaN (Blue) + Phosphor)
-LEDs are almost pure, filtered incandescent is (usually) not-Unfiltered incandescent light is represented by the black body curve. -Typical tungsten bulbs have a color temperature of 2800 K, their light is yellowish (point A)-A black body at 6500 K emits almost pure white light (point C)
RED( AlInGaP)
RED ORANGE (AlInGaP)
BLUE GREEN (InGaN)
BLUE (InGaN)

Color Mixing
The intensity/flux of two light beams is specified in terms of quantities Y1 and Y2and the color is specified by chromaticity coordinates x1, y1, x2, y2. The sum of the light beams is given by:
, that Note iiiiii
i ZYXZXY
m ++====. and ,with
and ,
21
21
2211
21
2211
Ym
Ym
mm
mxmxx
mm
mymyy sumsum
==
+⋅+⋅=
+⋅+⋅=
7
Light Source 1: Y1 = 10lm; x1 = 0.1; y1 = 0.2 (yellow)Light Source 2: Y2 = 20lm; x2 = 0.4; y2 = 0.5 (blue)
Light Source Sum: Y = 30lm; x = 0.23; y = 0.33 (bluish white)
REMARK:Twice as much yellow flux than blue flux but it still appears bluish, because the blue is "stronger" than yellow (m1 > m2, in this particular case).
Example:
z) andy x,of definition (see
, that Note iiiiii
i ZYXzxy
m ++====. and ,with 2
22
1
11 y
Ym
y
Ym ==

Colorimetric quantities
)()(683
[cd])intensity ()()(683
)()(683
=
⋅⋅=
⇒⋅⋅=
⋅⋅=
∫
∫
∫
Xx
dzPZ
dyPY
dxPX
λλλ
λλλ
λλλ
P(λ) is the radiated spectrum of the light source(i.e. the spectral intensity of the source)
8
1
=++
++=
++=
++=
zyx
ZYX
Zz
ZYX
Yy
ZYX
Xx (i.e. the spectral intensity of the source)
x(λ), y(λ) and z(λ) are the CIE color matching functions(sometimes also called x-bar, y-bar and z-bar)
X, Y and Z are the colorimetric quantities(Y is equal to the photometric intensity)
x, y and z are the color coordinates (x and y are the coordinates in the CIE-Diagram)

Color Purity
• Color Purity defines “how far away” a color is from it’s corresponding pure color
• Reference is Illuminant E(0.333,0.333)
9
E(0.333,0.333)• Color Purity= a/b

Correlated Color Temperature
• Correlated Color Temperature (CCT) is the temperature of a black body source most similar in color to a source in question
• Only applicable for
10
• Only applicable for sources close to the black body curve (white light)

Typical LED Spectra
0.5
0.6
0.7
0.8
0.9
1
Rel
In
ten
sity
[a.
u.]
AlInGaP Amber
AlInGaP Red
InGaN Blue
InGaN Green
InGaN White
11
0
0.1
0.2
0.3
0.4
0.5
400 450 500 550 600 650 700 750 800
Wavelength [nm]
Rel
In
ten
sity
[a.
u.]
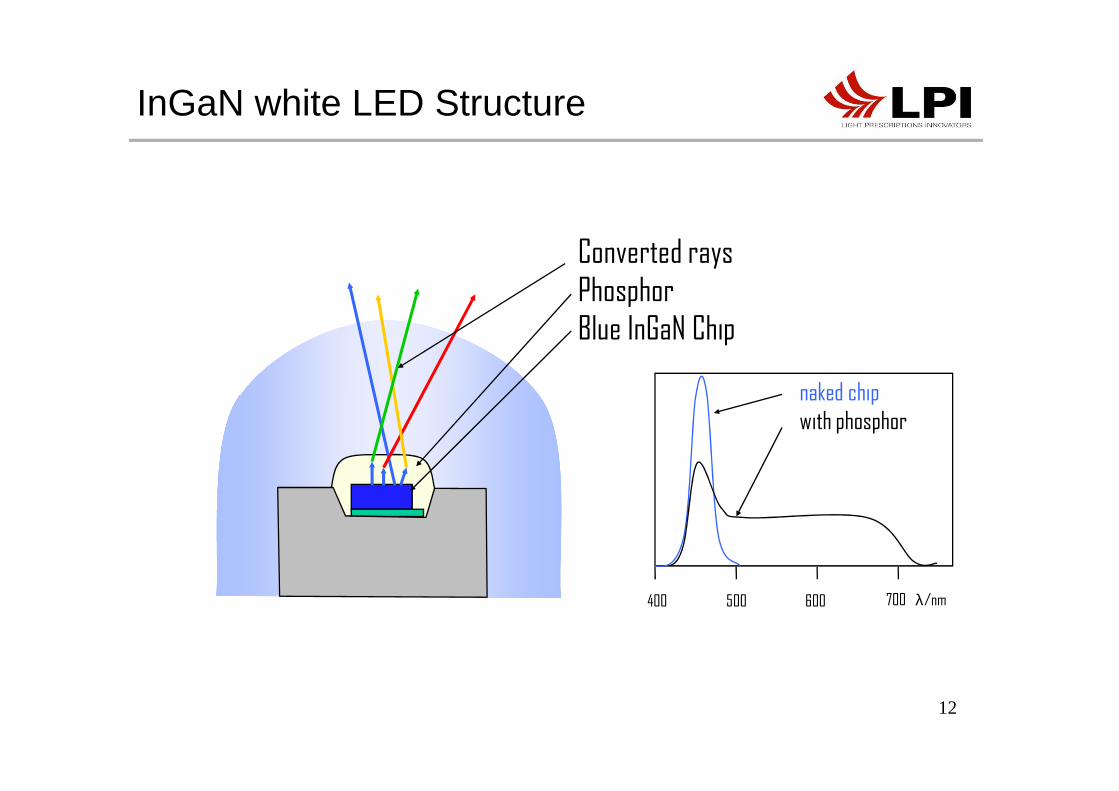
Converted raysPhosphorBlue InGaN Chip
Spectrum:naked chip
InGaN white LED Structure
12
Spectrum:
400 500 600
naked chipwith phosphor
700 λ/nm

The Human Eye Response
• All radiation which can be see with the eye is considered light (approx. 400nm to 750nm)– Radiation is measured in radiometric units, and– Light is measured in photometric units.
• The sensitivity of the eye is dependant on the wavelength of the light (e.g. the eye is 10,000 times more sensitive to 555nm-Green
13
light (e.g. the eye is 10,000 times more sensitive to 555nm-Green than to 750nm-Red).
• The response of the eye is logarithmic (high dynamic range).• The average human eye can only see the difference of a factor of
two to one in intensity (the eye is a bad detector).
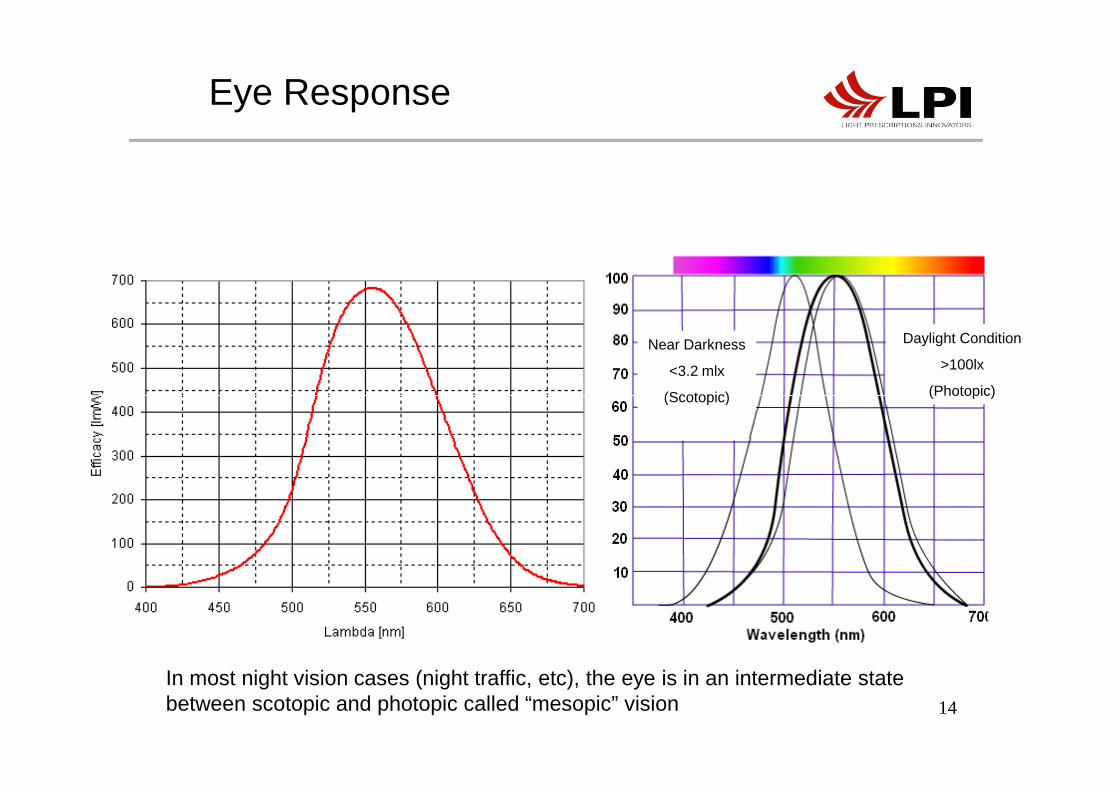
Eye Response
Near Darkness
<3.2 mlx
(Scotopic)
Daylight Condition
>100lx
(Photopic)
14
(Scotopic) (Photopic)
In most night vision cases (night traffic, etc), the eye is in an intermediate state between scotopic and photopic called “mesopic” vision

Intensity I and Solid Angle Ω
r
d
A
Definitions:
2
:r dfor
dA
d
dI
π==Ω
<<ΩΦ=
15
Radiometric Intensity: Iv [W/sr]
Photometric Intensity: I [lm/sr] or [cd], Candela
Solid Angle Units: Ω [sr], Steradian
r22 4r
d
r
A π==Ω

Conversion from Intensity to flux
ϕθ dId Ω=Φ:Form integralin Rewrite
),(
:element angle solid a into emitted
source a of fieldfar in theFlux
16
θθθπ
ϕθθϕθ
π
dI
ddI
∫
∫ ∫
=Φ
=Φ
0
)sin()(2
:Symmetry rotationalfor Flux Total
)sin(),(

Lambertian Emitter
Typical radiation pattern of a flat surface :(i.e. LED chip top surface)
)cos()( 0 θθ II =
Total flux in a cone with an opening angle 2 θ:
θ 0.8
0.9
1
Inte
nsity
[cd
], F
lux
[lm/p
i]
Intensity
Total Included Flux
2 θ
17
The total flux of a Lambertian source of 1 cd on axis is π lm!To collect for example 90% of the Flux of a Lambertian source, the optics must capture a cone ±72 deg off axis angle
02
0
0
0
)(sin
')'sin()'cos(2
')'sin()'(2
I
dI
dI
θπ
θθθπ
θθθπ
θ
θ
=
=
=Φ
∫
∫
0
0.1
0.2
0.3
0.4
0.5
0.6
0.7
0.8
0 10 20 30 40 50 60 70 80 90
Off Axis Angle
Inte
nsity
[cd
], F
lux
[lm/p
i]
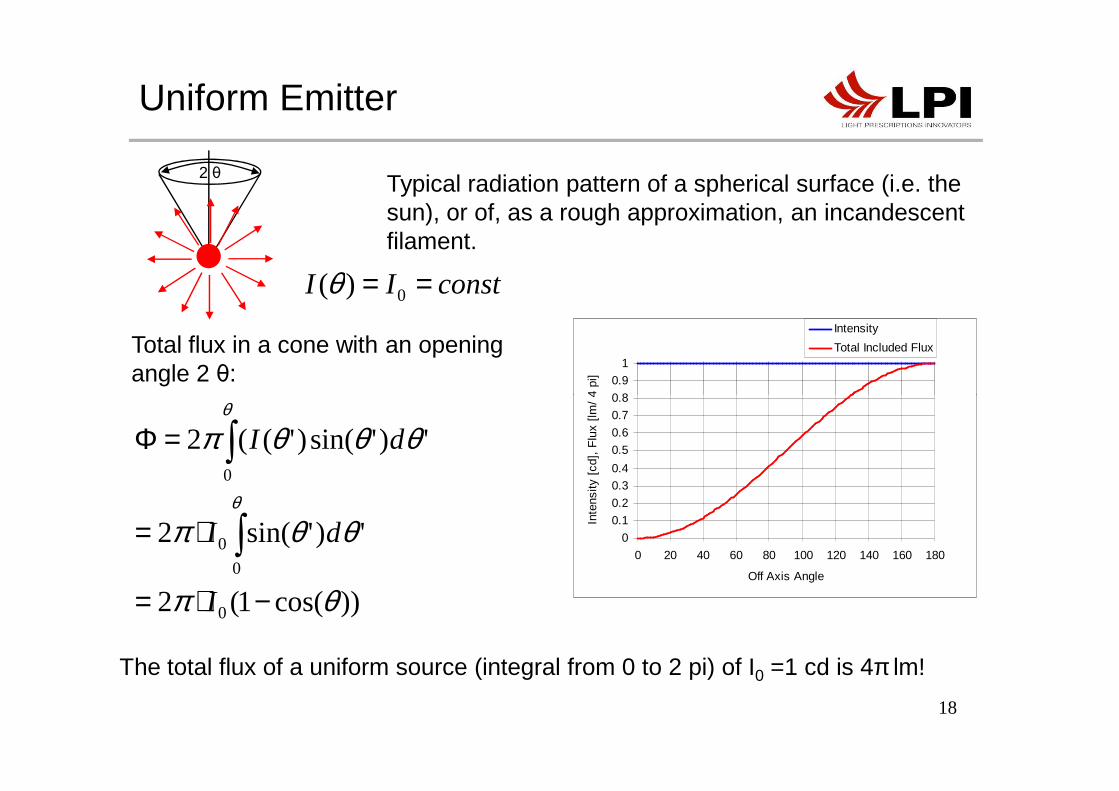
Uniform Emitter
Typical radiation pattern of a spherical surface (i.e. the sun), or of, as a rough approximation, an incandescent filament.
0.8
0.9
1
Inte
nsity
[cd
], F
lux
[lm/
4 pi
]
Intensity
Total Included Flux
constII == 0)(θ
Total flux in a cone with an opening angle 2 θ:
2 θ
18
))cos(1(2
')'sin(2
')'sin()'((2
0
0
0
0
θπ
θθπ
θθθπ
θ
θ
−⋅=
⋅=
=Φ
∫
∫
I
dI
dI
The total flux of a uniform source (integral from 0 to 2 pi) of I0 =1 cd is 4π lm!
0
0.1
0.2
0.3
0.4
0.5
0.6
0.7
0.8
0 20 40 60 80 100 120 140 160 180
Off Axis AngleIn
tens
ity [
cd],
Flu
x [lm
/ 4
pi]
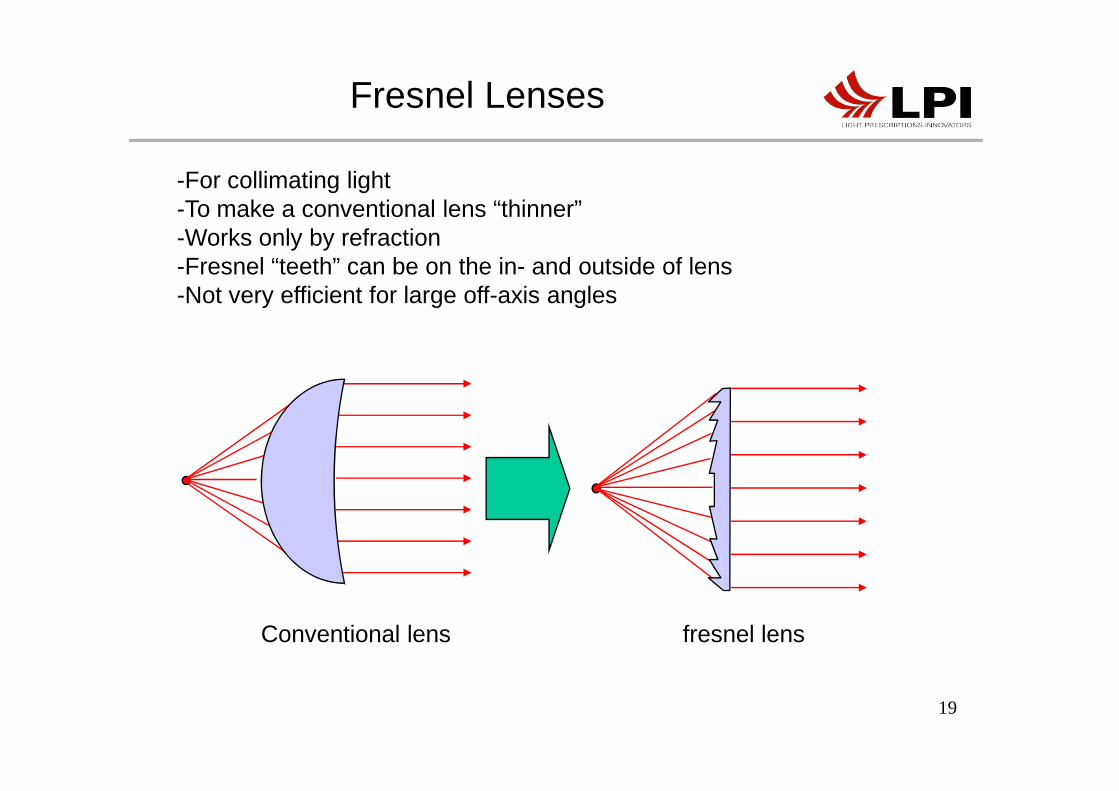
Fresnel Lenses
-For collimating light-To make a conventional lens “thinner”-Works only by refraction-Fresnel “teeth” can be on the in- and outside of lens-Not very efficient for large off-axis angles
19
Conventional lens fresnel lens

TIR Lenses
-For collimating light-To make a conventional lens “thinner”-Works by refraction AND total internal reflection-“Teeth” are on the inside of lens-Very efficient for large off-axis angles, no so efficient for small angles-TIR Reflection has NO losses if the surface of the facet it perfect!
TIR
20TIR lensConventional lens

optimum transfer of luminous powerNIO
SourceA B
SourceA B
Nonimaging Optics (NIO)
21
IMAGINGOPTICAL SYSTEM
ReceiverA’ B’
NONIMAGING OPTICAL SYSTEM
Receiver
Source image No Source image

NIO Design Rules
SourceA B
Basic conservation and design rules:
•Flux conservation•Etendue conservation
22
NONIMAGING OPTICAL SYSTEM
Receiver
•Etendue conservation•Luminance conservation•Edge ray principle

inΦ
A passive optical system always decreases thesource flux due to absorption and reflection losseswithin the optical system:
Flux conservation:
Flux Conservation and Efficiency
inout Φ≤Φ
OPTICAL
Source
Lost flux
Collection Efficiency:
sourceΦ
23
OPTICAL SYSTEM
Target
outΦ
Optical Efficiency:
sourcetargetopt ΦΦ= /η
The optical efficiency of a system depends on thedefinition of the “useful” flux that falls onto thedesired target (either a surface or far field angleinterval).
targetΦ
sourceincoll ΦΦ= /η
The collection efficiency is the fraction of the source flux captured by the optical system
Lost flux

sourceΦ
Illuminance
dA
dE
Φ= “Flux emitted by a surface element”
Illuminance [Lux]:
Source
Source
AE
Φ=
Average Source Illuminance:
24
Target
targetΦ
TargetA
SourceASourceA
Example: A 100 lm 1x1 mm2 LED chip has a total emitting surface of typically 2 mm2 (including it’s 4 lateral surfaces!) => E=50 lm/mm2
Typical values for a filament: 50 lm/ mm2
“Flux received or emitted by a surface element”Sun: 10-100000 lxReceived by surface:Desktop illumination: 500 lxECE LB: 6 lx, HB: 32 lx @ 25 m

Luminance [cd/m2]:“Perceived brightness of a source”
Luminance
SourceSourceA dA
dIL =
“Intensity emitted or received by a surface element
Or flux per surface and solid angle”
Average Source Luminance for Lambertian sources:
L
n
25
If the source emits into a full hemisphere, the second half of the equation holds. L in general is a function of angle. L is constant for lambertian sources
With the index of refraction (n) of medium surrounding the source
Typical values for a filament bulb (n=1): 5-20 cd/ mm2
Good bulb (automotive halogen): approx. 25 cd/ mm2
White LEDs: up to: 100 cd/ mm, constantly improvingSun: 1500 cd/ mm2
ππ ⋅⋅Φ=
⋅=
22 nAn
EL
Source
SourceSourceSource
SourceL

n
No optical system can increase the brightness of asource*.Transmittance t takes into account all reflective andabsorptive losses of “central” rays contributing to the hotspot.
Luminance Conservation
Sourceout LtL ⋅=Source
SourceA
SourceL
Luminance Conservation:
“Conservation of brightness”
26
spot.OPTICAL SYSTEM
Aperture ApA
Source
maxAp Lt
IA
⋅≥OutL
Minimum Optics Aperture Size for Hotspot:
A “real” aperture, that is not totally flashed as seenfrom the hotspot will have to be larger!Example: Desired Intensity: 1000 cd, sourceluminance: 2.1 cd / mm2, t=0.7: Aap>680 mm2
*A system that adds up different colors into the same light path (by dichroic mirrors) and light recycling systems (like BEF films) are the only exceptions

Far Field Definition for lambertian sources
27
Lambertian source of radius r with a detector of the same radius at distance d. The source is supposed to have uniform radiance, (luminance) so L1. To the far field intensity is pi r^2 L1 and the signal at the detector E2= I1/ d^2The signal of the very close to the source is the full flux from the source. The transition from near to far field is from d/r=0.1 .. 10. In the limit of a perfectly collimated source, the detector signal is independent from the distance, so that the near field extends to infinity.

D rdθ
Far Field Definition for peaked sources
Source
Detector
28
To see detail in a pattern with a resolution of dθ, the detector has to be at a distance of at least: R>D/(2 tan(dθ)). This insures that light emitted with dθ from any point of the source (the extreme edges) hits the detector Examples: D=50 mm, dθ=1 deg => r> 1.4 mD=50 mm, dθ= 0.2 deg => r> 7 mD= 100 mm, dθ= 0.1 deg => r> 28 m (automotive headlamp)

ns
Sometimes called luminosity, light-gathering power or acceptance.
Etendue in 2 Dimensions
Etendue Conservation, Simplified
)sin(2 θ⋅⋅⋅= ndESource
sd
sθ2 The Etendue in an optical system is conserved.
)sin( ssndd
θ⋅=⇒
29
OPTICAL SYSTEM
Apd
apθapθ
)sin( apap
sssap n
ddθ
⋅=⇒
Formula can be used in the horizontal and verticaldirection independently.Example: Desired exit angle θap=5º (half angle!),ds=1 mm, ns=1.5, nap=1, θs=90º (collect full LEDflux) => minimum aperture width: dap=17 mm
A smaller aperture can yield the same collimationangle θap- if the collection angle θs is reduced. =>
Too small aperture + too small collimationangle => low efficiency

Etendue in 3 Dimensions,rotational symmetric emission
Etendue 3D, simplified
AnE ⋅⋅⋅= )(sin22 θπθ
Assumes that all light emitted is confined in a cone of 2x the opening angle theta
30
Source, Aof 2x the opening angle theta
AnE ⋅−⋅⋅= ))(sin)((sin 22
122 θθπ
Etendue in 3 Dimensions,rotational symmetric emission in limited angle cone,2D formula does not apply in this case!

Rays emerging (impinging) from the edge of a source and/ or under the maximum angle to a reference surface are called edge rays.
The Edge Ray PrincipleSource
Edge rays of the source
These are not edge rays
Edge Ray Principle
31
The edge-ray principle states that, in order to couple an emitted ray bundles by means of an optical system to a target ray bundle, it is sufficient to connect the edge-ray subsets.
In simpler words: If the optical systems is designed to transmit the source edge rays to the target, all other rays will also hit the target.
NONIMAGING OPTICAL SYSTEM
Target
Edge rays of the target

Source Image Superposition
Source Pinholes Images
Superposition Principle:
A Far Field Intensity pattern can be understood as a superposition of far field
32
superposition of far field images of the source (although this imaging not always occurs) through pinholes at exit surface.
Optical System
Screen at 25 m

The SMS method is the most recent and advanced design tool in NIO
The SMS method provides devices that perform close to the theoretical limits: prescribed intensity patterns achievable with the maximum efficiency
It uses the principles of refraction (R), reflection (X) and TIR (I) in optical
Simultaneous Multiple Surface (SMS) technology
33
It uses the principles of refraction (R), reflection (X) and TIR (I) in optical elements
It numerically creates at least two surfaces at the same time
LPI is holding several patents that protect the SMS method

Example
In the following slides a typical Free-Form-Optics design problem is introduced to compare conventional methods to the SMS method:
34
“Generation of a prescribed Far Field Radiation pattern from a known light source (incandescent, LED, HID…)”
Typical application: Car Head lamps
Screen at 25 m

Conventional Free From Design Methods
• Creates one free-from surface (= reflective or refractive surface, others can be “chosen”)
• Can be solved either by iterative procedures or by solving non-linear differential equation
• Allows to produce a desired radiation pattern for a Point Source
35
• Allows to produce a desired radiation pattern for a Point Source
• Extended source will produce different radiation pattern => repeat the design process with a different point source target radiation pattern until extended source radiation pattern is “good”

• Design controls only the position of one point of the source image (center, edge or corner) but not it’s size and shape
H
V
H
Conventional Free From Design Methods
36
• Single Free Form Reflector design: The image of the source always rotates
⇒ large vertical spread
H
V

3D-SMS DESIGN
• Method generates at least two free-form surfaces at the same time (refractive or reflective, more surfaces can be “chosen”)
• Two design points guide extended source image
H
V
37
• Gives control of vertical image size
• Gives full control over image width and rotation
• Produces minimum vertical spread, no rotation, optimized pattern estetics
H
V

Comparison Conventional/ SMS
Conventional SMS
Number of surfaces created: One Two (or more)
Source model: Point Source Extended Source
Image Rotation control: No Yes
38
Image Size control: No Yes
Optics Aperture Size: Large Close to physical limit
Optics Depth Deep (?) Can be minimized
Efficiency: ? Up to 85%

• The Machband describes an effect where the human mind subconsciously increases the contrast between two surfaces with different luminance=> good for distinghuising objects and detecting illuminance steps
• Mach banding is caused by lateral inhibition of the receptors in the eye. As receptors receive light they draw light-sensitive chemical compounds from adjacent regions, thus inhibiting the response of receptors in those regions.
Machband Effect
39
Perceived (dotted) and real illuminance (gray line) of image
above
Top Related