


Languages
Pages
Legal


Lampiran 1
KUISIONER PENELITIAN
PENGARUH PERILAKU TENAGA KERJA TERHADAP PENERAPAN MANAJEMEN KESELAMATAN DAN KESEHATAN KERJA DI BAGIAN PRODUKSI PT. GOLD COIN INDONESIA TAHUN 2010
I. Data Karakteristik Responden
a. Nomor Responden :
b. Nama :
c. Umur : a. 20-30 tahun
b. 31-40 tahun
c. 41-50 tahun
d. Pendidikan : a. Lulus SMP
b. Lulus SMA
c. Lulus S1
d. Lulus S2
Universitas Sumatera Utara

II. Pertanyaan Penelitian
A. Variabel Bebas (Prilaku Pekerja)
1. Pengetahuan
No Pernyataan Sangat Tahu Tahu Tidak
Tahu
1 Penerapan MK3 dapat mencegah dan mengurangi kecelakaan kerja
2 Penerapan MK3 dapat mencegah dan mengurangi penyakit akibat kerja
3 Standar operasi prosedur kerja yang telah ditetapkan
4 Arti dari setiap pelabelan yang dibuat untuk bahan-bahan berbahaya (B3)
5 Mengetahui Material Safety Data Sheet (MSDS) setiap bahan-bahan kimia yang digunakan
6 Kelengkapan isi kotak P3K sangat penting
7 Fasilitas ruang P3K sangat penting
8 Prosedur menggunakan APD secara benar
9 Pentingnya pencahayaan di tempat kerja
10 Pentingnya ventilasi (sirkulasi udara) yang baik ditempat kerja
11 Kebisingan mesin dapat menyebabkan tuli permanen
12 Banyaknya debu di tempat kerja dapat mengganggu fungsi paru
13 Cara kerja dan posisi kerja yang baik dapat mengurangi kelelahan
Universitas Sumatera Utara
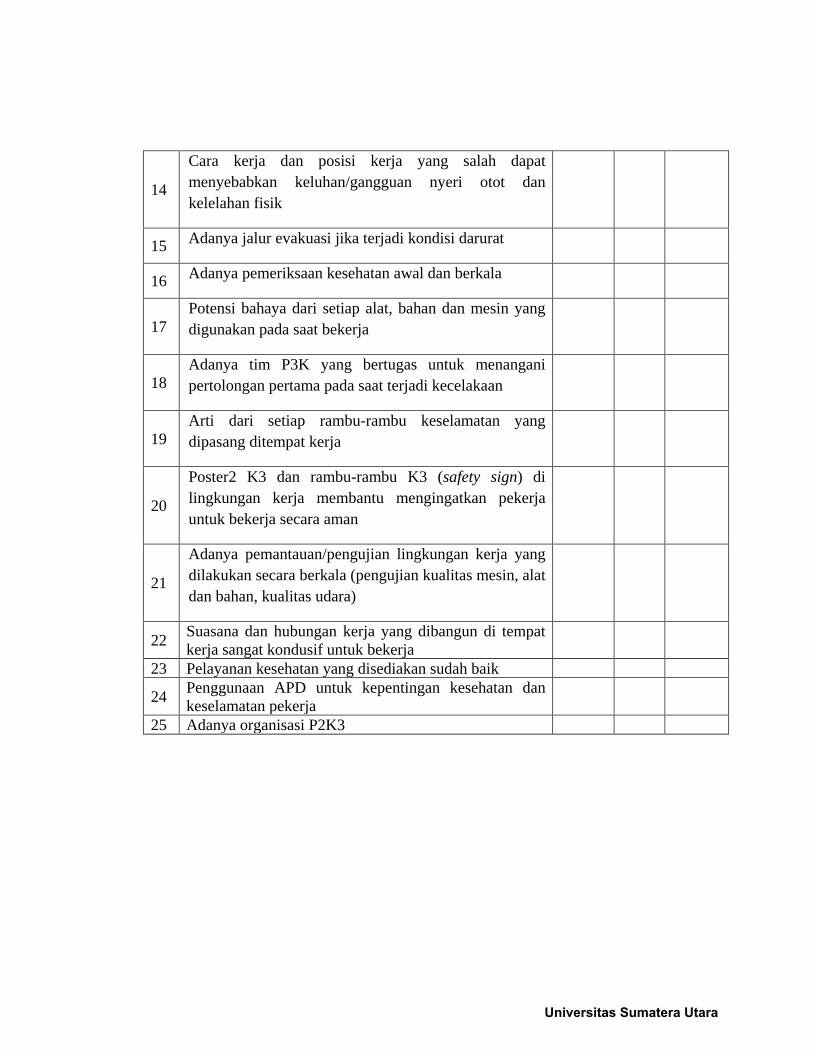
14
Cara kerja dan posisi kerja yang salah dapat menyebabkan keluhan/gangguan nyeri otot dan kelelahan fisik
15 Adanya jalur evakuasi jika terjadi kondisi darurat
16 Adanya pemeriksaan kesehatan awal dan berkala
17 Potensi bahaya dari setiap alat, bahan dan mesin yang digunakan pada saat bekerja
18 Adanya tim P3K yang bertugas untuk menangani pertolongan pertama pada saat terjadi kecelakaan
19 Arti dari setiap rambu-rambu keselamatan yang dipasang ditempat kerja
20
Poster2 K3 dan rambu-rambu K3 (safety sign) di lingkungan kerja membantu mengingatkan pekerja untuk bekerja secara aman
21
Adanya pemantauan/pengujian lingkungan kerja yang dilakukan secara berkala (pengujian kualitas mesin, alat dan bahan, kualitas udara)
22 Suasana dan hubungan kerja yang dibangun di tempat kerja sangat kondusif untuk bekerja
23 Pelayanan kesehatan yang disediakan sudah baik
24 Penggunaan APD untuk kepentingan kesehatan dan keselamatan pekerja
25 Adanya organisasi P2K3
Universitas Sumatera Utara

2. Sikap
No Pernyataan Sangat Setuju Setuju Tidak
Setuju
1 Penerapan MK3 dapat mencegah dan mengurangi kecelakaan kerja
2 Penerapan MK3 dapat mencegah dan mengurangi penyakit akibat kerja
3 Bekerja sesuai dengan Standar operasi prosedur kerja yang telah ditetapkan
4 Adanya pelabelan yang dibuat untuk setiap bahan-bahan berbahaya (B3)
5 Adanya Material Safety Data Sheet (MSDS) setiap bahan-bahan kimia yang digunakan
6 Fasilitas isi kotak P3K sangat lengkap 7 Fasilitas ruang P3K sudah baik
8 Bekerja menggunakan APD secara benar sesuai prosedur
9 Pencahayaan di tempat kerja sudah cukup memadai 10 Ventilasi (sirkulasi udara) di tempat kerja bagus
11 Kebisingan di tempat kerja sudah dikendalikan dengan alat pelindung telinga
12 Potensi bahaya debu di tempat kerja sudah dikendalikan dengan adanya masker
13 Cara kerja dan posisi kerja yang baik dapat mengurangi kelelahan
14 Cara kerja dan posisi kerja yang salah dapat menimbulkan keluhan nyeri otot dan kelelahan fisik
15 Jalur evakuasi jika terjadi kondisi darurat sangat penting diketahui oleh pekerja
16 Adanya pemeriksaan kesehatan pekerja awal dan secara berkala setiap tahun
17 Adanya potensi bahaya dari setiap alat, bahan dan mesin yang digunakan pada saat bekerja
18 Tim P3K yang bertugas untuk menangani pertolongan pertama pada saat terjadi kecelakaan dalam
Universitas Sumatera Utara

melaksanakan tugasnya sangat efektif
19 Pekerja harus mengetahui arti dari setiap rambu-rambu keselamatan yang dipasang ditempat kerja
20 Poster2 K3 dan rambu-rambu K3 (safety sign) di lingkungan kerja membantu mengingatkan pekerja untuk bekerja secara aman
21 Adanya pemantauan/pengujian lingkungan kerja yang dilakukan secara berkala (pengujian kualitas mesin, alat dan bahan, kualitas udara)
22 Suasana dan hubungan kerja yang dibangun di tempat kerja sangat kondusif untuk bekerja
23 Pelayanan kesehatan yang disediakan sudah baik
24 Penggunaan APD untuk kepentingan kesehatan dan keselamatan pekerja
25 Adanya organisasi P2K3
PEDOMAN OBSERVASI TINDAKAN PEKERJA
No Pernyataan Ya Tidak 1 Bekerja selalu menggunakan APD 2 Tenaga kerja menjalankan peraturan K3 yang telah ditetapkan 3 Tenaga kerja menggunakan fasilitas kotak P3K 4 Bekerja sesuai SOP yang telah ditetapkan 5 Memanfaatkan fasilitas pelayanan kesehatan yang disediakan 6 Memperhatikan safety sign dalam bekerja 7 Cara kerja dan posisi kerja sudah ergonomis 8 Memperhatikan MSDS setiap bahan kimia yang digunakan
9 Memperhatikan pelabelan setiap bahan-bahan berbahaya yang digunakan
10 Memelihara APD yang telah disediakan perusahaan dengan baik
Universitas Sumatera Utara

B. Variabel Terikat (Penerapan MK3)
No Pernyataan Baik Tidak Baik
1 Penyediaan personil yang memiliki kompetensi dalam melakukan identifikasi, penilaian dan pengendalian potensi bahaya di lingkungan kerja
2 Menyelenggarakan pelatihan sesuai kebutuhan program K3 3 Penyediaan dana dan sarana pendukung program K3 4 Tenaga kerja dilibatkan secara aktif dalam setiap program K3
5 Perusahaan memberikan reaksi yang cepat dan tepat terhadap kondisi yang menyimpang
6 Informasi K3 terbaru dikomunikasikan ke tenaga kerja 7 Tanggung jawab suvervisor atas kinerja K3 di unit kerjanya
8 Petugas P3K yang menangani pertolongan pertama jika terjadi kecelakaan telah mendapatkan pelatihan P3K
9 Petugas penanggulangan kebakaran telah mendapatkan pelatihan fire safety
10 Pekerja selalu diberi arahan tentang bahaya fisik, kimia, ergonomik, biologis dan psikologis yang mungkin dapat menciderai dan melukai pada saat bekerja
11 Pekerja selalu diberi arahan tentang bagaimana mengindentifikasi bahaya yang mengancam pada saat bekerja dan bagaimana mencegah terjadinya insiden
12 Prosedur kerja telah didokumentasikan dan disosialisasikan kepada seluruh pekerja
13 Prosedur pelaporan informasi yang terkait dengan identifikasi sumber bahaya, kinerja K3, kecelakaan kerja
14 Dokumentasi kebijakan, tujuan dan sasaran K3 secara sistematik dan peranan, tanggung jawab dan SOP pelaksanaan program K3
15 Petugas yang berkompeten telah mengidentifikasi dan menilai potensi bahaya dan risiko K3 yang berkaitan dengan operasi
16 Prosedur menghadapi keadaan darurat dan bencana alam
17 Sosialisasi informasi cara penggunaan bahan, alat dan mesin yang digunakan mengenai identifikasi, penilaian dan pengendalian risiko kecelakaan dan penyakit akibat kerja.
18 Prosedur menghadapi insiden yang meliputi penyediaan fasilitas P3K dengan jumlah yang cukup dan sesuai sampai mendapatkan pertolongan medik, dan proses perawatan lanjutan
Universitas Sumatera Utara

19 Prosedur rencana pemulihan keadaan gawat darurat dan pemulihan tenaga kerja yang trauma
20 Alat pelindung diri yang berkualitas telah disediakan
21 Pekerja diberi arahan tentang bagaimana menggunakan APD secara benar dan memelihara APD sehingga selalu dalam kondisi layak pakai
22 Pengawasan yang dilakukan petugas berwenang untuk menjamin pekerjaan dilaksanakan secara aman dan mengikuti setiap prosedur kerja yang telah ditetapkan
23 Rambu-rambu mengenai keselamatan dan tanda pintu darurat telah diapasang dengan jelas
24 Pengujian lingkungan kerja secara berkala (pengujian kualitas bising mesin, kualitas udara di lingkungan kerja, pengujian kualitas pencahayaan) setiap tahun
25 Pemeriksaan kesehatan pekerja secara berkala setiap tahun
Universitas Sumatera Utara
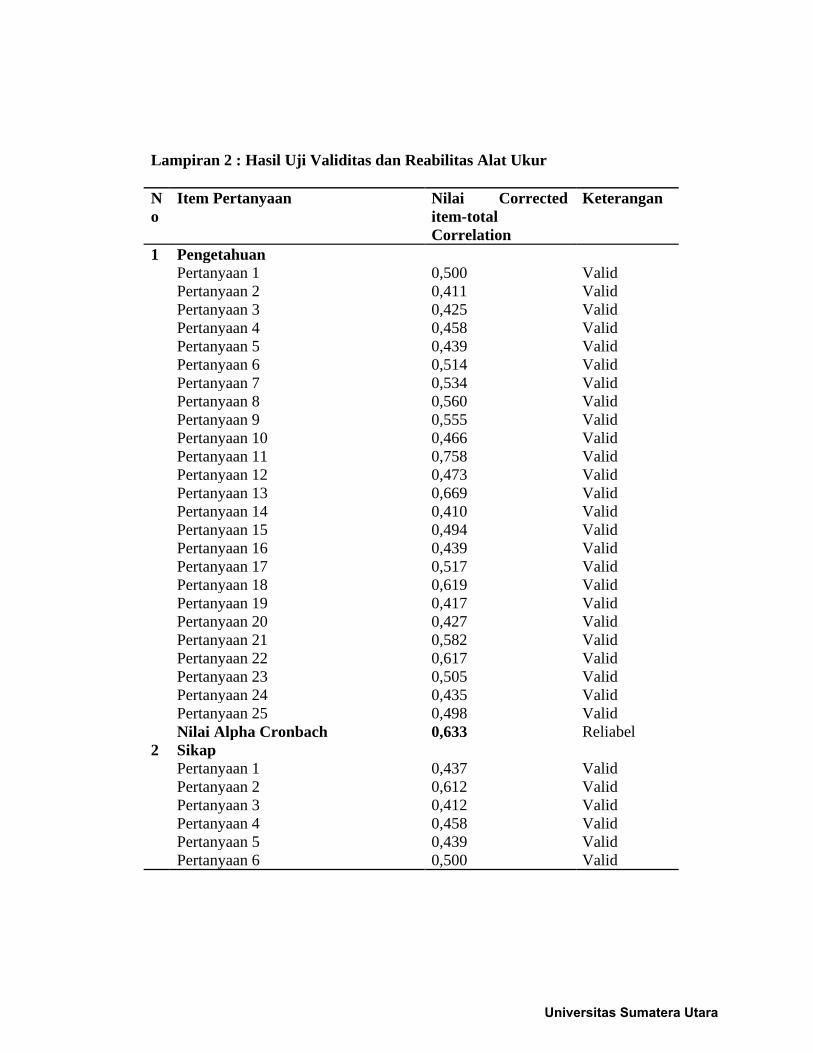
Lampiran 2 : Hasil Uji Validitas dan Reabilitas Alat Ukur
No
Item Pertanyaan Nilai Corrected item-total Correlation
Keterangan
1 Pengetahuan Pertanyaan 1 0,500 Valid Pertanyaan 2 0,411 Valid Pertanyaan 3 0,425 Valid Pertanyaan 4 0,458 Valid Pertanyaan 5 0,439 Valid Pertanyaan 6 0,514 Valid Pertanyaan 7 0,534 Valid Pertanyaan 8 0,560 Valid Pertanyaan 9 0,555 Valid Pertanyaan 10 0,466 Valid Pertanyaan 11 0,758 Valid Pertanyaan 12 0,473 Valid Pertanyaan 13 0,669 Valid Pertanyaan 14 0,410 Valid Pertanyaan 15 0,494 Valid Pertanyaan 16 0,439 Valid Pertanyaan 17 0,517 Valid Pertanyaan 18 0,619 Valid Pertanyaan 19 0,417 Valid Pertanyaan 20 0,427 Valid Pertanyaan 21 0,582 Valid Pertanyaan 22 0,617 Valid Pertanyaan 23 0,505 Valid Pertanyaan 24 0,435 Valid Pertanyaan 25 0,498 Valid Nilai Alpha Cronbach 0,633 Reliabel
2 Sikap Pertanyaan 1 0,437 Valid Pertanyaan 2 0,612 Valid Pertanyaan 3 0,412 Valid Pertanyaan 4 0,458 Valid Pertanyaan 5 0,439 Valid Pertanyaan 6 0,500 Valid
Universitas Sumatera Utara

No
Item Pertanyaan Nilai Corrected item-total Correlation
Keterangan
Pertanyaan 7 0,411 Valid Pertanyaan 8 0,510 Valid Pertanyaan 9 0,428 Valid Pertanyaan 10 0,432 Valid Pertanyaan 11 0,419 Valid Pertanyaan 12 0,491 Valid Pertanyaan 13 0,564 Valid Pertanyaan 14 0,622 Valid Pertanyaan 15 0,476 Valid Pertanyaan 16 0,491 Valid Pertanyaan 17 0,442 Valid Pertanyaan 18 0,418 Valid Pertanyaan 19 0,601 Valid Pertanyaan 20 0,421 Valid Pertanyaan 21 0,435 Valid Pertanyaan 22 0,468 Valid Pertanyaan 23 0,472 Valid Pertanyaan 24 0,418 Valid Pertanyaan 25 0,625 Valid Nilai Alpha Cronbach 0,621 Reliabel
3 Tindakan Pertanyaan 1 0,581 Valid Pertanyaan 2 0,472 Valid Pertanyaan 3 0,498 Valid Pertanyaan 4 0,447 Valid Pertanyaan 5 0,522 Valid Pertanyaan 6 0,436 Valid Pertanyaan 7 0,563 Valid Pertanyaan 8 0,613 Valid Pertanyaan 9 0,541 Valid Pertanyaan 10 0,605 Valid Nilai Alpha Cronbach 0,606 Reliabel
4 Penerapan SMK3 Pertanyaan 1 0,478 Valid Pertanyaan 2 0,416 Valid
N Item Pertanyaan Nilai Corrected Keterangan
Universitas Sumatera Utara

o item-total Correlation
Pertanyaan 3 0,416 Valid Pertanyaan 4 0,494 Valid Pertanyaan 5 0,492 Valid Pertanyaan 6 0,539 Valid Pertanyaan 7 0,417 Valid Pertanyaan 8 0,624 Valid Pertanyaan 9 0,610 Valid Pertanyaan 10 0,466 Valid Pertanyaan 11 0,421 Valid Pertanyaan 12 0,533 Valid Pertanyaan 13 0,572 Valid Pertanyaan 14 0,577 Valid Pertanyaan 15 0,432 Valid Pertanyaan 16 0,489 Valid Pertanyaan 17 0,493 Valid Pertanyaan 18 0,411 Valid Pertanyaan 19 0,452 Valid Pertanyaan 20 0,482 Valid Pertanyaan 21 0,491 Valid Pertanyaan 22 0,474 Valid Pertanyaan 23 0,430 Valid Pertanyaan 24 0,658 Valid Pertanyaan 25 0,644 Valid Nilai Alpha Cronbach 0,681 Reliabel
Universitas Sumatera Utara

Lampiran 3 MASTER DATA PENELITIAN “Pernyataan Sikap (S)”
No S1 S2 S3 S4 S5 S6 S7 S8 S9 S 10
S 11
S 12
S 13
S 14
S 15
S 16
S 17
S 18
S 19
S 20
S 21
S 22
S 23
S 24
S 25
Total S
1 2 1 3 2 1 2 2 1 2 3 3 3 1 1 3 2 3 2 2 1 2 2 2 3 1 50 2 2 1 3 3 1 2 2 3 2 3 3 3 1 1 2 2 3 2 2 1 2 3 2 3 2 54 3 2 1 3 1 1 3 2 1 2 3 3 3 1 1 3 3 3 2 2 2 2 3 2 2 2 53 4 2 2 3 2 1 2 2 1 2 2 2 3 1 1 3 2 2 2 3 2 3 2 2 3 1 51 5 2 2 3 3 1 3 2 2 2 3 2 3 2 2 3 2 2 2 3 2 2 3 2 3 1 57 6 2 2 2 2 1 3 2 2 2 3 2 2 1 1 2 2 3 3 3 2 3 3 2 3 1 54 7 2 2 3 2 1 2 2 2 2 3 2 2 2 2 2 2 3 2 2 1 3 2 2 3 2 53 8 3 2 3 1 1 3 2 1 3 3 2 3 1 1 3 2 2 1 2 1 2 2 2 3 2 51 9 3 2 2 2 1 2 3 1 2 3 2 2 1 1 3 3 2 1 2 1 2 3 2 3 2 51 10 3 1 3 1 1 2 2 1 2 2 3 1 1 1 2 2 2 2 2 1 2 3 2 3 1 46 11 1 1 2 1 1 2 2 1 2 2 2 2 1 1 2 2 2 3 3 3 2 3 2 3 1 47 12 2 1 2 2 2 3 2 1 2 2 2 3 1 1 3 2 1 3 3 3 2 2 2 3 1 51 13 2 2 2 3 3 3 3 1 1 2 2 3 1 1 3 2 2 2 2 2 2 3 2 3 3 55 14 2 1 3 1 3 2 2 3 1 3 2 1 2 2 3 2 2 2 2 2 2 2 2 3 2 52 15 2 2 2 2 2 3 2 1 2 2 3 2 1 1 2 2 2 2 3 2 2 2 2 3 2 51 16 3 1 2 2 2 2 2 3 2 2 1 2 1 1 2 2 1 2 2 2 2 3 2 3 3 50 17 1 1 3 3 2 2 2 1 3 3 2 2 1 1 2 3 2 3 3 2 2 3 2 2 2 53 18 1 1 3 2 2 3 2 3 3 3 1 1 1 1 3 3 2 2 3 3 2 3 2 2 3 55 19 1 1 2 2 1 3 3 1 2 3 2 2 1 1 3 2 2 2 2 1 2 3 2 2 1 47 20 1 1 2 1 1 2 3 3 2 2 2 2 1 1 3 3 2 3 2 1 2 3 2 3 2 50 21 2 1 3 3 2 2 3 2 1 2 2 2 1 1 3 2 2 1 3 3 2 2 3 3 1 52 22 2 1 3 3 2 2 2 3 3 3 2 1 2 2 2 3 1 2 3 3 2 2 3 3 3 58 23 2 2 2 1 3 3 2 3 3 3 3 2 1 1 2 2 2 2 2 1 2 2 2 3 2 53 24 3 2 3 2 2 2 2 1 2 3 2 2 3 3 2 2 3 3 2 1 3 3 2 3 2 58 25 3 1 3 1 1 3 3 1 3 3 1 3 1 1 3 2 3 2 3 3 2 2 2 3 2 55 26 3 3 2 2 2 3 3 3 3 2 2 2 2 2 2 2 2 3 3 3 2 3 1 3 3 61 27 1 2 2 2 2 3 3 1 1 3 1 2 1 1 2 2 2 2 3 3 2 3 2 3 1 50 28 2 2 2 3 2 2 2 3 2 3 2 3 2 2 2 3 2 3 3 3 2 2 2 3 1 58 29 2 2 2 2 2 2 2 1 2 2 2 3 1 1 2 3 3 2 3 2 3 3 2 3 1 53 30 2 1 2 2 1 2 2 3 2 2 2 2 1 1 3 3 3 2 2 2 3 3 2 3 2 53 31 1 2 2 2 1 2 3 3 3 3 3 1 3 3 3 3 3 2 2 2 3 2 2 3 2 59 32 1 1 2 3 2 3 2 2 2 3 2 1 3 3 2 3 2 2 3 2 2 3 2 3 2 56 33 1 1 2 3 1 3 2 1 2 2 2 3 1 1 2 3 3 3 3 2 2 3 2 3 1 52 34 1 1 2 3 2 3 2 1 2 2 2 2 1 1 1 3 2 3 2 1 2 3 2 2 2 48 35 2 1 3 2 2 2 3 2 1 2 1 2 1 1 2 2 1 3 2 2 1 2 2 2 2 46 36 2 1 3 1 2 2 3 1 3 3 1 2 1 1 1 2 1 3 3 1 2 2 2 2 2 47 37 2 2 3 1 1 2 2 3 3 3 2 2 3 3 2 2 2 3 3 2 2 2 3 3 2 58 38 1 1 3 1 1 2 2 1 1 3 2 3 1 1 1 2 2 3 3 2 2 2 3 3 2 48
Universitas Sumatera Utara

39 2 1 2 3 1 2 2 1 2 2 2 3 1 1 2 2 1 2 2 2 2 2 2 3 2 47 40 2 2 3 2 1 3 2 3 3 3 2 3 1 1 1 2 2 2 3 2 2 3 2 3 2 55 41 2 2 2 2 2 3 3 2 2 2 1 3 1 1 2 2 3 2 3 3 3 3 2 3 2 56 42 3 3 3 3 2 3 2 3 2 2 1 1 1 1 3 3 2 2 2 2 2 3 2 3 3 57 43 3 3 3 3 2 2 2 3 2 3 3 2 2 2 3 3 1 2 3 3 2 3 1 3 1 60 44 2 1 2 3 3 2 3 3 3 3 3 1 3 3 2 2 1 2 2 1 2 3 2 3 2 57 45 1 1 2 2 3 3 2 3 3 3 3 3 2 2 2 2 2 3 2 2 1 2 2 3 1 55 46 1 2 2 1 3 3 3 3 2 3 2 1 1 1 3 2 2 3 2 2 2 2 2 3 2 53 47 1 1 2 1 3 2 3 1 2 3 2 2 2 2 2 2 3 3 3 3 2 2 2 3 2 54 48 2 1 3 2 2 2 2 1 2 3 2 1 1 1 3 2 2 2 3 2 2 2 1 3 1 48
Lampiran 3 MASTER DATA PENELITIAN “Pertanyaan Tindakan (T)” NO T1 T2 T3 T4 T5 T6 T7 T8 T9 T10 Total
T 1 1 1 2 1 2 1 1 1 2 1 13 2 2 1 2 1 2 1 2 1 2 2 16 3 1 1 2 1 2 2 2 1 1 1 14 4 1 1 2 2 2 2 2 2 1 1 16 5 1 1 2 2 2 1 2 2 2 2 17 6 2 2 2 2 2 2 1 1 2 2 18 7 2 2 2 1 2 1 2 1 1 2 16 8 1 1 2 1 2 1 1 2 1 1 13 9 1 1 2 1 2 1 1 2 2 2 15 10 1 1 1 2 2 1 1 1 1 2 13 11 1 1 2 2 1 2 1 1 1 2 14 12 1 1 2 1 2 2 1 2 2 1 15 13 1 1 2 1 2 2 1 2 2 1 15 14 2 2 1 2 2 2 2 2 1 2 18 15 1 1 2 1 2 1 1 2 2 1 14 16 2 2 1 2 2 1 1 2 2 2 17 17 1 1 1 1 2 2 1 2 2 1 14 18 2 2 1 2 2 2 1 2 2 2 18 19 1 1 2 1 2 1 1 1 1 1 12 20 2 2 2 2 2 1 1 1 1 2 16 21 2 1 2 1 2 2 1 1 2 2 16 22 2 1 2 1 2 2 2 1 2 2 17 23 2 2 2 2 2 1 1 2 1 2 17 24 1 1 2 1 2 1 2 2 2 1 15 25 1 1 2 1 2 1 1 1 1 1 12 26 2 2 2 2 1 1 2 2 1 2 17 27 1 1 2 1 2 2 1 2 2 1 15 28 2 2 2 2 2 1 2 2 2 2 19
Universitas Sumatera Utara

29 1 1 2 1 2 1 1 2 2 1 14 30 2 2 1 1 2 1 1 1 1 2 14 31 2 2 1 2 2 2 2 1 1 2 17 32 1 1 2 1 2 2 2 2 2 2 17 33 1 1 2 1 2 1 1 1 2 1 13 34 1 1 1 1 2 1 1 2 2 1 13 35 1 1 1 1 2 2 1 2 2 2 15 36 1 1 2 1 2 1 1 2 1 1 13 37 2 2 2 2 2 1 2 1 1 2 17 38 1 1 2 1 2 2 1 1 1 1 13 39 1 1 2 1 2 2 1 1 2 1 14 40 2 2 2 2 2 2 1 1 2 2 18 41 2 2 2 2 2 2 1 2 2 2 19 42 2 1 2 1 2 2 1 2 2 2 17 43 2 1 1 2 1 2 2 2 2 2 17 44 2 2 2 2 2 1 2 2 2 2 19 45 2 2 2 2 2 1 2 2 1 2 18 46 2 2 2 2 2 2 1 2 1 2 18 47 1 1 2 2 2 2 2 2 1 1 16 48 1 1 2 2 1 1 1 2 1 1 13
Universitas Sumatera Utara
Lampiran 4
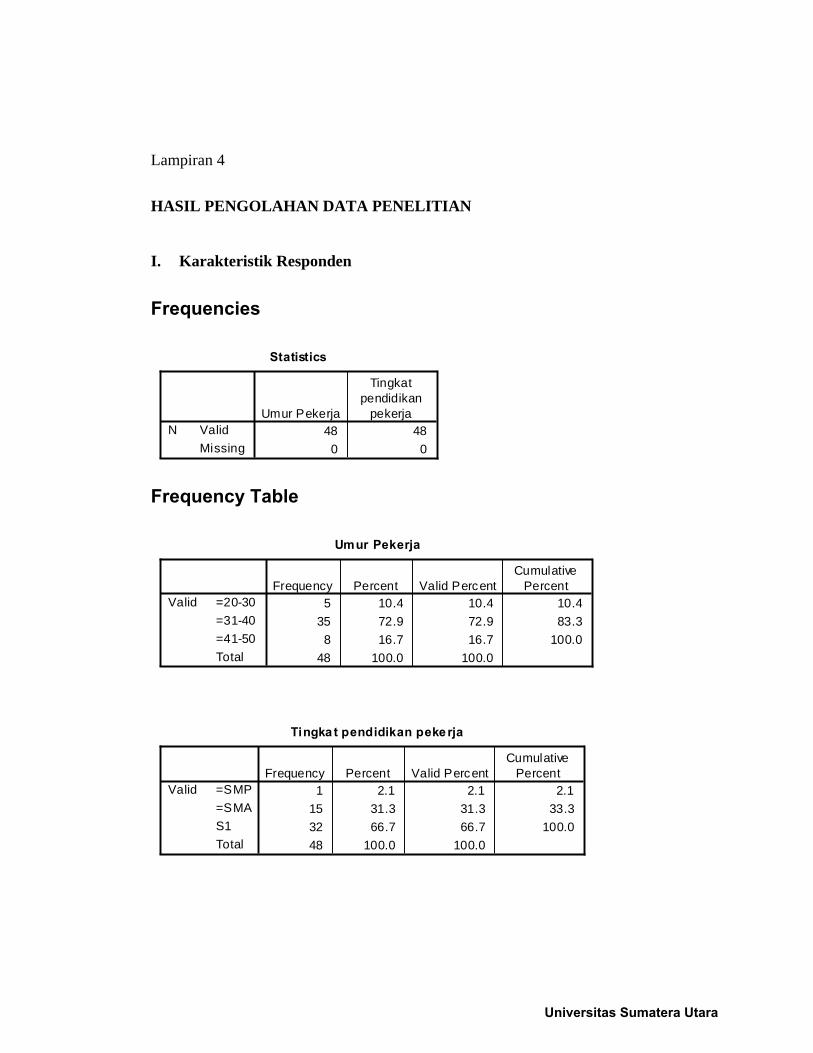
HASIL PENGOLAHAN DATA PENELITIAN
I. Karakteristik Responden
Frequencies
Statistics
48 480 0
ValidMissing
NUmur Pekerja
Tingkatpendidikan
pekerja
Frequency Table
Umur Pekerja
5 10.4 10.4 10.435 72.9 72.9 83.3
8 16.7 16.7 100.048 100.0 100.0
=20-30=31-40=41-50Total
ValidFrequency Percent Valid Percent
CumulativePercent
Tingka t pendidikan pekerja
1 2.1 2.1 2.115 31.3 31.3 33.332 66.7 66.7 100.048 100.0 100.0
=SMP=SMAS1Total
ValidFrequency Percent Valid Percent
CumulativePercent
Universitas Sumatera Utara

II. Hasil Univariat
Frequency Table
Pernyataan Pengetahuan 1
15 31.3 31.3 31.325 52.1 52.1 83.3
8 16.7 16.7 100.048 100.0 100.0
123Total
ValidFrequency Percent Valid Percent
CumulativePercent
Pernyataan Pengetahuan 2
24 50.0 50.0 50.019 39.6 39.6 89.6
5 10.4 10.4 100.048 100.0 100.0
123Total
ValidFrequency Percent Valid Percent
CumulativePercent
Pernyataan Pengetahuan 3
23 47.9 47.9 47.925 52.1 52.1 100.048 100.0 100.0
23Total
ValidFrequency Percent Valid Percent
CumulativePercent
Pernyataan Pengetahuan 4
20 41.7 41.7 41.718 37.5 37.5 79.210 20.8 20.8 100.048 100.0 100.0
123Total
ValidFrequency Percent Valid Percent
CumulativePercent
Universitas Sumatera Utara

Pernyataan Pengetahuan 5
21 43.8 43.8 43.821 43.8 43.8 87.5
6 12.5 12.5 100.048 100.0 100.0
123Total
ValidFrequency Percent Valid Percent
CumulativePercent
Pernyataan Pengetahuan 6
6 12.5 12.5 12.542 87.5 87.5 100.048 100.0 100.0
23Total
ValidFrequency Percent Valid Percent
CumulativePercent
Pernyataan Pengetahuan 7
6 12.5 12.5 12.542 87.5 87.5 100.048 100.0 100.0
23Total
ValidFrequency Percent Valid Percent
CumulativePercent
Pernyataan Pengetahuan 8
18 37.5 37.5 37.530 62.5 62.5 100.048 100.0 100.0
23Total
ValidFrequency Percent Valid Percent
CumulativePercent
Pernyataan Pengetahuan 9
27 56.3 56.3 56.321 43.8 43.8 100.048 100.0 100.0
23Total
ValidFrequency Percent Valid Percent
CumulativePercent
Universitas Sumatera Utara
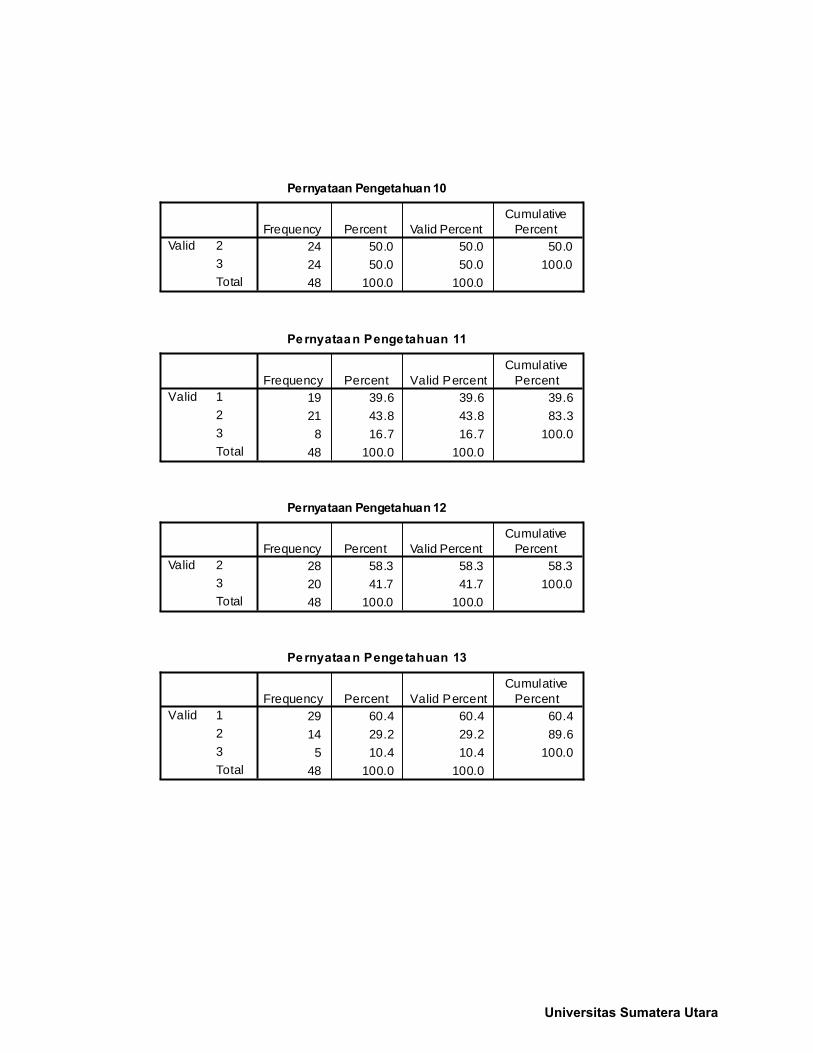
Pernyataan Pengetahuan 10
24 50.0 50.0 50.024 50.0 50.0 100.048 100.0 100.0
23Total
ValidFrequency Percent Valid Percent
CumulativePercent
Pernyataan Pengetahuan 11
19 39.6 39.6 39.621 43.8 43.8 83.3
8 16.7 16.7 100.048 100.0 100.0
123Total
ValidFrequency Percent Valid Percent
CumulativePercent
Pernyataan Pengetahuan 12
28 58.3 58.3 58.320 41.7 41.7 100.048 100.0 100.0
23Total
ValidFrequency Percent Valid Percent
CumulativePercent
Pernyataan Pengetahuan 13
29 60.4 60.4 60.414 29.2 29.2 89.6
5 10.4 10.4 100.048 100.0 100.0
123Total
ValidFrequency Percent Valid Percent
CumulativePercent
Universitas Sumatera Utara

Pernyataan Pengetahuan 14
16 33.3 33.3 33.315 31.3 31.3 64.617 35.4 35.4 100.048 100.0 100.0
123Total
ValidFrequency Percent Valid Percent
CumulativePercent
Pernyataan Pengetahuan 15
8 16.7 16.7 16.726 54.2 54.2 70.814 29.2 29.2 100.048 100.0 100.0
123Total
ValidFrequency Percent Valid Percent
CumulativePercent
Pernyataan Pengetahuan 16
29 60.4 60.4 60.419 39.6 39.6 100.048 100.0 100.0
23Total
ValidFrequency Percent Valid Percent
CumulativePercent
Pernyataan Pengetahuan 17
16 33.3 33.3 33.318 37.5 37.5 70.814 29.2 29.2 100.048 100.0 100.0
123Total
ValidFrequency Percent Valid Percent
CumulativePercent
Universitas Sumatera Utara

Pernyataan Pengetahuan 18
23 47.9 47.9 47.925 52.1 52.1 100.048 100.0 100.0
23Total
ValidFrequency Percent Valid Percent
CumulativePercent
Pernyataan Pengetahuan 19
14 29.2 29.2 29.217 35.4 35.4 64.617 35.4 35.4 100.048 100.0 100.0
123Total
ValidFrequency Percent Valid Percent
CumulativePercent
Pernyataan Pengetahuan 20
14 29.2 29.2 29.217 35.4 35.4 64.617 35.4 35.4 100.048 100.0 100.0
123Total
ValidFrequency Percent Valid Percent
CumulativePercent
Pernyataan Pengetahuan 21
3 6.3 6.3 6.331 64.6 64.6 70.814 29.2 29.2 100.048 100.0 100.0
123Total
ValidFrequency Percent Valid Percent
CumulativePercent
Universitas Sumatera Utara
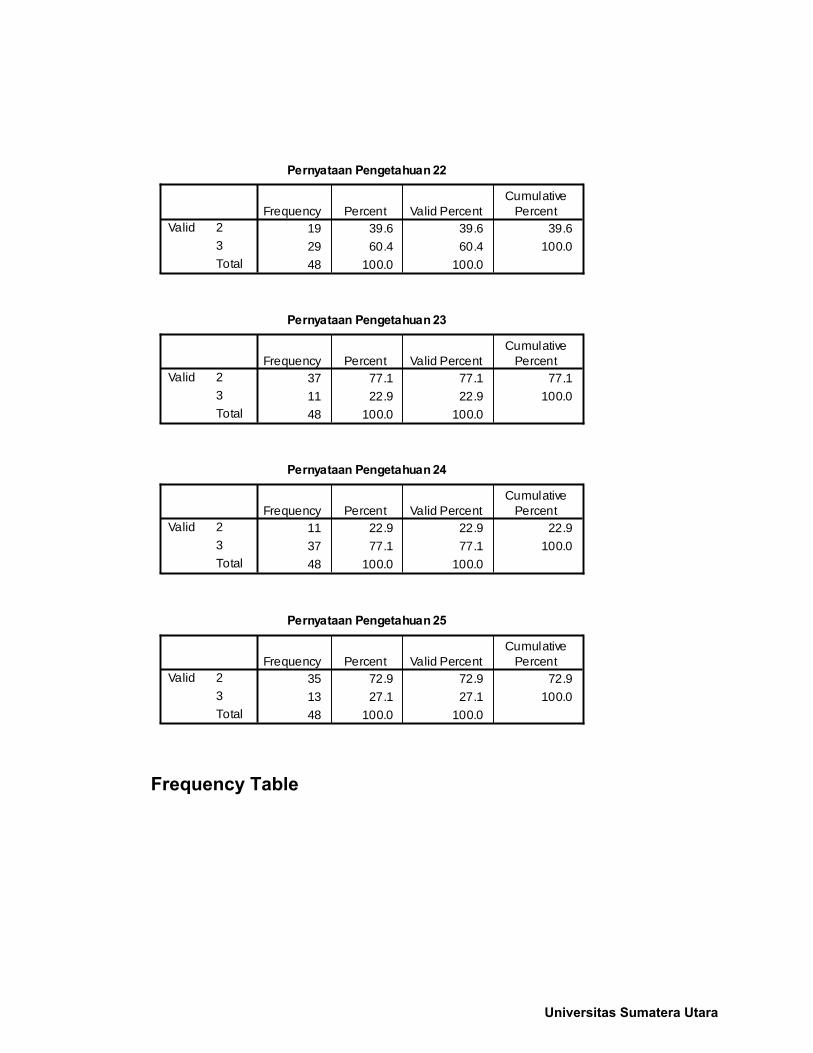
Pernyataan Pengetahuan 22
19 39.6 39.6 39.629 60.4 60.4 100.048 100.0 100.0
23Total
ValidFrequency Percent Valid Percent
CumulativePercent
Pernyataan Pengetahuan 23
37 77.1 77.1 77.111 22.9 22.9 100.048 100.0 100.0
23Total
ValidFrequency Percent Valid Percent
CumulativePercent
Pernyataan Pengetahuan 24
11 22.9 22.9 22.937 77.1 77.1 100.048 100.0 100.0
23Total
ValidFrequency Percent Valid Percent
CumulativePercent
Pernyataan Pengetahuan 25
35 72.9 72.9 72.913 27.1 27.1 100.048 100.0 100.0
23Total
ValidFrequency Percent Valid Percent
CumulativePercent
Frequency Table
Universitas Sumatera Utara

Pernyataan Sikap 1
14 29.2 29.2 29.225 52.1 52.1 81.3
9 18.8 18.8 100.048 100.0 100.0
123Total
ValidFrequency Percent Valid Percent
CumulativePercent
Pernyataan Sikap 2
27 56.3 56.3 56.318 37.5 37.5 93.8
3 6.3 6.3 100.048 100.0 100.0
123Total
ValidFrequency Percent Valid Percent
CumulativePercent
Pernyataan Sikap 3
25 52.1 52.1 52.123 47.9 47.9 100.048 100.0 100.0
23Total
ValidFrequency Percent Valid Percent
CumulativePercent
Pernyataan Sikap 4
13 27.1 27.1 27.121 43.8 43.8 70.814 29.2 29.2 100.048 100.0 100.0
123Total
ValidFrequency Percent Valid Percent
CumulativePercent
Universitas Sumatera Utara

Pernyataan Sikap 5
21 43.8 43.8 43.820 41.7 41.7 85.4
7 14.6 14.6 100.048 100.0 100.0
123Total
ValidFrequency Percent Valid Percent
CumulativePercent
Pernyataan Sikap 6
27 56.3 56.3 56.321 43.8 43.8 100.048 100.0 100.0
23Total
ValidFrequency Percent Valid Percent
CumulativePercent
Pernyataan Sikap 7
33 68.8 68.8 68.815 31.3 31.3 100.048 100.0 100.0
23Total
ValidFrequency Percent Valid Percent
CumulativePercent
Pernyataan Sikap 8
23 47.9 47.9 47.97 14.6 14.6 62.5
18 37.5 37.5 100.048 100.0 100.0
123Total
ValidFrequency Percent Valid Percent
CumulativePercent
Universitas Sumatera Utara
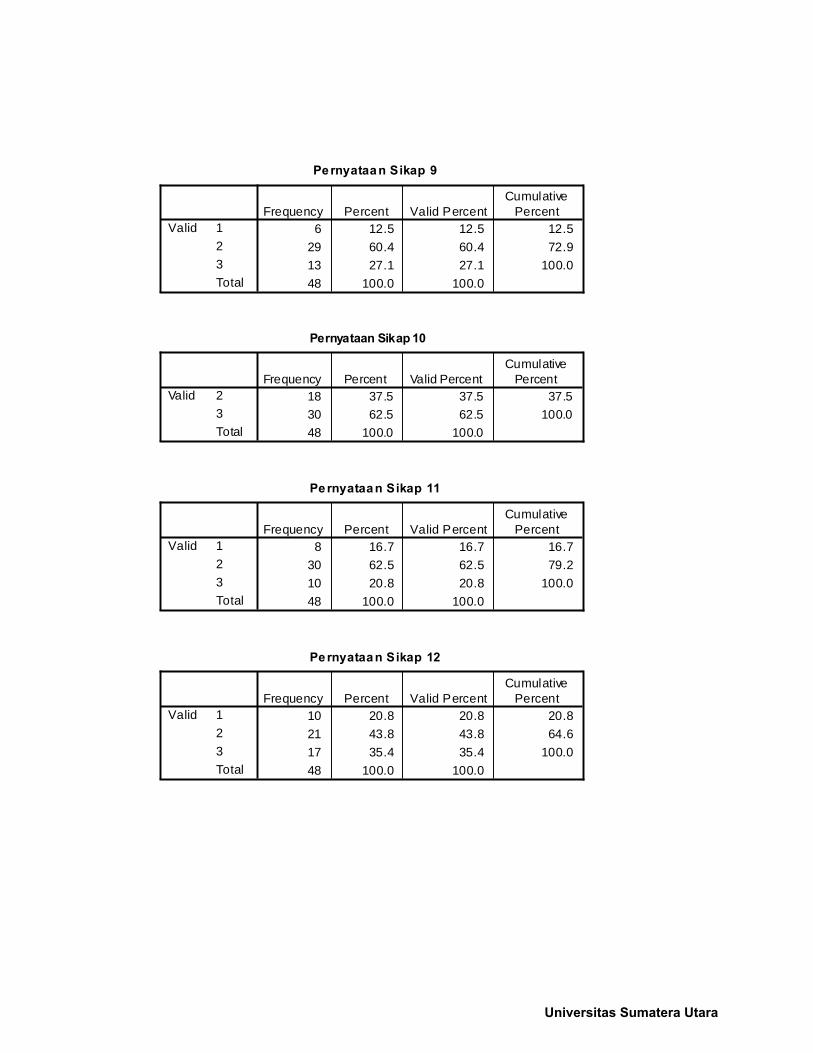
Pernyataan Sikap 9
6 12.5 12.5 12.529 60.4 60.4 72.913 27.1 27.1 100.048 100.0 100.0
123Total
ValidFrequency Percent Valid Percent
CumulativePercent
Pernyataan Sikap 10
18 37.5 37.5 37.530 62.5 62.5 100.048 100.0 100.0
23Total
ValidFrequency Percent Valid Percent
CumulativePercent
Pernyataan Sikap 11
8 16.7 16.7 16.730 62.5 62.5 79.210 20.8 20.8 100.048 100.0 100.0
123Total
ValidFrequency Percent Valid Percent
CumulativePercent
Pernyataan Sikap 12
10 20.8 20.8 20.821 43.8 43.8 64.617 35.4 35.4 100.048 100.0 100.0
123Total
ValidFrequency Percent Valid Percent
CumulativePercent
Universitas Sumatera Utara

Pernyataan Sikap 13
34 70.8 70.8 70.89 18.8 18.8 89.65 10.4 10.4 100.0
48 100.0 100.0
123Total
ValidFrequency Percent Valid Percent
CumulativePercent
Pernyataan Sikap 14
34 70.8 70.8 70.89 18.8 18.8 89.65 10.4 10.4 100.0
48 100.0 100.0
123Total
ValidFrequency Percent Valid Percent
CumulativePercent
Pernyataan Sikap 15
4 8.3 8.3 8.324 50.0 50.0 58.320 41.7 41.7 100.048 100.0 100.0
123Total
ValidFrequency Percent Valid Percent
CumulativePercent
Pernyataan Sikap 16
33 68.8 68.8 68.815 31.3 31.3 100.048 100.0 100.0
23Total
ValidFrequency Percent Valid Percent
CumulativePercent
Universitas Sumatera Utara

Pernyataan Sikap 17
8 16.7 16.7 16.727 56.3 56.3 72.913 27.1 27.1 100.048 100.0 100.0
123Total
ValidFrequency Percent Valid Percent
CumulativePercent
Pernyataan Sikap 18
3 6.3 6.3 6.328 58.3 58.3 64.617 35.4 35.4 100.048 100.0 100.0
123Total
ValidFrequency Percent Valid Percent
CumulativePercent
Pernyataan Sikap 19
23 47.9 47.9 47.925 52.1 52.1 100.048 100.0 100.0
23Total
ValidFrequency Percent Valid Percent
CumulativePercent
Pernyataan Sikap 20
13 27.1 27.1 27.123 47.9 47.9 75.012 25.0 25.0 100.048 100.0 100.0
123Total
ValidFrequency Percent Valid Percent
CumulativePercent
Universitas Sumatera Utara

Pernyataan Sikap 21
2 4.2 4.2 4.238 79.2 79.2 83.3
8 16.7 16.7 100.048 100.0 100.0
123Total
ValidFrequency Percent Valid Percent
CumulativePercent
Pernyataan Sikap 22
22 45.8 45.8 45.826 54.2 54.2 100.048 100.0 100.0
23Total
ValidFrequency Percent Valid Percent
CumulativePercent
Pernyataan Sikap 23
3 6.3 6.3 6.341 85.4 85.4 91.7
4 8.3 8.3 100.048 100.0 100.0
123Total
ValidFrequency Percent Valid Percent
CumulativePercent
Pernyataan Sikap 24
7 14.6 14.6 14.641 85.4 85.4 100.048 100.0 100.0
23Total
ValidFrequency Percent Valid Percent
CumulativePercent
Universitas Sumatera Utara

Pernyataan Sikap 25
16 33.3 33.3 33.326 54.2 54.2 87.5
6 12.5 12.5 100.048 100.0 100.0
123Total
ValidFrequency Percent Valid Percent
CumulativePercent
Frequency Table
Tindakan 1
26 54.2 54.2 54.222 45.8 45.8 100.048 100.0 100.0
12Total
ValidFrequency Percent Valid Percent
CumulativePercent
Tindakan 2
31 64.6 64.6 64.617 35.4 35.4 100.048 100.0 100.0
12Total
ValidFrequency Percent Valid Percent
CumulativePercent
Tindakan 3
10 20.8 20.8 20.838 79.2 79.2 100.048 100.0 100.0
12Total
ValidFrequency Percent Valid Percent
CumulativePercent
Universitas Sumatera Utara

Tindakan 4
26 54.2 54.2 54.222 45.8 45.8 100.048 100.0 100.0
12Total
ValidFrequency Percent Valid Percent
CumulativePercent
Tindakan 5
4 8.3 8.3 8.344 91.7 91.7 100.048 100.0 100.0
12Total
ValidFrequency Percent Valid Percent
CumulativePercent
Tindakan 6
25 52.1 52.1 52.123 47.9 47.9 100.048 100.0 100.0
12Total
ValidFrequency Percent Valid Percent
CumulativePercent
Tindakan 7
31 64.6 64.6 64.617 35.4 35.4 100.048 100.0 100.0
12Total
ValidFrequency Percent Valid Percent
CumulativePercent
Tindakan 8
19 39.6 39.6 39.629 60.4 60.4 100.048 100.0 100.0
12Total
ValidFrequency Percent Valid Percent
CumulativePercent
Universitas Sumatera Utara

Tindakan 9
21 43.8 43.8 43.827 56.3 56.3 100.048 100.0 100.0
12Total
ValidFrequency Percent Valid Percent
CumulativePercent
Tindakan 10
20 41.7 41.7 41.728 58.3 58.3 100.048 100.0 100.0
12Total
ValidFrequency Percent Valid Percent
CumulativePercent
Frequency Table
Penerapan SMK3 1
8 16.7 16.7 16.740 83.3 83.3 100.048 100.0 100.0
12Total
ValidFrequency Percent Valid Percent
CumulativePercent
Penerapan SMK3 2
17 35.4 35.4 35.431 64.6 64.6 100.048 100.0 100.0
12Total
ValidFrequency Percent Valid Percent
CumulativePercent
Universitas Sumatera Utara

Penerapan SMK3 3
17 35.4 35.4 35.431 64.6 64.6 100.048 100.0 100.0
12Total
ValidFrequency Percent Valid Percent
CumulativePercent
Penerapan SMK3 4
22 45.8 45.8 45.826 54.2 54.2 100.048 100.0 100.0
12Total
ValidFrequency Percent Valid Percent
CumulativePercent
Penerapan SMK3 5
20 41.7 41.7 41.728 58.3 58.3 100.048 100.0 100.0
12Total
ValidFrequency Percent Valid Percent
CumulativePercent
Penerapan SMK3 6
19 39.6 39.6 39.629 60.4 60.4 100.048 100.0 100.0
12Total
ValidFrequency Percent Valid Percent
CumulativePercent
Penerapan SMK3 7
24 50.0 50.0 50.024 50.0 50.0 100.048 100.0 100.0
12Total
ValidFrequency Percent Valid Percent
CumulativePercent
Universitas Sumatera Utara

Penerapan SMK3 8
11 22.9 22.9 22.937 77.1 77.1 100.048 100.0 100.0
12Total
ValidFrequency Percent Valid Percent
CumulativePercent
Penerapan SMK3 9
23 47.9 47.9 47.925 52.1 52.1 100.048 100.0 100.0
12Total
ValidFrequency Percent Valid Percent
CumulativePercent
Penerapan SMK3 10
18 37.5 37.5 37.530 62.5 62.5 100.048 100.0 100.0
12Total
ValidFrequency Percent Valid Percent
CumulativePercent
Penerapan SMK3 11
19 39.6 39.6 39.629 60.4 60.4 100.048 100.0 100.0
12Total
ValidFrequency Percent Valid Percent
CumulativePercent
Penerapan SMK3 12
6 12.5 12.5 12.542 87.5 87.5 100.048 100.0 100.0
12Total
ValidFrequency Percent Valid Percent
CumulativePercent
Universitas Sumatera Utara

Penerapan SMK3 13
16 33.3 33.3 33.332 66.7 66.7 100.048 100.0 100.0
12Total
ValidFrequency Percent Valid Percent
CumulativePercent
Penerapan SMK3 14
48 100.0 100.0 100.02ValidFrequency Percent Valid Percent
CumulativePercent
Penerapan SMK3 15
8 16.7 16.7 16.740 83.3 83.3 100.048 100.0 100.0
12Total
ValidFrequency Percent Valid Percent
CumulativePercent
Penerapan SMK3 16
48 100.0 100.0 100.02ValidFrequency Percent Valid Percent
CumulativePercent
Penerapan SMK3 17
20 41.7 41.7 41.728 58.3 58.3 100.048 100.0 100.0
12Total
ValidFrequency Percent Valid Percent
CumulativePercent
Universitas Sumatera Utara

Penerapan SMK3 18
9 18.8 18.8 18.839 81.3 81.3 100.048 100.0 100.0
12Total
ValidFrequency Percent Valid Percent
CumulativePercent
Penerapan SMK3 19
16 33.3 33.3 33.332 66.7 66.7 100.048 100.0 100.0
12Total
ValidFrequency Percent Valid Percent
CumulativePercent
Penerapan SMK3 20
21 43.8 43.8 43.827 56.3 56.3 100.048 100.0 100.0
12Total
ValidFrequency Percent Valid Percent
CumulativePercent
Penerapan SMK3 21
2 4.2 4.2 4.246 95.8 95.8 100.048 100.0 100.0
12Total
ValidFrequency Percent Valid Percent
CumulativePercent
Penerapan SMK3 22
26 54.2 54.2 54.222 45.8 45.8 100.048 100.0 100.0
12Total
ValidFrequency Percent Valid Percent
CumulativePercent
Universitas Sumatera Utara

Penerapan SMK3 23
14 29.2 29.2 29.234 70.8 70.8 100.048 100.0 100.0
12Total
ValidFrequency Percent Valid Percent
CumulativePercent
Penerapan SMK3 24
5 10.4 10.4 10.443 89.6 89.6 100.048 100.0 100.0
12Total
ValidFrequency Percent Valid Percent
CumulativePercent
Penerapan SMK3 25
48 100.0 100.0 100.02ValidFrequency Percent Valid Percent
CumulativePercent
Frequency Table
Pengetahuan Pekerja
24 50.0 50.0 50.024 50.0 50.0 100.048 100.0 100.0
23Total
ValidFrequency Percent Valid Percent
CumulativePercent
Sikap Pekerja
38 79.2 79.2 79.210 20.8 20.8 100.048 100.0 100.0
23Total
ValidFrequency Percent Valid Percent
CumulativePercent
Universitas Sumatera Utara

Tindakan Pekerja
23 47.9 47.9 47.925 52.1 52.1 100.048 100.0 100.0
12Total
ValidFrequency Percent Valid Percent
CumulativePercent
Penerapan SMK3
21 43.8 43.8 43.827 56.3 56.3 100.048 100.0 100.0
12Total
ValidFrequency Percent Valid Percent
CumulativePercent
III. Hasil Bivariat
Crosstabs
Case Processing Summary
48 100.0% 0 .0% 48 100.0%
48 100.0% 0 .0% 48 100.0%
48 100.0% 0 .0% 48 100.0%
Pengetahuan Pekerja *Penerapan SMK3Sikap Pekerja *Penerapan SMK3Tindakan Pekerja *Penerapan SMK3
N Percent N Percent N PercentValid Missing Total
Cases
Pengetahuan Pekerja * Penerapan SMK3
Universitas Sumatera Utara
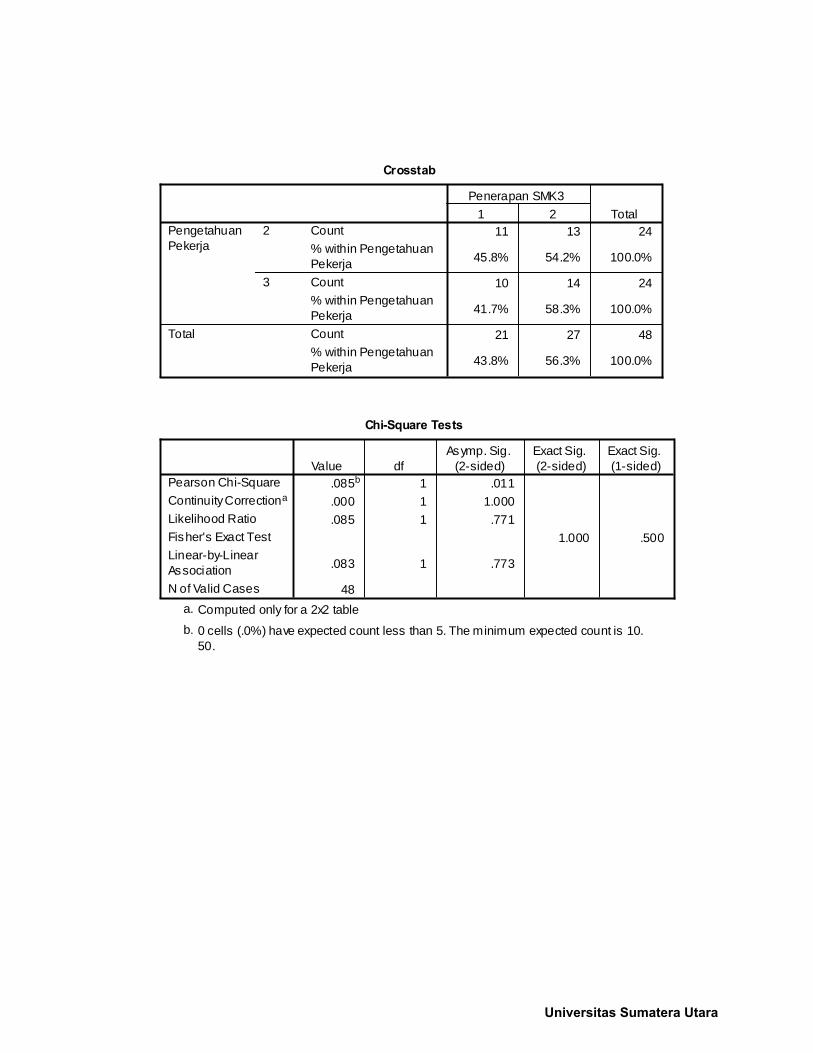
Crosstab
11 13 24
45.8% 54.2% 100.0%
10 14 24
41.7% 58.3% 100.0%
21 27 48
43.8% 56.3% 100.0%
Count% within PengetahuanPekerjaCount% within PengetahuanPekerjaCount% within PengetahuanPekerja
2
3
PengetahuanPekerja
Total
1 2Penerapan SMK3
Total
Chi-Square Tests
.085b 1 .011
.000 1 1.000
.085 1 .7711.000 .500
.083 1 .773
48
Pearson Chi-SquareContinuity Correctiona
Likelihood RatioFisher's Exact TestLinear-by-LinearAssociationN of Valid Cases
Value dfAsymp. Sig.
(2-sided)Exact Sig.(2-sided)
Exact Sig.(1-sided)
Computed only for a 2x2 tablea.
0 cells (.0%) have expected count less than 5. The minimum expected count is 10.50.
b.
Universitas Sumatera Utara

Risk Estimate
1.185 .378 3.710
1.100 .578 2.092
.929 .563 1.531
48
Odds Ratio forPengetahuanPekerja (2 / 3)For cohortPenerapan SMK3 = 1For cohortPenerapan SMK3 = 2N of Valid Cases
Value Lower Upper
95% ConfidenceInterval
Sikap Pekerja * Penerapan SMK3
Crosstab
17 21 3844.7% 55.3% 100.0%
4 6 1040.0% 60.0% 100.0%
21 27 4843.8% 56.3% 100.0%
Count% within Sikap PekerjaCount% within Sikap PekerjaCount% within Sikap Pekerja
2
3
Sikap Pekerja
Total
1 2Penerapan SMK3
Total
Chi-Square Tests
.072b 1 .009
.000 1 1.000
.073 1 .7881.000 .539
.071 1 .790
48
Pearson Chi-SquareContinuity Correctiona
Likelihood RatioFisher's Exact TestLinear-by-LinearAssociationN of Valid Cases
Value dfAsymp. Sig.
(2-sided)Exact Sig.(2-sided)
Exact Sig.(1-sided)
Computed only for a 2x2 tablea.
1 cells (25.0%) have expected count less than 5. The minimum expected count is 4.38.
b.
Universitas Sumatera Utara

Risk Estimate
1.214 .294 5.011
1.118 .484 2.584
.921 .515 1.647
48
Odds Ratio for SikapPekerja (2 / 3)For cohortPenerapan SMK3 = 1For cohortPenerapan SMK3 = 2N of Valid Cases
Value Lower Upper
95% ConfidenceInterval
Tindakan Pekerja * Penerapan SMK3
Crosstab
10 13 23
43.5% 56.5% 100.0%
11 14 25
44.0% 56.0% 100.0%
21 27 48
43.8% 56.3% 100.0%
Count% withinTindakan PekerjaCount% withinTindakan PekerjaCount% withinTindakan Pekerja
1
2
TindakanPekerja
Total
1 2Penerapan SMK3
Total
Universitas Sumatera Utara

Chi-Square Tests
.001b 1 .041
.000 1 1.000
.001 1 .9711.000 .601
.001 1 .971
48
Pearson Chi-SquareContinuity Correctiona
Likelihood RatioFisher's Exact TestLinear-by-LinearAssociationN of Valid Cases
Value dfAsymp. Sig.
(2-sided)Exact Sig.(2-sided)
Exact Sig.(1-sided)
Computed only for a 2x2 tablea.
0 cells (.0%) have expected count less than 5. The minimum expected count is 10.06.
b.
Risk Estimate
.979 .313 3.066
.988 .520 1.879
1.009 .613 1.663
48
Odds Ratio forTindakan Pekerja (1 / 2)For cohort PenerapanSMK3 = 1For cohort PenerapanSMK3 = 2N of Valid Cases
Value Lower Upper
95% ConfidenceInterval
IV. Hasil Multivariat
Universitas Sumatera Utara

a. Pengetahuan
Logistic Regression
Case Processing Summary
48 100.00 .0
48 100.00 .0
48 100.0
Unweighted Casesa
Included in AnalysisMissing CasesTotal
Selected Cases
Unselected CasesTotal
N Percent
If weight is in effect, see class ification table for the totalnumber of cases.
a.
Dependent Variable Encoding
01
Original Value12
Internal Value
Block 0: Beginning Block
Classification Table a,b
0 21 .00 27 100.0
66.3
Observed12
Penerapan SMK3
Overall Percentage
Step 01 2
Penerapan SMK3 PercentageCorrect
Predicted
Constant is included in the model.a.
The cut value is .500b.
Universitas Sumatera Utara

Variables in the Equation
.251 .291 .746 1 .388 1.286ConstantStep 0B S.E. Wald df Sig. Exp(B)
Variables not in the Equation
.085 1 .001
.085 1 .001PENGETAHUANVariables
Overall StatisticsStep 0
Score df Sig.
Block 1: Method = Enter
Omnibus Tests of Model Coefficients
.085 1 .001
.085 1 .001
.085 1 .001
StepBlockModel
Step 1Chi-square df Sig.
Model Summary
65.705a .002 .002Step1
-2 Loglikelihood
Cox & SnellR Square
NagelkerkeR Square
Estimation terminated at iteration number 3 becauseparameter estimates changed by less than .001.
a.
Universitas Sumatera Utara

Classification Table a
0 21 .00 27 100.0
66.3
Observed12
Penerapan SMK3
Overall Percentage
Step 11 2
Penerapan SMK3 PercentageCorrect
Predicted
The cut value is .500a.
Variables in the Equation
3.483 .582 .085 1 .771 32.568-.172 1.482 .013 1 .908 .000
PENGETAHUANConstant
Step1
a
B S.E. Wald df Sig. Exp(B)
Variable(s) entered on step 1: PENGETAHUAN.a.
b. Sikap
Logistic Regression [DataSet1] D:\TESIS IKA\NEW SMK3\SMK3 SPSS\master SMK3.sav
Case Processing Summary
48 100.00 .0
48 100.00 .0
48 100.0
Unweighted Casesa
Included in AnalysisMissing CasesTotal
Selected Cases
Unselected CasesTotal
N Percent
If weight is in effect, see class ification table for the totalnumber of cases.
a.
Universitas Sumatera Utara

Dependent Variable Encoding
01
Original Value12
Internal Value
Block 0: Beginning Block
Classification Table a,b
0 21 .00 27 100.0
56.3
Observed12
Penerapan SMK3
Overall Percentage
Step 01 2
Penerapan SMK3 PercentageCorrect
Predicted
Constant is included in the model.a.
The cut value is .500b.
Variables in the Equation
.251 .291 .746 1 .388 1.286ConstantStep 0B S.E. Wald df Sig. Exp(B)
Universitas Sumatera Utara

Variables not in the Equation
.072 1 .295
.072 1 .295SIKAPPVariables
Overall StatisticsStep 0
Score df Sig.
Block 1: Method = Enter
Omnibus Tests of Model Coefficients
.073 1 .295
.073 1 .295
.073 1 .295
StepBlockModel
Step 1Chi-square df Sig.
Model Summary
65.718a .002 .002Step1
-2 Loglikelihood
Cox & SnellR Square
NagelkerkeR Square
Estimation terminated at iteration number 3 becauseparameter estimates changed by less than .001.
a.
Classification Table a
0 21 .00 27 100.0
56.3
Observed12
Penerapan SMK3
Overall Percentage
Step 11 2
Penerapan SMK3 PercentageCorrect
Predicted
The cut value is .500a.
Universitas Sumatera Utara

Variables in the Equation
-1.194 .723 .072 1 .788 1.214-1.220 1.620 .012 1 .913 .838
SIKAPPConstant
Step1
a
B S.E. Wald df Sig. Exp(B)
Variable(s) entered on s tep 1: SIKAPP.a.
c. Tindakan
Logistic Regression
Case Processing Summary
48 100.00 .0
48 100.00 .0
48 100.0
Unweighted Casesa
Included in AnalysisMissing CasesTotal
Selected Cases
Unselected CasesTotal
N Percent
If weight is in effect, see class ification table for the totalnumber of cases.
a.
Universitas Sumatera Utara

Dependent Variable Encoding
01
Original Value12
Internal Value
Block 0: Beginning Block
Classification Table a,b
0 21 .00 27 100.0
76.2
Observed12
Penerapan SMK3
Overall Percentage
Step 01 2
Penerapan SMK3 PercentageCorrect
Predicted
Constant is included in the model.a.
The cut value is .500b.
Variables in the Equation
.251 .291 .746 1 .388 1.286ConstantStep 0B S.E. Wald df Sig. Exp(B)
Variables not in the Equation
.001 1 .041
.001 1 .041TINDAKANVariables
Overall StatisticsStep 0
Score df Sig.
Block 1: Method = Enter
Universitas Sumatera Utara

Omnibus Tests of Model Coefficients
.001 1 .041
.001 1 .041
.001 1 .041
StepBlockModel
Step 1Chi-square df Sig.
Model Summary
65.789a .000 .000Step1
-2 Loglikelihood
Cox & SnellR Square
NagelkerkeR Square
Estimation terminated at iteration number 3 becauseparameter estimates changed by less than .001.
a.
Classification Table a
0 21 .00 27 100.0
56.3
Observed12
Penerapan SMK3
Overall Percentage
Step 11 2
Penerapan SMK3 PercentageCorrect
Predicted
The cut value is .500a.
Variables in the Equation
1.155 .582 .001 1 .971 3.175.284 .933 .092 1 .761 .001
TINDAKANConstant
Step1
a
B S.E. Wald df Sig. Exp(B)
Variable(s) entered on s tep 1: TINDAKAN.a.
d. Pengetahuan dan Tindakan
Logistic Regression
Universitas Sumatera Utara

Case Processing Summary
48 100.00 .0
48 100.00 .0
48 100.0
Unweighted Casesa
Included in AnalysisMissing CasesTotal
Selected Cases
Unselected CasesTotal
N Percent
If weight is in effect, see class ification table for the totalnumber of cases.
a.
Dependent Variable Encoding
01
Original Value12
Internal Value
Block 0: Beginning Block
Classification Table a,b
0 21 .00 27 100.0
56.3
Observed12
Penerapan SMK3
Overall Percentage
Step 01 2
Penerapan SMK3 PercentageCorrect
Predicted
Constant is included in the model.a.
The cut value is .500b.
Variables in the Equation
.251 .291 .746 1 .388 1.286ConstantStep 0B S.E. Wald df Sig. Exp(B)
Universitas Sumatera Utara

Variables not in the Equation
.085 1 .771
.001 1 .971
.138 2 .933
PENGETAHUANTINDAKAN
Variables
Overall Statistics
Step0
Score df Sig.
Block 1: Method = Enter
Omnibus Tests of Model Coefficients
.138 2 .023
.138 2 .023
.138 2 .023
StepBlockModel
Step 1Chi-square df Sig.
Model Summary
65.652a .003 .004Step1
-2 Loglikelihood
Cox & SnellR Square
NagelkerkeR Square
Estimation terminated at iteration number 3 becauseparameter estimates changed by less than .001.
a.
Classification Table a
0 21 .00 27 100.0
85.7
Observed12
Penerapan SMK3
Overall Percentage
Step 11 2
Penerapan SMK3 PercentageCorrect
Predicted
The cut value is .500a.
Universitas Sumatera Utara
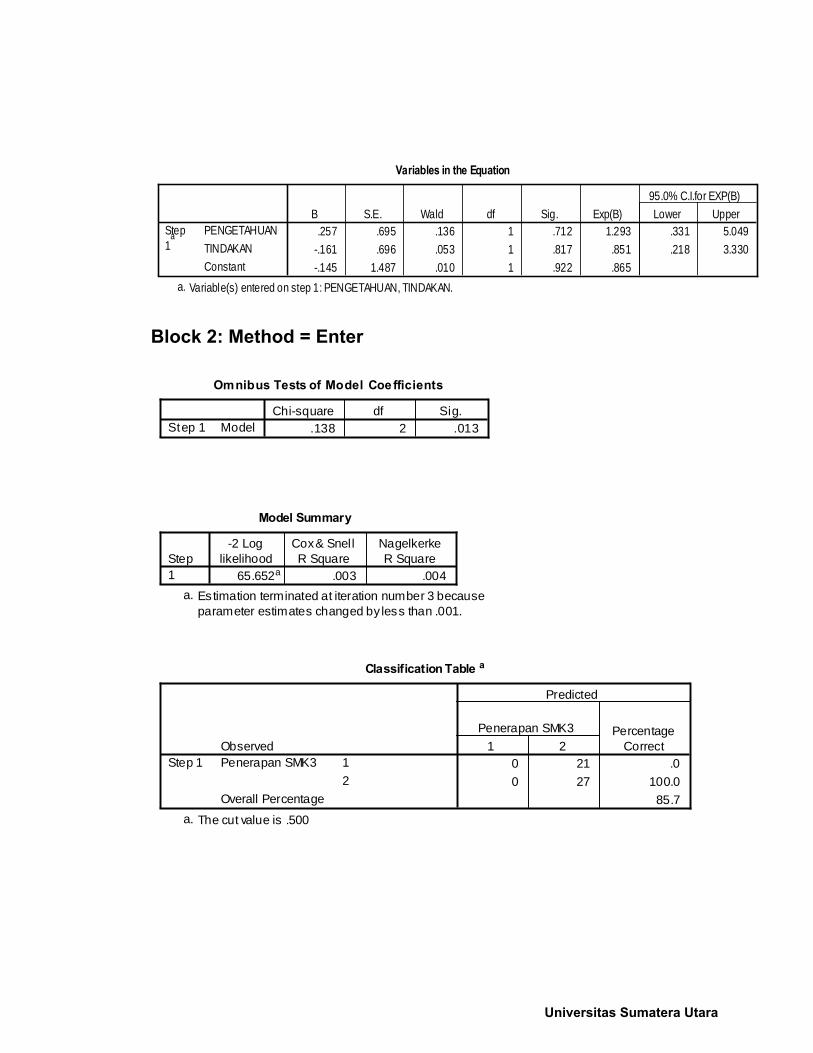
Variables in the Equation
.257 .695 .136 1 .712 1.293 .331 5.049-.161 .696 .053 1 .817 .851 .218 3.330-.145 1.487 .010 1 .922 .865
PENGETAHUANTINDAKANConstant
Step1
a
B S.E. Wald df Sig. Exp(B) Lower Upper95.0% C.I.for EXP(B)
Variable(s) entered on step 1: PENGETAHUAN, TINDAKAN.a.
Block 2: Method = Enter
Omnibus Tests of Model Coe fficients
.138 2 .013ModelStep 1Chi-square df Sig.
Model Summary
65.652a .003 .004Step1
-2 Loglikelihood
Cox & SnellR Square
NagelkerkeR Square
Estimation terminated at iteration number 3 becauseparameter estimates changed by less than .001.
a.
Classification Table a
0 21 .00 27 100.0
85.7
Observed12
Penerapan SMK3
Overall Percentage
Step 11 2
Penerapan SMK3 PercentageCorrect
Predicted
The cut value is .500a.
Universitas Sumatera Utara

Variables in the Equation
2.649 .695 .136 1 .022 8.293 .331 5.0493.448 .696 .053 1 .000 31.451 .218 3.330
-9.948 1.487 .010 1 .000 .001
PENGETAHUANTINDAKANConstant
Step1
a
B S.E. Wald df Sig. Exp(B) Lower Upper95.0% C.I.for EXP(B)
Variable(s) entered on step 1: PENGETAHUAN, TINDAKAN.a.
e. Perilaku (pengetahuan, sikap, dan tindakan)
Logistic Regression [DataSet1] D:\TESIS IKA\NEW SMK3\SMK3 SPSS\master SMK3.sav
Case Processing Summary
48 100.00 .0
48 100.00 .0
48 100.0
Unweighted Casesa
Included in AnalysisMissing CasesTotal
Selected Cases
Unselected CasesTotal
N Percent
If weight is in effect, see class ification table for the totalnumber of cases.
a.
Dependent Variable Encoding
01
Original Value12
Internal Value
Block 0: Beginning Block
Universitas Sumatera Utara

Classification Table a,b
0 21 .00 27 100.0
89.7
Observed12
Penerapan SMK3
Overall Percentage
Step 01 2
Penerapan SMK3 PercentageCorrect
Predicted
Constant is included in the model.a.
The cut value is .500b.
Variables in the Equation
.251 .291 .746 1 .388 1.286ConstantStep 0B S.E. Wald df Sig. Exp(B)
Variables not in the Equation
.085 1 .771
.072 1 .788
.001 1 .971
.169 3 .982
PENGETAHUANSIKAPPTINDAKAN
Variables
Overall Statistics
Step0
Score df Sig.
Block 1: Method = Enter
Omnibus Tests of Model Coefficients
.170 3 .013
.170 3 .013
.170 3 .013
StepBlockModel
Step 1Chi-square df Sig.
Universitas Sumatera Utara

Model Summary
65.620a .004 .005Step1
-2 Loglikelihood
Cox & SnellR Square
NagelkerkeR Square
Estimation terminated at iteration number 3 becauseparameter estimates changed by less than .001.
a.
Classification Table a
0 21 .00 27 100.0
89.7
Observed12
Penerapan SMK3
Overall Percentage
Step 11 2
Penerapan SMK3 PercentageCorrect
Predicted
The cut value is .500a.
Variables in the Equation
1.240 .754 .073 1 .026 25.227.150 .852 .031 1 .024 2.163
3.210 .704 .065 1 .000 31.451-8.590 1.784 .032 1 .000 .727
PENGETAHUANSIKAPPTINDAKANConstant
Step1
a
B S.E. Wald df Sig. Exp(B)
Variable(s) entered on step 1: PENGETAHUAN, SIKAPP, TINDAKAN.a.
Universitas Sumatera Utara
Top Related