


Languages
Pages
Legal


Your career. Your future.Discover and apply your passion
Monday, October 21, 13
“ I have no special talents. I am passionately curious.”
~ Albert Einstein
Monday, October 21, 13

NEW REALITY
Monday, October 21, 13
State of ConstructionYo
ur c
aree
r�
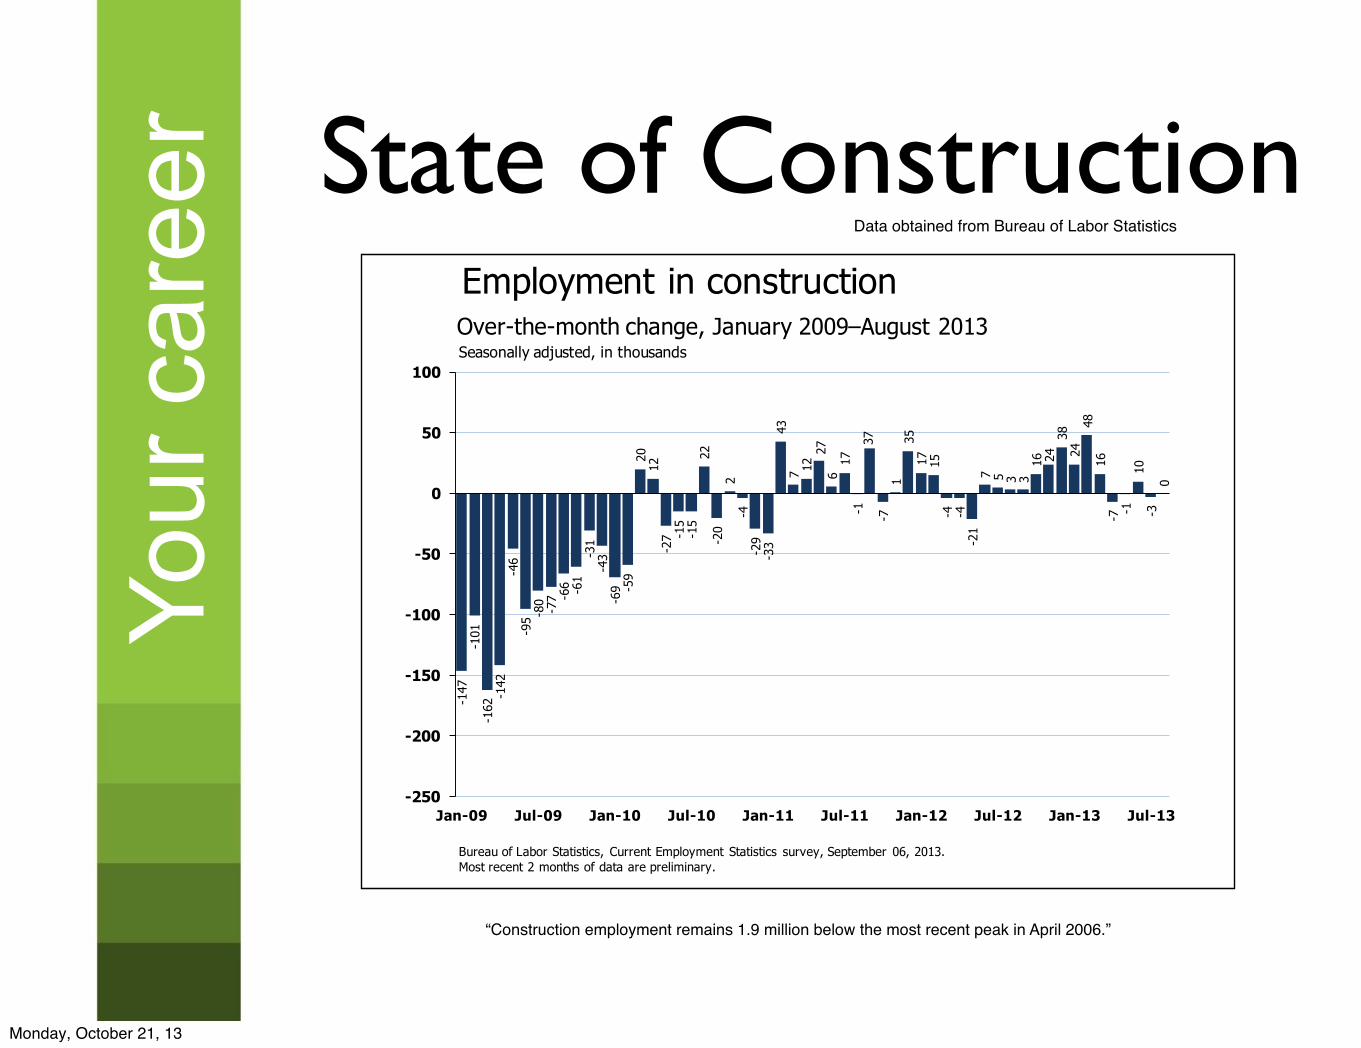
�����(PSOR\PHQW�LQ�FRQVWUXFWLRQ�ZDV�XQFKDQJHG�LQ�$XJXVW��$IWHU�DGGLQJ���������MREV�EHWZHHQ�6HSWHPEHU������DQG�0DUFK�������FRQVWUXFWLRQ�HPSOR\PHQW�KDV�VKRZQ�QR�QHW�FKDQJH���
����&RQVWUXFWLRQ�HPSOR\PHQW�UHPDLQV�����PLOOLRQ�EHORZ�WKH�PRVW�UHFHQW�SHDN�LQ�$SULO������
-147
-101
-162
-142
-46
-95 -8
0-7
7 -66 -61
-31
-43
-69 -5
920
12-2
7 -15
-15
22-2
02
-4-2
9-3
343
7 1227
617
-137
-71
3517 15
-4 -4-2
17 5 3 3
16 2438
2448
16-7 -1
10-3
0
-250
-200
-150
-100
-50
0
50
100
Jan-09 Jul-09 Jan-10 Jul-10 Jan-11 Jul-11 Jan-12 Jul-12 Jan-13 Jul-13
Employment in constructionOver-the-month change, January 2009–August 2013
Bureau of Labor Statistics, Current Employment Statistics survey, September 06, 2013.Most recent 2 months of data are preliminary.
Seasonally adjusted, in thousands
&RQVWUXFWLRQ�
6XPPDU\� 0LQLQJ��/RJJLQJ� &RQVWUXFWLRQ� 0DQXIDFWXULQJ�
7UDGH��:KROHVDOH�5HWDLO�
7UDQVS���:DUHKRXVLQJ��8WLOLWLHV�
,QIRUPDWLRQ� )LQDQFLDO�$FWLYLWLHV�
3URIHVVLRQDO��%XVLQHVV�6HUYLFHV�
3ULYDWH�(GXFDWLRQ��+HDOWK�6HUYLFHV�
/HLVXUH��+RVSLWDOLW\�
2WKHU�6HUYLFHV� *RYHUQPHQW�
&(6�+LJKOLJKWV��
5HOHDVH�'DWH��6HSWHPEHU���������
“Construction employment remains 1.9 million below the most recent peak in April 2006.”
Data obtained from Bureau of Labor Statistics
Monday, October 21, 13

State of ConstructionYo
ur c
aree
r
�
�����(PSOR\PHQW�LQ�SURIHVVLRQDO�DQG�EXVLQHVV�VHUYLFHV�FRQWLQXHG�WR�WUHQG�XS�LQ�$XJXVW�������������6LQFH�WKH�PRVW�UHFHQW�HPSOR\PHQW�WURXJK�LQ�$XJXVW�������HPSOR\PHQW�LQ�WKH�LQGXVWU\�KDV�H[SDQGHG�E\�����PLOOLRQ���1$,&6����±�3URIHVVLRQDO�DQG�WHFKQLFDO�VHUYLFHV������3URIHVVLRQDO�DQG�WHFKQLFDO�VHUYLFHV�HPSOR\PHQW�FRQWLQXHG�WR�WUHQG�XS�LQ�$XJXVW������������7KHVH�LQGXVWULHV�DFFRXQW�IRU���������RI�WKH�MREV�JDLQHG�LQ�SURIHVVLRQDO�DQG�EXVLQHVV�VHUYLFHV�VLQFH�$XJXVW��������1$,&6����±�$GPLQLVWUDWLYH�DQG�ZDVWH�VHUYLFHV�������7HPSRUDU\�KHOS�VHUYLFHV�HPSOR\PHQW�DOVR�FRQWLQXHG�WR�HGJH�XS�LQ�$XJXVW�����������DQG�KDV�DGGHG���������MREV�VLQFH�$XJXVW�������
-143
-177
-137
-152
-64
-105
-23
-28
16 1050
1044
28-4
7233
6312
4724
4999
7030
5889
4859
-930
65 6734
4360
8976
43 45 37 3552
2915
53 5535
4693
5969 70 64
3223
-250
-200
-150
-100
-50
0
50
100
150
200
Jan-09 Jul-09 Jan-10 Jul-10 Jan-11 Jul-11 Jan-12 Jul-12 Jan-13 Jul-13
Employment in professional and business services
Over-the-month change, January 2009–August 2013
Bureau of Labor Statistics, Current Employment Statistics survey, September 06, 2013.Most recent 2 months of data are preliminary.
Seasonally adjusted, in thousands
4.2
9.1
13.4
-1.5
1.7
2.4
-0.4
2.4
10.9
-6 -4 -2 0 2 4 6 8 10 12 14 16 18
- Services to buildings
- Employment services
Administrative and waste services°
Management of companies
- Management and technical consulting
- Computer systems design
- Architectural and engineering
- Accounting and bookkeeping
Professional and technical°
Employment in selected professional and business services
Bureau of Labor Statistics, Current Employment Statistics survey, September 06, 2013.Data are preliminary.˚Includes additional component industries not shown separately.* denotes significance.
Over-the-month change, August 2013Seasonally adjusted, in thousands
Professional and business services:
23
3URIHVVLRQDO�DQG�%XVLQHVV�6HUYLFHV�
&(6�+LJKOLJKWV��
5HOHDVH�'DWH��6HSWHPEHU���������
6XPPDU\� 0LQLQJ��/RJJLQJ� &RQVWUXFWLRQ� 0DQXIDFWXULQJ�
7UDGH��:KROHVDOH�5HWDLO�
7UDQVS���:DUHKRXVLQJ��8WLOLWLHV�
,QIRUPDWLRQ� )LQDQFLDO�$FWLYLWLHV�
3URIHVVLRQDO��%XVLQHVV�6HUYLFHV�
3ULYDWH�(GXFDWLRQ��+HDOWK�6HUYLFHV�
/HLVXUH��+RVSLWDOLW\�
2WKHU�6HUYLFHV� *RYHUQPHQW�
Data obtained from Bureau of Labor Statistics
Monday, October 21, 13

EMPLOYMENT& WAGES
Monday, October 21, 13

Job OutlookYo
ur c
aree
rData obtained from Bureau of Labor Statistics
“Employment of interior designers is expected to grow by 19 percent from 2010 to 2020, about as fast as the average for all occupations. Designers will be needed to respond to consumer expectations that the interiors of homes and offices meet certain conditions, such as being environmentally friendly or more easily accessible.”
Monday, October 21, 13

Average PayYo
ur c
aree
rData obtained from Bureau of Labor Statistics
Median annual wage for interior designers in architectural, engineering, and related services was $46,280 in May 2010,
• Architectural, engineering, and related services $51,990• Specialized design services $45,280• Construction $44,350• Furniture and home furnishings stores $40,320• Building material and supplies dealers $38,720
Monday, October 21, 13

What are you good at?
Monday, October 21, 13
Your
car
eer
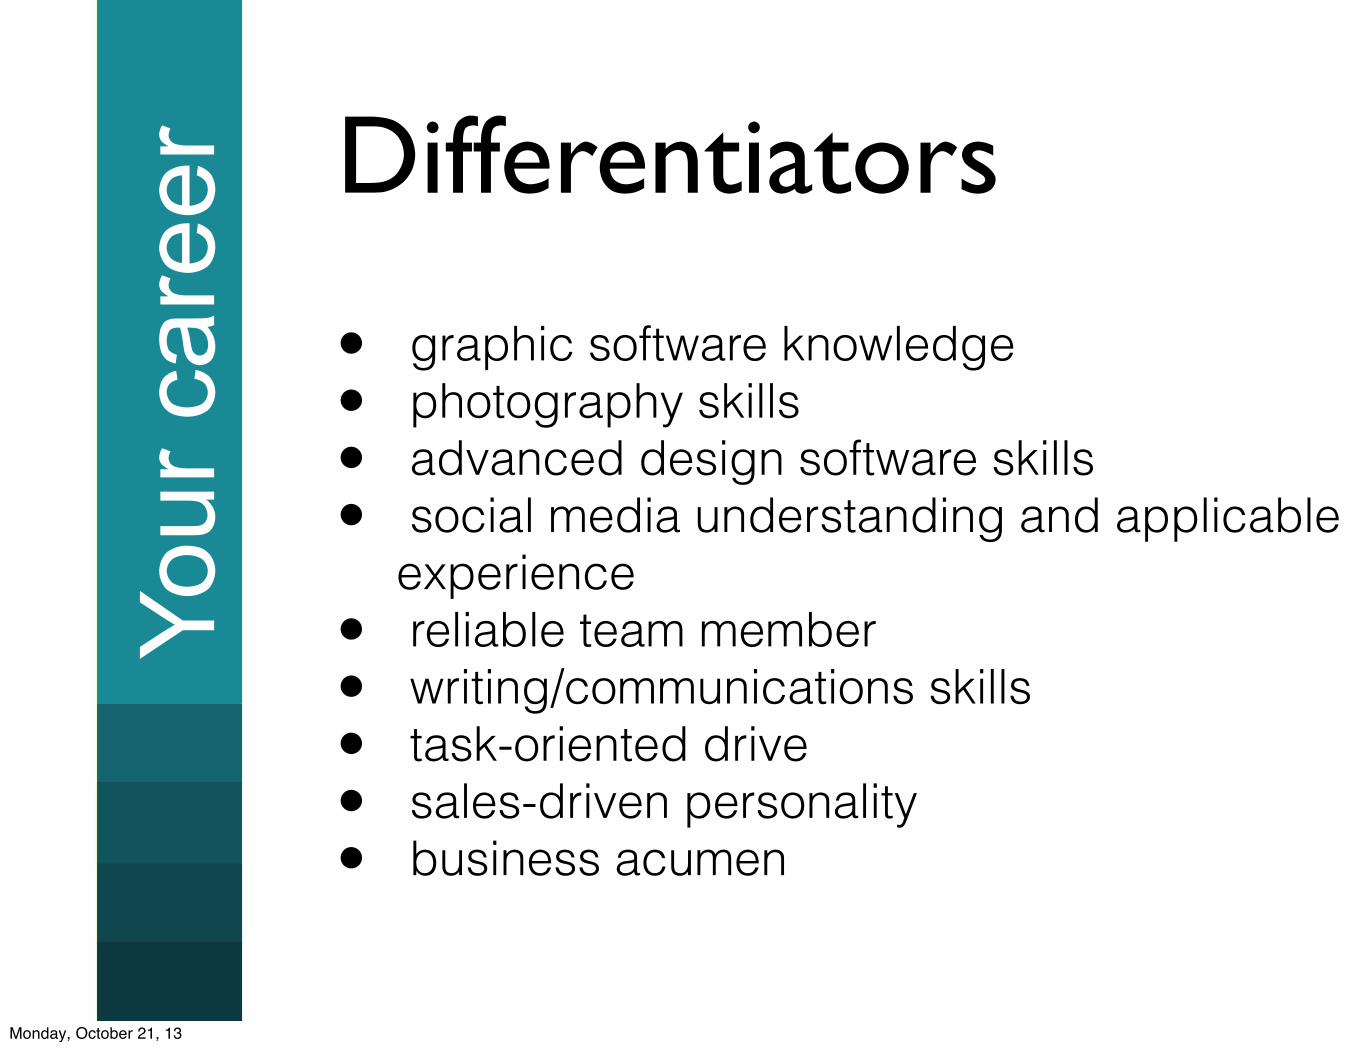
• graphic software knowledge• photography skills• advanced design software skills• social media understanding and applicable
experience• reliable team member• writing/communications skills• task-oriented drive• sales-driven personality• business acumen
Differentiators
Monday, October 21, 13

Your
car
eer
• Competition• Achiever• Ideation
STRENGTH FINDER
Monday, October 21, 13

What are you not so good at?
Monday, October 21, 13

Your
car
eer
• Know your brand (Passion, values, strengths, story)
• Share your story (Tell everyone you know)
• Don’t sit at your desk all day (Interact, build a brand)
• Invest time and money in your brand (“I see you everywhere” effect)
• Leverage social media and networking (We all have the same amount of time – time is no excuse! )
The Brand of You
Monday, October 21, 13

MOVING YOUR BRAND
ONLINEMonday, October 21, 13

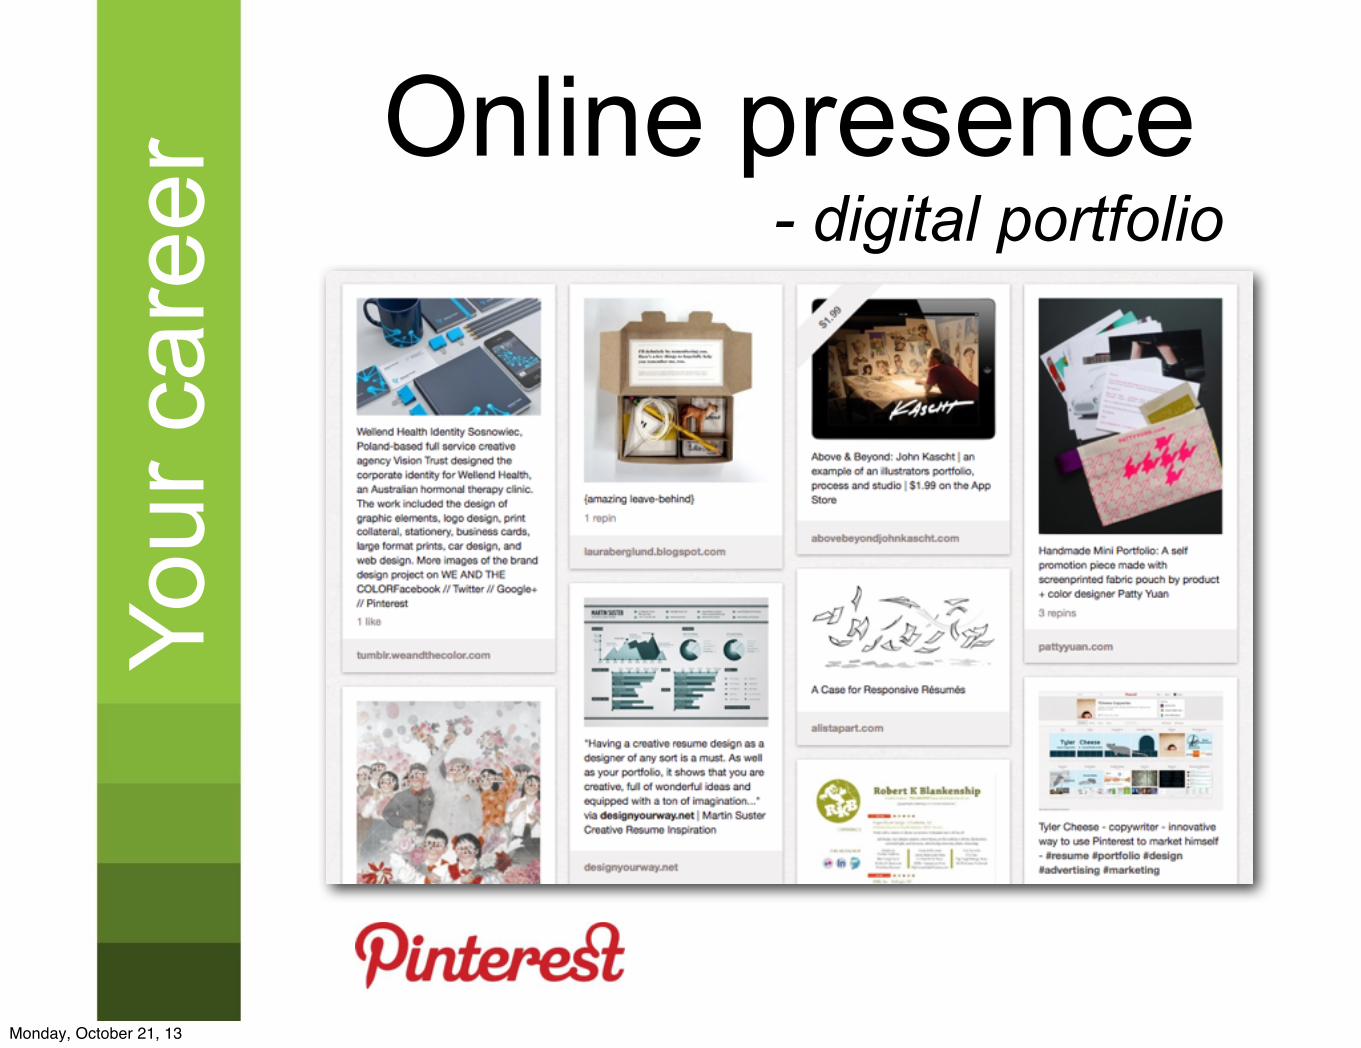
Online presence- digital portfolio
~ Folio Link
Your
car
eer
Monday, October 21, 13
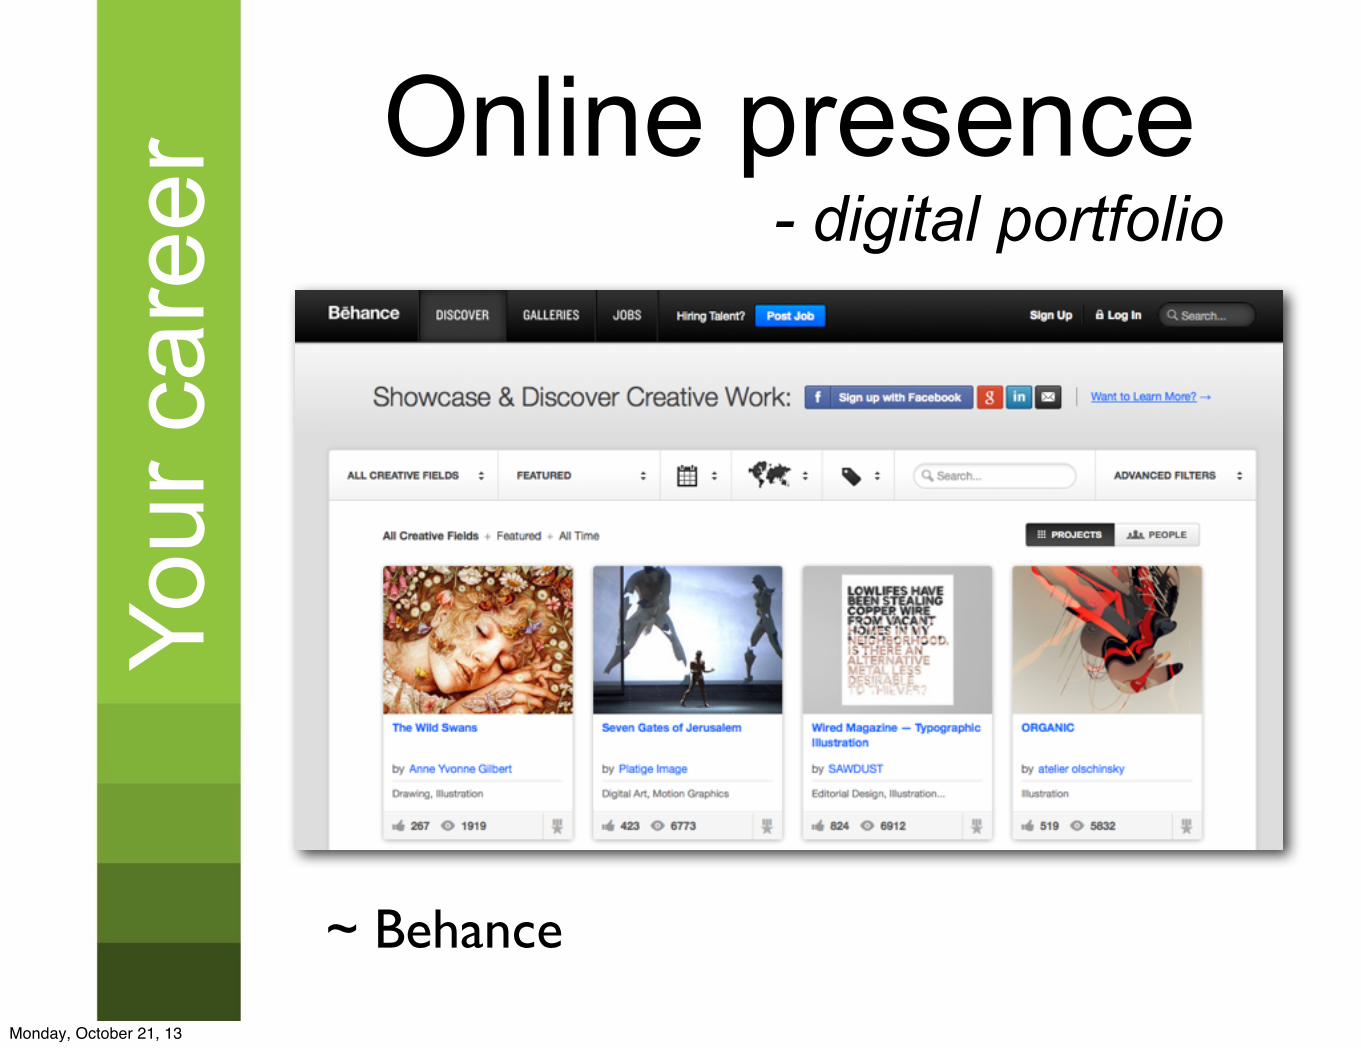
Online presence- digital portfolio
Your
car
eer
~ Behance
Monday, October 21, 13
Online presence- digital portfolio
Your
car
eer
Monday, October 21, 13
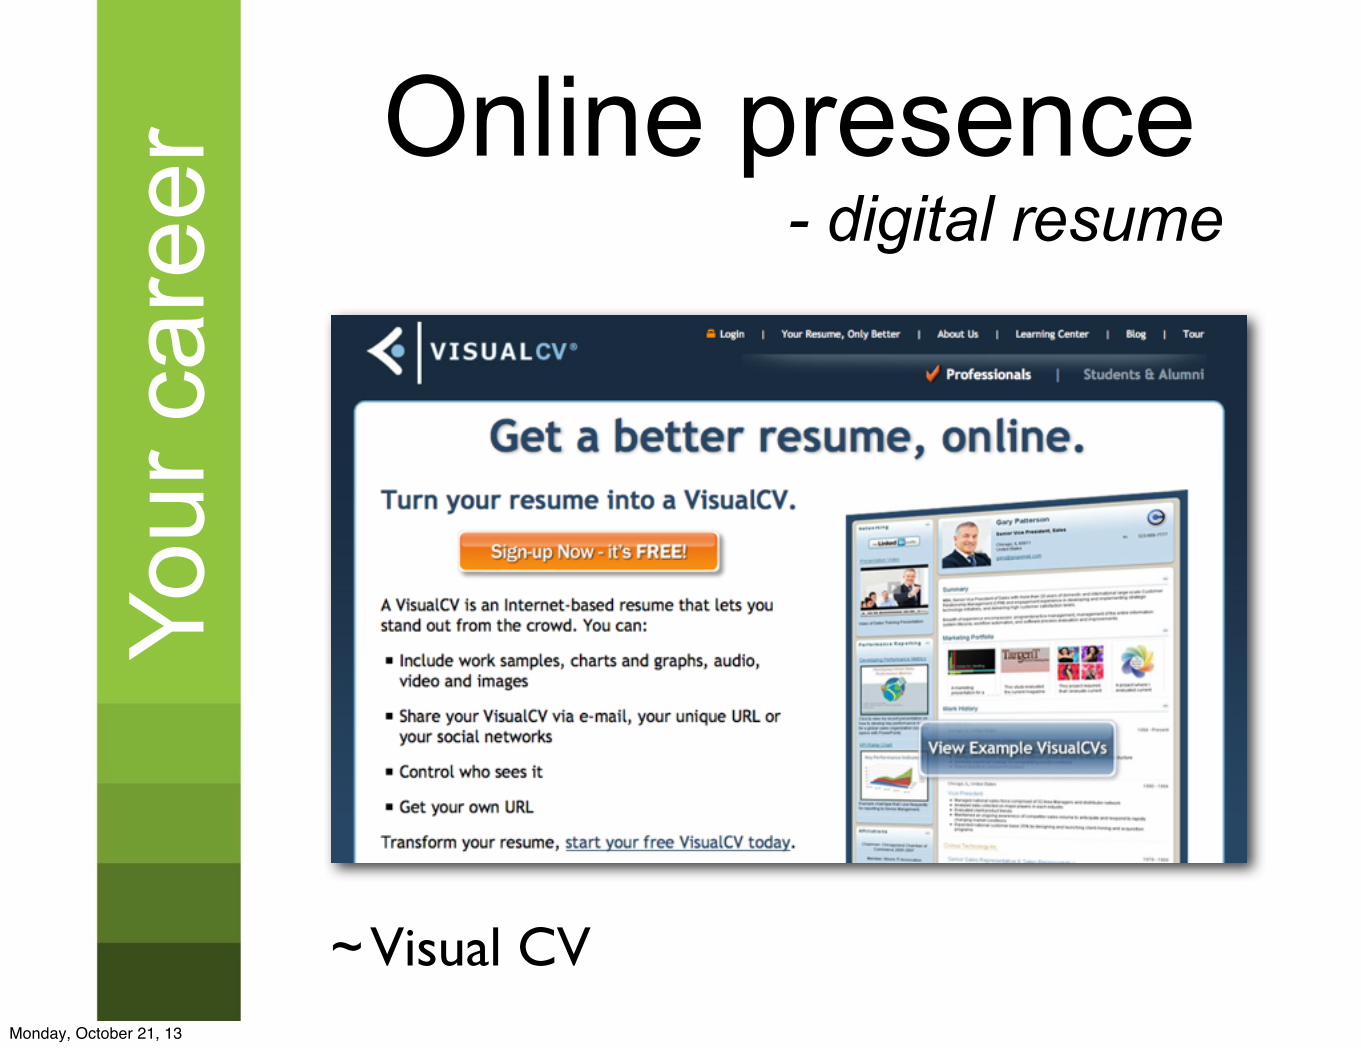
Online presence- digital resume
~ Visual CV
Your
car
eer
Monday, October 21, 13

Online presence- LinkedIn profile
Your
car
eer
Five essential elements of your LinkedIn Profile:• Professional headshot• Optimize your headline• Update your experience and summary• Build connections• Gain and give recommendations
Monday, October 21, 13

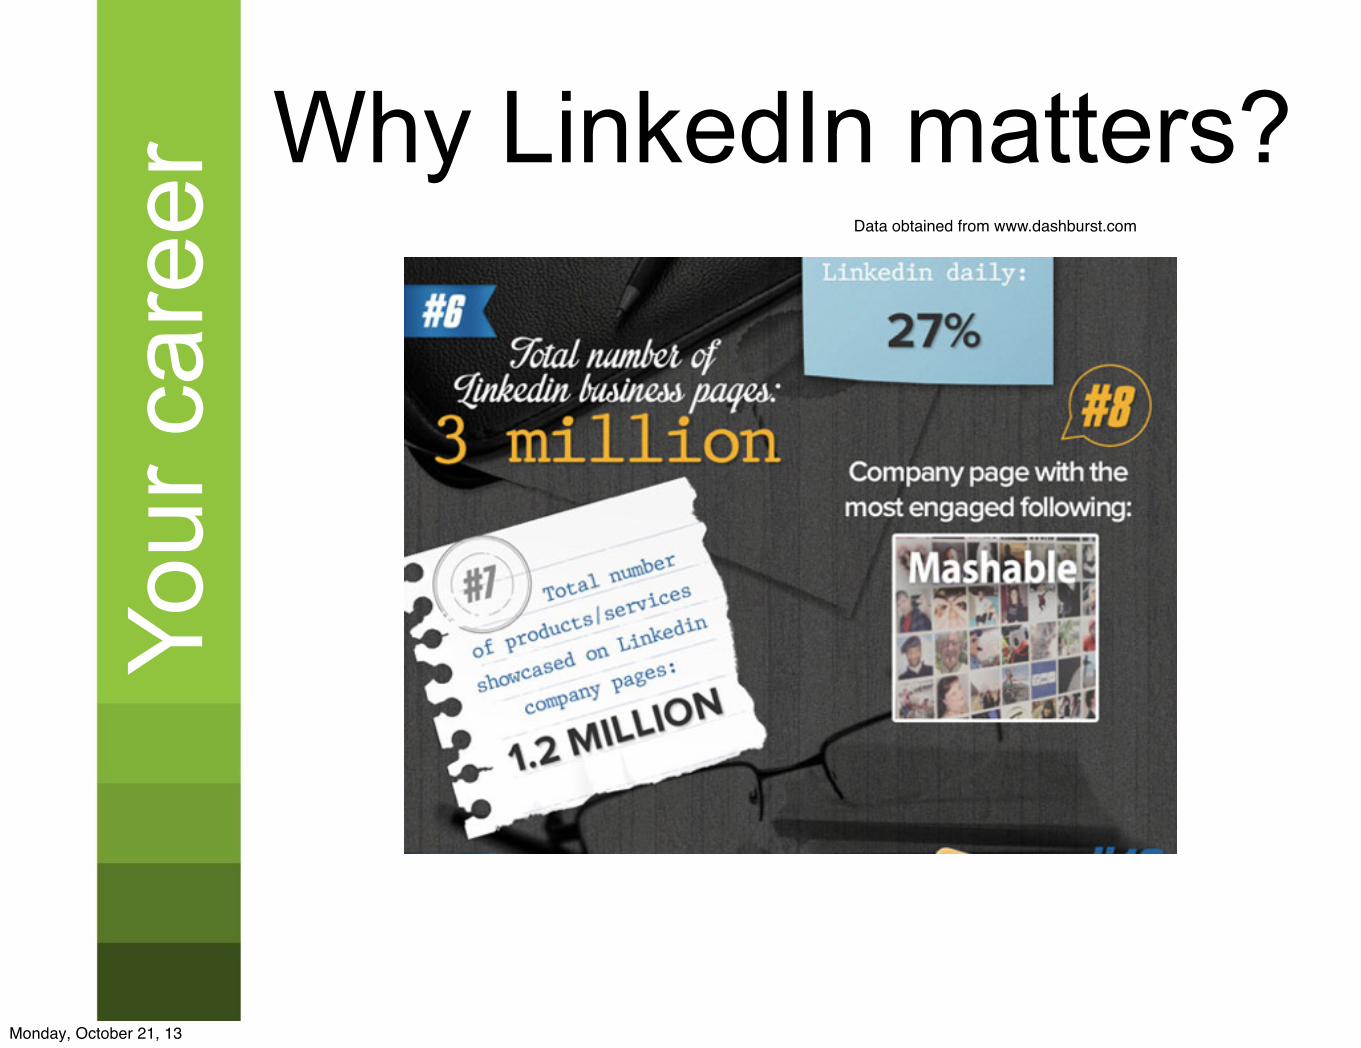
Why LinkedIn matters?Yo
ur c
aree
rData obtained from www.dashburst.com
Monday, October 21, 13

Why LinkedIn matters?Yo
ur c
aree
rData obtained from www.dashburst.com
Monday, October 21, 13
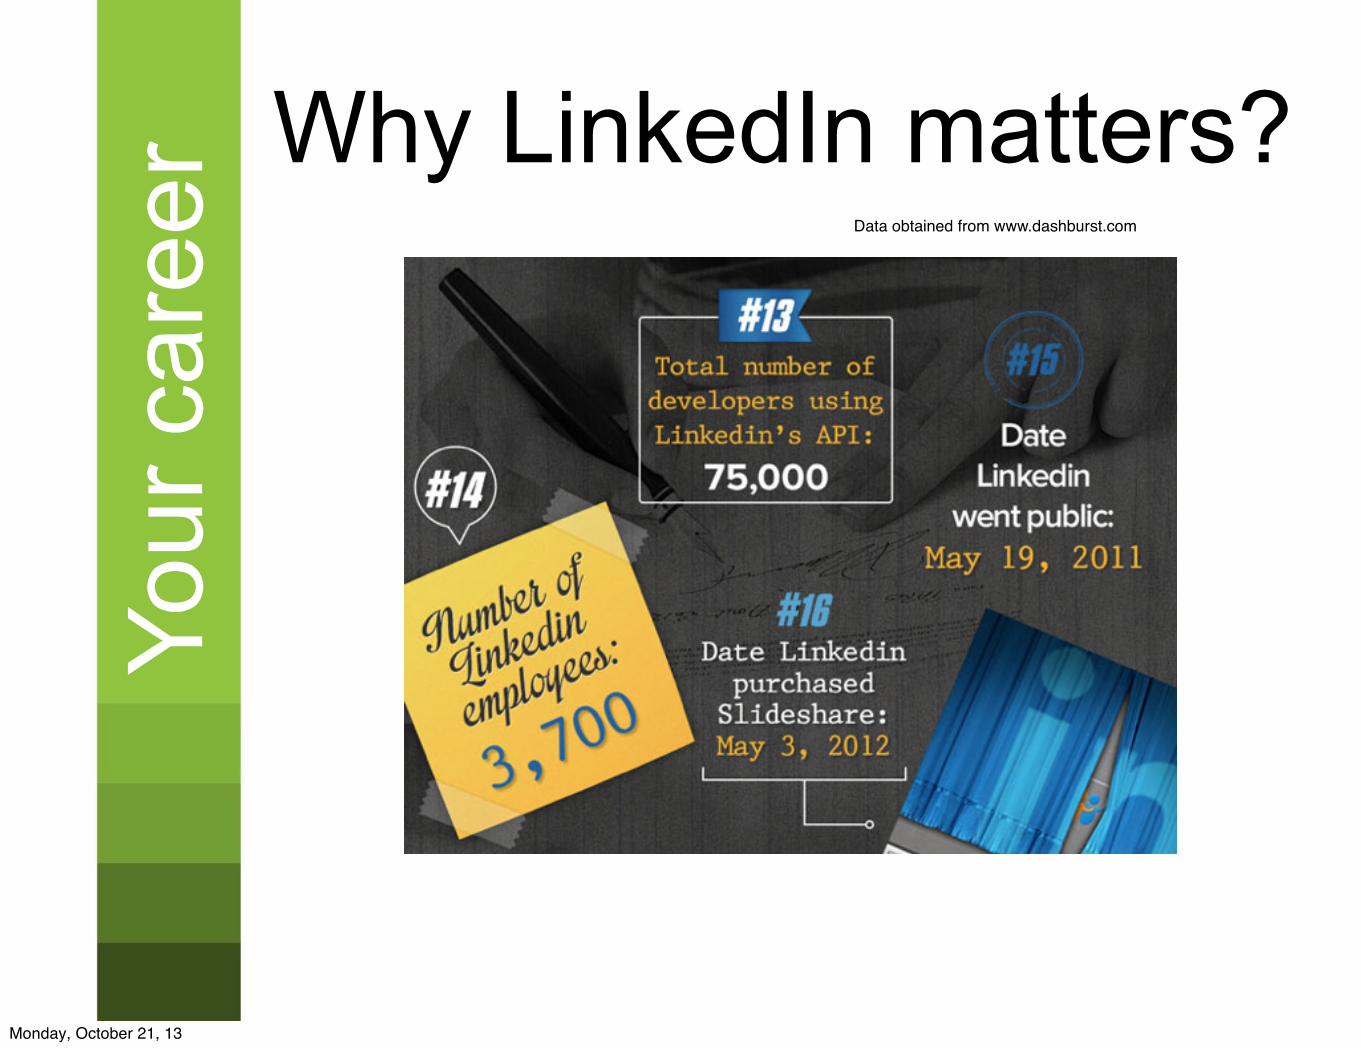
Why LinkedIn matters?Yo
ur c
aree
rData obtained from www.dashburst.com
Monday, October 21, 13
Why LinkedIn matters?Yo
ur c
aree
rData obtained from www.dashburst.com
Monday, October 21, 13

Why LinkedIn matters?Yo
ur c
aree
rData obtained from www.dashburst.com
Monday, October 21, 13

Your
car
eer Social Media in Recruiting
Monday, October 21, 13

NETWORKNETWORK
NETWORKMonday, October 21, 13
Your
car
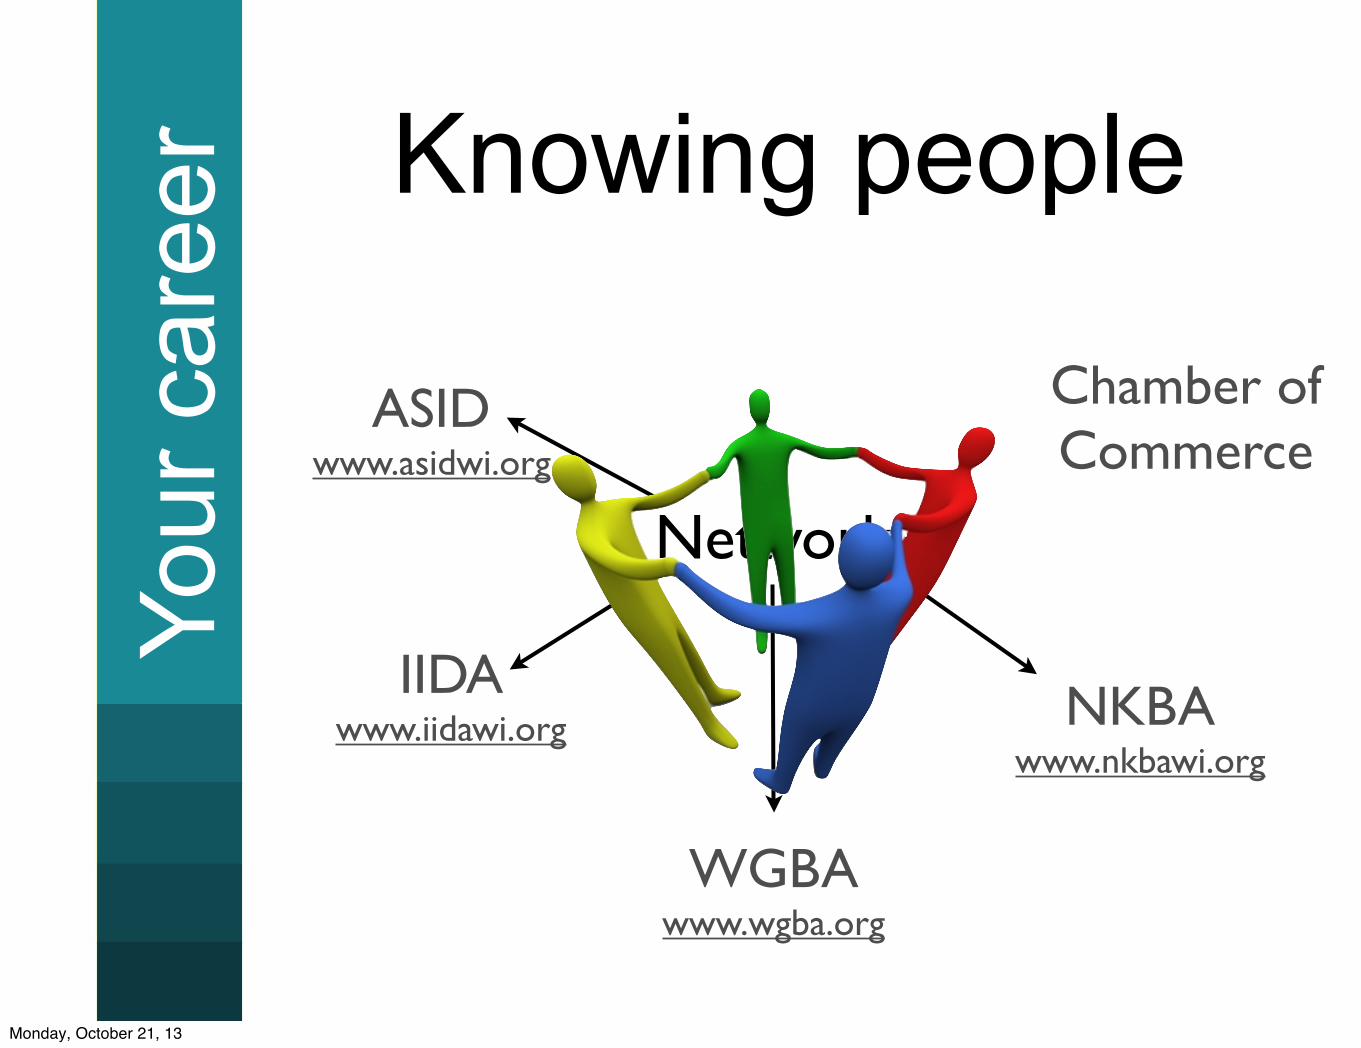
eer Knowing people
Network
ASIDwww.asidwi.org
IIDAwww.iidawi.org
WGBAwww.wgba.org
Chamber of Commerce
NKBAwww.nkbawi.org
Monday, October 21, 13

QUESTIONS
Monday, October 21, 13
Top Related