


Languages
Pages
Legal


TNK-BP: Managing risk in Russia
Larry McVayChief Operating Officer, TNK-BPCERA Week, Houston, February 15, 2004

Presentation outline
I. Company introduction
II. Russia’s operating environment: opportunities and challenges
III. TNK-BP experience: managing risk in Russia

TNK-BP at a glance– Annualized 2004 liquids production of 1.44 mln bpd (TNK-BP excluding Slavneft)
+ 0.22 mln bpd (Slavneft)
– Operating in all major hydrocarbon areas of Russia, main production assets located in West Siberia and Volga Urals basins
– Year-end 2003 liquid reserves:• SPE total proved: 9,060 mln bbls
• SPE total proved + probable: 17,383 mln bbls
• SEC total proved with license cut-offs: 4,318 mln bbls
– Total number of fields: 250 • well stock: 15,000 producing and 9,500 idle
– Lift method: circa 80% of production on ESPs
– Pipeline (km): 28,000
– Refineries: 6 (28 mtpa throughput)
– Retail sites: over 2,100
– Employees: 99 000 in Russia and Ukraine

TNK-BP geography
core production areas
project areas
Volga Urals
West Siberia
Moscow
East Siberia
Samotlor
Saratov Orenburg
Udmurt
RospanNyagan
Kovytka
VC
NNG
TNK Sakhalin
Uvat
* SPE proved
Liquid VolumesVolga Urals
West Siberia
East Siberia Total
04 production (kbpd) 451 987 0
0
1.8
1,437
* reserves (bn bbls) 1.9 7.1 9.1
** resource (bn bbls) 4.1 23.1 28.9
** SPE 3P consolidated reserves(excluding Slavneft)
SPE Proved 9.1 bn bbls
SPE Possible 11.4 bn
bbls
SPE Probable
8.3 bn bbls

Industry position
• TNK-BP keeps production growth above Russian average rate
• Oil production growth continuing but slowing in Russia
Source: Company reports
0
200
400
600
800
1000
1200
1400
1600
1800
Yukos Lukoil TNK-BP Surgut Sibneft Tatneft Slavneft Rosneft Bashneft
20032004
Annu
al c
rude
pro
duct
ion
(kbp
d)
0%
5%
10%
15%
20%
25%
Slavneft TNK-BP SurgutNG Rosneft Russia Sibneft Lukoil Yukos
20032004
Production growth rate, 2004
2004 production growth

TNK-BP: 17 months on
• Strong production growth above the industry average 13%
• Renewal of asset base commenced
• Focus on corporate governance
• Exports and sales up
• Refinery modernization on track
• HSE improving
• Robust financials, working within financial framework
700
800
900
1,000
1,100
1,200
1,300
1,400
1,500
Q1 Q2 Q3 Q4 Q1 Q2 Q3 Q4 Q1 Q2 Q3 Q4 Q1 Q2 Q3 Q4
2001 2002 2003 2004
kbpd
35
45
55
65
75
mtpa

Russian Petroleum Basins
Ultimately Recoverable Reserves in bnboe with gas/oil division. Source: BP reports, 2003
Moscow
Irkutsk
WESTSIBERIA
SAKHALIN
EASTSIBERIA
TIMANPECHORA
VOLGA-URALS VC
KT 4
Uvat
Rospan
Ryabchik
Kovykta
BARENTS
OilOilGasGas
531531
105105
6363
3030
3737
2626

Working in Russia: operating environment
ChallengesChallengesPositivesPositives• Compelling opportunity set
• Robust macroeconomic environment
• Domestic market increasingly attractive
• Federal and regional authorities open to dialogue
• Tax regime– Provides cushion in case of price
decline
• Increasing state control
• State monopolies restricting
– Oil transportation and exports
– Gas transportation
• Complex bureaucracy
• Tax regime
– Incremental tax take 90% after $25/bbl

Tax regime
0%
10%
20%
30%
40%
50%
60%
70%
80%
90%
100%
15 20 25 30 35$/bbl
Russia Norway US GoM UK old fields UK new fields
Marginal tax rate in %
Source: International Tax and Investment Council/Petroleum Advisory Forum/TNK-BP

The export challenge
• Production substantially outpacing domestic demand growth
• Export system needs de-bottlenecking
– Investment in new infrastructure required
– New export routes required to access higher-growth markets (North America, Asia-Pacific)
• Government supports plans to expand export infrastructure but is reluctant to allow private investment in infrastructure

Incremental crude export capacity expansion, 2002-2006F• Transneft Export Expansions
Source: TNK-BP projection
94273
591511
580
200
400
600
800
2002 2003 2004 2005E 2006E
mtpa
0510152025303540
kbpd

internationalmarkets
Ryabchik
infrastructure access
currentproduction
infill drilling
field optimisation
near infrastructureleddevelopment
0
5
10
15
20
25
30
35
prob
able
poss
ible
drilling & re-completions
SPE
prov
ed
long termshort term medium term
Estimated resources30.8bn boe (Liquids only) estimated bn boe estimated bn boe
SEC basis PD 3.4
4.3
6.0
SEC basis PD + PUD
SPE PD
SPE PD + PUD 9.1
SEC basis : proved, truncated at license expiry
SPE : recovery to economic life of field
PD : proved developed
PUD : proved un-developed
Proved reserves as at 1/1/2004
Resources to reserves to production
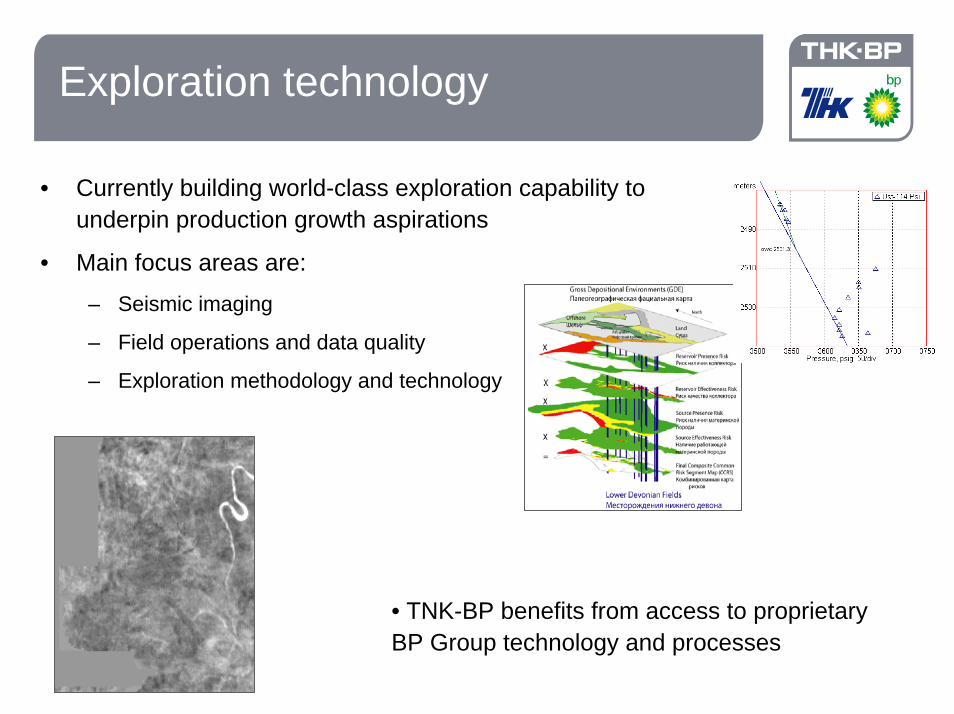
Exploration technology
• Currently building world-class exploration capability to underpin production growth aspirations
• Main focus areas are:
– Seismic imaging
– Field operations and data quality
– Exploration methodology and technology
• TNK-BP benefits from access to proprietary BP Group technology and processes

Downstream portfolio
• St. Petersburg
• Moscow• Kaluga
• Tula• Kursk
• Saratov
• Rostov • Orenburg
• Karelia
• Krasnodar
R U S S I A
• Dnipropetrovsk
• Donets'k
• Kiev
U K R A I N E
• Linos refinery
• Orskrefinery
•Krasnoleninskrefinery
• Nizhnevartovskrefinery
•Ryazan
refinery
•Saratovrefinery
•Orenburglubes plant
Russia:• GDP per capita:
8,945 USD• GDP growth rate:
7%• Fuel demand: 70.0
blpa (retail 40.0 blpa)
• Fuel volume growth: 3.5%
Ukraine:• GDP per capita:
5,300 USD• GDP growth rate:
8.2%• Fuel demand: 10.3
blpa (retail 7.0 blpa)• Fuel volume growth:
5.0%
Yaroslavl
GDP PPP terms, CIA world fact book
Fuel demand, McKinsey long term forecast
Strategic prospective regions
Growth regions
Other regions of current presence
Strategic regions
Refining RefineriesRef. volumes,
mtpa
226
Market share10%18%
Russia 5Ukraine 1
MarketingRetail sites
Retail volume,
blpaRussia 1,080 4.3Ukraine 1,020 1.4

Downstream optimization process
Gas Condensate
5 Refineries55 Types of
Products
13 Fields6 Quality Grade of
Crude
Export Crude
Products for Export
Products for domestic market
Crude for domestic market
Pipe (280 routes)
Rail (95 routes)
Barge (2 routes)
18 Ports
12 Ports13 Types of
Products
14 Marketing Subsidiaries
35 Wholesale Terminals
Pipe (84 routes)
Rail (6 routes)
Pipe (46 routes)
Rail (2 routes)
Barge (2 routes)
Pipe supplyfor refining
Supplies to2 refineries
Export pipe supply
Transshipment via
refinery for export
Summary
• Environment remains challenging but manageable
• Long-term horizon is key• A quality opportunity set• Resource base confirmed and
robust• Right technology application
can deliver • High quality skilled workforce• Moving from harvest to renewal • Gas will become increasingly
important• Governance progressing,
more to do
Top Related