
Yu info 2015 final jg
42
Telecom and In ter net T r e n d s (and service provider challenges) Jož ek Gruš kovnjak Managing Director & Principal Consultant
-
Upload
jozek-gruskovnjak -
Category
Business
-
view
324 -
download
0
Transcript of Yu info 2015 final jg

Telecom and Internet Trends (and service provider challenges)
Jožek Gruškovnjak Managing Director & Principal Consultant

A Minute in the Life of the Internet
Source: GP Bullhorn
208,000 photos uploaded 30 hours of new video uploaded
2 million search queries $83,000 in revenue
100,000 tweets
100 new accounts
© Inluceo Consulting, Ltd., 2014 2

A Minute in the Life of the Internet
Source: GP Bullhorn
208,000 photos uploaded243,000 photos uploaded
30 hours of new video uploaded100 hours of new video uploaded
2 million search queries3.5 million search queries
$83,000 in revenue$118,000 in revenue
100,000 tweets350,000 tweets
100 new accounts120 new accounts
2012 2013
⬆1177%%
⬆2200%% ⬆7755%% ⬆4422%%
⬆223333%%⬆225500%%
© Inluceo Consulting, Ltd., 2014 3

All these new services and users are
51
62
76
91
110
132
0
20
40
60
80
100
120
140
2013 2014 2015 2016 2017 2018
Exab
ytes
per
Mon
th
Year
CAGR of 21%2.6 x increase
Source: Cisco VNI Global Forecast, 2013–2018© Inluceo Consulting, Ltd., 2014
§ Global IP traffic increased more than five-fold in the last five years.
§ Annual global traffic will surpass the zettabyte in 2016.
§ Content delivery networks (CDN) will carry more than 50% of internet traffic in 2018.
§ Over half of all IP traffic will originate with non-PC devices by 2018.
§ Globally, IP will be 79% of all consumer Internet traffic in 2018.
4

© Inluceo Consulting, Ltd., 2014 5
0
50
100
150
200
250
300
350
400
2009 2010 2011 2012 2013
GGrroo
wwtthh
IInnddee
xx ((22
000099==
110000))
SSPP PPrroo ttaabbiilliittyy vveerrssuuss IInntteerrnneett TTrraaff cc GGrroowwtthh22000099––22001133**
Total Internet traffic evolution Revenue EBITDA
Source: Cisco SPTG, Cisco Visual Networking Index, 2009-2014)
Growth – 38% CAGR
Revenue Growth – 6% CAGR
EBITDA Growth – 5% CAGR
Value Opportunity (?)

There is a perfect storm in the making
© Inluceo Consulting, Ltd., 2014 6

Voice
Messaging
Video
Conferencing
Music
© Inluceo Consulting, Ltd., 2014 7

© Inluceo Consulting, Ltd., 2014 8
$11BB qquuaarrtteerrllyy AAWWSS rreevveennuueess220000MM++ ccuussttoommeerr aaccccoouunnttss
880000MM iiOOSS ddeevviicceess sshhiippppeedd11..22BB mmoonntthhllyy aaccttiivvee
uusseerrss ((7777%% mmoobbiillee))
1B Android 1B YouTube 750M Chrome 1B Web 425M Gmail users
Over 1.25B Windows 750M Office 70M Xbox 41M Skype 900M Web users
FFiigghhtt ttoo OOwwnn//
CCoonnttrrooll
CCuussttoommeerr
CClloouudd
PPllaattffoorrmm
EEccoossyysstteemm
DDaattaa
DDoollllaarrss
Source: Cisco SPTG, Source: Web Operation Quarterly Update, Patrick Morrissey
© Inluceo Consulting, Ltd., 2014
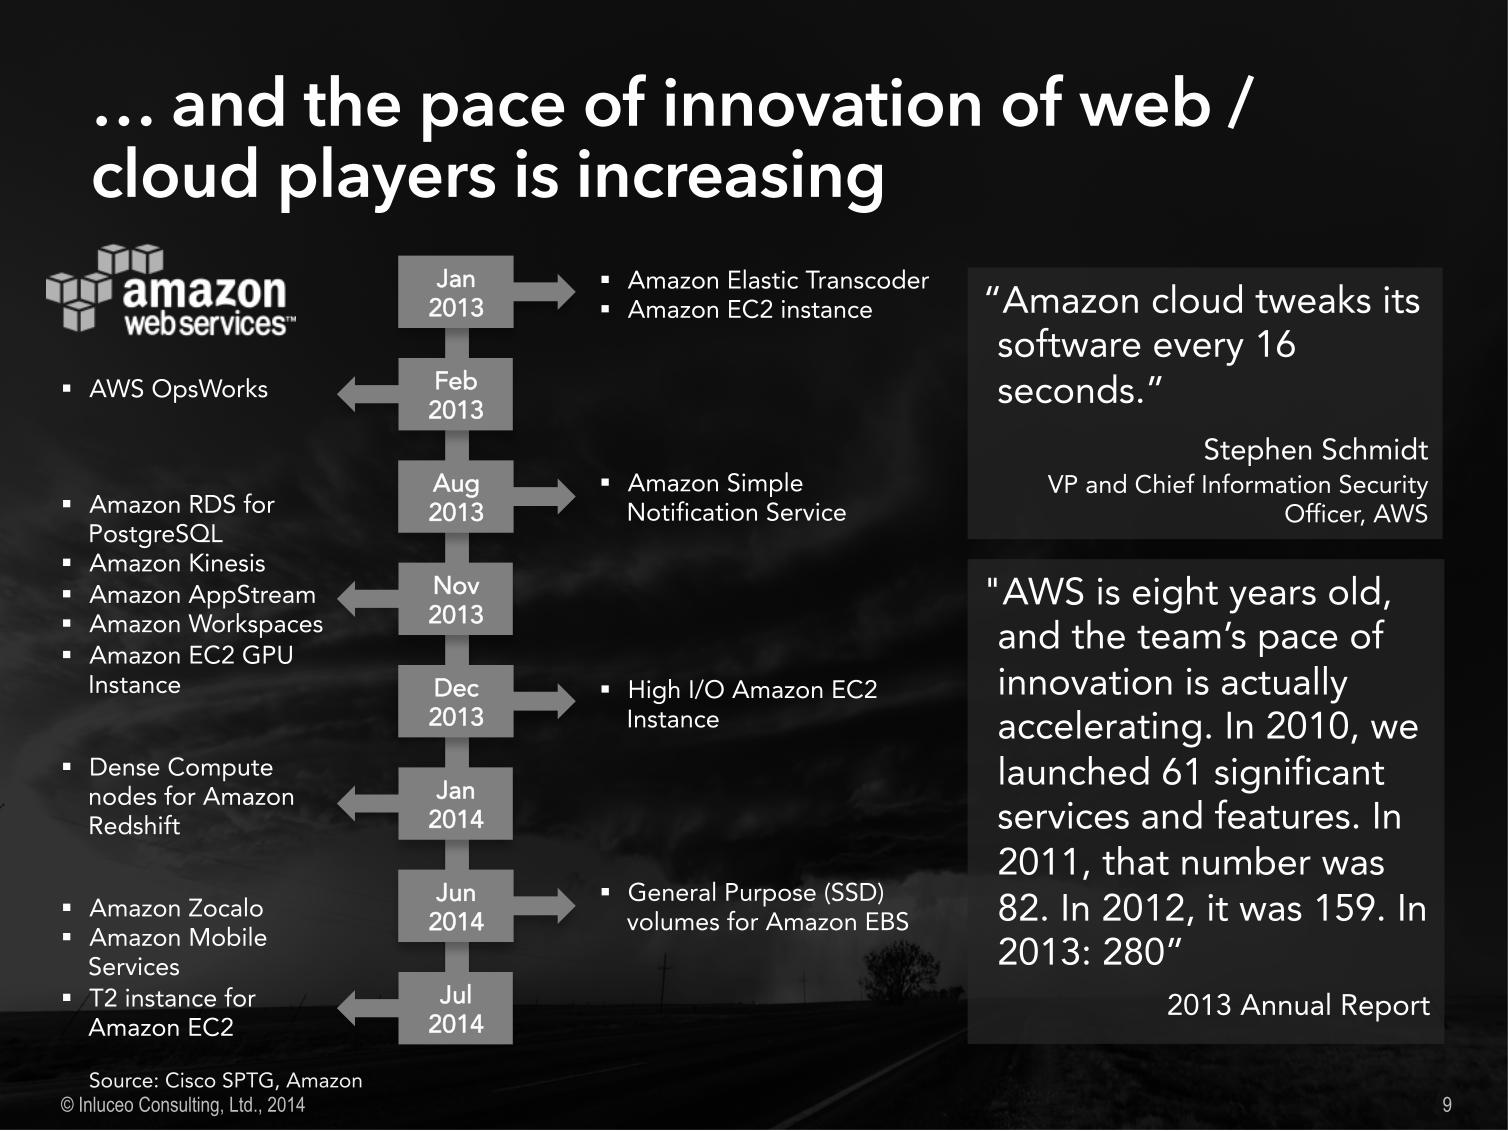
JJaann22001133
FFeebb22001133
AAuugg22001133
NNoovv22001133
DDeecc22001133
JJaann22001144
JJuunn22001144
JJuull22001144
§ Amazon Zocalo§ Amazon Mobile
Services § T2 instance for
Amazon EC2
§ Dense Compute nodes for Amazon Redshift
§ General Purpose (SSD) volumes for Amazon EBS
§ High I/O Amazon EC2 Instance
§ Amazon RDS for PostgreSQL
§ Amazon Kinesis§ Amazon AppStream§ Amazon Workspaces§ Amazon EC2 GPU
Instance
§ Amazon Simple Notification Service
§ AWS OpsWorks
§ Amazon Elastic Transcoder§ Amazon EC2 instance “Amazon cloud tweaks its
software every 16 seconds.”
Stephen SchmidtVP and Chief Information Security
Officer, AWS
"AWS is eight years old, and the team’s pace of innovation is actually accelerating. In 2010, we launched 61 significant services and features. In 2011, that number was 82. In 2012, it was 159. In 2013: 280”
2013 Annual Report
9 Source: Cisco SPTG, Amazon

Telecommunications services providers are feeling the
aaiinn
© Inluceo Consulting, Ltd., 2014 10

Traditional telecommunications services are
© Inluceo Consulting, Ltd., 2014 11
648 608 533
468 532 574
1,296 1,216 1,189
720 912 1,189
468 532 615 3,600
3,800 4,100
-
1,000
2,000
3,000
4,000
5,000
Past Now Future
RReevvee
nnuueess
((UUSSDD
BB$$))
Fixed Voice Fixed Data Mobile Voice Mobile Data Video
2012 & 2013 2014 & 2015 2016 & 2017
2.8%Y/Y growth
3.4%Y/Y growth
2.7%Y/Y growth
Mobile Datakey growth driver
Source: Cisco SPTG, Ovum Knowledge Centre
Overall CAGR 2012 – 2017: 3.1%

11 16 21 20 33 52 27
77
139
-
50
100
150
200
250
Past Now Future
RReevvee
nnuueess
((UUSSDD
BB$$))
OOTTTT && AAddvveerrttiissiinngg
Social Media Ads OTT Mobile Internet Ads
2012 & 2013 2014 & 2015 2016 & 2017
691 1,141
1,681
231 363 580 18 28
48
-
1,000
2,000
RReevvee
nnuueess
((UUSSDD
BB$$))
MMaacchhiinnee--ttoo--MMaacchhiinnee
M2M Revenue MNO Addressable MNO Expected
© Inluceo Consulting, Ltd., 2014 12
Past Now Future2012 & 2013 2014 & 2015 2016 & 2017
11 12 11 6 17 23 80
142 198
2
5
10
-
50
100
150
200
250
300
Past Now Future
RReevvee
nnuueess
((UUSSDD
BB$$))
CClloouudd
IaaS PaaS SaaS BPaaS
CAGR: 26%
CAGR: 40% CAGR: 25%
2012 & 2013 2014 & 2015 2016 & 2017
…
Sources: Cisco SPTG, ABI Research, eMarketer, BIA/Kelsey, Machina Research

The trend is improving as service providers enter new markets deploy new pricing strategies. Examples: § Industry focus (Singtel,
SK Telecom – gaming, …)
§ Tiered data plans (Comcast, Airtel, Telstra, …)
§ Shared data plans (Vodafone, …)
§ App-centric data plans (MTN, NTT Docomo, …)
© Inluceo Consulting, Ltd., 2014 13
-‐10% -‐5% 0% 5%
La�n America
E. Europe, MEA
Europe
North America
Asia (Developed)
Asia (Emerging)
Average
2015
2014
2013
2012
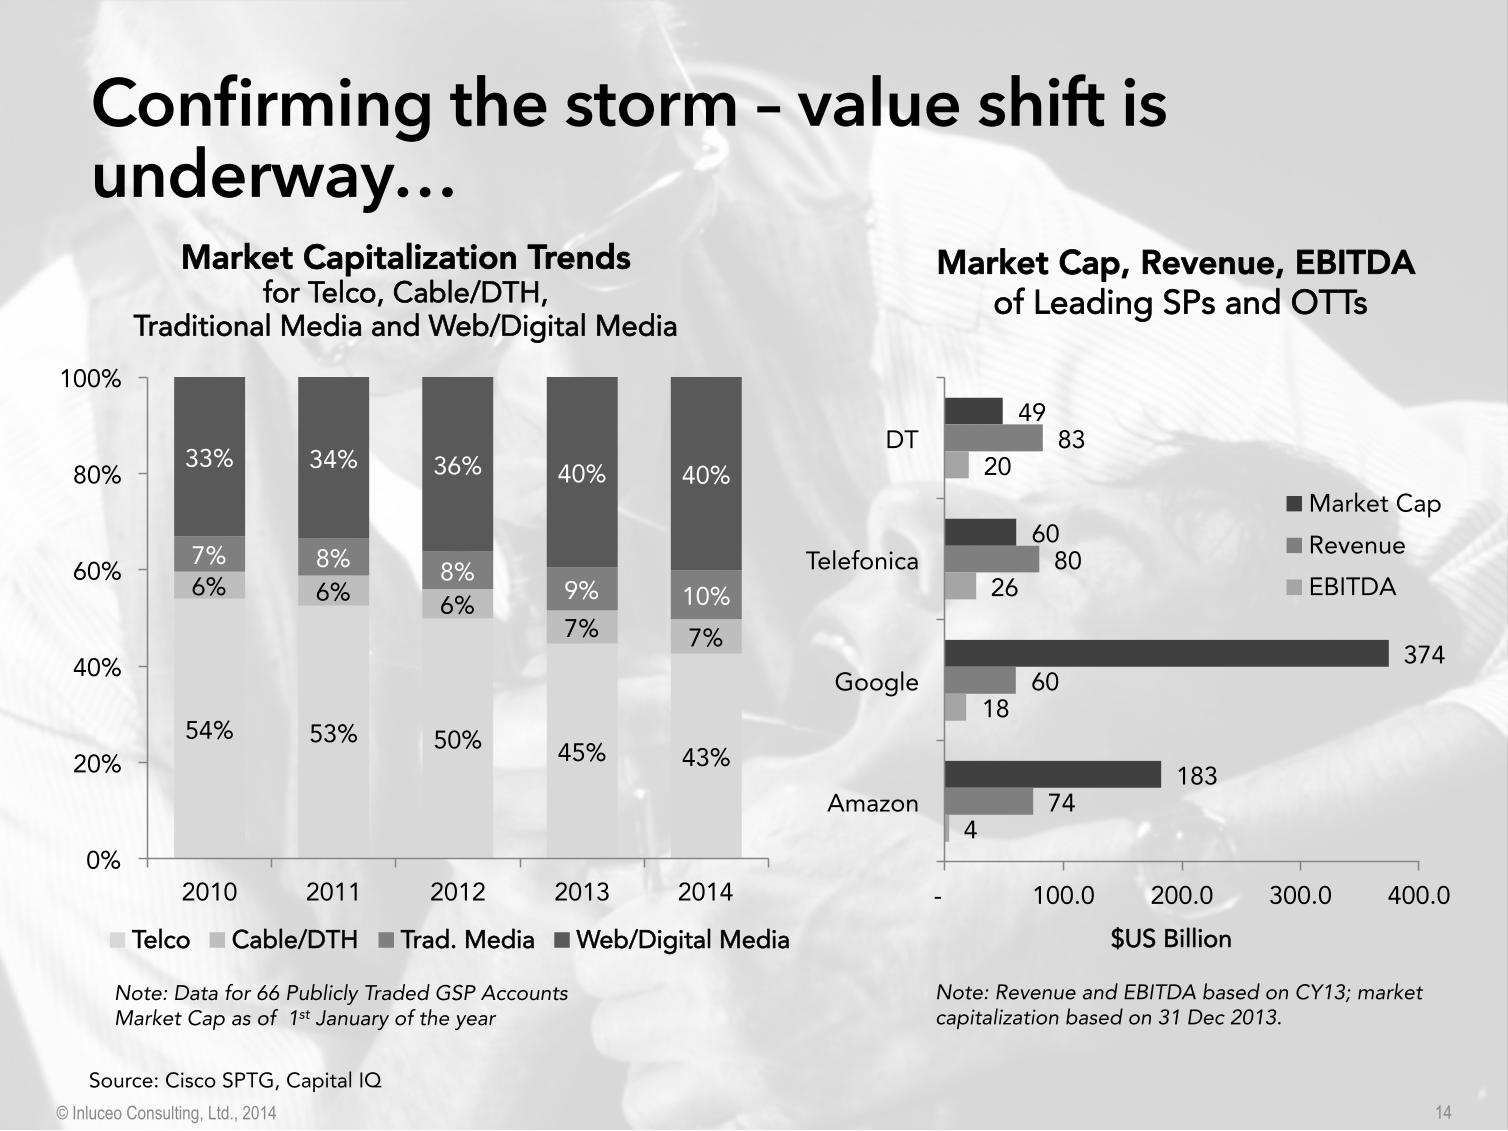
54% 53% 50% 45% 43%
6% 6% 6%7% 7%
7% 8% 8%9% 10%
33% 34% 36% 40% 40%
0%
20%
40%
60%
80%
100%
2010 2011 2012 2013 2014
TTeellccoo CCaabbllee//DDTTHH TTrraadd.. MMeeddiiaa WWeebb//DDiiggiittaall MMeeddiiaa
© Inluceo Consulting, Ltd., 2014 14
MMaarrkkeett CCaappiittaalliizzaattiioonn TTrreennddssffoorr TTeellccoo,, CCaabbllee//DDTTHH,,
TTrraaddiittiioonnaall MMeeddiiaa aanndd WWeebb//DDiiggiittaall MMeeddiiaa
49
60
374
183
83
80
60
74
20
26
18
4
- 100.0 200.0 300.0 400.0
DT
Telefonica
Amazon
$$UUSS BBiilllliioonn
Market CapRevenueEBITDA
Note: Revenue and EBITDA based on CY13; market capitalization based on 31 Dec 2013.
MMaarrkkeett CCaapp,, RReevveennuuee,, EEBBIITTDDAA ooff LLeeaaddiinngg SSPPss aanndd OOTTTTss
Note: Data for 66 Publicly Traded GSP AccountsMarket Cap as of 1st January of the year
Source: Cisco SPTG, Capital IQ

CONNECTIVITY SERVICES Entry Barriers High Lower
Investment Long-term, high volume, lower risk
Short-term, lower volume, higher risk
Metrics Unit cost Time-to-market, agility
Market Velocity Years / decades Weeks / months
SP Role Incumbency, few players Just one of competitors
Key Success Factors
§ Ubiquitous, seamless connectivity
§ Lean, utility-type production§ Build scale§ Differentiate via speed/QoS,
price, service§ Smart service enablement§ Manage disruption (FTTX,
WiFi/small cells)
§ All-in service ecosystems§ Time-to-market and agility § Highly scalable cost
structures (new services at ≈ zero incremental cost)
§ Customer ownership§ Information & data
ownership/management
© Inluceo Consulting, Ltd., 2014 15

So what should telecommunications service providers focus on?
© Inluceo Consulting, Ltd., 2014 Photo: HBR
16

© Inluceo Consulting, Ltd., 2014
Revenue
OOppeerraattiioonnaall CCoommppeettiittiivveenneessss:: OOPPEEXX RReedduuccttiioonn,, NNeettwwoorrkk SShhaarriinngg,,
CCoo--ooppeettiittiioonn
CCaattcchhiinngg tthhee NNeexxtt WWaavvee ooff
CClloouudd
UUnnlloocckkiinngg TThhee VVaalluuee ooff SSMMBB
NNeettwwoorrkk VViirrttuuaalliizzaattiioonn &&
PPrrooggrraammmmaabbiilliittyy
IInntteerrnneett--ooff--TThhiinnggss
PPrrooffiittaabbiilliittyy aanndd GGrroowwtthh ooff DDiiggiittaall
MMeeddiiaa
PPeerrvvaassiivvee MMoobbiilliittyy
BBiigg DDaattaa aanndd AAnnaallyyttiiccss
SSPP SSeerrvviicceess EEvvoolluuttiioonn
17

Photo: Tauno Tõhk, Creative Commons, http:// /photos/toehk/
The world has gone
18

The world has gone
© Inluceo Consulting, Ltd., 2014 19
-
25
50
75
100
125
-
2,500
5,000
7,500
'01
'02
'03
'04
'05
'06
'07
'08
'09
'10
'11
'12
'13
'14*
PPeerr 110000 IInnhhaabbiittaannttss
MMoobb
iillee--CC
eelllluu
llaarr SS
uubbsscc
rriippttiioo
nnss ((MM
iilllliioo
nnss))
GGlloobbaall MMoobbiillee SSuubbssccrriibbeerrss ((22000011--22001144))
Subscriptions
Source: ITU World Telecommunication/ICT Indicators database
-
500
1,000
1,500
2,000
2,500
'05 '06 '07 '08 '09 '10 '11 '12* '13*
MMoobb
iillee--CC
eelllluu
llaarr SS
uubbsscc
rriippttiioo
nnss
((MMiillll
iioonnss
))
BBrrooaaddbbaanndd SSuubbssccrriibbeerrss -- FFiixxeedd vvss.. MMoobbiillee
((22000055--22001111))
Fixed BBMobile BB
* estimates
Converging forces§ 3rd Generation Applications – video,
social networks, music, books, etc.§ Devices – bigger, powerful§ New, faster cellular technologies –
LTE, LTEA, 5G, …§ Rise of Wi-Fi – availability, ease of
use§ Nomadic Use – versus mobile… drive staggering mobile data traffic growth – 66% CAGR beween 2012 and 2017

© Inluceo Consulting, Ltd., 2014 20
-
200
400
600
800
1,000
1,200
2012 2013 2014 2015 2016 2017 2018 2019
Mobile Services Revenues(2012 – 2019, billions USD)
Americas Asia & Oceania Europe MEA
-
5
10
15
20
25
2012 2013 2014 2015 2016 2017 2018 2019
Mobile Services ARPU(2012 – 2019, USD)
Americas Asia & Oceania Europe MEA
Questions that needs to be answered:How can MNOs make money in new mobile world? What is the next generation of mobile monetization?
Subscriber Penetration
Net
Reve
nue
Revenue Growth Curves
Voice
Messaging
Access Next Generation Mobile Monetization
Sources: Cisco IBSG, Ovum, revenue growth curves adopted from Chetan Sharma Consulting
CAGR: 2.3% L

can use to create additional value
© Inluceo Consulting, Ltd., 2014 21
How to make enough money from mobile to
justify infrastructure investments?
Cost Optimization11
Pricing22
Network Enabled Features
33
New Solutions and Services
44
§ Virtualized production architectures § Next generation mobile access § Improving business agility § New business models
§ Tiered pricing & usage caps § Valued-based pricing § Shared plans Internet of Everything
readiness § Plan rationalization & simplification § Bundling
§ Quality of Service § Policy § APIs § Data & analytics § Security
§ Mobile cloud § Internet of Things “IoT” § Connected vehicles § Enterprise/SMB solutions § OTT collaboration § Wi-Fi/small cell solutions

© Inluceo Consulting, Ltd., 2014 22
0
100
200
300
400
500
600
700
800
900
n Portable Media Players
n Connected TVs
n Desktop PCs
— Traditional TVs
Video Enabled Devices Connected-Fixed; Connected-Portable; Traditional
BRIC Countries
n Notebook
n Netbook
n Tablet
n Wi-Fi Cell Phone
n Portable Game Console
Tablets expands mobile video§ 11% of online users own / planning
to buy a tablet§ 439 installed base by 2015
Mobile TV and Video Service revenue§ $4.5 billion (2013) è $9.5 billion
(2017)§ By 2017, 2 B mobile and tablet users
will watch TV and video on their devices
Online video§ 70% of online users watch online
video
§ In 2020 viewing of internet / online video will surpass live broadcast
2010 2011 2012 2013 2014 2015F
Sources: Cisco IBSG, Screen Digest 2011, Strategy Analytics, 2011, eMarketer, The Diffusion Group

now
© Inluceo Consulting, Ltd., 2014 23
Multi-screen TV
experience
Online Content on TV /STB
Intuitive Unified Navigation for All Content
Social and Interactive Experiences on TV/STB
Cloud-enabled ‘Hassle free’ features
Sources: Cisco IBSG

Objective: Provide high-quality user experience.Services examples:§ Usage Based Tiers and Video§ New Video Experiences (e.g., Web
Video on TV)§ Replay/Catch-up TV§ N-Screen services§ Ad-supported content§ Application and Content Store
Objective: Enable IP distribution to spread content.Services examples:§ Media vault/storage§ Content repurposing§ CDN service§ User profiling§ Targeted advertising§ Billing and payment
exist
© Inluceo Consulting, Ltd., 2014 24
Business to Consumer (B2C)
Source: Cisco WWSP and IBSG
Broadcasters
Advertisers
Content Aggregators
Application Developers
Business to Business (B2B)
$
Service Provider

- massive growth
© Inluceo Consulting, Ltd., 2014 26 Source: Business Insider

Analytics and business intelligence tools empower decision makers as never before by extracting and presenting meaningful information in real-time, helping us be more predictive than reactive.
AAnn tt ccss
Ubiquitous networks and device proliferation enable access to a massive and growing amount of traditionally siloed Information.
BB DD tt
Where is the ?
© Inluceo Consulting, Ltd., 2014 27
The Internet of Things connects all manner of end-points, unraveling a treasure trove of data.
Valu
e fo
r bus
ines
s
IIooTT
Source: Frost & Sullivan

l SSeeaarrcchhl BBrroowwssiinngg
l FFrriieennddss && FFaammiillyyl LLiikkeess && HHoobbbbiieess
l CCoonntteenntt CCoonnssuummeeddl AApppplliiccaattiioonnss
the
© Inluceo Consulting, Ltd., 2014 28
Public Internet
Corporate / Private Internet
Internet of Things
CCoonntteexxtt ccaann bbee sseeeenn by the network(Location, Identity, Presence, X-Platform, etc.)
AAccttiioonn ccaann bbee ttaakkeenn through network control points
(Policy, Security, QoS, Fog, Routing, etc.)
u RReettaaiillu BBaannkkiinngg
u OOiill && GGaassu MMaannuuffaaccttuurriinngg
u HHeeaalltthhccaarree
u CCoommppaannyy--SSppeecciiffiicc AAnnaallyyttiiccssu BBuussiinneessss AApppplliiccaattiioonnss
n MMeetteerrssn MMeeddiiccaall
n CCaarrss // FFlleeeettssn TToollllss
n CCoonnssuummeerr DDeevviicceess
n CCiittyy CCaammeerraassu PPuubblliicc SSeeccttoorr
NNeett
wwoorr
kk DD
aattaa
EExxcchh
aannggee
NNeettww
oorrkk DDaattaa EExxcchhaannggee
Data is being collected everywhere, but the network is always in the middle, able to see, correlate patterns and take action

© Inluceo Consulting, Ltd., 2014 29
-
20
40
60
80
100
120
140
160
180
2011201220132014201520162017201820192020
TToottaa
ll PPuubb
lliicc CC
lloouudd
MMaarr
kkeettss
((BB$$))
GGlloobbaall PPuubblliicc CClloouudd MMaarrkkeett SSiizzee
IaaS PaaS SaaS BPaaS
Total CAGR of 23%
CAGR
39%
23%
35%6%
Telecommunications Service Providers
Systems Integrators & Server Vendors
Advanced SI capabilities, enterprise trust, SMB channels
Internet Companies
Global footprint and scale, large scale apps experience,
low cost

Deciding is critical
© Inluceo Consulting, Ltd., 2014 30
Variable Business ProcessSystem Legacy /
Heterogeneity
Real-time QoS Dynamic Bandwidth
Security / Privacy
Decoupled Best Effort Network
IT ComplexitySimple IT
IITTplus
SSII SSeerrvviicceess
IInntteerrnneett plus
LLaarrggee--SSccaallee DDaattaa CCeenntteerr
IInntteeggrraatteedd NNeettwwoorrkk aanndd IITTIInntteeggrraatteedd NNWW--IITT
plusSSII SSeerrvviicceess
CClloouudd PPllaayyss
(Gaming / HCS / TPaaS / VDI / APM / Hybrid Cloud / CDN / …)
Source: Cisco IBSG SP
(ERP, BPO, …)
(AWS, Gmail, …) (Desktop Outsourcing)
Network - IT Interdependency
Probably the best bet for network service providers

© Inluceo Consulting, Ltd., 2014 31
$11,739
$1,599
$934
$1,211
$1,764
$3,387
$966
$18,225
$12,509 $15,772
$7,855
$1,220
$100
$1,000
$10,000
-10% -5% 0% 5% 10% 15% 20% 25% 30% 35% 40%
Aver
age
Annu
al S
pend
(201
2 –
2017
, log
arith
mic
scal
e)
CAGR 2012 - 2017
SSMMBB SSeerrvviicceess iinn LLAATTAAMM:: SSiizzee aanndd GGrroowwtthh(2012 – 2017)
Source: AMI Partners, 2012, Cisco IBSG Analysis
Wireline Voice
Wireless Communications
Wireless Data
Network
IT Support
Web Hosting
Managed Network
Managed Communications
SaaS Collaboration
IaaS
RMITS SaaS
LLAATTAAMM 22001133 SSppeenndd
SB (1- 99 empl.) 52.8 B$
MB (100-999 empl.) 14.0 B$

Consumers are getting addicted to
© Inluceo Consulting, Ltd., 2014 32
18% 33% 39% 43%67%
66%42% 38% 36%
18%
Mobile Data Pay TV Mobile Voice Landline Phone Broadband
Respondents dropping last or second to lastRespondents dropping first or second
Source: Cisco IBSG, 2011, base: 6 Country Average
reduce expenses?
Some Canadians would give up essentials in order to have access to the Internet, 34% would give up liquor and beer, 31% would give up chocolate, 27% would give up coffee,
6% would give up sex, and 4% would give up daily bathing or showering.
– Rogers Innovation Report 2012

the factors that consumers value ?
© Inluceo Consulting, Ltd., 2014 33
€0.26 / liter €1.10 / liter €4.44 / liter
VALUE BASED PRICING
§ New value criteria – and thus pricing levers – can be created even in mature commodity products
§ The key is to identify & develop new value levers for broadband access
§ Potential levers:
² Broadband access: speed, consumption, quality
² Services portfolio: new SP services, 3rd party services
² Bundling

to
© Inluceo Consulting, Ltd., 2014 34
Evolution of cable operations and infrastructure
User experience
New device ecosystem
IP video end-to-end
Cloud computing
§ New interactive experiences§ Easy to change § Embrace the web§ Aggregation of info, entertainment & communication
§ Lower cost, commoditized devices§ Flexible storage architecture§ Managed configuration
§ Serve any device, source any content§ Leverage personal media§ Off-footprint reach
§ Faster product cycles with web development process
§ Apps store§ Easier to support more devices at scale
§ Ingest content, serve user interfaces§ Billing and entitlement§ Support service with customers
Example: Comcast Strategy / Vision

in this direction
© Inluceo Consulting, Ltd., 2014 35
UUnnlliimmiitteedd PPllaannssCCaappppeedd//TTiieerreeddPPllaannss
SShhaarreedd DDaattaa PPllaannss
AApppp--CCeennttrriicc PPllaannss
0% 20% 40% 60% 80% 100%
UUnnlliimmiitteedd
SShhaarreedd
AApppp--CCeennttrriicc
VVaalluuee--bbaasseedd
%% ooff OOppeerraattoorrss OOffffeerriinngg SSppeeccii eedd DDaattaa PPllaannss
2014
2012
Statistics from a Study conducted by Allot Communications based on data collected from ~180 mobile operators worldwide

© Inluceo Consulting, Ltd., 2014 36

© Inluceo Consulting, Ltd., 2014 37
Differentiated User Experience, Service Velocity, and Monetization
SP Platform Use Network and Data Assets
$ Content Aggregators
Broadcasters
Application Developers
Utilities
Advertisers
$$
$$
$$
$$
$ $$
$

review of is needed
© Inluceo Consulting, Ltd., 2014 38
59
53
47
45
64
47
59
75
81
average
Outsourcing capabilities
Capability to international
Capability to operate lean
Partnership development
Merger and acquisition
Deeper analytics for competitive insights
Deeper analytics for customer insights
Agility (capability to change)
CCaappaabbiilliittiieess aass mmuusstt hhaavvee ttoo ccoommppeettee iinn tthhee ffuuttuurreePercent of respondents
Source: McKinsey TMT, “Fast-forward: An inside view of the TMT sector’s future” Oct. 2012
Business agility is becoming a critical “must have”.
Business Architecture
Technology Architecture
Agile Service Provider

need to evolve their
© Inluceo Consulting, Ltd., 2014 39
Architectural Blueprint
= Standardized Interface
Consumer Business …WholesaleCustomer-centric Business Units
11
Service Supplier Orchestration E2EServiceManagement
22
ServiceSupplier…Access &
TransportMedia& Apps
ThirdParty
IPNetwork
33
44 44 44 44
Source: Cisco IBSG
Guiding Principles
11 Customer segment-centric, market-facing business units
22 Technology-agnostic , end-to-end service fulfillment and assurance
33 Self-contained, component-level service 'factories’ with standardized interfaces to orchestration layer
44 Modular operations governed by SLAs and with minimum inter-dependencies
Interdependent operational processes become modularized into a logical hierarchy that is easily managed and modified

© Inluceo Consulting, Ltd., 2014
Revenue
OOppeerraattiioonnaall CCoommppeettiittiivveenneessss:: OOPPEEXX RReedduuccttiioonn,, NNeettwwoorrkk SShhaarriinngg,,
CCoo--ooppeettiittiioonn
CCaattcchhiinngg tthhee NNeexxtt WWaavvee ooff CClloouudd
UUnnlloocckkiinngg TThhee VVaalluuee ooff SSMMBB
NNeettwwoorrkk VViirrttuuaalliizzaattiioonn &&
PPrrooggrraammmmaabbiilliittyy
IInntteerrnneett--ooff--TThhiinnggss
PPrrooffiittaabbiilliittyy aanndd GGrroowwtthh ooff DDiiggiittaall
MMeeddiiaa
PPeerrvvaassiivvee MMoobbiilliittyy
BBiigg DDaattaa aanndd AAnnaallyyttiiccss
SSPP SSeerrvviicceess EEvvoolluuttiioonn
40
The times are changing for services providers and they need to evolve their service portfolios and business and technology architectures…

© Inluceo Consulting, Ltd., 2014 41
““IIff yyoouu ddiisslliikkee cchhaannggee,, yyoouu wwiillll ddiisslliikkee iirrrreelleevvaannccee eevveenn mmoorree..””
General Eric Shineski
CChhaannggee is not optional.

PPaanneell DDiissccuussssiioonn Telecom and Internet Trends
© Inluceo Consulting, Ltd., 2014 42

PROCESS PLAN CREATIVE
COM
MUN
ICAT
E MOTIVATE INNOVATE CREATE
STRATEGY GO WORK
BRAIN
MEDIA
BOX OUT OF THE
WRI
TE
RESEARCH
SKET
CH
MEE
TIN
G
SUCC
ESS
!
! OK
THINK IDEA
SE
LL PO
SITI
VE
BRAINSTORM POWER
TEAM GOAL
MAR
KET
MOTIVATE
TARGET GROUP
TALK
W
ORD
S iinnlluucceeoo consulting
Thank You!
[email protected] © Inluceo Consulting, Ltd., 2014 43