ex-waseda.jpex-waseda.jp/documents/cource/早稲田大学OC冬2017... · Translate this pageex-waseda.jp

WIF-12-005:December 2012
Stock Ownership Structure and Corporate Social Performance:
Evidence from Japan
Megumi Suto
Hitoshi Takehara
早稲田大学ファイナンス総合研究所
http://www.waseda.jp/wnfs/labo/index.html

Stock Ownership Structure and Corporate Social Performance:
Evidence from Japan†
Megumi Suto
Hitoshi Takehara
This version: December, 2012
(Please do not quote without authors’ permission.)
Abstract
Japanese firms’ relationships with their stockholders have changed significantly since the
globalisation of stock ownership in the 2000s. This study represents a first attempt to investigate the
influences of different types of investor groups on corporate social performance (CSP) in Japan in
the late 2000s. This paper focuses on the role of foreign investors in affecting corporate social
performance relative to domestic investors. To accomplish this, we identify attributes of corporate
social responsibility (CSR) and construct a normalized CSP composite index and five dimensional
indices through principal component analysis. After controlling for firm characteristics,
cross-sectional regression analyses of ownership structure on the CSP indices reveal that an increase
in foreign shareholdings is positively associated with high levels of CSP. In contrast, a higher share
of domestic corporate investors shows a negative association with those same outcome measures.
Both foreign and domestic investors demonstrate strong preferences for large-scale and mature firms.
These empirical results suggest that foreign investors, who are increasingly concerned with the
social implications of investees’ activities in a globalised business environment, may play a key role
as a driver of CSR and consequently influence stakeholder management of Japanese firms.
†Corresponding author: Megumi Suto, Graduate School of Finance, Accounting and Law, Waseda
University, 1-4-1 Nihombashi, Chuo-ku, Tokyo, 103-0027, Japan.
E-mail address: [email protected]
1
1. Introduction
Corporate social responsibility (CSR) has been globally recognised as one of the core
concepts in corporate management since the 1980s, when international businesses underwent
economic and financial liberalisation. CSR relates to broad business activities and processes,
but expected gains from CSR are generally uncertain and ambiguous. Business organizations
suffer significant financial losses for engaging in CSR-related activities in the short term, even
if these activities are geared towards long-term societal goals. Strategic responses of business
organizations vary from firm to firm and industry to industry, so corporate social performance is
not a standardized concept but is instead multi-dimensional. Therefore, in this study, we apply
the stakeholder management approach to explore the CSR-related practices of Japanese firms in
the context of the globalised nature of business and ownership structures, focusing on the role of
investors as drivers of CSR.
The central purpose of this study is to investigate the relationship between corporate
ownership and corporate social performance (CSP) of Japanese business firms in the late 2000s,
when ownership structures of many Japanese firms changed significantly. Foreign investors
became major players in the Japanese stock market, while cross-shareholdings among business
corporations and financial intermediaries were gradually dissolved. In addition, some domestic
institutional investors began to voice dissent against their investees’ management personnel in
the prolonged worldwide economic downturn. These changing environmental characteristics led
Japanese firms to adjust their attitudes regarding shareholders and ownership, as well as their
relationships with other stakeholders.
This study is a first attempt to shed light on the influence of foreign investors on the CSP of
Japanese firms. Specifically, this study is the first to compare the effects of foreign investors on
CSP to those associated with domestic investors in the late 2000s. The remainder of this study is
as follows. First, we explicitly distinguish foreign investors’ preference bias for high-CSP firms
from their influence on the CSP of investee companies. Second, we explore the influence of
different types of investment structures on a comprehensive CSP index and five dimensional
indices of stakeholders’ perspectives, both of which we originally constructed on the basis of
questionnaire results of the CSR Database of Toyo Keizai, Incorporated.
Through these analyses, we found that an increase in foreign shareholdings was positively
associated with high scores on the CSR indices while an increase in domestic corporate
investors’ shareholdings demonstrated an opposite relationship. Our results suggest that foreign
investors, who are concerned with CSP as well as financial performance, played a key role as
drivers of CSR and influenced stakeholder management of Japanese firms in the late 2000s. The
results also imply that in addition to their traditional business-related activities, individual
investors may have played a complementary role in enhancing social relations and

2
environmental preservation on the part of the company. Changing ownership structures have
influenced the CSR-behaviours of Japanese firms, but domestic corporate investors appear to
continue under the restraint of relation-based investment.
The rest of the paper will proceed in the following manner: Section 2 will survey the
conceptual background and extant empirical studies related to ownership structure and investor
behaviour. Section 3 will present research objectives and introduce hypotheses to be examined.
Section 4 will explain data construction, estimation methods, and results. Finally, in Section 5,
we will discuss implications for development of CSR practices in Japanese firms from an
international perspective, and provide some avenues of future research in this area.
2. Ownership Structure and Investors’ Behaviour in Japan
2.1. Definition of CSR and Stakeholders
Although discussions regarding the definition of CSR have a long and varied history, they
have yet to produce a consensus conceptualisation. The concept of CSR has long been discussed
in the fields of business and societal studies (see Carroll 1979; Wood, 2000; Windsor 2006;
McWilliams, Siegel and Wright, 2006) and many empirical studies have been conducted on the
relationship between corporate social performance (CSP) and corporate financial performance
(CFP) since the 1970s (see Cochran and Wood, 1984; McGuire, Sundgren and Schneeweis,
1988; Waddock and Graves, 1997; McGuire and Siegel, 2000, 2001). Proposed definitions for
CSR have varied greatly, and have emphasized the narrow aspects of stakeholder management
to the broad aspects of social issue management.
Although the definition of CSR is still embryonic and ambiguous in both academic analyses
and business practices, ‘researchers are moving beyond just defining and identifying CSR
activities, to examine the strategic role of CSR in organizations’ (McWilliam et al., 2006, p. 2).
Many researchers have explored the financial implications of CSR and firms’ incentives for
engaging in socially responsible behaviour. To this end, some researchers have applied a
governance framework on CSR practices and analysed the relationship between CSR activities
and financial performance.
Empirical research on the association between CFP and CSP using a governance framework
provides businesses with practical insight regarding ‘how firms’ roles in society take shapein the
interaction with their stakeholders’ (de Graaf and Stoelhorst, 2009, p. 5). As a result of these
investigations, it has been found that ‘the comprehensiveness of CSP becomes problematic in
assessing the relationship between it and CFP, as some aspects of CSP might aid financial
performance whereas other aspects of CSP might hurt it’ (Cox and Schneider, 2010, p. 255).
Despite the confusing nature of the CFP-CSP relationship thus far, disaggregating the
dimensions of CSP in stakeholder relationship management may promote the development of

3
sustainable sources of competitive advantage (Hillman and Keim, 2001).
Various models for stakeholder behaviour have been proposed to explain the relationship
between CSP and CFP. Observations and theoretical discussion have shown that consumers
might be drivers of CSR, supporting pro-social corporate products and punishing corporations
that fail social responsibility (Smith, 2008). Schuler and Cording (2006), for example, examined
the moderating effects of information intensity and moral values on the relationship between
CSP and consumers’ purchase behaviours. Similarly, Deakin and Hobbs (2007) presented a
model of CSR that described it as a set of mechanisms for aligning corporate behaviour with the
interests of society by reducing externalities and promoting a sustainable corporate sector that
takes voluntary action geared towards more than simply enhancing competitiveness. The
financial tenets of this model are concerned with managerial incentives for aligning CSR
strategies in the financial market and promoting shareholder engagement on internal issues
related to employment and safety. Devoting corporate resources to the social benefit of
employees, customers, suppliers, and local communities can help to create shareholder value
(Brickley et al., 2003). Given this, long-term institutional investors, such as pension funds and
insurance companies, are expected to play a crucial role as key drivers of CSR.
2.2. Long-term Investors and CSP in Preceding Studies
Institutionalization of investment is a recent trend that has commonly been observed in
countries with developed economies. In the tradition of a seminal study by Cochran and Wood
(1984), many empirical studies on the relationship between institutional shareholding and CSP
have been conducted since the 1990s. The results of many of these studies suggest a positive
relationship between institutional shareholdings and CSP (see Waddock and Graves, 1997;
Johnson and Greening, 1999; Hillman and Keim, 2001).
Investment time horizon and aims differ between types of institutional investors. Social
investors generally have long-term perspectives, though the objectives pursued by their
investments are various. They include ‘value-based investors’ who act in accordance with
deeply held ethical views, ‘value-seeking investors’ who use social and environmental data to
enhance portfolio performance, ‘value-enhancing investors’ who use shareholder activism
techniques to enhance investment value by focusing primarily on corporate governance, and
investors targeting some other specific concern (Kurtz, 2008). The socially-responsible
investment (SRI) movement in the USA in the 1970s and 1980s was religiously, socially, and
politically value-based. In contrast, recent global institutional investors who are concerned with
CSP seem to be value-seeking or value-enhanced rather than value-based.
Long-term institutional investors’ decision making is subject to various pressures arising
from regulatory constraints and customer demands. For example, the 2000 revision of the
4
Pension Funds Act requires that controllers of pension funds in the UK disclose their policy for
socially responsible investment within their formal Statement of Investment Principles. Under
this regulation, SRI has spread among institutional investors in the UK, and CSR has
subsequently influenced pension investors’ decision making in the European region. On the
other hand, customers within an aging society have increased their demand for financial gain
from their pension funds and mutual funds. In this way, the association between CSP and CFP is
coming to the forefront of discussions related to long-term asset management in developed
countries.
Cox et al. (2004) investigated patterns of institutional shareholding and its relationship with
socially responsible behaviour in large British companies between 2001 and 2002. Their results
suggest that shareholding by long-term institutional investors or pension funds is positively
related to CSP. With the same data set, Cox et al. (2008) examined the relationship between
multidimensional CSP and pension ownership, and found that UK pension funds prefer
employee-focused aspects of CSP. Cox and Schneider (2010) compared preference for CSP of
‘US-–domiciled’ and ‘UK-domiciled’ pension plans in the UK stock market. They found that
the UK pension plans possess a positive relationship with workplace practices and environment,
while the US pension plans stress CFP. These results imply that a regulatory framework of
institutional investment is a critical determinant in promoting certain CSR activities.
Neubaum and Zahra (2006) examined the influence of shareholders’ activism and
coordination on executives’ support of CSP. Using data from Fortune 500 companies from 1995
to 2000, they found that socially-active investors had a positive influence on CSP. Their results
suggest that long-term shareholdings may foster relational exchanges between shareholders and
corporate executives related to the enhancement of CSP. Based on the organizational
architecture of corporations, the authors further imply that coordination among stakeholders
reduces conflicts with executives and may enhance corporate value.
2.3. Foreign Ownership and Domestic Investors in Japan
Conventionally, stock ownership in Japanese companies is characterized as either insider
holdings or cross-holdings among corporations based on relevant long-term business
relationships. This feature of ownership structure has changed since the Bubble Economy Burst
in the late 1980s. During a decline in cross-shareholding among Japanese firms, institutional
and foreign investors have emerged as major shareholders since the 1990s, when globalisation
of business and financial liberalisation advanced with worldwide growth of capital flow and
cross-border diversification of portfolio investments.
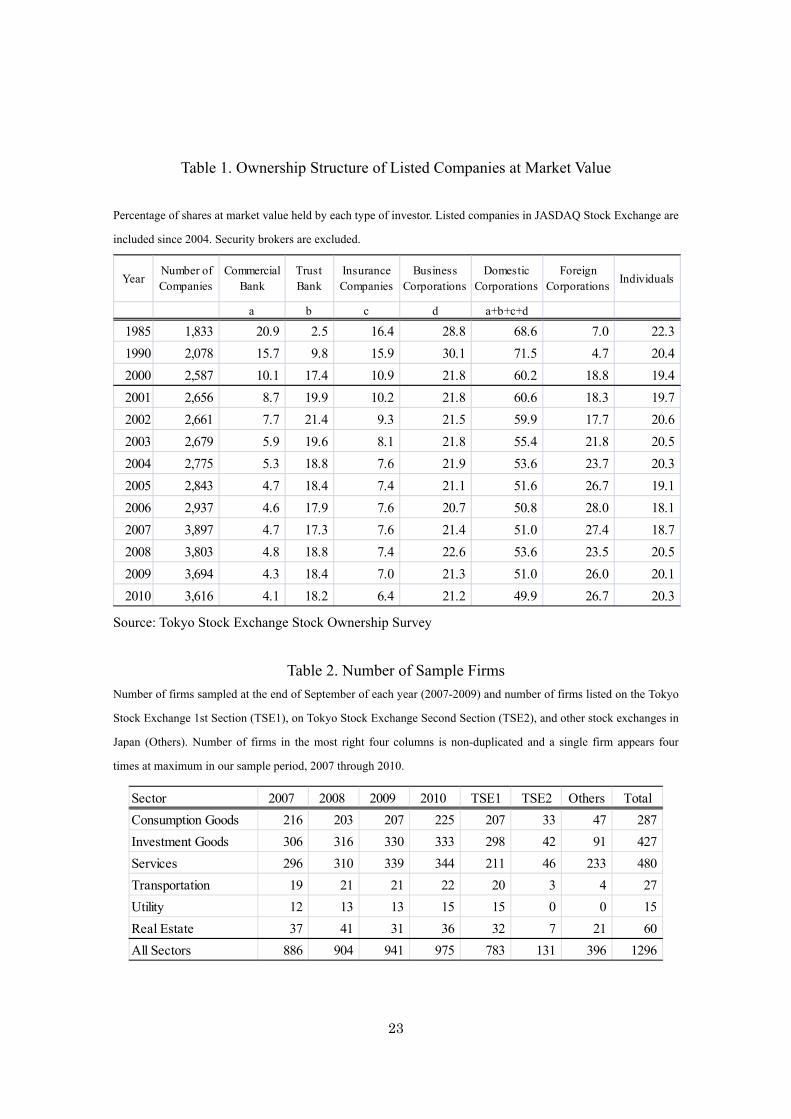
Table 1 shows stock ownership at market value from 1985 to 2010. Stockholding by foreign
investors was at 4.7% in 1990, rose to 18.8% in 2000, and peaked at 28% in 2006. Domestic
5
corporate shareholding fell from 60.2% to 49.9% during the period between 2000 and 2010.
Among shares owned by domestic corporations, shareholding by trust banks, comprised of
investment trust accounts and pension fund accounts, held around 18%. This degree of
ownership is considered as institutional holding. Shareholding by commercial banks, insurance
companies, and businesses, fell from 42.8% to 31.7%. Given this, investment by corporations
and financial institutions (with the exception of trust banks) may maintain a large part of
ownership of Japanese listed companies, even at the end of the 2000s. Many of them might be
realized as relation-based investment. Shareholding by individuals, which include various types
of direct holdings by individual investors, held steady at about 20% throughout the 2000s.
[Table 1 about here]
Since the early 2000s, corporate governance by institutional shareholders has been gradually
recognized among domestic, long-term institutional investors. In 2001, Pension Fund
Association (PFA) began disclosing their policy for shareholder voting and began to execute
voting rights on stocks of its in-house portfolio management. On the other hand, managers of
pension funds have faced increasing pressure from their customers to demand high performance
in a society that is rapidly aging.
Generally, institutional investors have behavioural biases as a result of pressures from their
customers or a regulatory authority. Their behaviour may also be influenced by an incentive
system of the organization to which they belong (Scharfstein and Stein, 1990; Sias, 2004;
Hansen and Hill, 1991). Suto and Toshino (2005) examined behavioural biases of fund
managers of Japanese institutional investors based on the 2003 survey data. Their results
indicated that fund managers demonstrated a short-term bias and participated in herding, and
self-marketing to improve appearance of portfolio performance under strong pressures from
their customers who demand high financial performance in the short-term. Their results also
suggested that in the relationship between sponsor companies of pension funds and fund
management companies or Keiretsu financial group, fund managers displayed weakness due to
pressures from customers.
Biases of long-term investors would seem to contradict their role as monitors for corporate
value. In other words, long-term investment biases could hurt the corporate governance
mechanism of shareholders. In this way, Japanese institutional investors have been sensitive to
(and biased towards) their customers’ expectations since the early 2000s1.
1 Suto, Menkhoff, L. and Beckmann (2005) compared the results of the same form of surveys in Japan, Germany, and the U.S. Their findings indicated that Japanese fund managers demonstrate more strongly biased behaviour than both German and U.S. fund managers in terms of short-time bias and herding.
6
2.4. Preference of Foreign Investors
Given the growth of cross-border portfolio investment, many researchers have become
interested in the behaviour of foreign investors and examined their preferences. According to
previous studies, foreign investors are more inclined to invest in large and esteemed firms
relative to those that are small or poorly governed. Additionally, they tend to have a
home-country bias in selecting investee companies due to information asymmetry relative to
local investors (Choe, Koh, and Stulz, 2005; Leuz et al., 2009).
American investors show a strong preference for disclosure and transparency, avoiding
insider systems, peculiar relationships, and weak stockholder protection (Kang and Stulz, 1997;
Kho, Starks and Warnock, 2006; Aggarwal, Klapper and Wysocki, 2005; Leuz et al., 2009).
Institutional investors generally prefer firms with low transaction costs or high liquidity in the
market (Gompers and Metric, 2001). Given this, foreign investors might prefer large-scale
companies with global significance and high credit ranking in the Japanese stock market.
I. In 2006, the Tokyo Stock Exchange began requiring listed companies to disclose their
Corporate Governance Report. In 2007, the Financial Instruments and Exchange Act was passed
and became effective in April 2008. According to this Act, a company that is required to submit
annual securities reports to the Ministry of Finance must also submit internal control reports. In
the corporate sector, this has led large and international companies to strengthen their investor
relations (IR) and most of have voluntarily issued CSR reports.
In spite of these activities and legislation, many have argued that the disclosure and
transparency of Japanese firms remain insufficient (OECD, 2010; ACGN 2008). Further, some
have argued that Japanese pension funds should be more concerned with disclosure related to
nonfinancial issues to improve long-term performance (OECD, 2010). Using data from
Japanese firms between 1991 and 2008, Miyajima and Nitta (2011) examined the relationship
and causality between shareholding and governance features. They found that the way in which
a board of directors is structured with respect to shareholders’ interest is a primary determinant
of foreign ownership. The results suggest that foreign investors pay a premium for firms with
more independent directors. Thus, foreign investors exhibited a home-country bias and
preferred strong corporate governance in investing in the Japanese stocks, but also influenced
the improvement of corporate performance of investee companies.
2.5. SRI Market in Japan
Traditional Japanese corporations are characterised by ethical self-discipline or CSR policy
that is passed down in the business over generations2. Some key concepts of CSR, including
2 The most well-known policy of long-established Japanese business is the coordination of interests of

7
product quality, social contributions, and community employment, are familiar to traditional
Japanese corporate management as integral for the company’s long-term survival.
Nevertheless, the SRI market in Japan is extremely small in comparison to the economy.
Based on a 2009 estimation, 90% of SRI is comprised of investment trust funds for individuals;
only 10% is due to long-term institutional investment. Investment funds for individuals have
been biased toward the environmental aspects of CSR3. In contrast, pension funds remain
sceptical about SRI in terms of both investment policy and performance. In a prolonged
financial downturn, pension funds’ primary concern is not social performance, but financial
performance. Governance problems related to the organization of pension funds, particularly
their ambiguity regarding the decision-making responsibilities of trustees and the advisory
committee have also been discussed. Hence, long-term institutional investors have been
reluctant to implement an investment strategy based on CSP4.
Given the above situation, foreign investors who have a global perspective of CSR may
have played a key role in pushing for the improvement of socially responsible practices related
to ESG (Environmental, Social, and Governance) to increase the corporate social performance
of Japanese corporations.
3. Research Objective and Hypotheses
3.1. CSP Attributes
Through a review of the extant research and arguments related to CSR attributes, we find a
consensus that different types of corporate social activities have different implications for
financial performance (Cox et al., 2009, p.29). In terms of risk management, cost-saving, and
employee motivation, there are many potential benefits for linking CSP and CFP. Thus, different
types of investors may be primarily concerned with different aspects of corporate activities.
Although indicators and attributes of CFP are relatively clear, the discussions related to the
linkage between CSP and CFP are characterized by disagreement and ambiguity of CSP
attributes.
three stakeholders: suppliers, buyers, and community or society; Sanpou-yoshi (business should be run for three-stakeholder-benefits) to establish trust based on societal relationships as well as in transactions guided by self-discipline. According to the 2010 report of TEIKOKU DATABANK Ltd, there are 22,219 companies that are over a hundred years old and 39 companies that are older than 500 years. The oldest company is Kongo-gumi, a construction company that specializes in building temples and shrines. It has operated as a private business since 578 A.D. 3 According to the estimation by SIF-Japan, market value of SRI peaked at approximately 850 billion Japanese Yen at the end of 2007, but fell to 579 billion JPY due to the shrinking of the market. In 2007, European SRI amounted to 2.7 trillion Euro and that of the U.S. amounted to $2.7 trillion. (Japan Social Investment Forum, Annual Report, 2009). 4 Based on a questionnaire survey for pension plans, only 6.9% of pension plans (32 plans out of 465 respondents to the survey) have already adopted SRI. (Study Report for SRI and PR by Research Policies on Pension and Aging (2008).)
8
A stakeholder-focused approach to corporate governance emphasizes that corporate
responsible activities can be linked to different stakeholder relations (e.g. employees,
communities, customers, suppliers, the environment) and firms are required to choose the
appropriate architecture of internal governance and adopt strategies in the existing regulatory
framework. Given these stakeholder relationships, we define the following five attributes of
corporate social performance: 1) employee relations, 2) social contributions, 3) security for
organization and product safety (i.e. quality of product), 4) internal governance and risk
management, and 5) environmental preservations.
The first attribute, employee relations, which includes working conditions within the
organization, can enhance employee quality and motivation (Turban and Greening, 1997).
Appropriate working hours and salary, minority employment, job stability, safe working
conditions, as well as enlightenment and the development of abilities are all related to the
employee relations variable.
The second attribute, social contributions, is related to a firm’s policy for and response to
social demands. Good relationships and coordination with the surrounding community in which
they operate can reduce costs associated with local conflicts, attract effective human resources,
and enhance reputation. On the other hand, negative relationships with the surrounding
community can narrow business perspectives and increase costs and risks associated with
business operation.
The third attribute, firm security and product safety, is related to the quality of a firm’s
products and the sustainability of its business. Therefore, it exists as a competitive advantage of
corporate management in the long-term. Security and safety is related to supply chain
management as well as the firm’s own activities, and ultimately affects a firm’s relationship
with its customers.
The fourth attribute, internal governance and risk management, is related to the quality of
disclosure, compliance, internal auditing and self-disciplining that a firm demonstrates. The fifth
attribute, environmental preservation, is a pillar of CSR in a society that is increasingly
concerned with global climate change. As such one may perceive that this is the most integral
responsibility of firms.
We define comprehensive or ‘Composite CSP’ as a composite index of the above five
attributes.
3.2. Hypotheses Development
In light of the above discussion, we propose hypotheses to examine the relationship between
the foreign ownership and CSP of Japanese listed firms in the late 2000s. Considering the
simultaneous determination of CSP and the structure of shareholdings, we attempt to distinguish

9
foreign investors’ preference for companies with high-CSP from their influence on improving
the CSP of the investee companies. Three groups of ownership are classified based on distance
from their investees: domestic corporate ownership, foreign corporate ownership, and individual
ownership.
Corporate ownership includes shareholdings of both business companies and financial
institutions. Thus, domestic corporate ownership is relationship-based shareholding, broadly
defined. On the other hand, foreign ownership is characterized by shareholding by those outside
a company’s country of operation. Foreign corporate investors may prefer established
companies due to information asymmetry. Corporate investors, both domestic and foreign, are
inclined to prefer large-scale and mature companies, though their respective reasoning for this
could differ. Individual ownership reflects the decision-making of various individual investors.
In this study, we focus on corporate investor groups. We explore domestic and foreign
investors’ preferences for and influences on CSP of listed companies in which they invest. We
propose the following hypotheses related to the association between investment structure and
CSP. Foreign investors might place a higher value on the individual CSP dimensions than
domestic investors. Domestic corporate investors might have stronger interest in
CSP-employment in a Japanese insider-system of corporate management relative to foreign
investors. The internal governance index might be less interesting to investors in the observed
period, as an internal control report was legally required for all listed corporations from 2008
and simply complied.
We examine the association of ownership structure with Composite CSP and CSR
dimensions, and the influences of changes in ownership on CSR achievement. Thus, our
hypotheses can be divided into three categories:
(1) Corporate ownership structure and Composite CSP
Hypothesis 1: There is a positive relationship between corporate ownership and Composite
CSP achievement because they prefer matured companies.
Hypothesis 2: The positive relationship between foreign ownership and Composite CSP is
more pronounced than the relationship between domestic corporate ownership and composite
CSP.
(2) Changes in foreign ownership and Composite CSP
Hypothesis 3: There is a positive relationship between growing foreign ownership and
Composite CSP because foreign investors pressure have influences on investee companies to
improve their CSP.
10
Hypothesis 4: The positive relationship between growing foreign ownership and CSP is more
pronounced than the relationship between growing domestic ownership and CSP.
(3) Changes in ownership structure and CSP Dimensions
Hypothesis 5: The relationships between the five CSP dimensions and three types of investors
differ because each type of investor has different preferences for firms’ CSP practices.
Hypothesis 6: The relationships between five CSP dimensions and changes in stock
ownership by three types of investors differ because each type of investor has different
influences on firms’ CSP practices.
4. Data Construction Method and Estimation
4.1. Construction of CSP Indices
We constructed the CSP indices using the Corporate Social Responsibility Database, which
was provided by Toyo Keizai Inc. as a primary data source. The original database consists of
three parts: employee relations (Part I), an overall survey for CSR (Part II), and environmental
preservation (Part III). We further subdivided Part II into three CSP attributes. They were ‘social
contributions’, ‘security of the firm and product safety’, and ‘internal governance and risk
management’.
First, we carefully selected 17 questions items about employee relations, 21 questions about
CSR in general, and 18 questions about environmental preservation5. Then, based on the
responses to the questions we selected, we kept 13 scores regarding (1) employee relations
(EMP), 5 scores regarding (2) social contributions (SC), 5 scores regarding (3) security of the
firm and product safeness (SS), 6 scores regarding (4) internal governance and risk management
(IG), and 5 scores regarding (5) environmental preservation (ENV)6. Third, for each of these
five CSP attributes (ENV, SC, SS, IG, and ENV), we constructed CSP dimensional indices by
conducting a principal component analysis. Items and their related factor weights are shown in
Table A2. Each CSP dimensional index is demeaned and scaled by its standard deviation so that
it approximately obeyed a standard normal distribution.
5 With respect to environmental preservation, we excluded items which require quantities such as costs and emissions because there can be large dispersion about the accuracy of figures among industries. Further, there was a significant amount missing data for such questions. 6 In each year, we first converted quantitative data such as proportion of female employees to three or four level categorical data. Second, we made within sector adjustments since some questions had very different meanings among sectors. The seven sectors used in this study shown in Table A1 are identical to those defined in Kubota and Takehara (2007) that set store on the distance between firms and final consumers.
11
The comprehensive CSP index was computed based on the above constructed five
dimensional indices. Let r( ) denote the function that gives a rank of the element of vector in
ascending order and n denote the number of firms in each year. Given this, the comprehensive
measure of CSP in each year is defined as follows:
361
1))()()()()((
n
ENVrIGrSSrSCrEMPrrCSP (1)
It is convenient for researchers if the scale of the comprehensive CSP measure is comparable to
those of the CSP dimensional indices. Since our CSP dimensional indices approximately obey a
standard normal distribution, equation (1) is adjusted such that the comprehensive measure of
CSP is uniformly distributed and falls in the closed interval [-3, 3].
4.2. Descriptive Statistics of CSP and Firm Characteristics
We constructed the CSP Dimensional Index Database using information from 2007 to 2010,
which included all the listed firms in Japan which responded to the questionnaire survey
administered by Toyo Keizai Inc. Toyo Keizai Inc. sent a questionnaire to the firms in the
beginning of July and the firms responded by the end of September. In this study, we use the
most recent financial statement data and market-attributed data that were available at the end of
September. The primary source for financial statement data was the NIKKEI NEEDS Database.
The primary source for market attributed data, including market value of equity and stock return,
was the NIKKEI Portfolio Master Database.
Before examining the hypotheses described in the previous section, it was imperative to
compute the proportion of shares owned by domestic corporations, foreign corporations, and
individuals, respectively. Japanese firms are required to disclose the brief summary of their
stock ownership structure in their financial reports. This summary includes the number of shares
owned by foreign corporations and the number of shares owned by individuals. For this study,
the number of shares owned by domestic corporations was defined as the sum of shares owned
by financial institutions and the number of shares owned by other corporations. We explicitly
excluded shares owned by financial products dealers, governments, and public organizations in
our calculation of shares owned by domestic corporations.
To investigate the behaviour of stakeholders associated with CSP, it was necessary to
evaluate the firms’ characteristics in addition to the stock ownership structure. We used the
following eight variables in this study. First, as is pointed out in many previous studies, a firm’s
CSP is positively correlated to its size. As such, we use natural logarithm of total asset value (in
million JPY), lnTA, as a measure of size. Since the relationship between CSP and firm size is
not linear, we also constructed three size dummy variables, Size1, Size2, and Size3 for use in
the regression analysis whose results will be reported later. Other characteristic variables were
12
proxies for profitability, credit risk, and growth of the firm. These variables were Return on
Asset (ROA), Debt Ratio (DR), and Growth rate in Total Asset (GTA), respectively. As a
measure of liquidity and financial variability of the firm, we used monthly turnover rate (Turn)
and past the volatility of the past three years’ monthly stock returns (Vol3Y), respectively.
Book-to-Price Ratio (BPR) was a variable used to control the difference in firm’s style (i.e.
value and growth.) A lower book-to price ratio implies that investors expect managers to create
value thorough the operation of the firm. Finally, we introduced a Foreign Dependency Ratio
(FDR) variable, which was defined as sales in foreign countries divided by total sales.
Table 2 lists the number of firms in each sector by year. The number of firms ranged from
894 in 2007 to 975 in 2010. About 60 percent of the firms are listed on the Tokyo Stock
Exchange (TSE) first section, however, about 10 percent of the firms are listed in the TSE
second section and about 30 percent of the firms are listed exchanges other than the TSE. Firms
in the services industry represented 37 percent of the sample firms, but only half of them are
listed in the TSE.
[Table 2 about here]
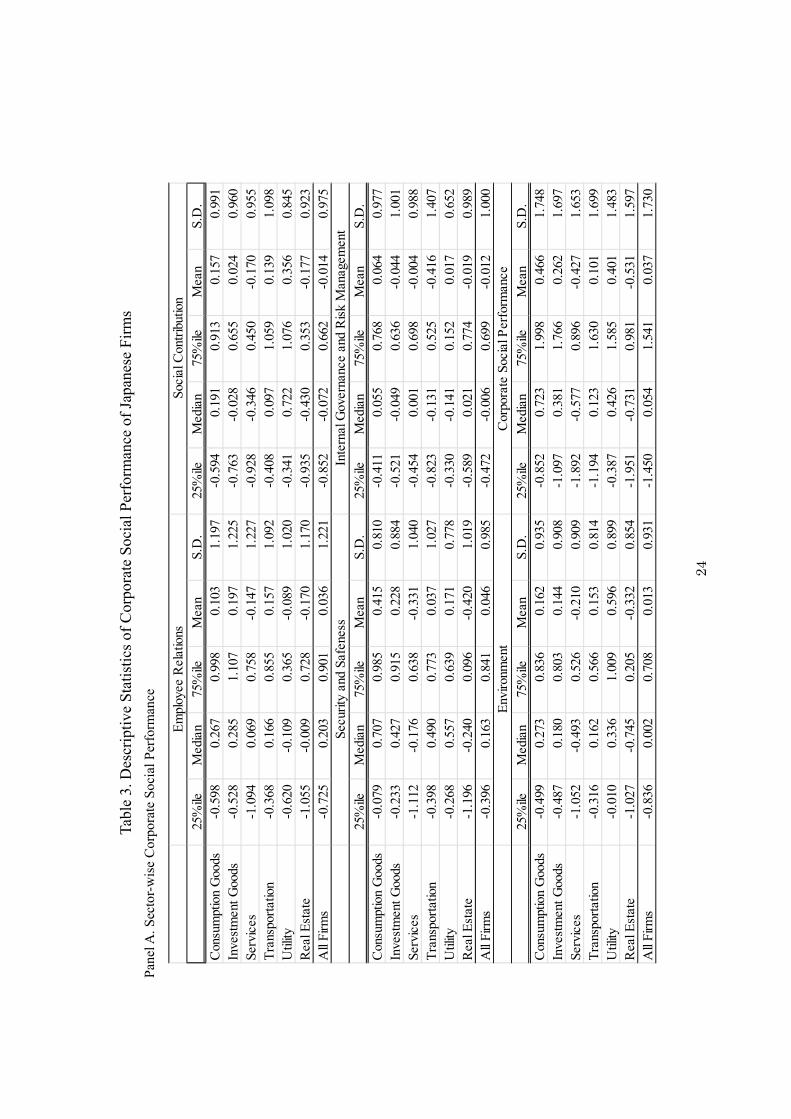
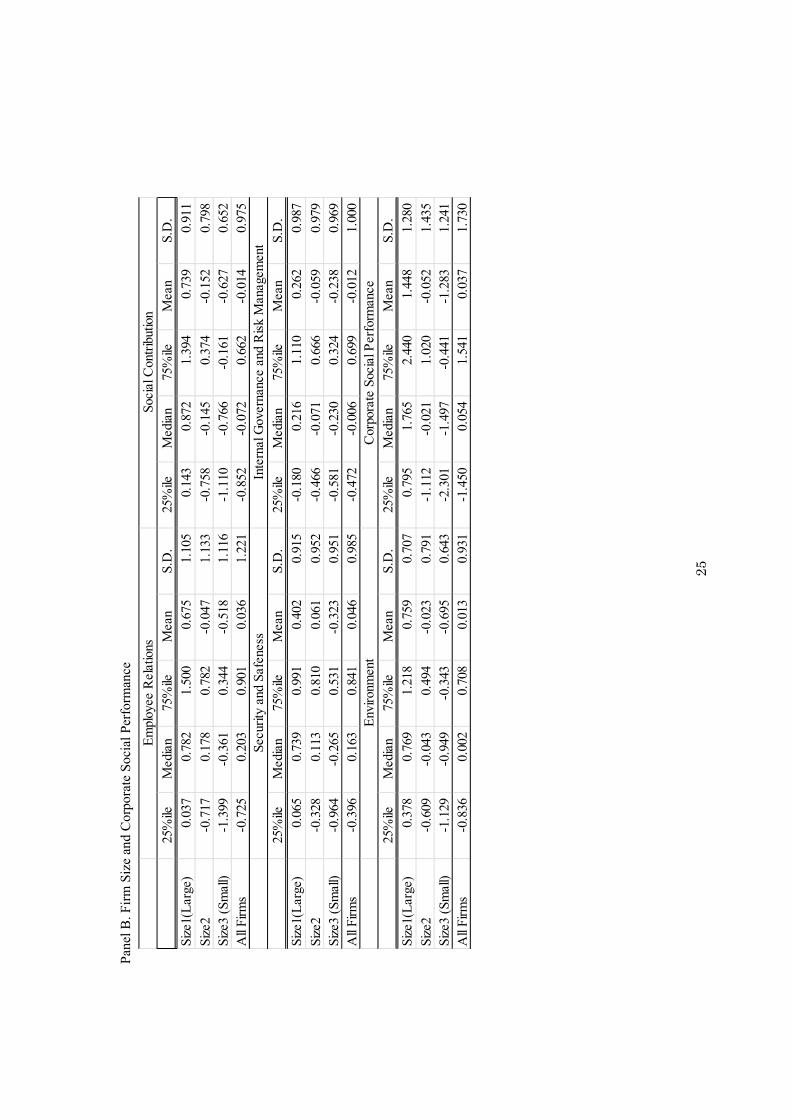
For September of each year, we constructed sector portfolios or size-ranked equal-weighted
portfolios. Table 3 reports the descriptive statistics of CSP by sector (Panel A) and by firm size
(Panel B). The median and mean scores for CSP (the comprehensive measure of CSP) is highest
in the consumption goods sector. Medians of EMP, SS, and IG are highest in the investment
goods sector. Contrarily, median values of SC and ENV are highest in the utility sector. Panel B
shows the pronounced positive relationship between the firm size (as measured by total assets)
and firm CSP.
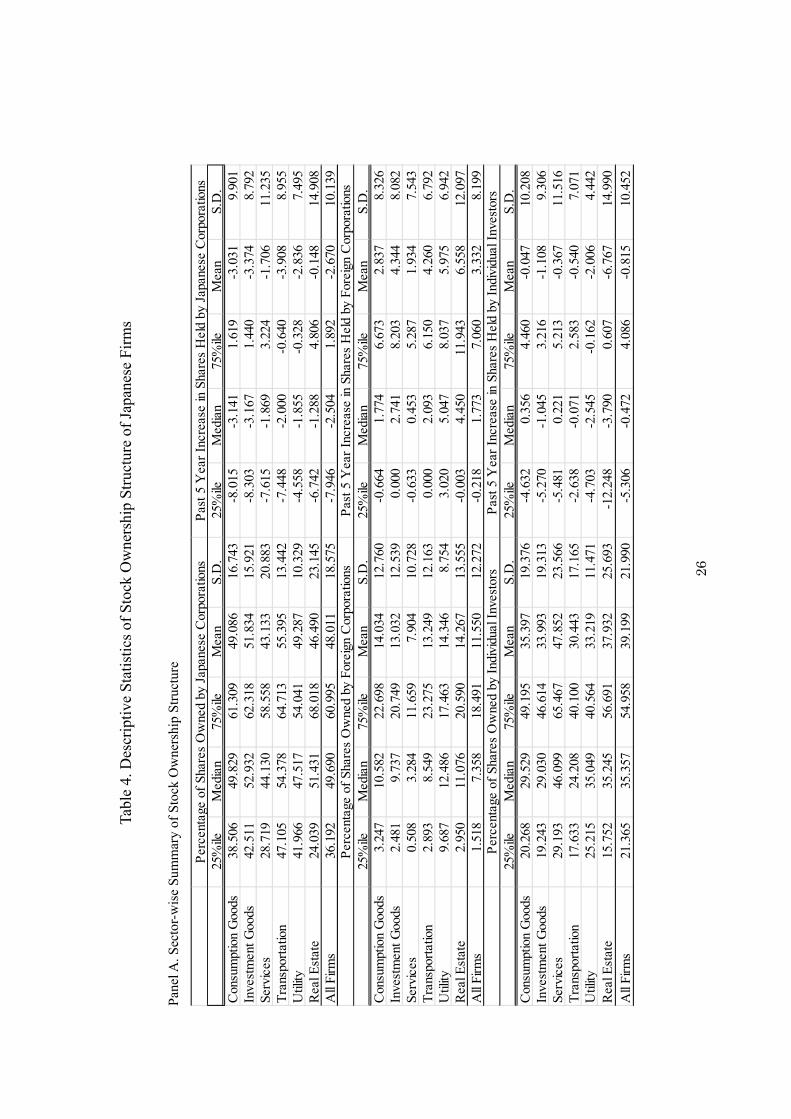
Descriptive statistics related to the stock ownership structure of sample firms are shown in
Table 4. There is little difference in shares owned by domestic corporations across the sectors or
firms size. In sharp contrast, there exists a large difference in the number of shares owned by
foreign corporations. Foreign corporations tend to own large- and medium-sized stocks and do
not invest a great deal in firms in service sectors whose CSPs are relatively low.
[Table 3 about here]
[Table 4 about here]
4.3. Correlation between the Variable and Regression Model
Panel A of Table 5 shows the correlations between CSP and ownership structure, and Panel
13
B shows the correlations between CSP and eight firm characteristic variables. In both panels,
Spearman rank correlations and their corresponding probability values are reported. The results
shown in this table can assist in verifying the research hypotheses we have proposed.
In panel A, the correlation between comprehensive CSP and percentage of shares owned by
Japanese corporations is 0.269 and the correlation between comprehensive CSP and percentage
of shares owned by foreign corporations is 0.533. Both correlations are positive and significant
at the 1% level. This finding supports Hypothesis 1. Since the correlation is much higher for the
relationship between foreign corporate ownership and CSP, these findings also provide evidence
for supporting Hypothesis 2. The correlation between comprehensive CSP and the five-year
increase in shares owned by foreign corporations is 0.217 and significant at the 1% level. This
supports Hypothesis 3. Contrary to the positive correlation between CSP and the increase in
percentage of shares owned by foreign corporations, the correlation between CSP and the
increase in percentage of shares owned by Japanese corporations is negative at -0.155. This
observation does not contradict Hypothesis 4. Finally, there exists significant variation in the
magnitudes of the correlation between CSP dimensional indices and ownership structure
variables; this observation supports Hypotheses 5 and 6. Overall, these findings provide no
evidence against Hypotheses 1 to 6 in Panel A of Table 5.
Panel B confirms the relationship between firms’ characteristics and the CSP indices. The
correlations between the comprehensive CSP measure and the characteristics variables were
statistically significant at 1% level in most cases. The exceptions were the respective
relationships between CSP and debt ratio (DR), and growth rate of assets (GTA). As already
confirmed in Table 3, there exist strong, positive relationships between the CSP indices and firm
size (lnTA). Furthermore, the CSP indices were higher in firms that are more liquid and less
variable.
[Table 5 about here]
The high correlations between the CSP indices and characteristics variables raise suspicion
regarding the findings in Panel A. To verify the findings reported above, we a conducted
regression analysis by treating the characteristic variables as covariates. To verify the robustness
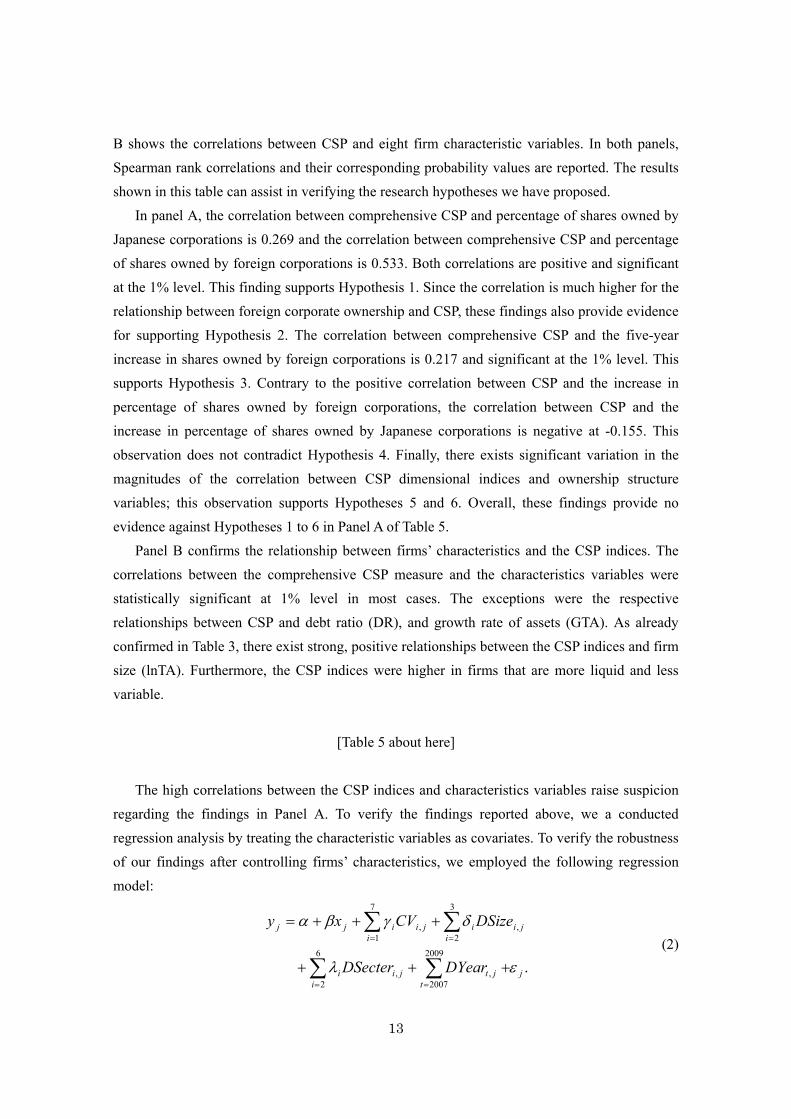
of our findings after controlling firms’ characteristics, we employed the following regression
model:
. 6
2
2009
2007,,
3
2,
7
1,
ji t
jtjii
ijii
ijiijj
DYearDSecter
DSizeCVxy
(2)

14
In model (2), yi is a comprehensive measure of CSP or one of five CSP dimensional indices.
Independent variable xj indicates the percentage of shares owned by Japanese corporations, the
percentage of shares owned by foreign corporations, the percentage of shares owned by
individuals, the percentage increase in in share ownership by Japanese corporations, the
percentage increase in share ownership by foreign corporations, or the percentage increase in
share ownership by individuals. CVi,j is the set of control variables consisting of ROA, DR, GTA,
Turn, Vol3Y, BPR, and FDR. DSizei,j is a size dummy-coded variable which is equal to 1 if the
sample j belongs to the i-th size ranked portfolio and equal to 0 otherwise. DSectori,j is a sector
dummy variable if the sample j belongs to the i-th sector and 0 otherwise. Finally, the DYear
variables are the dummy variables for each year t=2007,…, 2009.
Before conducting the regression analysis, we excluded the upper and lower 2.5%
samples as outliers7. As a result, the number of firms we used in the following regression
analysis was 3,536.
4.4. Estimation Results
Table 6 reports the regression results for different types of ownership for all sample firms on
both the Composite CSP and five attribute indices with a set of control variables. With respect to
the association among different types of ownership in companies and Composite CSR, the
results support Hypothesis 1; corporate ownership, both domestic and foreign, demonstrated a
positive relationship with comprehensive corporate social performance (p < 0.05), while
individual ownership demonstrated a significantly negative relationship. The estimated
coefficient for CSP of foreign ownership is larger than that of domestic corporate ownership, so
Hypothesis 2 is likewise supported. These results indicate that corporate investors seem to
prefer large-scale and matured companies which have had relatively high levels of success and
reputation in the society in which they operate.
[Table 6 about here]
Table 7 indicates similar regression results related to the influence of changes in ownership
on Composite CSP and five attribute indices. It shows that growing foreign ownership has a
positive influence on Composite CSP, thus supporting Hypothesis 3. Further, it is interesting
that growing domestic ownership demonstrated a negative relationship with Composite CSP,
though this relationship did not achieve statistical significance. These results can be interpreted
such that domestic corporate investors are, as a whole, not terribly concerned with the social
7 Although the number of independent variables in model (2) equals 15, variance inflation factors are less than 2 for all variables, and multicollinearlity may not exist in model (2).

15
aspects of corporate performance relative to foreign investors, who have seemed to contribute to
the improvement of CSR practices of investee companies. According to the results, Hypothesis
4 is also supported.
[Table 7 about here]
With regard to firm characteristics, Composite CSP showed negative associations with debt
ratio, growth rate, stock volatility and BPR. However, ROA and Turn have no significant
relationship as a whole as reported in Table 6. High CSP companies are generally shown to be
less dependent on debts, and are rather matured with lower growth, less risk, and therefore
relatively low market prices. Also shown in Table 7, debt ratio and growth rate do not have a
significantly positive relationship with the CSR indices. On the contrary, FDR is significantly
positive, and volatility (Vol3Y) is significantly negative in all cases. These results suggest that
firms exposed to international competition are more sensitive to corporate social performance
and stocks of higher CSP companies experience less volatility in the market.
Concerning the results on dimensional CSP in Table 6, all indices showed a significant
positive relationship with corporate ownership as well, but the coefficients for foreign
ownership were much higher. In contrast, individual ownership had a significantly negative
association with all dimensions.
Further, Table 7, reports some interesting observations related to changes in ownership
structure for the past five years. First, with EMP, an increase in foreign ownership is shown to
have a significant positive relationship with CSP, while an increase in domestic ownership is not.
This suggests that foreign investors are concerned with good employment policies and may
contribute to improving the employment circumstances of their investees.
Second, for SC and ENV, regression coefficients associated with an increase in domestic
corporate ownership were negative and significant, but that of an increase in foreign ownership
is positive but non-significant. These results imply that domestic corporate investors seem to be
insensitive to social contributions and environmental strategies.
Third, Panel C of Table 7 shows that an increase in individual investors’ shareholdings is
positively correlated with both SC and ENV, though it is negatively correlated with EMP. These
results suggest that individual investors are concerned with social contributions and
environmental strategies of those firms in which they invest. As such, they might emphasize
these dimensions of CSR more than employment policy.
Fourth, for IG and SS, regression coefficients of ⊿ ⊿changes in shareholdings ( JPN, FOR
⊿and IND) were not statistically significant in Table 7, despite the fact that percentage of
shareholding is positively correlated with IG and SS in Panel A of Table 7. One possible
16
interpretation is that all investor groups treat these variables as equally important.
In sum, Hypothesis 5 and Hypothesis 6 were partially supported. From these results, which
are shown in Tables 6 and 7, we infer that firms who perform well with respect to CSP tend to
be large and matured, which are qualities that are generally preferred by corporate investors.
However, foreign investors may have some influence on improving the CSR practices of firms
in which they invest, while domestic investors seem to be unconcerned with improvement of
CSR practices. These results suggest that individual investors may play drive CSR with respect
to societal goods and environment protection.
4.5. Reverse Causality
The regression results showed that all indices of corporate social performance are positively
associated with both domestic and foreign institutional ownership. In addition, increases in
foreign institutional shareholdings are positively related with the Composite CSP and EMP.
However, in regression model (2), we implicitly assumed that the stock ownership structure
(and/or changes in the stock ownership structure) affects a firm’s social performance. This
assumption raises the question of causality with regard to the relationship between corporate
social performance and stock ownership structure. Does stock ownership structure dictate CSP
or are certain types of stockholders drawn to firms that already demonstrate a given level of
CSP? To address this critical issue, we interchanged the main independent variable and
dependent variable in model (2) and examined how the corporate social performance of the firm
affects the stock ownership structure. Consequently, in the following regression analysis we
used CSP or its dimensional indices (EMP, SC, SS, IG and ENV) as main independent variable
xj in (2)8.
[Table 8 about here]
The regression results are summarized in Table 8. With respect to the relationship between
Composite CSP and shareholding by each group of investors in Panel A, estimated coefficients
were consistent with the results from regression model (2). As a result, there exists the
possibility of reverse causality between Composite CSP and stock ownership structure.
However, results were more illuminating with respect to changes in ownership and CSP. In
8 One may suggest that we should employ the instrument variable approach including two-stage least square regression to control the endogeneity between the corporate social performance and stock ownership structure. Although we conducted two-stage least squared regressions, we do not report their results because none of several candidates of instrument variables have passed the Sargan’s over-identification test. Furthermore, it is possible that more complicated endogeneity among the independent variables in model (2) may be uncontrollable even if we impose instrument variable approach.

17
Panel A of Table 8, Composite CSP is negatively associated with an increase in domestic
corporate ownership (⊿JPN, p<.1).). On the other hand, CSP is positively associated with an
increase ⊿in individual investor ownership ( IND; p<.1).. An increase in foreign corporate
ownership ⊿( FOR) was not significantly associated with CSP. These results suggest that current
CSP practices can yield a decrease in domestic corporation shareholding and an increase in
individual investors’ shareholding. Similar results are observed for SC and ENV. This suggests
that high expected CSP may serve as an incentive for individual investors, but not to domestic
corporate investors. Foreigners seem to be indifferent to the expected level of CSP.
This regression also provided insight with respect to foreign corporate ownership and CFP.
Positive relationships between ROA and Turn and CFP were observed in every case. Though
expected CSP was not significantly related to an increase in share of foreign investors, expected
corporate financial performance (in terms of profit and liquidity) might increase foreign share
ownership. In contrast, there were no positive relationships observed between expected CFP and
the proportion of shares held by domestic corporate investors or its change.
Our results imply that foreign corporate investors are not only concerned with expected CFP,
but also serve to improve CSP practices. On the other hand, domestic corporate investors seem
to be concerned with neither expected CFP nor CSP improvement. This is consistent with
conventional interpretations of cross-shareholding of Japanese corporations and
relationship-based investment.
4.6. Industry-wise Regression Results
The association between CSP and changes in ownership could vary from industry to industry.
To explore this phenomenon, we carried out industry-wide tests on three major industry groups
in our sample: consumption goods, investment goods, and services. Firms in the consumption
goods sector may be more sensitive to product safety and social contributions because they deal
directly with consumers’ preferences and social demands, while those in the investment goods
sector may be more concerned about environmental issues because they have a greater influence
on global circumstances relative to other sectors. Firms in the services industry, including retail
and wholesale, may demonstrate a proclivity for security and safeness. To test these possibilities,
we focus on the influence of changes in ownership structure for each industry.
[Table 9 about here]
Table 9 shows the relationship between the CSR indices and changes in ownership by
industry. Only for the service sector was an increase in foreign ownership shown to significantly
positive relationship on CSR. The influence of changes in ownership on the CSP dimensional
18
indices vary from industry to industry. In the consumption goods sector, an increase in foreign
ownership was positively associated with all dimensions of CSP but only its relationship with
EMP was significant. Contrary to our assertion, the increase in individual ownership
demonstrated no relationship with all indices in the consumption goods sector.
For the investment goods industry, ENV showed a significant negative association with
increases in both domestic and foreign corporate ownership, though it had a significant positive
association with increase in individual ownership. This suggests that environmental preservation
may be costly for the industry in the observed period, as social pressure to employ
environmentally friendly strategies increases. Similar results are observed for SC.
For the service sector, an increase in domestic corporate ownership had a significant
negative relationship with ENV. However, an increase in foreign ownership demonstrated a
significant positive relationship with both the Composite CSP and ENV. These results suggest
that foreign investors have remarkable influence on CSR practices in this sector.
In sum, domestic corporate investors tend to behave negatively or indifferently toward CSP
practices in all three sectors. In contrast, foreign investors’ clear attention to CSP practices can
contribute to the improvement of EMP and ENV in the consumption goods and services sectors.
Results further indicate that individual investors may promote environmentally friendly
practices in the investment goods sector, in which even foreign investors seem hesitant to
pursue.
5. Summary and Implications
This is the first study to investigate the influence of stock ownership structure on the
corporate social performance of Japanese business firms in the late 2000s. In particular, this
study has highlighted the role of foreign investors in promoting CSP relative to domestic
corporate investors or individual investors. Features of our empirical analysis are twofold. First,
we constructed normalized CSP attribute indices and a composite index with a wide range of
questionnaire survey data. Second, we explicitly distinguished foreign investors’ preference bias
for high CSP firms from their influence on CSP of investee companies in the Japanese market.
The use of cross-sectional regressions of ownership structure and its changes on CSP indices
while controlling for firm characteristics allowed for additional insights. First, foreign corporate
ownership showed a more positive relationship with comprehensive social performance than
that of domestic ownership. Both foreign and domestic corporate shareholders tend to prefer
large-scale and mature firms, which are relatively concerned with CSR. However, this
relationship is more pronounced for foreign investors.
Second, the increase in foreign shareholdings is positively associated with high CSP indices
while the increase in domestic corporate investors’ shareholdings shows an opposite relationship.
19
Domestic corporate investors are less conscious of improving the CSP practices than their
foreign counterparts. It also may be that they are still influenced by relational investment.
Third, foreign corporate investors are not only concerned with expected CFP of investees,
but also influence CSP practices as shareholders. In contrast, domestic corporate investors do
not show much concern for CFP and CSP of their investees. These results imply that foreign
investors, who are concerned about the social aspects of investees’ activities in a highly
connected world, might play a key role as a driver of CSR and influenced stakeholder
management of Japanese firms.
Lastly, the individual investors might also drive CSR in the form of socially friendly goods
and environmental protection. It is also suggested that high expected CSP may serva sa an
incentive for individual investors.
Despite the findings of this study, there were some limitations associated with it. First, our
categorization scheme for investors (i.e. foreign corporate investors, domestic corporate
investors, and individuals) did not distinguish long-term institutional investors from others. This
shortcoming is due to ownership data we used. However, it would be interesting to break down
domestic ownership to investigate the heterogeneity of corporate governance and stakeholder
management of Japanese firms. In future studies, we could exploit extant ownership structure
data more in detail to accomplish this. Second, it is necessary to develop technical devices for
use in the regression model to solve endogeneity between CSP indices and stock ownership
structure. This represents our next stage in this avenue of research.
References:
ACGA, 2008. White Paper on Corporate Governance in Japan.
http://www.acga-asia.org/public/files/Japan%20WP%20May2008.pdf.
Aggarwal, R., Klapper, L. and Wysocki, P., 2005. Portfolio preference of foreign institutional
investors. Journal of Banking and Finance, 29(12). 2919-2946.
Brickley, J.A., Smith, C.W., and Zimmerman, J. L. 2003. Corporate governance, ethics, and
organizational architecture. Journal of Applied Corporate Finance, 15(3). 34-45.
Carroll, A. B., 1979. A three dimensional conceptual model of corporate performance. Academy
of Management Review, 4 (4). 497-505.
Choe, H., Koh, B. C., and Stulz, R. M., 2005. Do domestic investors have an edge? The trading
experience of foreign investors in Korea. The review of Financial Studies. 18(3). 795-829.
Cochran, P. and Wood, R., 1984. Corporate social responsibility and financial Performance.
Academy of Management Journal, 27(1). 42-56.
Cox, P., Brammer, S., and Millington, A., 2004. An empirical examination of institutional
investor preferences for corporate social performance. Journal of Business Ethics, 52(1). 27-43.
Cox, P., Brammer, S. and Millington A., 2008. Pension funds and corporate social performance:
An empirical analysis. Business and Society, 47(2). 213-241.
Cox, P., and Schneider, M., 2010. Is corporate social performance a criterion in the overseas
investment strategy of U.S. pension plans? An empirical examination. Business and Society,
49(2). 252-289.
Deakin, S. and Hobbs, R., 2007. False dawn for? Shifts in regulatory policy and the response of
the corporate and financial sectors in Britain. Corporate Governance: An International Review.
15(1). 68-75.
De Graaf, F. J. and Stoelhorst, J. W., 2009. The role of governance in corporate social
responsibility; Lessons from Dutch finance. Business and Society, (Forthcoming).
Grave, S. B. and Waddock, S.A., 1994. Institutional ownership and corporate social
performance. Academy of Management Journal. 37.1034-1046.
Gompers, P.A. and Metrick, A., 2001. Institutional investors and equity prices. The Quarterly
Journal of Economics. 116(1). 229-259.
Hansen, G. S. and Hill, C. W., 1991. Are institutional investors myopic? A time series study of
four technology driven industries. Strategic Management Journal, 12(1). 1-16.
Hillman A. J. and Keim, G. D., 2001. Shareholder value, stakeholder management and social
issues: What’s the bottom line?. Strategic Management Journal, 22(2). 125-139.
Johnson, R. A. and Greening, D. W., 1999. The effect of corporate governance and institutional
ownership types on corporate social performance. Academy of Management Journal, 42(5).
564-576.
21
Kang, J. K. and Stulz, R. M., 1997. Why is there a home bias? An analysis of foreign portfolio
equity ownership in Japan. Journal of Financial Economics, 46(1). 3-28.
Kubota, K. and Takehara, H. 2007. Effects of tax rate changes on the cost of capital: Case of
Japanese firms. Finanz Archiv/Public Finance Analysis, 63(2). 163-185.
Kurtz, L. 2008. Socially responsible investment and shareholder activism. The Oxford
Handbook of Corporate Social responsibility, A. Crane, A. McWilliams, D. Matten , J. Moon
and D.S. Stiegel (eds.), Oxford Handbooks, 249-280.
Kho, B. C., Stulz, R. M. and Warnock, F. E., 2006. Financial globalization, governance, and the
evolution of the home bias”, NBER Working Paper Series, 12389.
Leuz, C., Lins, K. V. and Warnock, F. E., 2009. Do foreigners invest in poorly governed firms?.
The Review of Financial Studies, 23(3). 3245-3285.
McGuire, J. B., Sundgren, A. and Schneeweis, T., 1988. Corporate social responsibility and firm
financial performance. Academy of management Journal, 31(4 ). 854-872.
McWilliams, A. and Siegel, D. S., 2000. Corporate social responsibility and financial
performance: Correlation or misspecification?. Strategic Management Journal, 2(5). 603-609.
McWilliams, A., and Siegel, D. S., 2001. Corporate social responsibility: A theory of the firm
perspective. Academy of Management Review, 26(1). 117-127.
McWilliams, A., Siegel, D. S. and Wright, P. M., 2006. Corporate social responsibility: Strategic
implication. Journal of Management Studies, 43(1). 1-18.
Miyajima, H. and Nitta, K., 2011. Diversification of shareholding structure and the results:
Dissolution and revive of cross-shareholdings and role of foreign investors” RIETI Discussion
Paper Series 11-J-011 (in Japanese).
Neubaum, D. O. and Zahra, S. A., 2006. Institutional ownership and corporate social
performance: The moderating effects of investment horizon, activism, and coordination. Journal
of Management, 32(1). 108-131.
Stewart, F. and Yermo J., 2010. Options to improve the governance and investment of Japan’s
government pension investment fund. OECD Working Papers on Finance, Insurance and
Private Pensions.
Scharfstein, D. S. and Stein, J. C., 1990. Herd behavior and investment. American Economic
Review, 80(3). 465-479.
Schuler, D. A. and Cording, M., 2006. A corporate social performance-corporate financial
performance behavioral model for consumers. Academy of Management Review, 31(3).
540-558.
Sias, R. W., 2004. Institutional herding. Review of Financial Studies, 17(1). 165-206.
Smith, N.C., 2008. Consumers as drivers of corporate social responsibility. A. Crane, A.
McWilliams, D. Matten , J. Moon and D.S. Stiegel (eds.), The Oxford Handbook of Corporate
22
Social responsibility, 281-302.
Suto, M. and Toshino, M., 2005. Behavioral biases of Japanese institutional investors: Fund
management and corporate governance. Corporate Governance: An International Review, 13(4).
466-477.
Suto, M., Menkhoff, L. and Beckmann, D., 2005. Behavioral biases of institutional
investors: Japan and Germany vs. the US”, Waseda University, Finance Research
Center, Working Paper Series, WNIF-05-006.
Turban, D.B. and Greening, D. W., 1997. Corporate social performance and organizational
attractiveness to prospective employers. Academy of Management Journal, 40(3) 658-672.
Waddock, S. A. and Graves, S. B., 1997. The corporate social performance - financial
performance link. Strategic Management Journal, 18(4). 303-319.
Windsor, D., 2006. Corporate social responsibility: Three key approaches. Journal of
Management Studies, 43(1). 93-114.
Wood, D. J., 2000. Theory and integrity in business and society. Business & Society, 39(4).
359-378.
23
Table 1. Ownership Structure of Listed Companies at Market Value
Percentage of shares at market value held by each type of investor. Listed companies in JASDAQ Stock Exchange are
included since 2004. Security brokers are excluded.
YearNumber ofCompanies
CommercialBank
TrustBank
InsuranceCompanies
BusinessCorporations
DomesticCorporations
ForeignCorporations
Individuals
a b c d a+b+c+d
1985 1,833 20.9 2.5 16.4 28.8 68.6 7.0 22.3
1990 2,078 15.7 9.8 15.9 30.1 71.5 4.7 20.4
2000 2,587 10.1 17.4 10.9 21.8 60.2 18.8 19.4
2001 2,656 8.7 19.9 10.2 21.8 60.6 18.3 19.7
2002 2,661 7.7 21.4 9.3 21.5 59.9 17.7 20.6
2003 2,679 5.9 19.6 8.1 21.8 55.4 21.8 20.5
2004 2,775 5.3 18.8 7.6 21.9 53.6 23.7 20.3
2005 2,843 4.7 18.4 7.4 21.1 51.6 26.7 19.1
2006 2,937 4.6 17.9 7.6 20.7 50.8 28.0 18.1
2007 3,897 4.7 17.3 7.6 21.4 51.0 27.4 18.7
2008 3,803 4.8 18.8 7.4 22.6 53.6 23.5 20.5
2009 3,694 4.3 18.4 7.0 21.3 51.0 26.0 20.1
2010 3,616 4.1 18.2 6.4 21.2 49.9 26.7 20.3
Source: Tokyo Stock Exchange Stock Ownership Survey
Table 2. Number of Sample Firms
Number of firms sampled at the end of September of each year (2007-2009) and number of firms listed on the Tokyo
Stock Exchange 1st Section (TSE1), on Tokyo Stock Exchange Second Section (TSE2), and other stock exchanges in
Japan (Others). Number of firms in the most right four columns is non-duplicated and a single firm appears four
times at maximum in our sample period, 2007 through 2010.
Sector 2007 2008 2009 2010 TSE1 TSE2 Others Total
Consumption Goods 216 203 207 225 207 33 47 287
Investment Goods 306 316 330 333 298 42 91 427
Services 296 310 339 344 211 46 233 480
Transportation 19 21 21 22 20 3 4 27
Utility 12 13 13 15 15 0 0 15
Real Estate 37 41 31 36 32 7 21 60
All Sectors 886 904 941 975 783 131 396 1296
24
Tabl
e 3.
Des
crip
tive
Sta
tist
ics
of C
orpo
rate
Soc
ial P
erfo
rman
ce o
f Ja
pane
se F
irm
s
Pan
el A
. Sec
tor-
wis
e C
orpo
rate
Soc
ial P
erfo
rman
ce
25%
ile
Med
ian
75%
ile
Mea
n S
.D.
25%
ile
Med
ian
75%
ile
Mea
n S
.D.
Con
sum
ptio
n G
oods
-0
.598
0.26
70.
998
0.10
31.
197
-0.5
940.
191
0.91
30.
157
0.99
1In
vest
men
t Goo
ds
-0.5
280.
285
1.10
70.
197
1.22
5-0
.763
-0.0
280.
655
0.02
40.
960
Serv
ices
-1
.094
0.06
90.
758
-0.1
471.
227
-0.9
28-0
.346
0.45
0-0
.170
0.95
5T
rans
port
atio
n -0
.368
0.16
60.
855
0.15
71.
092
-0.4
080.
097
1.05
90.
139
1.09
8U
tility
-0
.620
-0.1
090.
365
-0.0
891.
020
-0.3
410.
722
1.07
60.
356
0.84
5R
eal E
stat
e -1
.055
-0.0
090.
728
-0.1
701.
170
-0.9
35-0
.430
0.35
3-0
.177
0.92
3A
ll Fi
rms
-0.7
250.
203
0.90
10.
036
1.22
1-0
.852
-0.0
720.
662
-0.0
140.
975
25%
ile
Med
ian
75%
ile
Mea
n S
.D.
25%
ile
Med
ian
75%
ile
Mea
n S
.D.
Con
sum
ptio
n G
oods
-0
.079
0.70
70.
985
0.41
50.
810
-0.4
110.
055
0.76
80.
064
0.97
7In
vest
men
t Goo
ds
-0.2
330.
427
0.91
50.
228
0.88
4-0
.521
-0.0
490.
636
-0.0
441.
001
Serv
ices
-1
.112
-0.1
760.
638
-0.3
311.
040
-0.4
540.
001
0.69
8-0
.004
0.98
8T
rans
port
atio
n -0
.398
0.49
00.
773
0.03
71.
027
-0.8
23-0
.131
0.52
5-0
.416
1.40
7U
tility
-0
.268
0.55
70.
639
0.17
10.
778
-0.3
30-0
.141
0.15
20.
017
0.65
2R
eal E
stat
e -1
.196
-0.2
400.
096
-0.4
201.
019
-0.5
890.
021
0.77
4-0
.019
0.98
9A
ll Fi
rms
-0.3
960.
163
0.84
10.
046
0.98
5-0
.472
-0.0
060.
699
-0.0
121.
000
25%
ile
Med
ian
75%
ile
Mea
n S
.D.
25%
ile
Med
ian
75%
ile
Mea
n S
.D.
Con
sum
ptio
n G
oods
-0
.499
0.27
30.
836
0.16
20.
935
-0.8
520.
723
1.99
80.
466
1.74
8In
vest
men
t Goo
ds
-0.4
870.
180
0.80
30.
144
0.90
8-1
.097
0.38
11.
766
0.26
21.
697
Serv
ices
-1
.052
-0.4
930.
526
-0.2
100.
909
-1.8
92-0
.577
0.89
6-0
.427
1.65
3T
rans
port
atio
n -0
.316
0.16
20.
566
0.15
30.
814
-1.1
940.
123
1.63
00.
101
1.69
9U
tility
-0
.010
0.33
61.
009
0.59
60.
899
-0.3
870.
426
1.58
50.
401
1.48
3R
eal E
stat
e -1
.027
-0.7
450.
205
-0.3
320.
854
-1.9
51-0
.731
0.98
1-0
.531
1.59
7A
ll Fi
rms
-0.8
360.
002
0.70
80.
013
0.93
1-1
.450
0.05
41.
541
0.03
71.
730
Em
ploy
ee R
elat
ions
Soci
al C
ontr
ibut
ion
Secu
rity
and
Safe
ness
Inte
rnal
Gov
erna
nce
and
Ris
k M
anag
emen
t
Env
ironm
ent
Cor
pora
te S
ocia
l Per
form
ance
25
Pan
el B
. Fir
m S
ize
and
Cor
pora
te S
ocia
l Per
form
ance
25%
ile
Med
ian
75%
ile
Mea
n S
.D.
25%
ile
Med
ian
75%
ile
Mea
n S
.D.
Size
1(L
arge
)0.
037
0.78
21.
500
0.67
51.
105
0.14
30.
872
1.39
40.
739
0.91
1
Size
2 -0
.717
0.17
80.
782
-0.0
471.
133
-0.7
58-0
.145
0.37
4-0
.152
0.79
8Si
ze3
(Sm
all)
-1.3
99-0
.361
0.34
4-0
.518
1.11
6-1
.110
-0.7
66-0
.161
-0.6
270.
652
All
Firm
s-0
.725
0.20
30.
901
0.03
61.
221
-0.8
52-0
.072
0.66
2-0
.014
0.97
5
25%
ile
Med
ian
75%
ile
Mea
n S
.D.
25%
ile
Med
ian
75%
ile
Mea
n S
.D.
Size
1(L
arge
)0.
065
0.73
90.
991
0.40
20.
915
-0.1
800.
216
1.11
00.
262
0.98
7
Size
2 -0
.328
0.11
30.
810
0.06
10.
952
-0.4
66-0
.071
0.66
6-0
.059
0.97
9Si
ze3
(Sm
all)
-0.9
64-0
.265
0.53
1-0
.323
0.95
1-0
.581
-0.2
300.
324
-0.2
380.
969
All
Firm
s-0
.396
0.16
30.
841
0.04
60.
985
-0.4
72-0
.006
0.69
9-0
.012
1.00
0
25%
ile
Med
ian
75%
ile
Mea
n S
.D.
25%
ile
Med
ian
75%
ile
Mea
n S
.D.
Size
1(L
arge
)0.
378
0.76
91.
218
0.75
90.
707
0.79
51.
765
2.44
01.
448
1.28
0
Size
2 -0
.609
-0.0
430.
494
-0.0
230.
791
-1.1
12-0
.021
1.02
0-0
.052
1.43
5Si
ze3
(Sm
all)
-1.1
29-0
.949
-0.3
43-0
.695
0.64
3-2
.301
-1.4
97-0
.441
-1.2
831.
241
All
Firm
s-0
.836
0.00
20.
708
0.01
30.
931
-1.4
500.
054
1.54
10.
037
1.73
0
Em
ploy
ee R
elat
ions
Soci
al C
ontr
ibut
ion
Secu
rity
and
Safe
ness
Inte
rnal
Gov
erna
nce
and
Ris
k M
anag
emen
t
Env
ironm
ent
Cor
pora
te S
ocia
l Per
form
ance
26
Tabl
e 4.
Des
crip
tive
Sta
tist
ics
of S
tock
Ow
ners
hip
Str
uctu
re o
f Ja
pane
se F
irm
s
Pan
el A
. Sec
tor-
wis
e S
umm
ary
of S
tock
Ow
ners
hip
Str
uctu
re
25%
ile
Med
ian
75%
ile
Mea
n S
.D.
25%
ile
Med
ian
75%
ile
Mea
n S
.D.
Con
sum
ptio
n G
oods
38
.506
49.8
2961
.309
49.0
8616
.743
-8.0
15-3
.141
1.61
9-3
.031
9.90
1In
vest
men
t Goo
ds
42.5
1152
.932
62.3
1851
.834
15.9
21-8
.303
-3.1
671.
440
-3.3
748.
792
Serv
ices
28
.719
44.1
3058
.558
43.1
3320
.883
-7.6
15-1
.869
3.22
4-1
.706
11.2
35T
rans
port
atio
n 47
.105
54.3
7864
.713
55.3
9513
.442
-7.4
48-2
.000
-0.6
40-3
.908
8.95
5U
tility
41
.966
47.5
1754
.041
49.2
8710
.329
-4.5
58-1
.855
-0.3
28-2
.836
7.49
5R
eal E
stat
e 24
.039
51.4
3168
.018
46.4
9023
.145
-6.7
42-1
.288
4.80
6-0
.148
14.9
08A
ll Fi
rms
36.1
9249
.690
60.9
9548
.011
18.5
75-7
.946
-2.5
041.
892
-2.6
7010
.139
25%
ile
Med
ian
75%
ile
Mea
n S
.D.
25%
ile
Med
ian
75%
ile
Mea
n S
.D.
Con
sum
ptio
n G
oods
3.
247
10.5
8222
.698
14.0
3412
.760
-0.6
641.
774
6.67
32.
837
8.32
6In
vest
men
t Goo
ds
2.48
19.
737
20.7
4913
.032
12.5
390.
000
2.74
18.
203
4.34
48.
082
Serv
ices
0.
508
3.28
411
.659
7.90
410
.728
-0.6
330.
453
5.28
71.
934
7.54
3T
rans
port
atio
n 2.
893
8.54
923
.275
13.2
4912
.163
0.00
02.
093
6.15
04.
260
6.79
2U
tility
9.
687
12.4
8617
.463
14.3
468.
754
3.02
05.
047
8.03
75.
975
6.94
2R
eal E
stat
e 2.
950
11.0
7620
.590
14.2
6713
.555
-0.0
034.
450
11.9
436.
558
12.0
97A
ll Fi
rms
1.51
87.
358
18.4
9111
.550
12.2
72-0
.218
1.77
37.
060
3.33
28.
199
25%
ile
Med
ian
75%
ile
Mea
n S
.D.
25%
ile
Med
ian
75%
ile
Mea
n S
.D.
Con
sum
ptio
n G
oods
20
.268
29.5
2949
.195
35.3
9719
.376
-4.6
320.
356
4.46
0-0
.047
10.2
08In
vest
men
t Goo
ds
19.2
4329
.030
46.6
1433
.993
19.3
13-5
.270
-1.0
453.
216
-1.1
089.
306
Serv
ices
29
.193
46.0
9965
.467
47.8
5223
.566
-5.4
810.
221
5.21
3-0
.367
11.5
16T
rans
port
atio
n 17
.633
24.2
0840
.100
30.4
4317
.165
-2.6
38-0
.071
2.58
3-0
.540
7.07
1U
tility
25
.215
35.0
4940
.564
33.2
1911
.471
-4.7
03-2
.545
-0.1
62-2
.006
4.44
2R
eal E
stat
e 15
.752
35.2
4556
.691
37.9
3225
.693
-12.
248
-3.7
900.
607
-6.7
6714
.990
All
Firm
s 21
.365
35.3
5754
.958
39.1
9921
.990
-5.3
06-0
.472
4.08
6-0
.815
10.4
52
Per
cent
a ge
of S
hare
s O
wne
d by
Jap
anes
e C
orpo
ratio
nsP
ast 5
Yea
r In
crea
se in
Sha
res
Hel
d by
Jap
anes
e C
orpo
ratio
ns
Per
cent
age
of S
hare
s O
wne
d by
For
eign
Cor
pora
tions
Pas
t 5 Y
ear
Incr
ease
in S
hare
s H
eld
by F
orei
gn C
orpo
ratio
ns
Per
cent
age
of S
hare
s O
wne
d by
Ind
ivid
ual I
nves
tors
Pas
t 5 Y
ear
Incr
ease
in S
hare
s H
eld
by I
ndiv
idua
l Inv
esto
rs
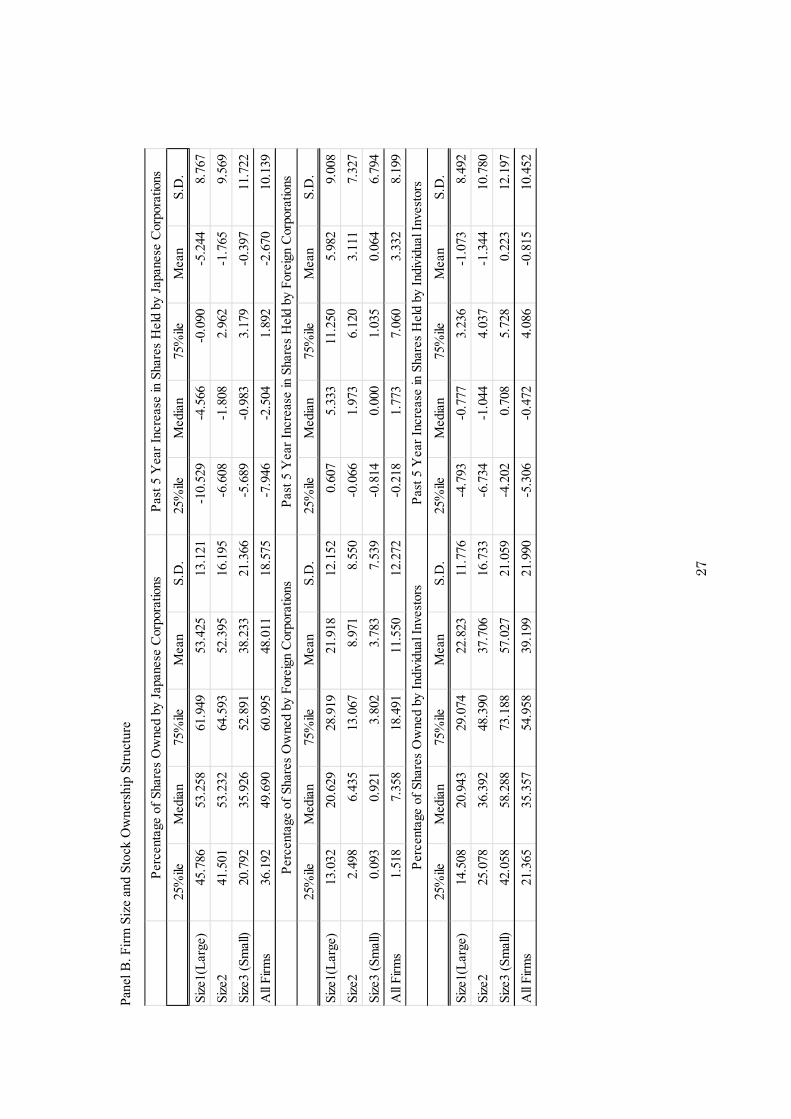
27
Pan
el B
. Fir
m S
ize
and
Sto
ck O
wne
rshi
p S
truc
ture
25%
ile
Med
ian
75%
ile
Mea
n S
.D.
25%
ile
Med
ian
75%
ile
Mea
n S
.D.
Size
1(L
arge
)45
.786
53.2
5861
.949
53.4
2513
.121
-10.
529
-4.5
66-0
.090
-5.2
448.
767
Size
2 41
.501
53.2
3264
.593
52.3
9516
.195
-6.6
08-1
.808
2.96
2-1
.765
9.56
9
Size
3 (S
mal
l)20
.792
35.9
2652
.891
38.2
3321
.366
-5.6
89-0
.983
3.17
9-0
.397
11.7
22
All
Firm
s36
.192
49.6
9060
.995
48.0
1118
.575
-7.9
46-2
.504
1.89
2-2
.670
10.1
39
25%
ile
Med
ian
75%
ile
Mea
n S
.D.
25%
ile
Med
ian
75%
ile
Mea
n S
.D.
Size
1(L
arge
)13
.032
20.6
2928
.919
21.9
1812
.152
0.60
75.
333
11.2
505.
982
9.00
8
Size
2 2.
498
6.43
513
.067
8.97
18.
550
-0.0
661.
973
6.12
03.
111
7.32
7
Size
3 (S
mal
l)0.
093
0.92
13.
802
3.78
37.
539
-0.8
140.
000
1.03
50.
064
6.79
4
All
Firm
s1.
518
7.35
818
.491
11.5
5012
.272
-0.2
181.
773
7.06
03.
332
8.19
9
25%
ile
Med
ian
75%
ile
Mea
n S
.D.
25%
ile
Med
ian
75%
ile
Mea
n S
.D.
Size
1(L
arge
)14
.508
20.9
4329
.074
22.8
2311
.776
-4.7
93-0
.777
3.23
6-1
.073
8.49
2
Size
2 25
.078
36.3
9248
.390
37.7
0616
.733
-6.7
34-1
.044
4.03
7-1
.344
10.7
80
Size
3 (S
mal
l)42
.058
58.2
8873
.188
57.0
2721
.059
-4.2
020.
708
5.72
80.
223
12.1
97
All
Firm
s21
.365
35.3
5754
.958
39.1
9921
.990
-5.3
06-0
.472
4.08
6-0
.815
10.4
52
Per
cent
age
of S
hare
s O
wne
d by
Jap
anes
e C
orpo
ratio
nsP
ast 5
Yea
r In
crea
se in
Sha
res
Hel
d by
Jap
anes
e C
orpo
ratio
ns
Per
cent
age
of S
hare
s O
wne
d by
For
eign
Cor
pora
tions
Pas
t 5 Y
ear
Incr
ease
in S
hare
s H
eld
by F
orei
gn C
orpo
ratio
ns
Per
cent
age
of S
hare
s O
wne
d by
Ind
ivid
ual I
nves
tors
Pas
t 5 Y
ear
Incr
ease
in S
hare
s H
eld
by I
ndiv
idua
l Inv
esto
rs
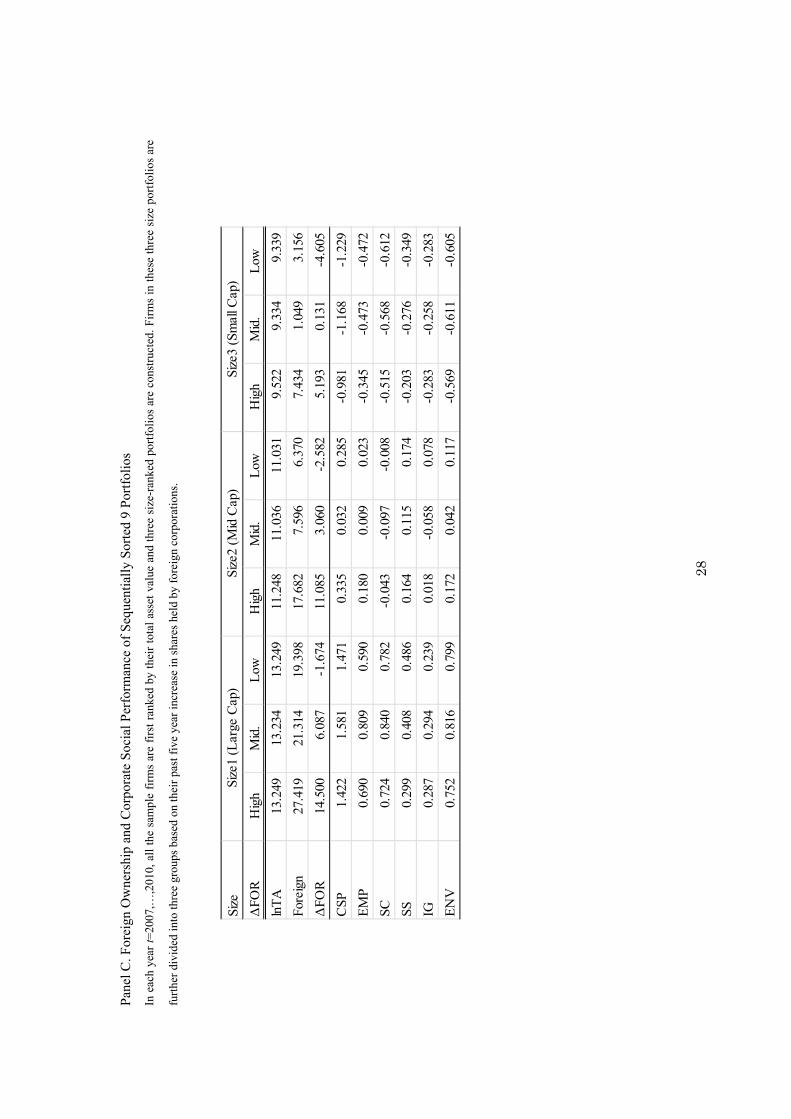
28
Pan
el C
. For
eign
Ow
ners
hip
and
Cor
pora
te S
ocia
l Per
form
ance
of
Seq
uent
iall
y S
orte
d 9
Por
tfol
ios
In e
ach
year
t=
2007
,…,2
010,
all
the
sam
ple
firm
s ar
e fi
rst
rank
ed b
y th
eir
tota
l as
set
valu
e an
d th
ree
size
-ran
ked
port
foli
os a
re c
onst
ruct
ed. F
irm
s in
the
se t
hree
siz
e po
rtfo
lios
are
furt
her
divi
ded
into
thre
e gr
oups
bas
ed o
n th
eir
past
fiv
e ye
ar in
crea
se in
sha
res
held
by
fore
ign
corp
orat
ions
.
Size
ΔFO
RH
igh
Mid
.L
owH
igh
Mid
.L
owH
igh
Mid
.L
ow
lnT
A
13.2
4913
.234
13.2
4911
.248
11.0
3611
.031
9.52
29.
334
9.33
9
Fore
ign
27.4
1921
.314
19.3
9817
.682
7.59
66.
370
7.43
41.
049
3.15
6
ΔFO
R
14.5
006.
087
-1.6
7411
.085
3.06
0-2
.582
5.19
30.
131
-4.6
05
CSP
1.
422
1.58
11.
471
0.33
50.
032
0.28
5-0
.981
-1.1
68-1
.229
EM
P
0.69
00.
809
0.59
00.
180
0.00
90.
023
-0.3
45-0
.473
-0.4
72
SC
0.72
40.
840
0.78
2-0
.043
-0.0
97-0
.008
-0.5
15-0
.568
-0.6
12
SS
0.29
90.
408
0.48
60.
164
0.11
50.
174
-0.2
03-0
.276
-0.3
49
IG
0.28
70.
294
0.23
90.
018
-0.0
580.
078
-0.2
83-0
.258
-0.2
83
EN
V
0.75
20.
816
0.79
90.
172
0.04
20.
117
-0.5
69-0
.611
-0.6
05
Size
1 (L
arge
Cap
)Si
ze2
(Mid
Cap
)Si
ze3
(Sm
all C
ap)
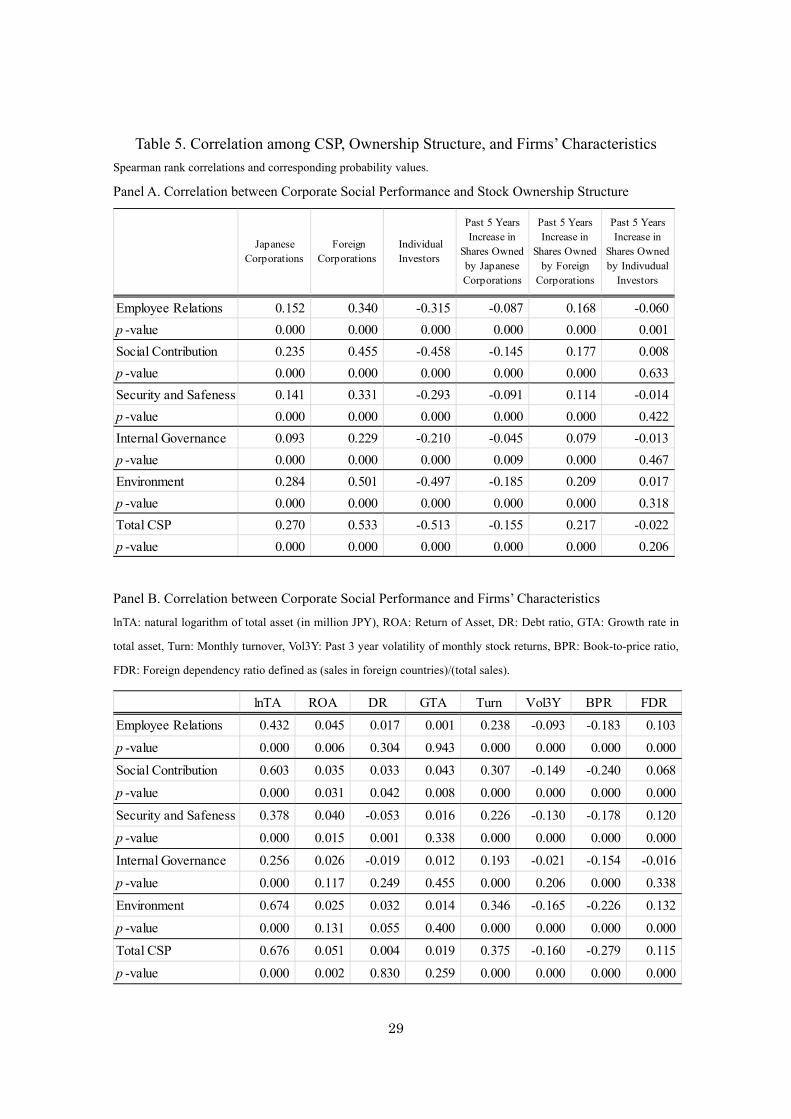
29
Table 5. Correlation among CSP, Ownership Structure, and Firms’ Characteristics
Spearman rank correlations and corresponding probability values.
Panel A. Correlation between Corporate Social Performance and Stock Ownership Structure
JapaneseCorporations
ForeignCorporations
IndividualInvestors
Past 5 YearsIncrease in
Shares Ownedby JapaneseCorporations
Past 5 YearsIncrease in
Shares Ownedby Foreign
Corporations
Past 5 YearsIncrease in
Shares Ownedby Indivudual
Investors
Employee Relations 0.152 0.340 -0.315 -0.087 0.168 -0.060
p -value 0.000 0.000 0.000 0.000 0.000 0.001
Social Contribution 0.235 0.455 -0.458 -0.145 0.177 0.008
p -value 0.000 0.000 0.000 0.000 0.000 0.633
Security and Safeness 0.141 0.331 -0.293 -0.091 0.114 -0.014
p -value 0.000 0.000 0.000 0.000 0.000 0.422
Internal Governance 0.093 0.229 -0.210 -0.045 0.079 -0.013
p -value 0.000 0.000 0.000 0.009 0.000 0.467
Environment 0.284 0.501 -0.497 -0.185 0.209 0.017
p -value 0.000 0.000 0.000 0.000 0.000 0.318
Total CSP 0.270 0.533 -0.513 -0.155 0.217 -0.022
p -value 0.000 0.000 0.000 0.000 0.000 0.206
Panel B. Correlation between Corporate Social Performance and Firms’ Characteristics
lnTA: natural logarithm of total asset (in million JPY), ROA: Return of Asset, DR: Debt ratio, GTA: Growth rate in
total asset, Turn: Monthly turnover, Vol3Y: Past 3 year volatility of monthly stock returns, BPR: Book-to-price ratio,
FDR: Foreign dependency ratio defined as (sales in foreign countries)/(total sales).
lnTA ROA DR GTA Turn Vol3Y BPR FDR
Employee Relations 0.432 0.045 0.017 0.001 0.238 -0.093 -0.183 0.103
p -value 0.000 0.006 0.304 0.943 0.000 0.000 0.000 0.000
Social Contribution 0.603 0.035 0.033 0.043 0.307 -0.149 -0.240 0.068
p -value 0.000 0.031 0.042 0.008 0.000 0.000 0.000 0.000
Security and Safeness 0.378 0.040 -0.053 0.016 0.226 -0.130 -0.178 0.120
p -value 0.000 0.015 0.001 0.338 0.000 0.000 0.000 0.000
Internal Governance 0.256 0.026 -0.019 0.012 0.193 -0.021 -0.154 -0.016
p -value 0.000 0.117 0.249 0.455 0.000 0.206 0.000 0.338
Environment 0.674 0.025 0.032 0.014 0.346 -0.165 -0.226 0.132
p -value 0.000 0.131 0.055 0.400 0.000 0.000 0.000 0.000
Total CSP 0.676 0.051 0.004 0.019 0.375 -0.160 -0.279 0.115
p -value 0.000 0.002 0.830 0.259 0.000 0.000 0.000 0.000

30
Table 6. Effects of Stock Ownership Structure on the CSP
[Dependent Variables] CSP: Total CSP, EMP: Employee relations, SC: Social Contribution, SS: Security of the firm
and Safeness of the product, IG: Internal Governance and Risk Management, ENV: Environment preservations.
[Independent Variables] lnTA: natural logarithm of total asset (in million JPY), ROA: Return of Asset, DR: Debt
ratio, GTA: Growth rate in total asset, Turn: Monthly turnover, Vol3Y: Past three year volatility of monthly stock
returns, BPR: Book-to-price ratio, FDR: Foreign dependency ratio defined as (sales in foreign countries)/(total sales).
*** Significant at p < .01, ** Significant at p < .05, *Significant at p < .10.
Intercept 1.716 *** 0.722 *** 0.846 *** 0.790 *** 0.367 *** 0.663 ***
Japanese Corp. 0.009 *** 0.003 ** 0.004 *** 0.003 ** 0.002 * 0.006 ***
ROA 0.000 0.005 -0.002 -0.002 -0.006 * 0.000DR -0.003 *** 0.001 0.000 -0.002 *** -0.001 * -0.001GTA -0.004 *** -0.003 ** -0.001 0.000 0.000 -0.002 ***
Turn 0.000 0.000 0.000 0.000 0.000 0.000 **
Vol3Y -0.025 *** -0.017 *** -0.014 *** -0.013 *** 0.001 -0.014 ***
BPR -0.002 *** -0.001 *** -0.001 *** -0.001 ** -0.001 *** 0.000 **
FDR 0.006 *** 0.004 *** 0.002 * 0.003 *** 0.000 0.003 ***
Adjusted R2 0.460 0.185 0.356 0.172 0.058 0.432
Intercept 1.724 *** 0.636 *** 0.738 *** 0.694 *** 0.333 *** 0.780 ***
Foreign Corp. 0.027 *** 0.014 *** 0.013 *** 0.012 *** 0.006 * 0.012 ***
ROA 0.003 0.006 * 0.000 -0.002 -0.005 * 0.002DR -0.001 0.001 0.000 -0.001 -0.001 0.000GTA -0.005 *** -0.004 ** -0.001 -0.001 0.000 -0.003 ***
Turn 0.000 0.000 0.000 0.000 0.000 0.000Vol3Y -0.032 *** -0.021 *** -0.015 *** -0.018 *** 0.002 -0.017 ***
BPR -0.001 *** -0.001 *** 0.000 * 0.000 ** -0.001 *** 0.000 **
FDR 0.002 0.003 * 0.001 0.001 -0.001 0.001
Adjusted R2 0.429 0.167 0.336 0.154 0.051 0.410
Intercept 2.470 *** 0.952 *** 1.173 *** 1.009 *** 0.569 *** 1.122 ***
Individuals -0.012 *** -0.004 *** -0.007 *** -0.003 ** -0.005 *** -0.006 ***
ROA 0.002 0.006 * -0.001 -0.001 -0.006 * 0.001DR -0.003 ** 0.001 0.000 -0.003 *** -0.002 * 0.000GTA -0.009 *** -0.007 *** -0.002 * -0.002 -0.002 -0.004 ***
Turn 0.001 * 0.000 0.000 0.001 ** 0.000 0.000 **
Vol3Y -0.029 *** -0.022 *** -0.014 *** -0.016 *** 0.002 -0.017 ***
BPR -0.002 *** -0.001 *** 0.000 *** 0.000 0.000 ** 0.000 *
FDR 0.005 *** 0.003 ** 0.001 0.003 *** 0.000 0.002 ***
Adjusted R2 0.425 0.174 0.336 0.156 0.061 0.395
Panel C. %Shares Held by Individual InvestorsCSP EMP SC SS IG ENV
Panel B. %Shares Held by Foreign CorporationsCSP EMP SC SS IG ENV
Panel A. %Shares Held by Japanese CorporationsCSP EMP SC SS IG ENV

31
Table 7. Effects of Change in Stock Ownership on the CSP
[Dependent Variables] CSP: Total CSP, EMP: Employee relations, SC: Social Contribution, SS: Security of the firm
and Safeness of the product, IG: Internal Governance and Risk Management, ENV: Environment preservations.
[Independent Variables] lnTA: natural logarithm of total asset (in million JPY), ROA: Return of Asset, DR: Debt
ratio, GTA: Growth rate in total asset, Turn: Monthly turnover, Vol3Y: Past 3 year volatility of monthly stock returns,
BPR: Book-to-price ratio, FDR: Foreign dependency ratio defined as (sales in foreign countries)/(total sales).
*** Significant at p < .01, ** Significant at p < .05, *Significant at p < .10.
Intercept 2.227 *** 0.872 *** 1.045 *** 0.953 *** 0.520 *** 0.976 ***
⊿JPN -0.003 0.001 -0.005 ** -0.001 0.001 -0.006 ***
ROA 0.002 0.006 -0.001 0.001 -0.001 -0.002DR -0.004 *** 0.001 -0.001 -0.003 *** -0.002 ** -0.001GTA -0.006 ** -0.006 *** 0.000 -0.003 * -0.003 -0.001Turn 0.000 0.000 0.000 * 0.000 -0.001 0.000Vol3Y -0.021 *** -0.018 *** -0.010 *** -0.018 *** 0.001 -0.012 ***
BPR -0.002 *** -0.001 *** -0.001 *** -0.001 ** -0.001 ** -0.001 ***
FDR 0.005 *** 0.003 ** 0.002 * 0.003 *** 0.000 0.002 **
Adjusted R2 0.408 0.159 0.334 0.141 0.057 0.377
Intercept 2.201 *** 0.866 *** 0.998 *** 0.957 *** 0.482 *** 0.994 ***
⊿FOR 0.015 *** 0.013 *** 0.005 0.003 0.000 0.004ROA 0.003 0.005 0.000 -0.002 -0.001 0.000DR -0.004 *** 0.001 -0.001 -0.003 *** -0.002 ** -0.001GTA -0.006 ** -0.006 *** 0.001 -0.001 -0.002 -0.002 *
Turn 0.000 0.000 -0.001 ** 0.000 -0.001 * 0.000Vol3Y -0.020 *** -0.022 *** -0.007 ** -0.014 *** 0.010 ** -0.013 ***
BPR -0.002 *** -0.001 *** -0.001 *** -0.001 ** -0.001 ** 0.000 ***
FDR 0.004 *** 0.003 ** 0.002 0.002 ** -0.001 0.002 **
Adjusted R2 0.422 0.164 0.341 0.153 0.060 0.387
Intercept 2.159 *** 0.902 *** 1.029 *** 0.871 *** 0.453 *** 0.974 ***
⊿IND -0.001 -0.006 * 0.005 ** 0.001 -0.001 0.006 ***
ROA 0.004 0.005 0.001 0.003 0.002 -0.002DR -0.004 *** 0.001 -0.001 -0.002 ** -0.002 * -0.001GTA -0.006 ** -0.006 *** 0.002 -0.003 -0.003 -0.001Turn 0.000 0.000 0.000 0.000 -0.001 0.001 **
Vol3Y -0.014 ** -0.020 *** -0.007 ** -0.011 ** 0.009 * -0.011 ***
BPR -0.002 *** -0.001 *** -0.001 *** 0.000 -0.001 ** -0.001 ***
FDR 0.003 ** 0.002 0.001 0.002 ** 0.000 0.002 **
Adjusted R2 0.418 0.166 0.346 0.143 0.062 0.384
Panel C. Past 5 Years Increase in Shares Held by Individual InvestorsCSP EMP SC SS IG ENV
Panel B. Past 5 Years Increase in Shares Held by Foreign CorporationsCSP EMP SC SS IG ENV
Panel A. Past 5 Years Increase in Shares Held by Japanese CorporationsCSP EMP SC SS IG ENV
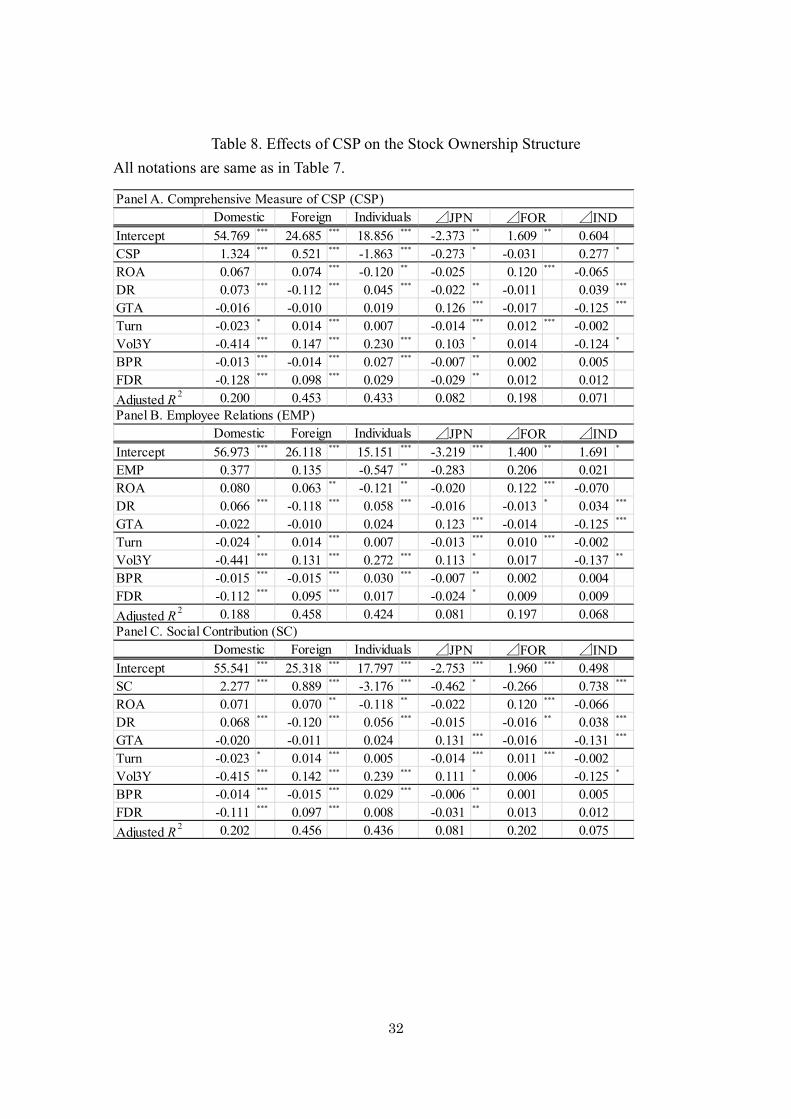
32
Table 8. Effects of CSP on the Stock Ownership Structure
All notations are same as in Table 7.
Intercept 54.769 *** 24.685 *** 18.856 *** -2.373 ** 1.609 ** 0.604CSP 1.324 *** 0.521 *** -1.863 *** -0.273 * -0.031 0.277 *
ROA 0.067 0.074 *** -0.120 ** -0.025 0.120 *** -0.065DR 0.073 *** -0.112 *** 0.045 *** -0.022 ** -0.011 0.039 ***
GTA -0.016 -0.010 0.019 0.126 *** -0.017 -0.125 ***
Turn -0.023 * 0.014 *** 0.007 -0.014 *** 0.012 *** -0.002Vol3Y -0.414 *** 0.147 *** 0.230 *** 0.103 * 0.014 -0.124 *
BPR -0.013 *** -0.014 *** 0.027 *** -0.007 ** 0.002 0.005FDR -0.128 *** 0.098 *** 0.029 -0.029 ** 0.012 0.012
Adjusted R2 0.200 0.453 0.433 0.082 0.198 0.071
Intercept 56.973 *** 26.118 *** 15.151 *** -3.219 *** 1.400 ** 1.691 *
EMP 0.377 0.135 -0.547 ** -0.283 0.206 0.021ROA 0.080 0.063 ** -0.121 ** -0.020 0.122 *** -0.070DR 0.066 *** -0.118 *** 0.058 *** -0.016 -0.013 * 0.034 ***
GTA -0.022 -0.010 0.024 0.123 *** -0.014 -0.125 ***
Turn -0.024 * 0.014 *** 0.007 -0.013 *** 0.010 *** -0.002Vol3Y -0.441 *** 0.131 *** 0.272 *** 0.113 * 0.017 -0.137 **
BPR -0.015 *** -0.015 *** 0.030 *** -0.007 ** 0.002 0.004FDR -0.112 *** 0.095 *** 0.017 -0.024 * 0.009 0.009
Adjusted R2 0.188 0.458 0.424 0.081 0.197 0.068
Intercept 55.541 *** 25.318 *** 17.797 *** -2.753 *** 1.960 *** 0.498SC 2.277 *** 0.889 *** -3.176 *** -0.462 * -0.266 0.738 ***
ROA 0.071 0.070 ** -0.118 ** -0.022 0.120 *** -0.066DR 0.068 *** -0.120 *** 0.056 *** -0.015 -0.016 ** 0.038 ***
GTA -0.020 -0.011 0.024 0.131 *** -0.016 -0.131 ***
Turn -0.023 * 0.014 *** 0.005 -0.014 *** 0.011 *** -0.002Vol3Y -0.415 *** 0.142 *** 0.239 *** 0.111 * 0.006 -0.125 *
BPR -0.014 *** -0.015 *** 0.029 *** -0.006 ** 0.001 0.005FDR -0.111 *** 0.097 *** 0.008 -0.031 ** 0.013 0.012
Adjusted R2 0.202 0.456 0.436 0.081 0.202 0.075
Panel C. Social Contribution (SC)Domestic Foreign Individuals ⊿JPN ⊿FOR ⊿IND
Panel B. Employee Relations (EMP)Domestic Foreign Individuals ⊿JPN ⊿FOR ⊿IND
Panel A. Comprehensive Measure of CSP (CSP)Domestic Foreign Individuals ⊿JPN ⊿FOR ⊿IND

33
(Table 8. Continued.)
Intercept 57.294 *** 25.824 *** 15.267 *** -2.944 *** 1.431 ** 1.406SS 0.074 0.655 *** -0.671 * -0.080 -0.108 0.038ROA 0.112 * 0.066 ** -0.156 *** 0.000 0.115 *** -0.085DR 0.060 *** -0.114 *** 0.059 *** -0.021 ** -0.011 0.038 ***
GTA -0.030 -0.015 * 0.037 * 0.120 *** -0.019 -0.117 ***
Turn -0.024 * 0.015 *** 0.005 -0.015 ** 0.013 *** -0.003Vol3Y -0.448 *** 0.134 *** 0.277 *** 0.100 0.022 -0.127 *
BPR -0.015 *** -0.015 *** 0.030 *** -0.006 ** 0.001 0.004FDR -0.120 *** 0.094 *** 0.024 -0.033 *** 0.006 0.022
Adjusted R2 0.195 0.470 0.440 0.094 0.208 0.069
Intercept 57.046 *** 25.964 *** 15.233 *** -3.272 *** 1.422 ** 1.635 *
IG 0.800 ** 0.515 *** -1.392 *** 0.174 -0.200 0.061ROA 0.092 0.071 *** -0.142 ** -0.027 0.129 *** -0.071DR 0.064 *** -0.112 *** 0.054 *** -0.016 -0.009 0.032 ***
GTA -0.029 -0.016 ** 0.037 * 0.129 *** -0.024 -0.120 ***
Turn -0.021 0.013 *** 0.005 -0.012 ** 0.010 *** -0.003Vol3Y -0.459 *** 0.135 *** 0.287 *** 0.112 * 0.020 -0.137 **
BPR -0.015 *** -0.015 *** 0.030 *** -0.006 ** 0.002 0.004FDR -0.112 *** 0.097 *** 0.015 -0.032 *** 0.006 0.021
Adjusted R2 0.193 0.465 0.443 0.081 0.195 0.068
Intercept 54.846 *** 25.594 *** 17.768 *** -2.272 ** 1.804 *** 0.274ENV 2.852 *** 0.757 *** -3.596 *** -0.904 *** -0.269 1.157 ***
ROA 0.040 0.079 *** -0.098 -0.010 0.103 *** -0.063DR 0.082 *** -0.123 *** 0.047 *** -0.013 -0.012 * 0.031 ***
GTA -0.017 -0.006 0.015 0.109 *** -0.005 -0.120 ***
Turn -0.024 * 0.015 *** 0.007 -0.015 *** 0.011 *** -0.001Vol3Y -0.422 *** 0.143 *** 0.239 *** 0.097 0.003 -0.109BPR -0.017 *** -0.015 *** 0.032 *** -0.007 *** 0.001 0.007 **
FDR -0.108 *** 0.092 *** 0.016 -0.027 ** 0.010 0.011
Adjusted R2 0.201 0.472 0.448 0.089 0.205 0.074
Panel D. Security of the Firm and Products Safeness (SS)Domestic Foreign Individuals ⊿JPN ⊿FOR ⊿IND
Panel E. Internal Governance and Risk Management (IG)Domestic Foreign Individuals ⊿JPN ⊿FOR ⊿IND
Panel F. Environment Preservations (ENV)Domestic Foreign Individuals ⊿JPN ⊿FOR ⊿IND
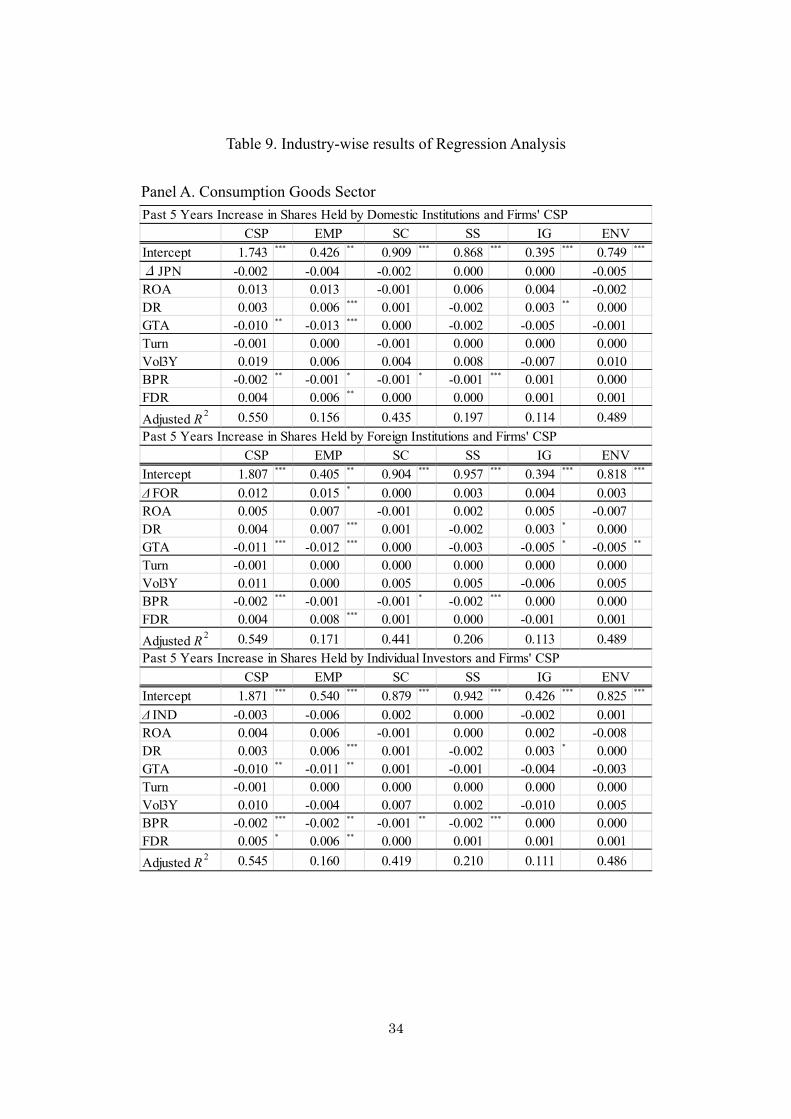
34
Table 9. Industry-wise results of Regression Analysis
Panel A. Consumption Goods Sector
Intercept 1.743 *** 0.426 ** 0.909 *** 0.868 *** 0.395 *** 0.749 ***
Δ JPN -0.002 -0.004 -0.002 0.000 0.000 -0.005ROA 0.013 0.013 -0.001 0.006 0.004 -0.002DR 0.003 0.006 *** 0.001 -0.002 0.003 ** 0.000GTA -0.010 ** -0.013 *** 0.000 -0.002 -0.005 -0.001Turn -0.001 0.000 -0.001 0.000 0.000 0.000Vol3Y 0.019 0.006 0.004 0.008 -0.007 0.010BPR -0.002 ** -0.001 * -0.001 * -0.001 *** 0.001 0.000FDR 0.004 0.006 ** 0.000 0.000 0.001 0.001
Adjusted R2 0.550 0.156 0.435 0.197 0.114 0.489
Intercept 1.807 *** 0.405 ** 0.904 *** 0.957 *** 0.394 *** 0.818 ***
ΔFOR 0.012 0.015 * 0.000 0.003 0.004 0.003ROA 0.005 0.007 -0.001 0.002 0.005 -0.007DR 0.004 0.007 *** 0.001 -0.002 0.003 * 0.000GTA -0.011 *** -0.012 *** 0.000 -0.003 -0.005 * -0.005 **
Turn -0.001 0.000 0.000 0.000 0.000 0.000Vol3Y 0.011 0.000 0.005 0.005 -0.006 0.005BPR -0.002 *** -0.001 -0.001 * -0.002 *** 0.000 0.000FDR 0.004 0.008 *** 0.001 0.000 -0.001 0.001
Adjusted R2 0.549 0.171 0.441 0.206 0.113 0.489
Intercept 1.871 *** 0.540 *** 0.879 *** 0.942 *** 0.426 *** 0.825 ***
Δ IND -0.003 -0.006 0.002 0.000 -0.002 0.001ROA 0.004 0.006 -0.001 0.000 0.002 -0.008DR 0.003 0.006 *** 0.001 -0.002 0.003 * 0.000GTA -0.010 ** -0.011 ** 0.001 -0.001 -0.004 -0.003Turn -0.001 0.000 0.000 0.000 0.000 0.000Vol3Y 0.010 -0.004 0.007 0.002 -0.010 0.005BPR -0.002 *** -0.002 ** -0.001 ** -0.002 *** 0.000 0.000FDR 0.005 * 0.006 ** 0.000 0.001 0.001 0.001
Adjusted R2 0.545 0.160 0.419 0.210 0.111 0.486
Past 5 Years Increase in Shares Held by Domestic Institutions and Firms' CSP
CSP EMP SC SS IG ENV
Past 5 Years Increase in Shares Held by Foreign Institutions and Firms' CSP
CSP EMP SC SS IG ENV
Past 5 Years Increase in Shares Held by Individual Investors and Firms' CSP
CSP EMP SC SS IG ENV
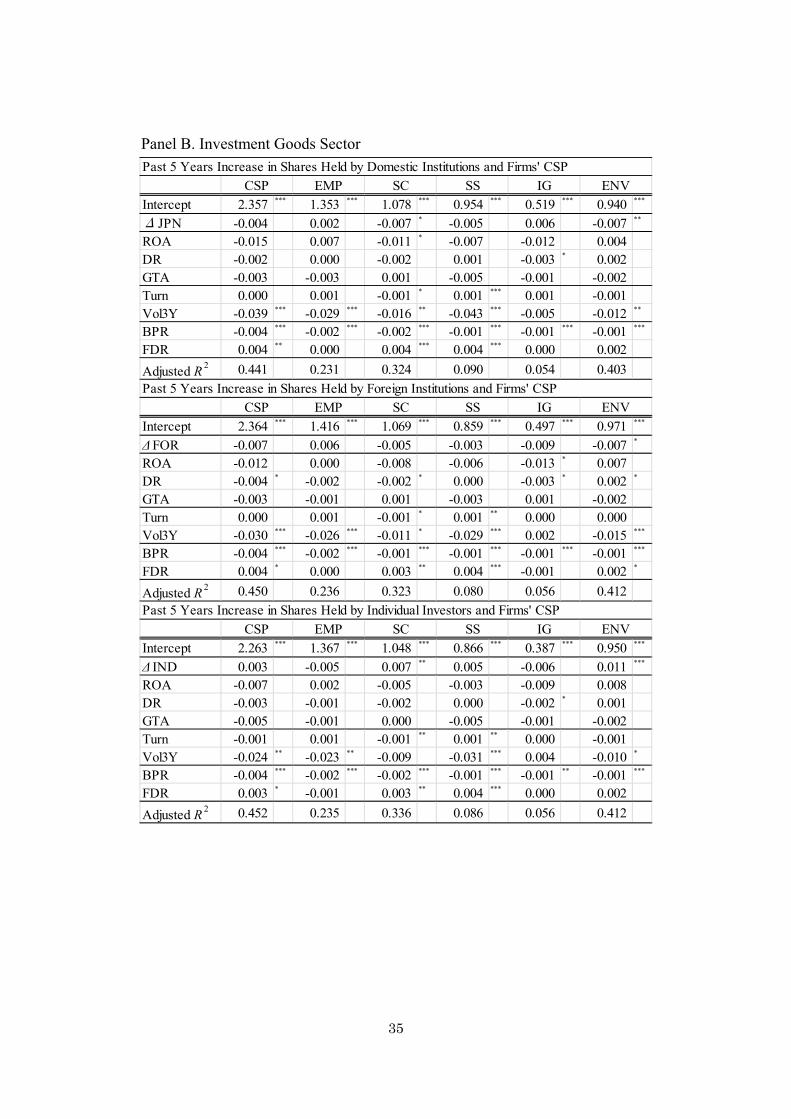
35
Panel B. Investment Goods Sector
Intercept 2.357 *** 1.353 *** 1.078 *** 0.954 *** 0.519 *** 0.940 ***
Δ JPN -0.004 0.002 -0.007 * -0.005 0.006 -0.007 **
ROA -0.015 0.007 -0.011 * -0.007 -0.012 0.004DR -0.002 0.000 -0.002 0.001 -0.003 * 0.002GTA -0.003 -0.003 0.001 -0.005 -0.001 -0.002Turn 0.000 0.001 -0.001 * 0.001 *** 0.001 -0.001Vol3Y -0.039 *** -0.029 *** -0.016 ** -0.043 *** -0.005 -0.012 **
BPR -0.004 *** -0.002 *** -0.002 *** -0.001 *** -0.001 *** -0.001 ***
FDR 0.004 ** 0.000 0.004 *** 0.004 *** 0.000 0.002
Adjusted R2 0.441 0.231 0.324 0.090 0.054 0.403
Intercept 2.364 *** 1.416 *** 1.069 *** 0.859 *** 0.497 *** 0.971 ***
ΔFOR -0.007 0.006 -0.005 -0.003 -0.009 -0.007 *
ROA -0.012 0.000 -0.008 -0.006 -0.013 * 0.007DR -0.004 * -0.002 -0.002 * 0.000 -0.003 * 0.002 *
GTA -0.003 -0.001 0.001 -0.003 0.001 -0.002Turn 0.000 0.001 -0.001 * 0.001 ** 0.000 0.000Vol3Y -0.030 *** -0.026 *** -0.011 * -0.029 *** 0.002 -0.015 ***
BPR -0.004 *** -0.002 *** -0.001 *** -0.001 *** -0.001 *** -0.001 ***
FDR 0.004 * 0.000 0.003 ** 0.004 *** -0.001 0.002 *
Adjusted R2 0.450 0.236 0.323 0.080 0.056 0.412
Intercept 2.263 *** 1.367 *** 1.048 *** 0.866 *** 0.387 *** 0.950 ***
Δ IND 0.003 -0.005 0.007 ** 0.005 -0.006 0.011 ***
ROA -0.007 0.002 -0.005 -0.003 -0.009 0.008DR -0.003 -0.001 -0.002 0.000 -0.002 * 0.001GTA -0.005 -0.001 0.000 -0.005 -0.001 -0.002Turn -0.001 0.001 -0.001 ** 0.001 ** 0.000 -0.001Vol3Y -0.024 ** -0.023 ** -0.009 -0.031 *** 0.004 -0.010 *
BPR -0.004 *** -0.002 *** -0.002 *** -0.001 *** -0.001 ** -0.001 ***
FDR 0.003 * -0.001 0.003 ** 0.004 *** 0.000 0.002
Adjusted R2 0.452 0.235 0.336 0.086 0.056 0.412
Past 5 Years Increase in Shares Held by Individual Investors and Firms' CSP
CSP EMP SC SS IG ENV
Past 5 Years Increase in Shares Held by Foreign Institutions and Firms' CSP
CSP EMP SC SS IG ENV
Past 5 Years Increase in Shares Held by Domestic Institutions and Firms' CSP
CSP EMP SC SS IG ENV

36
Panel C. Service Sector
Intercept 2.098 *** 0.842 *** 0.971 *** 0.592 *** 0.616 *** 1.019 ***
Δ JPN -0.003 0.002 -0.006 * 0.004 -0.001 -0.007 **
ROA 0.008 0.008 0.005 -0.007 -0.002 0.002DR -0.007 *** 0.000 0.001 -0.006 *** -0.004 *** -0.002GTA -0.010 ** -0.009 *** -0.002 -0.001 -0.006 ** -0.004Turn 0.000 0.000 0.000 0.000 -0.002 ** 0.001Vol3Y -0.031 *** -0.030 *** -0.014 *** -0.021 ** 0.017 *** -0.023 ***
BPR -0.001 *** 0.000 0.000 -0.001 -0.001 *** 0.000FDR -0.001 0.005 -0.009 -0.006 -0.003 0.005
Adjusted R2 0.271 0.108 0.276 0.035 0.043 0.280
Intercept 2.031 *** 0.763 *** 0.966 *** 0.567 *** 0.587 *** 1.002 ***
ΔFOR 0.020 ** 0.003 0.005 0.006 0.003 0.012 **
ROA 0.007 0.009 * 0.003 -0.008 -0.004 0.001DR -0.008 *** -0.001 0.000 -0.007 *** -0.005 *** -0.002 *
GTA -0.008 * -0.008 ** 0.000 0.001 -0.004 -0.003Turn -0.001 0.000 0.000 0.000 -0.002 *** 0.000Vol3Y -0.031 *** -0.026 *** -0.012 *** -0.019 *** 0.016 *** -0.022 ***
BPR -0.001 ** 0.000 0.000 0.000 -0.001 ** 0.000FDR -0.003 0.006 -0.012 ** -0.009 -0.003 0.003
Adjusted R2 0.278 0.109 0.274 0.041 0.043 0.285
Intercept 2.064 *** 0.781 *** 1.017 *** 0.543 *** 0.579 *** 0.996 ***
Δ IND -0.002 -0.003 0.002 -0.004 0.000 0.004ROA 0.011 0.012 ** 0.003 -0.004 0.000 0.004DR -0.007 *** 0.000 0.000 -0.007 *** -0.004 *** -0.001GTA -0.010 ** -0.008 ** 0.000 -0.001 -0.005 * -0.004 *
Turn 0.000 0.000 0.000 0.000 -0.002 ** 0.001 *
Vol3Y -0.029 *** -0.027 *** -0.014 *** -0.018 ** 0.018 *** -0.023 ***
BPR -0.001 ** 0.000 0.000 0.000 -0.001 ** 0.000FDR 0.000 0.006 -0.010 -0.008 -0.003 0.006 *
Adjusted R2 0.273 0.104 0.274 0.035 0.039 0.273
Past 5 Years Increase in Shares Held by Domestic Institutions and Firms' CSP
CSP EMP SC SS IG ENV
Past 5 Years Increase in Shares Held by Foreign Institutions and Firms' CSP
CSP EMP SC SS IG ENV
Past 5 Years Increase in Shares Held by Individual Investors and Firms' CSP
CSP EMP SC SS IG ENV

37
Table A1. Definition of Sector Classification
Based on 33 industry classifications by Tokyo Stock Exchange, we re-define seven sectors below
following Kubota and Takehara (2007).
Sector Industry Sector Industry
Fishery and Agriculture CommunicationFoods Wholesale TradeTextiles and Apparels Retail TradePharmaceutical ServicesElectric AppliancesOther Products BanksMining SecuritiesConstruction InsurancePulp and Paper Other Financing BusinessChemicalsOil and Coal Products Land TransportationRubber Products Marine TransportationGlass and Ceramics Products Air TransportationIron and Steel
Nonferrous Metals Utility Electric Power and Gas
Metal Products
Machinery WarehousingTransportation Equipment Real EstatePrecision Instruments
ConsumptionGoods
InvestmentGoods
Services
Financial
Transportation
Real Estate

38
Table A2. Adopted Questions from CSR Survey of Toyo Keizai CSR Database
Evaluation Point Weights
Employee Relations (EMP)
1 Ratio of female employees to total employees -0.233
2 Ratio of female managers to total managers -0.301
3 Ratio of phisically handicapped employees to total employees -0.305
4 Ratio of old employees (60 years old and over) to total employees -0.275
5 Average years of continuous employment -0.141
6 Labor turnover rate -0.318
7 Average salary for a 30 years old -0.306
8 Overtime hours -0.329
9 Overtime wage per hour -0.351
10 Rate of paid holidays taken -0.342
11 Frequency rates of industrial injuries -0.244
12 Flexible work arrangement (flex-time, short-time working, on-site child care, etc.) -0.191
13 Incentive program (internal venture, bonus plan, education program etc.) -0.165
Social Contribution (SC)
1 Comprehensive evaluation (CSR department, director in charge, CSR document etc.) -0.442
2 Corporate ethics (guidelines, business ethics document, etc.) -0.259
3 Department of social actions -0.693
4 Social expenditure per employee -0.438
5 Matching gift and voluntier grant programs -0.256
Security of the Firm and Product Safeness (SS)
1 Specialty divisions on investor relations, consumer affairs, cooperation with NPO. -0.282
2 Whisle-blower policy -0.132
3 Specialty department for managing quality and safety of products and services -0.907
4 Ratio of domestic business offices with ISO9000 certification -0.201
5 Ratio of foreign business offices with ISO9000 certification -0.202
Internal Governance and Risk Management (IG)
1 Comprehensive evalusation (whisle-blower protection, CSR manual, complaint DB, etc.) -0.191
2 Existence/nonexistence of complience department -0.450
3 Existence/nonexistence of CIO -0.579
4 Existence/nonexistence of CFO -0.601
5 Information systems (security policy, internal/external auditiing etc.) -0.220
6 Comprehensive evaluation (fair trade, complience, closedown in the past 3 years, etc.) -0.128
Environment Preservations (ENV)
1 Environmental planning department, director in charge of environmental affairs, etc. -0.497
2 Environmental accounting, disclosure and auditiing. -0.558
3 Ratio of environment related business to total revenue -0.431
4 Promotion of procurement of eco-friendly goods and services -0.462
5 Ecolabelling (ISO14020 series etc.) -0.198
6 Environment related complience (environmental disasters, law violation, etc.) -0.050