Wiemers butterflies as indicators
20
Butterflies as indicators: responses of butterfly populations to climatic fluctuations in Germany Martin Wiemers, Alexander Harpke, Elisabeth Kühn, Martin Musche, Oliver Schweiger, Josef Settele, Marten Winter
-
Upload
jacqueline-loos -
Category
Presentations & Public Speaking
-
view
116 -
download
0
Transcript of Wiemers butterflies as indicators

Butterflies as indicators: responses of butterfly populations to climatic fluctuations in Germany Martin Wiemers, Alexander Harpke, Elisabeth Kühn, Martin Musche, Oliver Schweiger, Josef Settele, Marten Winter

Background
• Research project on monitoring climate change and biodiversity in the German Free State of Saxony
• Development of biodiversity indicators for climate change
• Evaluation of available data • Impact of climate change on
• Community composition • Distribution ranges
SEITE 2

Temperature trend in Dresden 1812-2009
SEITE 3
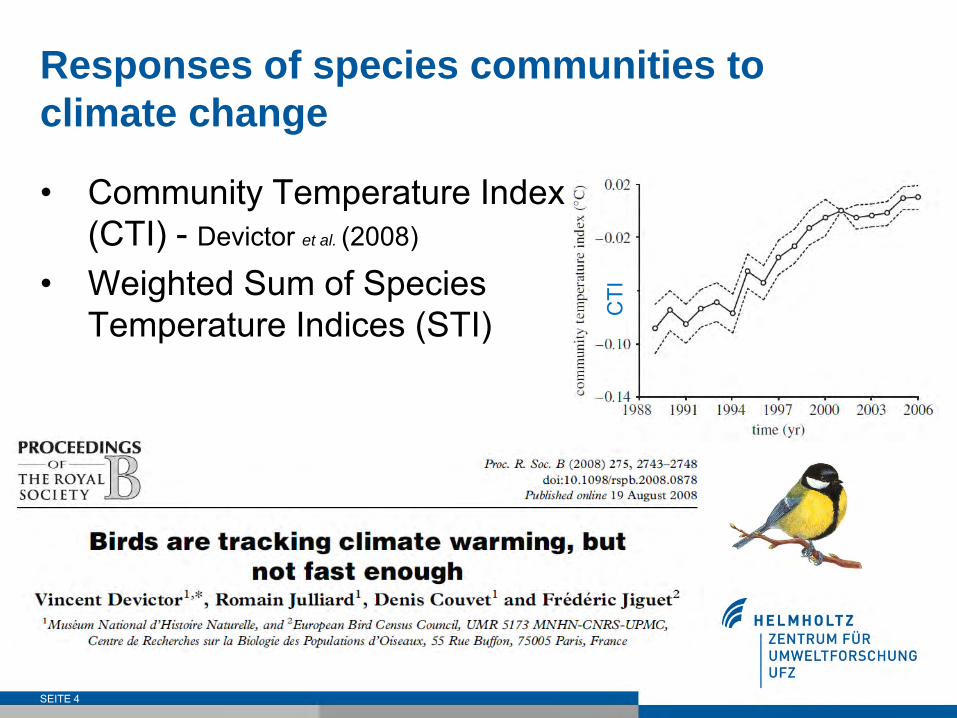
Responses of species communities to climate change
• Community Temperature Index (CTI) - Devictor et al. (2008)
• Weighted Sum of Species Temperature Indices (STI)
SEITE 4
CTI

Community Temperature Index in Butterflies
• Positive temporal trend of CTI in European Butterflies 1990-2009 (Van Swaay et al. 2008, 2010)
• European variations in trend of bird & butterfly CTI (Devictor et al. 2012 in Nature Climate Change)
SEITE 5

SEITE 6
Annual mean temperatures in Europe: Basis for Species Temperature Indices (STI)
Reference period: 1961-1990 Leipzig: 8.8 Sachsen: 8.1

SEITE 7
STI examples in butterflies
Colias palaeno: 3.62
Hipparchia statilinus: 11.82
Boreo-alpine species:
Mediterranean species:

Butterflies of Saxony • 140 species • Good temporal coverage for 36 years
(1975-2010) with >1000 records/year • Excellent spatial coverage • 43% of records without abundance data
SEITE 8

Butterfly Monitoring Germany (TMD) • 149 species • Monitoring data • Temporal coverage for 5 years
(2006-2010) • Limited spatial coverage
SEITE 10

CTI correlation with climatic fluctuations
SEITE 11
Correlation with annual mean temperature: 0.55, p<0.001***
▬ Saxony annual mean temperature ▬ CTI

Considering generation time
SEITE 13
Better Correlation (0,64) with the sliding 3-year mean of the current and 2 previous years
Generation length up to one year
Temperature of previous years decisive
▬ Annual mean temperature ▬ Mean temp. of the last 3 years ▬ CTI
Year x 0.549 *** 0.632 ***
0.637 *** 0.584 ** x-1 0.496 ** 0.491 **
0.424 * x-2 0.324 0.260 x-3

Correlation between CTI and annual mean temperatures across Europe
SEITE 14
0 5 10 15
05
1015
Mean annual temperature
CTI
Nearly linear correlation with an increase of 0.33
Saxony 1975-2010: Increase of
ann. mean: 0.0288 Projected CTI: 0.0095 Observed CTI: 0.0046 Difference: factor 0.5

Robustness of CTI
SEITE 15
CTI is robust to selection of species Exceptional immigration events may influence CTI
▬ without Colias crocea ▬ with Colias crocea

CTI – TMD Regions
SEITE 18
Yearx -0.169x-1 0.940 **x-2 0.518x-3 -0.316
0.558
0.1300.944 **
0.7180.825 *
0.781
• Strong correlation between CTI and the temperature mean of the previous year
SEITE 19
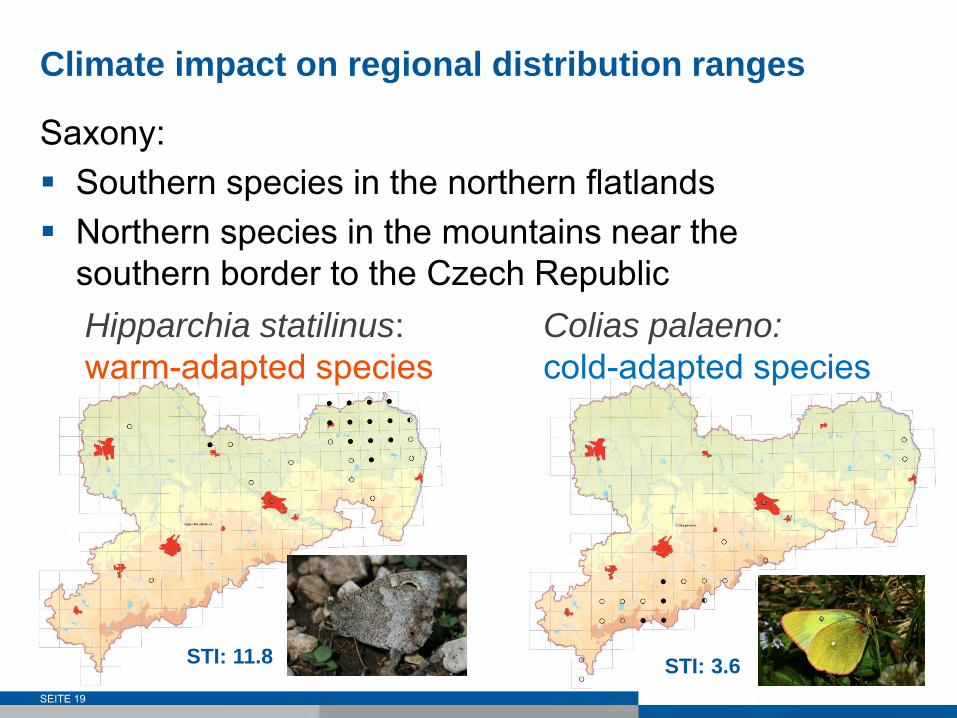
Climate impact on regional distribution ranges
Saxony: Southern species in the northern flatlands Northern species in the mountains near the
southern border to the Czech Republic
Hipparchia statilinus: warm-adapted species
Colias palaeno: cold-adapted species
STI: 11.8 STI: 3.6

SEITE 20
STI-based Areal Index Sum of occupied grid cells (e.g. MTB) of
southern versus northern species based on and weighted by the difference of each species‘ STI from the mean CTI
Examples of STI differences: The butterfly genus Colias: Colias alfacariensis 9.94 1.176Colias crocea 10.69 1.923Colias erate 10.03 1.266Colias hyale 8.37 -0.397Colias palaeno 3.62 -5.146
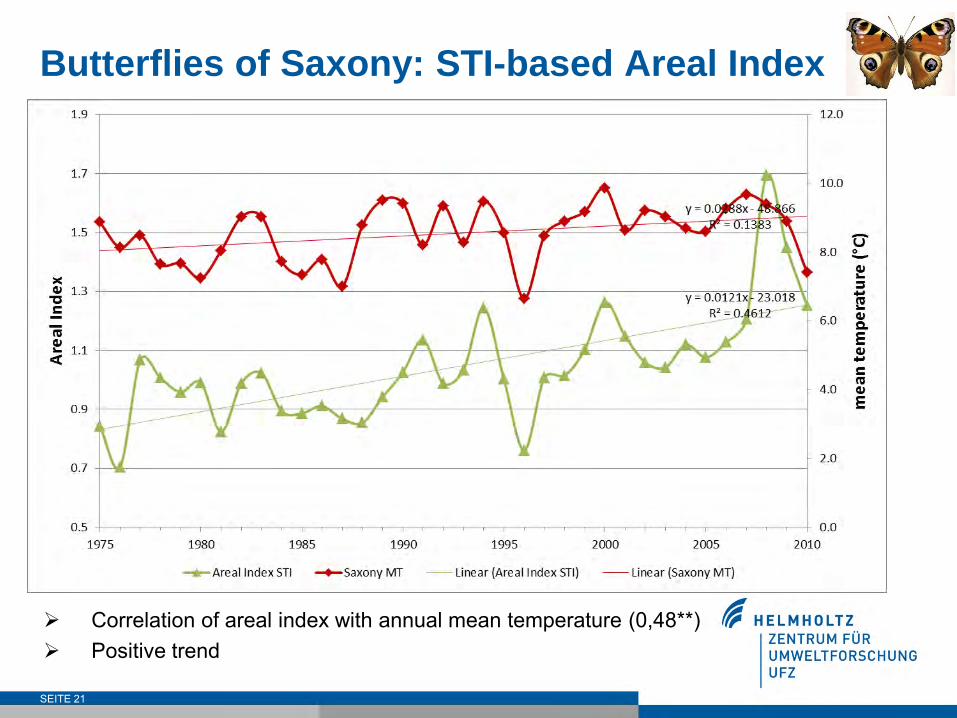
Butterflies of Saxony: STI-based Areal Index
SEITE 21
Correlation of areal index with annual mean temperature (0,48**) Positive trend

Areal Index vs. CTI in Butterflies of Saxony
SEITE 22
Very high correlation AISTI ↔ CTI: 0,93***
▬ Areal Index (STI-based) ▬ CTI

Conclusions • CTI indicates change of community composition
towards warm-adapted species during the last 2-3 decades
• CTI is a robust biodiversity indicator for climate change, but works best with monitoring data
• CTI is sensitive to short-term climatic fluctuations in animals with short generation times
• The extent of CTI fluctuations strongly depends on generation length
• STI values can be used to assess climate-driven range changes
• Climate-driven range changes strongly correlate with changes in community composition
SEITE 23

Thank you for your attention!
• Recorders and contributors to the Butterfly Fauna of Saxony and the Butterfly Monitoring Scheme Germany (TMD)
• Rolf Reinhardt and the „Sächsisches Landesamt für Umwelt, Landwirtschaft und Geologie (LfULG)“ for data
• Ingolf Kühn and members of the Department of Community Ecology for helpful discussions
SEITE 25
Acknowledgements