Who's Who Among Special Finance Companies (2015)
23
Who's Who Among Special Finance Companies What Companies Are Buying Which Customers? DEALERSTRONG Greg Goebel, CEO
-
Upload
dealerstrong -
Category
Automotive
-
view
329 -
download
0
Transcript of Who's Who Among Special Finance Companies (2015)

Who's Who Among Special Finance Companies
What Companies Are Buying Which Customers?
DEALERSTRONGGreg Goebel, CEO
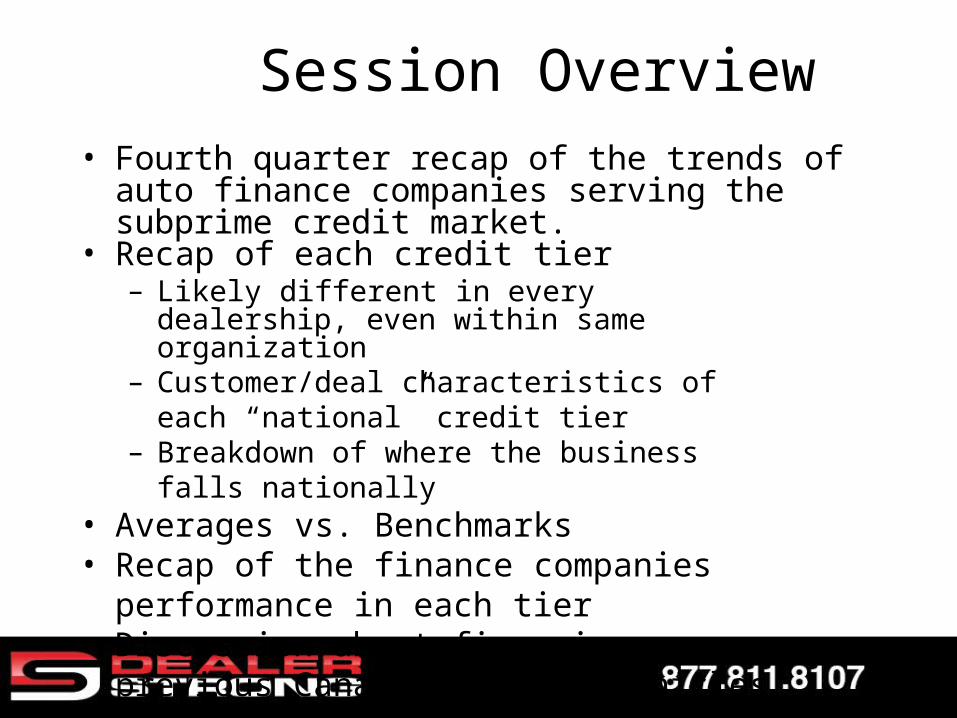
Session Overview• Fourth quarter recap of the trends of auto finance
companies serving the subprime credit market.• Recap of each credit tier
– Likely different in every dealership, even within same organization
– Customer/deal characteristics of each “national” credit tier
– Breakdown of where the business falls nationally• Averages vs. Benchmarks• Recap of the finance companies performance in
each tier• Discussion about financing previous Canadian
titled vehicles

Data Sampling• Cooperative effort - DealerStrong and ProMax Unlimited• Merged transactional deal data beginning May 2014.• Nearly 1.5M transactions from over 750 dealers who report
sales data tied to credit scores.• Data was scrubbed many times to validate each
transaction.• Averages and benchmark deal characteristics for each
credit tier developed (including near-prime and prime).• Identify the most frequently and profitably financed
vehicles.
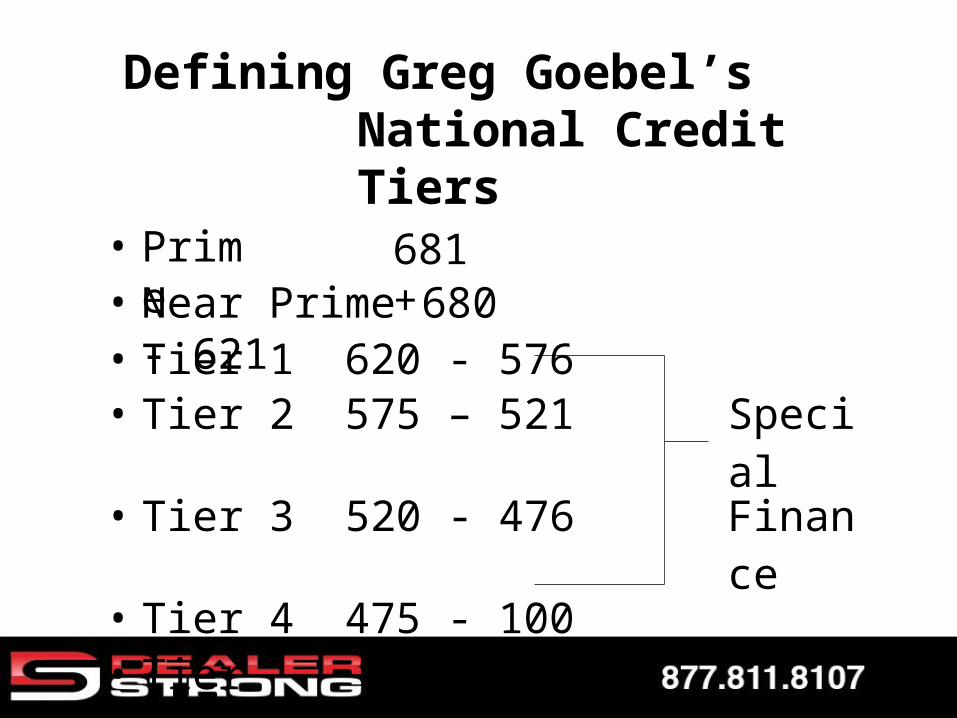
Defining Greg Goebel’s National Credit Tiers
• Prime 681+• Near Prime 680 - 621• Tier 1 620 - 576• Tier 2 575 – 521 Special• Tier 3 520 - 476 Finance• Tier 4 475 - 100• Tier Zero 0
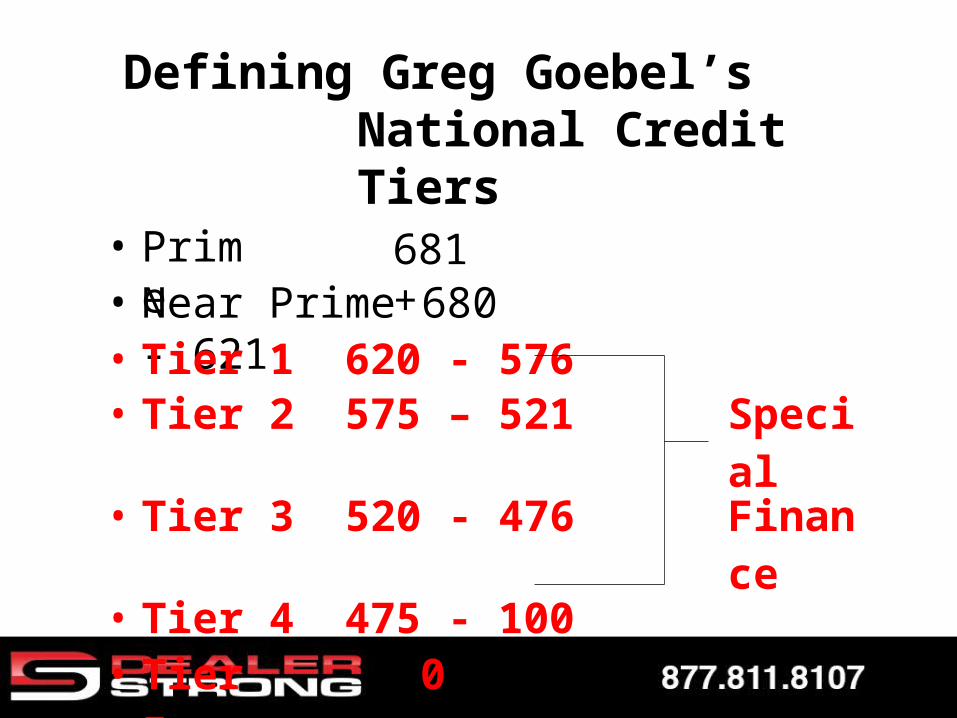
Defining Greg Goebel’s National Credit Tiers
• Prime 681+• Near Prime 680 - 621• Tier 1 620 - 576• Tier 2 575 – 521 Special• Tier 3 520 - 476 Finance• Tier 4 475 - 100• Tier Zero 0
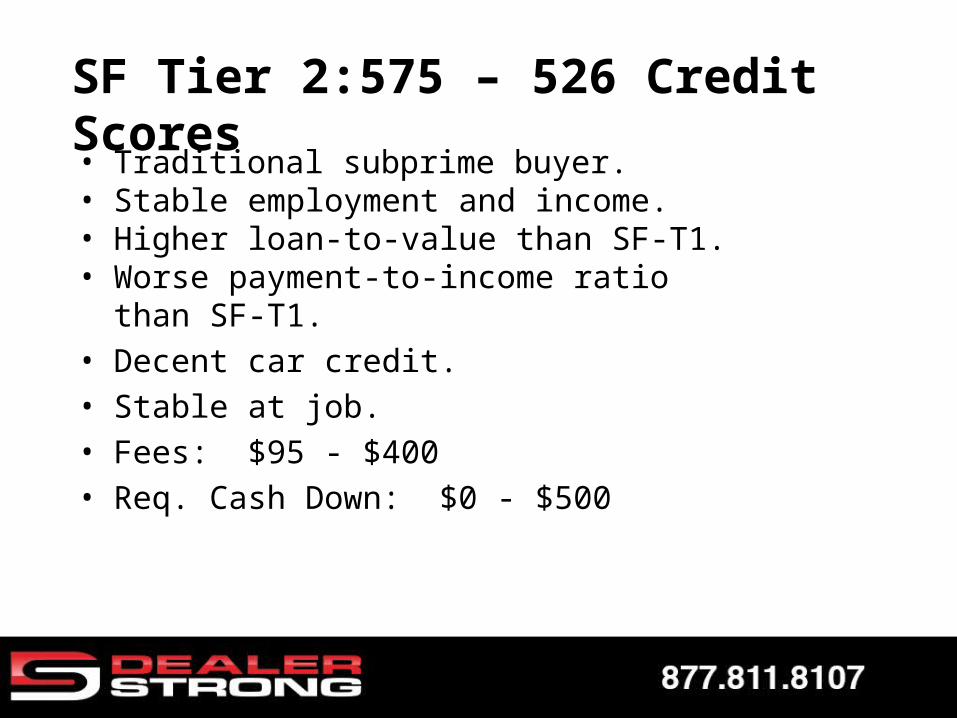
SF Tier 2: 575 – 526 Credit Scores• Traditional subprime buyer.• Stable employment and income.• Higher loan-to-value than SF-T1.• Worse payment-to-income ratio than SF-T1.• Decent car credit.• Stable at job.• Fees: $95 - $400• Req. Cash Down: $0 - $500
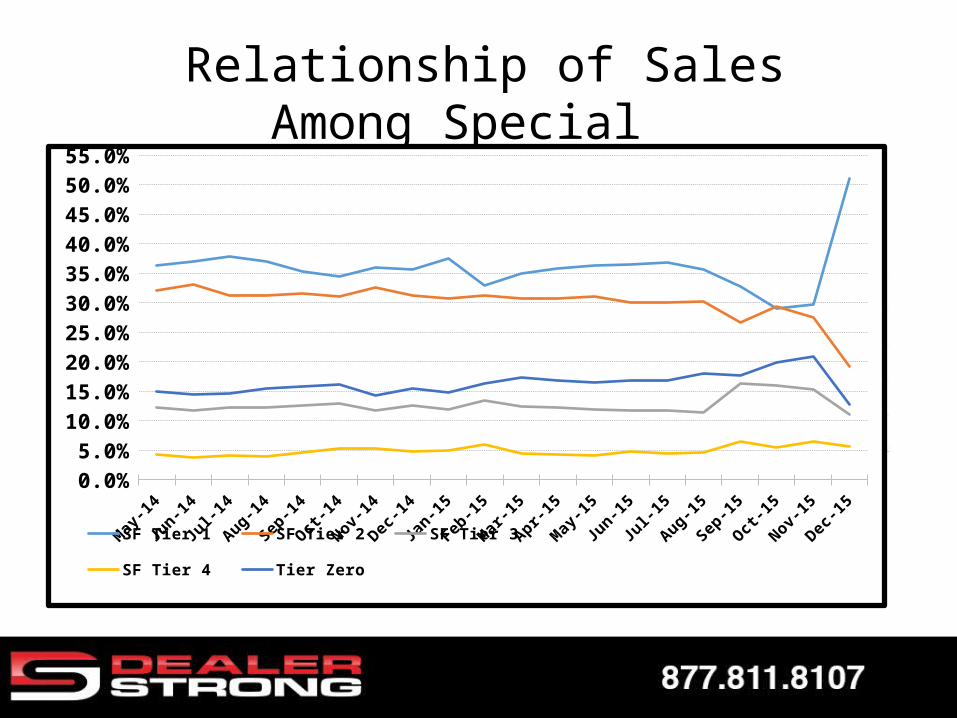
Relationship of Sales Among Special Finance Tiers
0.0%5.0%
10.0%15.0%20.0%25.0%30.0%35.0%40.0%45.0%50.0%55.0%
SF Tier 1 SF Tier 2 SF Tier 3 SF Tier 4 Tier Zero

SF Tier 3 525 – 476 Credit Scores
• Tier where you earn your keep.• Shorter job time, gaps. • Verifiable but lower income.• Fees: $500 - $1,000 Required cash down:
$1,000+• Some good credit – more derog. Likely prior repo
or foreclosure.• LTVs 90% - 105%.• PTI ratios 12% - 15%
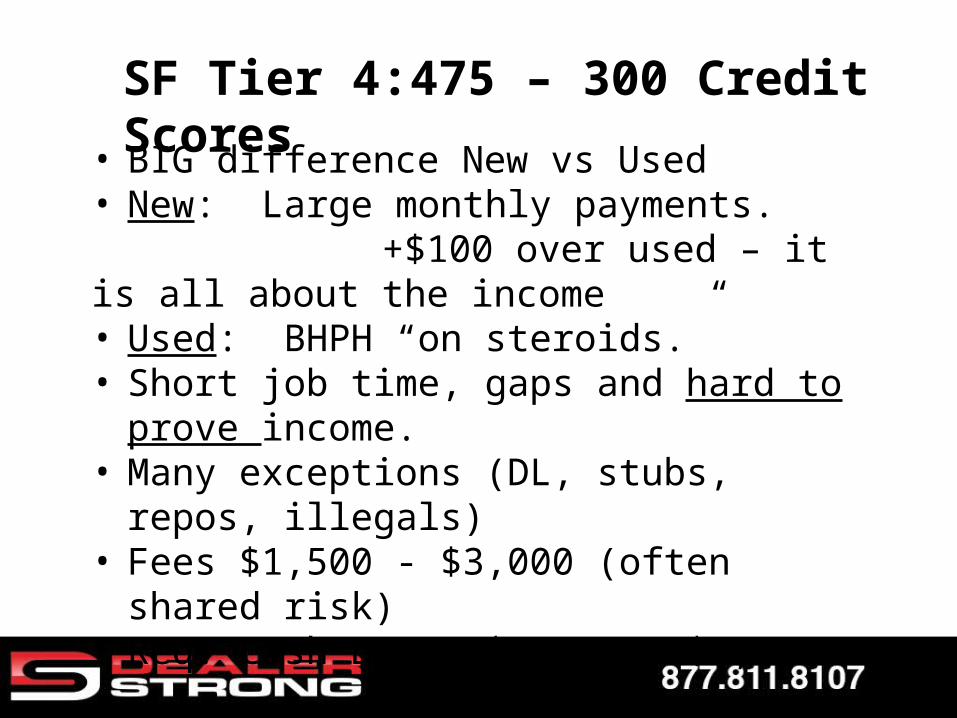
SF Tier 4: 475 – 300 Credit Scores• BIG difference New vs Used• New: Large monthly payments. +$100 over used – it is all about the income• Used: BHPH “on steroids.”• Short job time, gaps and hard to prove income.• Many exceptions (DL, stubs, repos, illegals)• Fees $1,500 - $3,000 (often shared risk)• Req. Cash Down: $1,500 - $3,000

Special Finance Zero Credit Scores
• Can be credit “ghost” or credit criminal• Affordability (PTI) with shorter terms is key.• Significant equity• In some states, “non-documented” aliens.• Fees: 10% - $2,500.• Req. Cash Down: 10% - $3,000• Tier grew by over 20% in 2015!
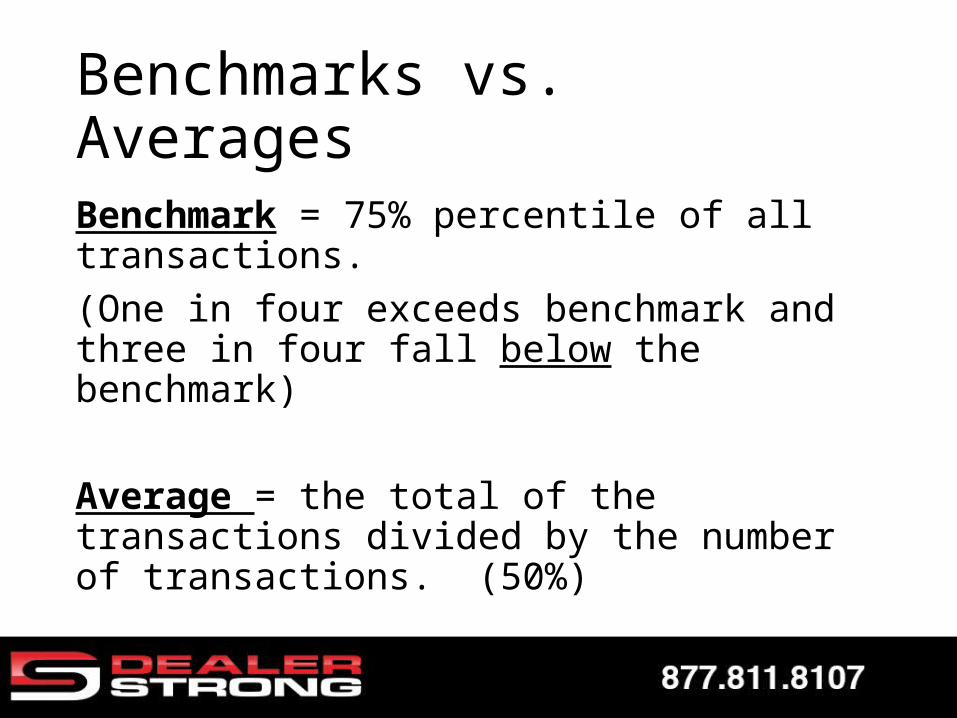
Benchmarks vs. AveragesBenchmark = 75% percentile of all transactions.(One in four exceeds benchmark and three in four fall below the benchmark)
Average = the total of the transactions divided by the number of transactions. (50%)
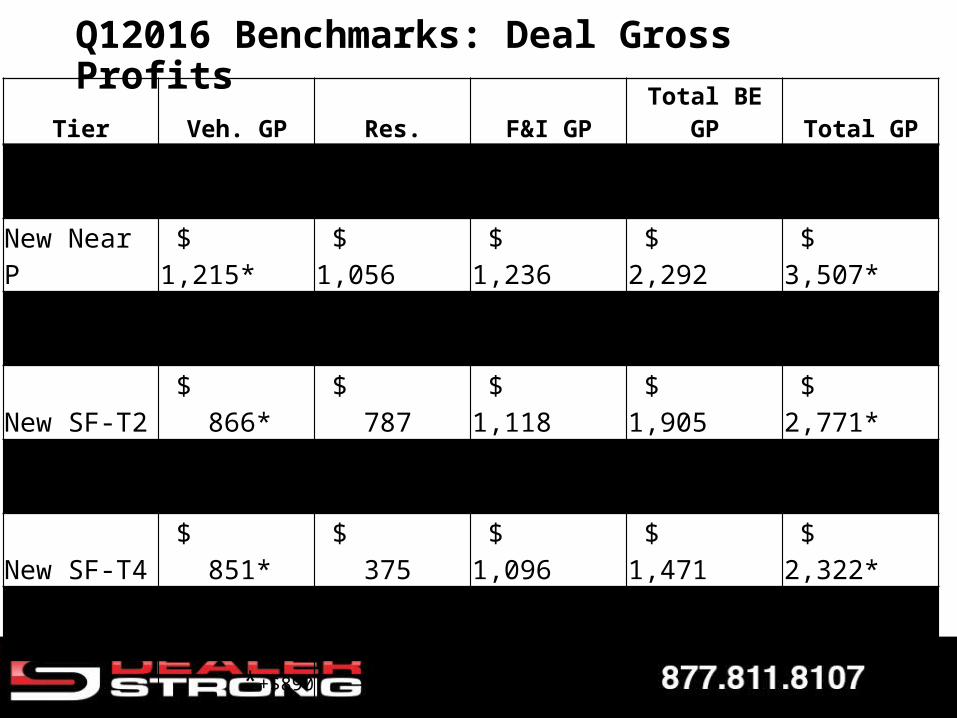
Q12016 Benchmarks: Deal Gross ProfitsTier Veh. GP Res. F&I GP Total BE GP Total GP
New Prime $ 1,317* $ 752 $ 809 $ 1,561 $ 2,878* New Near P $ 1,215* $ 1,056 $ 1,236 $ 2,292 $ 3,507* New SF-T1 $ 1,037* $ 713 $ 1,144 $ 1,857 $ 2,894* New SF-T2 $ 866* $ 787 $ 1,118 $ 1,905 $ 2,771* New SF-T3 $ 1,138* $ 778 $ 1,306 $ 2,084 $ 3,222* New SF-T4 $ 851* $ 375 $ 1,096 $ 1,471 $ 2,322* New SF-TNS $ 963* $ 415 $ 1,147 $ 1,562 $ 2,525*
*+$890 dlr inc.
Used Prime $ 2,348 $ 629 $ 878 $ 1,507 $ 3,855 Used Near P $ 2,376 $ 668 $ 999 $ 1,667 $ 4,043 Used SF-T1 $ 2,195 $ 557 $ 773 $ 1,330 $ 3,525 Used SF-T2 $ 2,130 $ 477 $ 695 $ 1,172 $ 3,302 Used SF-T3 $ 2,190 $ 293 $ 328 $ 621 $ 2,811 Used SF-T4 $ 2,225 $ 262 $ 530 $ 792 $ 3,017 Used SF-TNS $ 2,183 $ 382 $ 825 $ 1,207 $ 3,390

1Q2016 Average Finance Company Transaction Data• Ranked by used credit tiers SF-T2 through SF-TNS• NOT the same as benchmark.• Comparison of the two shows that the difference
between average and benchmark results is that the benchmark deals the transaction data is similar but benchmark deals have:• Better inventory sourcing (same vehicles/lower cost)• Better deal structure, more room left for F&I products
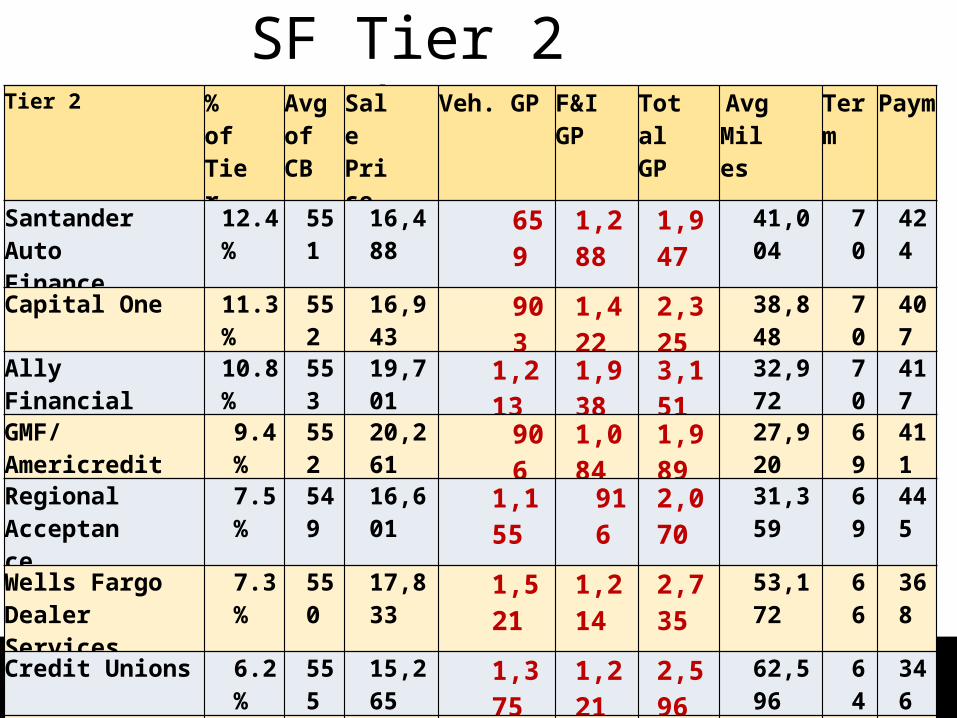
SF Tier 2 LeadersTier 2 % of
TierAvg of CB
Sale Price
Veh. GP F&I GP Total GP
Avg Miles
Term Paym
Santander Auto Finance
12.4% 551 16,488 659 1,288 1,947 41,004 70 424
Capital One 11.3% 552 16,943 903 1,422 2,325 38,848 70 407
Ally Financial 10.8% 553 19,701 1,213 1,938 3,151 32,972 70 417
GMF/Americredit 9.4% 552 20,261 906 1,084 1,989 27,920 69 411
Regional Acceptance
7.5% 549 16,601 1,155 916 2,070 31,359 69 445
Wells Fargo Dealer Services
7.3% 550 17,833 1,521 1,214 2,735 53,172 66 368
Credit Unions 6.2% 555 15,265 1,375 1,221 2,596 62,596 64 346
CPS 5.1% 547 15,845 1,497 751 2,248 47,548 67 406
Credit Acceptance 4.9% 549 10,989 1,407 381 1,787 94,248 55 347

SF Tier 2 Leaders (avg used deals)Tier 2 % of Tier Average of CB Amt Fin. Cash Down Incen. FE pft. F&I GP Avg Miles Term Paym.
Capital One $ 17,514 $ 1,213 0 $ 1,089 $ 935 48789 69 $ 407
Ally Financial 10.9% 553 $ 18,242 $ 1,016 0 $ 1,377 $ 876 50755 69 $ 388
Santander Auto Finance 9.0% 549 $ 16,007 $ 1,603 4 $ 742 $ 788 53252 67 $ 390
Credit Acceptance 8.6% 547 $ 13,252 $ 1,509 0 $ 1,468 $ 360 85675 58 $ 379
Wells Fargo Dealer Services 8.1% 552 $ 17,080 $ 1,488 0 $ 1,069 $ 598 65474 65 $ 361
CPS 7.8% 546 $ 15,216 $ 875 0 $ 1,470 $ 262 53294 66 $ 386
Credit Union 7.6% 551 $ 16,036 $ 656 0 $ 1,547 $ 934 70154 63 $ 336
Regional Acceptance 6.9% 550 $ 18,319 $ 620 0 $ 1,437 $ 951 40229 69 $ 439
Prestige Financial 6.5% 551 $ 16,600 $ 543 0 $ 1,222 $ 542 41734 69 $ 402
GMF/Americredit 5.5% 549 $ 17,857 $ 1,289 0 $ 1,395 $ 425 50858 68 $ 403
Flagship Credit Acceptance 4.0% 552 $ 18,030 $ 758 0 $ 973 $ 987 40825 72 $ 406
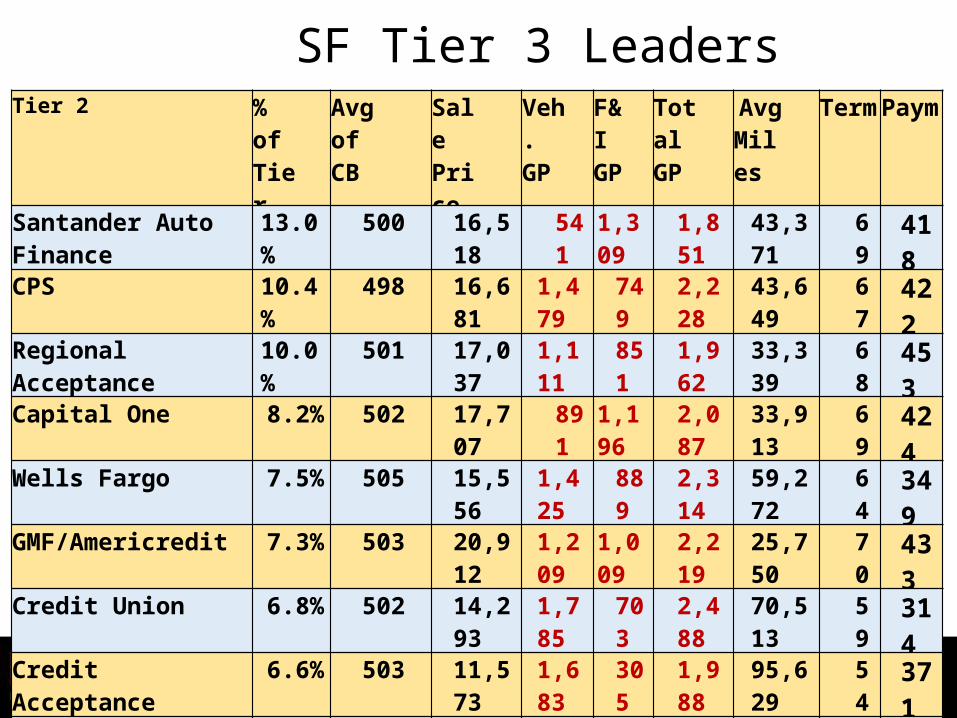
SF Tier 3 LeadersTier 2 % of
TierAvg of CB
Sale Price
Veh. GP
F&I GP
Total GP
Avg Miles
Term Paym
Santander Auto Finance 13.0% 500 16,518 541 1,309 1,851 43,371 69 418CPS 10.4% 498 16,681 1,479 749 2,228 43,649 67 422Regional Acceptance 10.0% 501 17,037 1,111 851 1,962 33,339 68 453Capital One 8.2% 502 17,707 891 1,196 2,087 33,913 69 424Wells Fargo 7.5% 505 15,556 1,425 889 2,314 59,272 64 349GMF/Americredit 7.3% 503 20,912 1,209 1,009 2,219 25,750 70 433Credit Union 6.8% 502 14,293 1,785 703 2,488 70,513 59 314Credit Acceptance 6.6% 503 11,573 1,683 305 1,988 95,629 54 371Prestige Financial 6.1% 500 15,815 1,726 958 2,684 42,647 69 426Ally Financial 5.1% 503 17,968 1,238 1,939 3,177 35,031 69 408
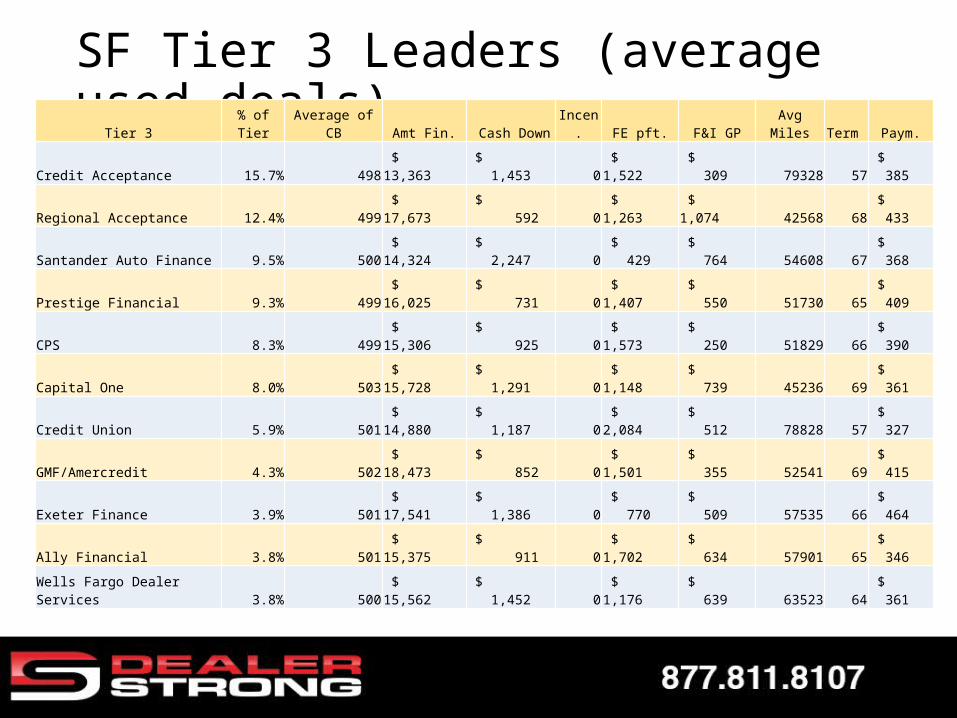
SF Tier 3 Leaders (average used deals)
Tier 3 % of Tier Average of CB Amt Fin. Cash Down Incen. FE pft. F&I GP Avg Miles Term Paym.
Credit Acceptance 15.7% 498 $ 13,363 $ 1,453 0 $ 1,522 $ 309 79328 57 $ 385
Regional Acceptance 12.4% 499 $ 17,673 $ 592 0 $ 1,263 $ 1,074 42568 68 $ 433
Santander Auto Finance 9.5% 500 $ 14,324 $ 2,247 0 $ 429 $ 764 54608 67 $ 368
Prestige Financial 9.3% 499 $ 16,025 $ 731 0 $ 1,407 $ 550 51730 65 $ 409
CPS 8.3% 499 $ 15,306 $ 925 0 $ 1,573 $ 250 51829 66 $ 390
Capital One 8.0% 503 $ 15,728 $ 1,291 0 $ 1,148 $ 739 45236 69 $ 361
Credit Union 5.9% 501 $ 14,880 $ 1,187 0 $ 2,084 $ 512 78828 57 $ 327
GMF/Amercredit 4.3% 502 $ 18,473 $ 852 0 $ 1,501 $ 355 52541 69 $ 415
Exeter Finance 3.9% 501 $ 17,541 $ 1,386 0 $ 770 $ 509 57535 66 $ 464
Ally Financial 3.8% 501 $ 15,375 $ 911 0 $ 1,702 $ 634 57901 65 $ 346
Wells Fargo Dealer Services 3.8% 500 $ 15,562 $ 1,452 0 $ 1,176 $ 639 63523 64 $ 361
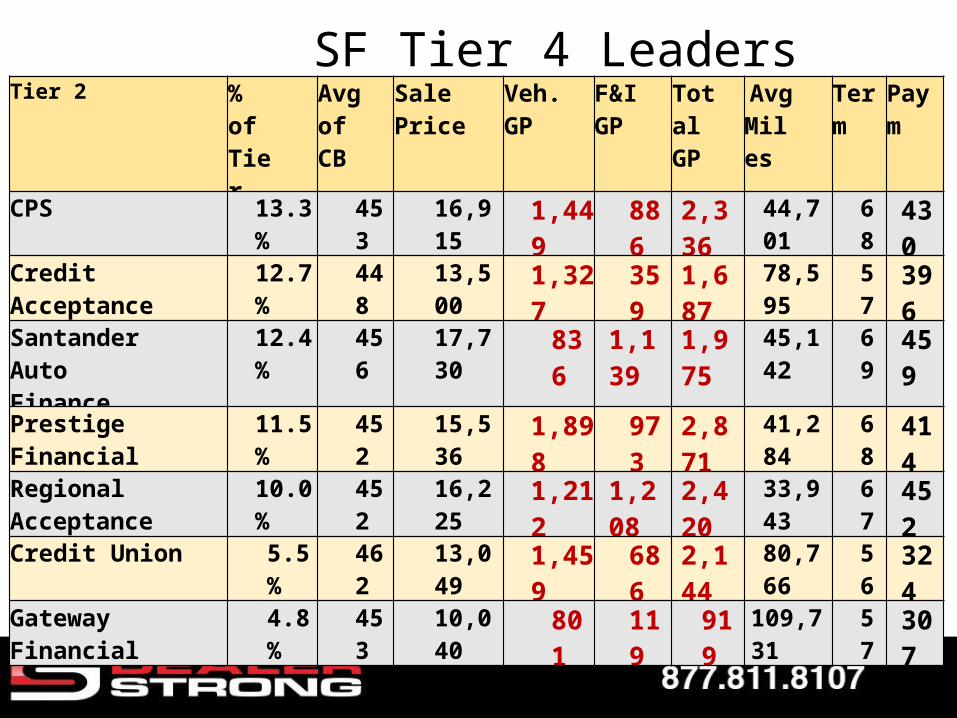
SF Tier 4 LeadersTier 2 % of
TierAvg of CB
Sale Price Veh. GP F&I GP Total GP
Avg Miles
TermPaym
CPS 13.3% 453 16,915 1,449 886 2,336 44,701 68 430
Credit Acceptance 12.7% 448 13,500 1,327 359 1,687 78,595 57 396
Santander Auto Finance
12.4% 456 17,730 836 1,139 1,975 45,142 69 459
Prestige Financial 11.5% 452 15,536 1,898 973 2,871 41,284 68 414
Regional Acceptance 10.0% 452 16,225 1,212 1,208 2,420 33,943 67 452
Credit Union 5.5% 462 13,049 1,459 686 2,144 80,766 56 324
Gateway Financial 4.8% 453 10,040 801 119 919 109,731 57 307
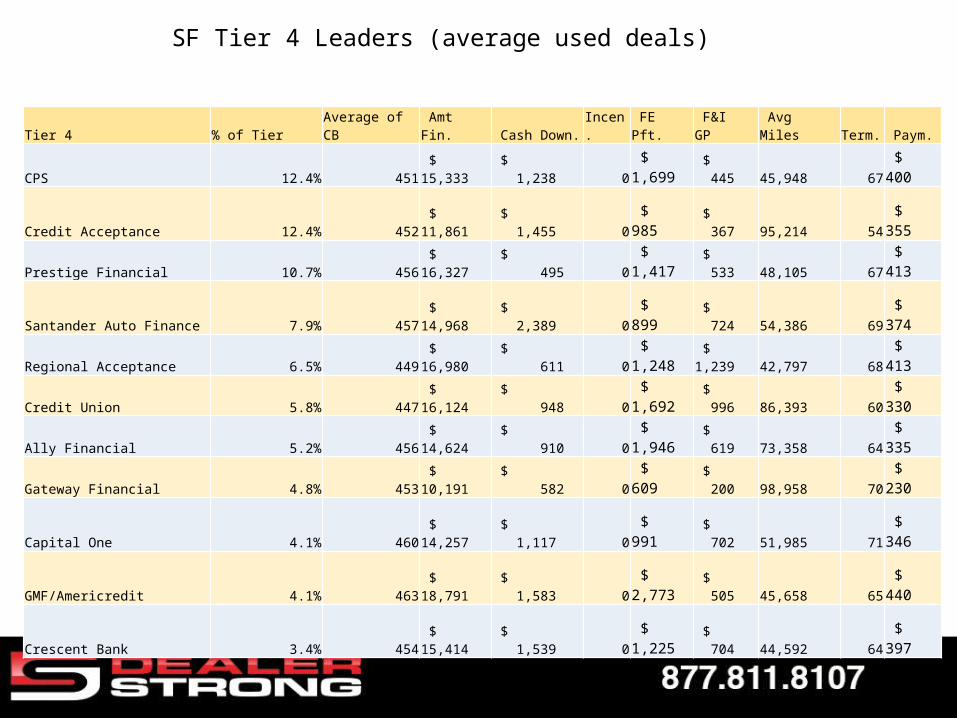
Tier 4 % of Tier Average of CB Amt Fin. Cash Down. Incen. FE Pft. F&I GP Avg Miles Term. Paym.
CPS 12.4% 451 $ 15,333 $ 1,238 0 $ 1,699 $ 445 45,948 67 $ 400
Credit Acceptance 12.4% 452 $ 11,861 $ 1,455 0 $ 985 $ 367 95,214 54 $ 355
Prestige Financial 10.7% 456 $ 16,327 $ 495 0 $ 1,417 $ 533 48,105 67 $ 413
Santander Auto Finance 7.9% 457 $ 14,968 $ 2,389 0 $ 899 $ 724 54,386 69 $ 374
Regional Acceptance 6.5% 449 $ 16,980 $ 611 0 $ 1,248 $ 1,239 42,797 68 $ 413
Credit Union 5.8% 447 $ 16,124 $ 948 0 $ 1,692 $ 996 86,393 60 $ 330
Ally Financial 5.2% 456 $ 14,624 $ 910 0 $ 1,946 $ 619 73,358 64 $ 335
Gateway Financial 4.8% 453 $ 10,191 $ 582 0 $ 609 $ 200 98,958 70 $ 230
Capital One 4.1% 460 $ 14,257 $ 1,117 0 $ 991 $ 702 51,985 71 $ 346
GMF/Americredit 4.1% 463 $ 18,791 $ 1,583 0 $ 2,773 $ 505 45,658 65 $ 440
Crescent Bank 3.4% 454 $ 15,414 $ 1,539 0 $ 1,225 $ 704 44,592 64 $ 397
SF Tier 4 Leaders (average used deals)

SF Tier Zero LeadersNo Score % of
TierAvg. of CB
SalePrice Veh. GP F&I GP Total GP
Avg Miles
Term Paym
Santander Auto Finance
19.5% 0 15,877 364 1,438 1,802 38,310 70 423
Credit Union 16.6% 0 14,967 1,325 1,281 2,606 63,258 63 307
Wells Fargo Dealer Services
8.4% 0 14,908 1,384 942 2,325 57,513 65 312
Credit Acceptance 7.8% 0 11,978 1,379 300 1,679 93,199 56 371
Capital One 7.2% 0 15,333 1,246 1,418 2,664 41,600 68 367
Ally Financial 5.8% 0 16,857 1,688 1,661 3,349 43,654 67 329
Regional Acceptance 5.6% 0 15,211 1,043 897 1,941 35,886 67 416
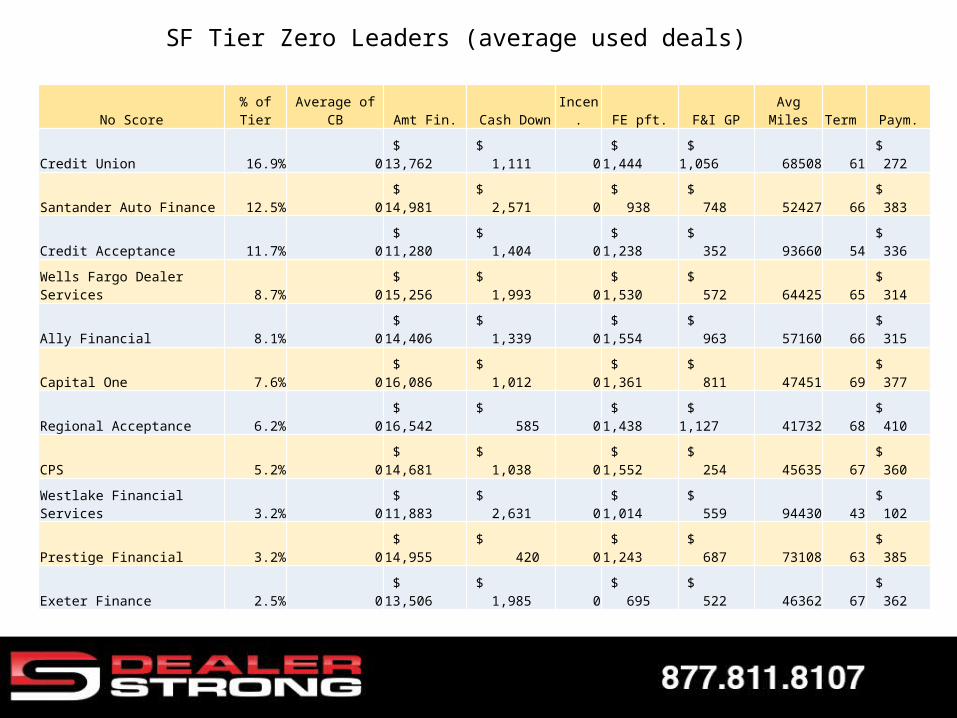
SF Tier Zero Leaders (average used deals)
No Score % of Tier Average of CB Amt Fin. Cash Down Incen. FE pft. F&I GP Avg Miles Term Paym.
Credit Union 16.9% 0 $ 13,762 $ 1,111 0 $ 1,444 $ 1,056 68508 61 $ 272
Santander Auto Finance 12.5% 0 $ 14,981 $ 2,571 0 $ 938 $ 748 52427 66 $ 383
Credit Acceptance 11.7% 0 $ 11,280 $ 1,404 0 $ 1,238 $ 352 93660 54 $ 336
Wells Fargo Dealer Services 8.7% 0 $ 15,256 $ 1,993 0 $ 1,530 $ 572 64425 65 $ 314
Ally Financial 8.1% 0 $ 14,406 $ 1,339 0 $ 1,554 $ 963 57160 66 $ 315
Capital One 7.6% 0 $ 16,086 $ 1,012 0 $ 1,361 $ 811 47451 69 $ 377
Regional Acceptance 6.2% 0 $ 16,542 $ 585 0 $ 1,438 $ 1,127 41732 68 $ 410
CPS 5.2% 0 $ 14,681 $ 1,038 0 $ 1,552 $ 254 45635 67 $ 360
Westlake Financial Services 3.2% 0 $ 11,883 $ 2,631 0 $ 1,014 $ 559 94430 43 $ 102
Prestige Financial 3.2% 0 $ 14,955 $ 420 0 $ 1,243 $ 687 73108 63 $ 385
Exeter Finance 2.5% 0 $ 13,506 $ 1,985 0 $ 695 $ 522 46362 67 $ 362
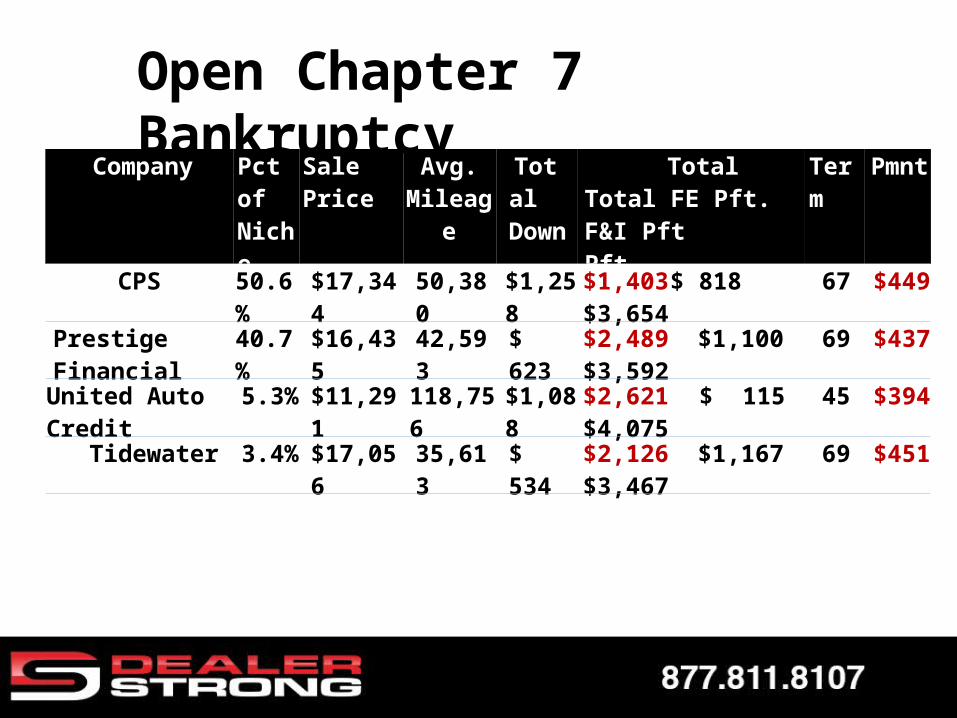
Open Chapter 7 BankruptcyCompany Pct of
NicheSale Price Avg.
MileageTotal Down
TotalTotal FE Pft. F&I Pft
Pft.
Term Pmnt
CPS 50.6% $17,344 50,380 $1,258 $1,403 $ 818$3,654
67 $449
Prestige Financial 40.7% $16,435 42,593 $ 623 $2,489 $1,100 $3,592
69 $437
United Auto Credit
5.3% $11,291 118,756 $1,088 $2,621 $ 115 $4,075 45 $394
Tidewater 3.4% $17,056 35,613 $ 534 $2,126 $1,167 $3,467
69 $451

Thank You.
For More Information:
Visit http://www.dealerstrong.com/ Call our office @ 877-811-8107