ปฏิบัติการปัจจัยสังคมกำหนดสุขภาพ สู่ความเป็นธรรมทางสุขภาพ - Social Determinants
OSIPP Discussion Paper : DP-2009-E-002
Who borrows among the poor? MC use determinants in Guatemala, with particular reference to social ties
January 14, 2009
Masako Hasegawa Ph.D. student, Osaka School of International Public Policy (OSIPP)
【Keywords】Micro Credit (MC), social ties, information asymmetry, creditworthiness, Guatemala,
【JEL code】C25, D14, Q14 【Abstract】Who borrows Micro Credit (MC) is the information needed to improve not only MC programs but also policies of poverty alleviation. This paper analyzes the MC use
determinants taking social ties into account using data in Guatemalan Living Standard
Measurement Study. It shows that the determinants are relatively different between the
poor and the non-poor. It also shows that social ties could raise the possibility of MC
utilization especially among the poor, which would verify the function of social ties as
collateral of creditworthiness. Those excluded from MC may not be the poorest but the
socially weakest.
Address: 1-31 Machikaneyama, Toyonaka, Osaka 560-0043 Japan, Tel /Fax: +81-6-6850-5839, E-mail address: [email protected] I thank Professor Naoto Yamauchi, Osaka
school of International Public Policy (OSIPP), Dr. Tsunehiro Ootsuki, associate professor of
OSIPP, and Professor Akira Kousaka, OSIPP, for their help and encouragement during the
preparation of this paper. I also thank Prof. Naoto Yamauchi for permitting me to publish
this paper.

Who borrows among the poor? MC use determinants in Guatemala, with particular reference to social ties
Masako Hasegawa
OSIPP, Osaka University
January 14, 2009
JEL Classification Codes: C25, D14, Q14
Key Words: Micro Credit (MC), social ties, information asymmetry, creditworthiness,
Guatemala
Abstract
Who borrows Micro Credit (MC) is the information needed to improve not only
MC programs but also policies of poverty alleviation. This paper analyzes the
MC use determinants taking social ties into account using data in Guatemalan
Living Standard Measurement Study. It shows that the determinants are
relatively different between the poor and the non-poor. It also shows that social
ties could raise the possibility of MC utilization especially among the poor, which
would verify the function of social ties as collateral of creditworthiness. Those
excluded from MC may not be the poorest but the socially weakest.

1
Introduction
Access to credit is an essential measure for poverty alleviation in developing countries when
the credit is used effectively for income generation activities or risk coping strategies.
Nevertheless, risky borrowers basically are refused unless adverse selection is introduced
under extremely high interest rates. Therefore, the poorest so far have been recognized as
those excluded from credit because of their economic riskiness (Hulme and Mosley, 1996;
Van Bastelaer, 2000)1. Then to what extent does credit for poverty alleviation such as Micro
Credit (MC) actually reach the poor as a whole? Is the widespread notion that MC favors the
wealthy poor really true? In this paper, who can access MC, namely the determinants of MC
use, is investigated empirically, with MC defined as a small credit by financial institutions
mainly for the poor2
Thus, in both direct and indirect mechanisms in rural credit markets, social ties are the
. Understanding attributes of MC borrowers could lead not only to better
designs of financial programs but also more efficient public policies enabling them.
In rural credit markets, there are two types of mechanisms to screen the trustworthy: direct
mechanisms and indirect mechanisms (Hoff and Stiglitz, 1990). The direct mechanisms
obviously rely on social ties between borrowers and lenders to overcome the information
asymmetry among them. Moreover, in rural communities that often are segmented socially
and geographically, information is circulated all the time and tends to be shared among
almost all villagers. Under such circumstances, borrowers’ information easily reaches
lenders’ ears, besides the direct information from the close relationships between borrowers
and lenders. Furthermore, if contracts are repeated in such close-knit societies, the problem
of information asymmetry is expected to be reduced greatly. In the indirect mechanisms,
group-lending also depends theoretically on social ties (Ghatak, 1999, 2000). According to
Ghatak (1999), in the process of group formation of group-lending, information provided by
social ties is utilized to select group members under the pressure of joint liability.
1 Hulme and Mosley (1996) organize their ideas from several case studies which are principally on income generating credits using group lending method. Van Bastelaer (2000) refers to this idea in the case of joint-liability groups as well. 2 Following the definition of Christen et al. (2004), MC is provided by such institutions as state-owned or agricultural banks, cooperatives, specialized microfinance institutions and non-governmental organizations, and can be distinguished from other credits provided by individuals.

2
basis for guaranteeing credit through abundant local information (Van Bastelaer, 2000). For
the poor without collateral, social ties should function just as the substitution of collateral to
guarantee their trustworthiness. Consequently, possessing abundant social ties should be an
important attribute for the poor MC borrowers. However, the social ties have not necessarily
been valued as MC determinants up to now.
At first, credit determinants were treated as control variables to analyze the impact of MC
because the borrowers’ attributes affect both selection of borrowers and impact on borrowers’
welfare (Pitt and Khandker, 1998; Coleman, 1999). In both Pitt and Khandker (1998) and
Coleman (1999), variables related to social ties were not considered as factors of program
participation at all. As Coleman (1999) suggests, the differences in MC access determinants
on different classes logically should affect its impact. Therefore, if only the poor clients make
most of the social ties as their credit guarantees, variables related to social ties should be
included in program participation analysis, which could change the impact analysis as a
result.
Many researchers have studied the relationships between social ties and repayment rate in
group lending (Besley and Coate, 1995; Ghatak, 2000; Ahlin and Townsend, 2007). Most of
them divide the function of social ties into two or three parts, which are ex-ante (selection)
and ex-post (monitoring and enforcement), then analyze which function could have the
greatest effect on the repayment rate. Wydick (1999) claims the effect of peer monitoring on
high repayment rate from his empirical analysis of group lending data in Guatemala.
Although he examines fully the role of social ties in MC3, the selection bias is not considered
in his repayment analysis. Meanwhile, Karlan (2005) succeeds in excluding this bias and
verifies that social ties affect higher repayment rates by analyzing group lending data in
Peru4
3 Wydick (1999) uses the term “social cohesion” instead of social ties and defines “social ties” as closeness or homogeneity among each group in the social cohesion. 4 Karlan (2007) uses the term “social connections”, which is defined as “the links and commonalities that bind a group of people together and determine their social interactions.” He regards this “social connections” as a broader form of “social capital.”
. He explains this effect by the social ties’ function that is gathering information and
increasing clients’ trustworthiness. He also indicates that cultural similarity and geographic
concentration improve group lending outcomes for the same reason. In his analysis, however,

3
economic variables such as income or assets of households are not included in the estimation
model. Supposing that social ties could be necessary, especially for poor MC borrowers, it
may be important to take economic factors into account even as control variables.
Recently there have been a few papers suggesting that ethnic ties affect access to credit.
Biggs et al. (2002) have found that ethnicity facilitates access to informal trade credit by
analyzing data in Kenya. They explain its mechanisms by channeling abundant information
and reputation functioning as enforcement among ethnic networks. Fisman (2003) also
shows an effect of ethnic ties on the provisions of trade credit in four African countries. He
suggests that discrimination against trade partners with different ethnic background is a
reason for preferential credit provision, besides more general rationalization that ethnic ties
may channel the information about members’ creditworthiness.
Credit provision in the case of MC, namely “MC outreach” depends basically on targeting
policies of each MC institution (Ledgerwood, 1999). While many MC institutions have
attempted to target the poor as their clients, some groups of poor people with particular
attributes tend to be excluded. Navajas et al. (2000) argue that MC borrowers are not the
poorest but rather those near the poverty line. Relying on Basic Human Needs5 as the basis
for poverty measurement, they proved that not the economically poor but the severely
socially deprived people were excluded in the MC programs in Bolivia. On the other hand,
Evans et al. (1999) show in their study of an MC program of Bangladesh Rural
Advancement Committee (BRAC) that the poorer the households are, the more likely they
are to have participated in the program. They also suggest that lack of female education,
small household size, and landlessness might reduce the possibility of MC access. While
those three factors surely related to borrowers’ creditworthiness, other important factors are
omitted in their analysis if social ties are the key to guarantees for borrowers’
creditworthiness, especially among the poor. Zeller (1994) has found that social ties did
affect application for informal credit in Madagascar, even though they were not too
significant so far as rationing of formal and informal credit was concerned6
5 Navajas et al. (1999) used the Index of Fulfillment of Basic Needs (IFBN) computed by the indicators of housing, access to public services, education, and access to health services. 6 In Zeller (1994), having ancestor’s burial places in the region is recognized as the variable of social ties.
. Recently, Amin
4
et al. (2003) have brought up the idea of vulnerability in analysis of MC access, and
demonstrated that MC was successful in reaching the poor, but unsuccessful in reaching the
vulnerable poor by using a panel data in Bangladesh. Thus, as Honohan (2005) says, “there
is less agreement on a framework for analyzing the determinants of access for low income
households.”
The aim of this paper is to analyze of the MC use determinants, taking social ties into
account using data from the Living Standard Measurement Study (LSMS) in Guatemala7
The principal data source for this study is the 2000 Guatemalan Living Standards
Measurement Survey (Encuesta Nacional Sobre Condiciones de Vida, hereafter ENCOVI
2000) which was carried out by the National Statistical Institute (INE) in Guatemala as an
LSMS of the World Bank. The ENCOVI 2000 features a module of social capital
questionnaires besides usual questionnaires, such as those about loan and deposit, which
makes it possible to study the relationship between MC and social ties, including social
capital. In ENCOVI 2000, 7,276 households were sampled as representative of eight regions
and urban/rural areas in Guatemala based on the 1999 census. In addition, each household
was labeled as “extremely poor,” “poor,” or “non-poor,” according to its income in the data
released on the World Bank’s website
.
Analysis of the MC use determinants could explain access barriers from the borrowers’ side
and contribute to the improvement of MC programs, as well. In addition, suggesting the
important determinants in deferent classes could influence the impact analysis as the
control variables that affect both credit access and the impact.
The rest of the paper is organized as follows. Section two describes the data used mainly in
this paper. Section three explains the econometric framework and its variables in particular
social ties. Section four presents and interprets the results in light of the guarantee of
creditworthiness among the poor. Section five concludes and adds policy implications.
Data
8
7 It can be obtained from the World Bank’s web site: http://econ.worldbank.org/WBSITE/EXTERNAL/EXTDEC/EXTRESEARCH/EXTLSMS/0,,contentMDK:21387262~pagePK:64168445~piPK:64168309~theSitePK:3358997,00.html.
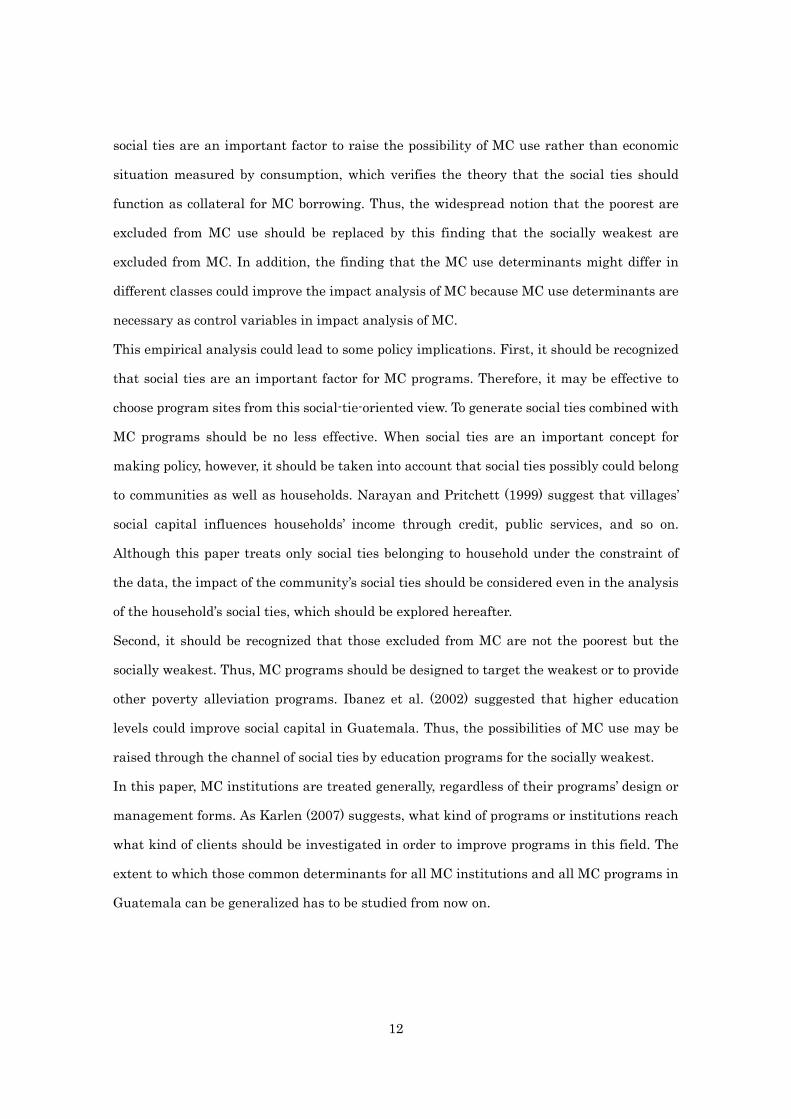
. This labeling suggests that 45.9 percent of
8 Extremely poor: their annual income is below the annual cost of the food basket, which
5
households are poor or extremely poor in Guatemala and about 75 percent of all those poor
live in rural areas (referring to Table 1). The north and the northwest regions seem to have
severe poverty problems from the regional point of view.
[Insert Table 1]
In Guatemala which is famous for its Mayan ruins, more than half of the population is
indigenous people coming mainly from the Mayan line. However, a small number of Spanish
whites have been dominant both politically and economically, and so-called Latinos who are
a mixture of the white and the indigenous comprise a middle ruling class. The poor north
and northwest regions are the resident places for indigenous people; therefore, the regional
distribution of the poor may reflect the social class structure in Guatemala.
As for credits, the penetration rate of MC in Guatemala takes fourth place in the world from
my calculation, using cross-country data compiled by Christen et al. (2004)9
Although credit outreach is similar among households in different economic situations, their
borrowing institutions are quite different (referring to Table 3). From Table 3, such informal
lenders as friends, families, and individuals can be recognized as major credit resources for
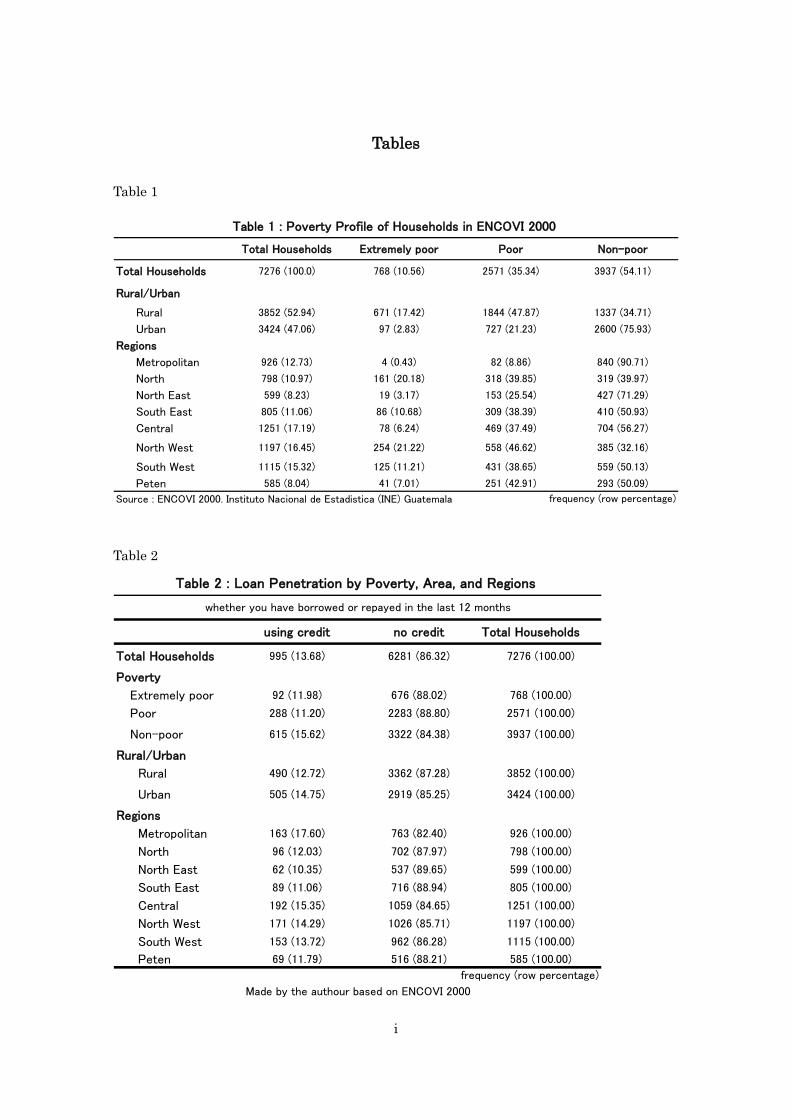
. In ENCOVI
2000, the ratio of credit borrowers, including informal credit, is 13.7 percent of the
population (referring to Table 2). Interestingly, the borrowers’ ratio among the extremely
poor is roughly the same as that in the poor. Geographically, there is not a big gap between
urban and rural areas; if anything, regional gaps from Metropolitan or Central districts to
Northeast are relatively apparent. Since households and communities in Guatemala have
various kinds of risk factors, such as natural disasters and fluctuating terms of trade for
commercial agricultural products (Tesliuc and Lindert, 2002), it may be necessary to use
credits in order to smooth consumption, regardless of poverty, areas, and geographical
regions.
[Insert Table 2]
satisfies the minimum daily intake of calories per capita (Quetzal 1912 ≑ $ 251.9). Poor: their annual income is below the annual cost necessary for the daily lives including the food expenses at the extremely poor level (Quetzal 4319 ≑ $ 569). Non-poor: their income is above the annual living cost at the poor level. 9 The penetration rate here is the proportion of the number of all MC accounts in a country to the population of the country. The first place is taken by Sri Lanka (17.84%), followed by Indonesia (13.74%), and Bangladesh (13.22%). Guatemala’s penetration rate is 8.55 percent.
6
the poor and the extremely poor, which accounts for more than half of their total credits. As
MC institutions, cooperatives can be said to penetrate the poor and the extremely poor. In
addition, a mission-oriented private bank named Banrural10
According to a cross-tabulation between borrowers’ jobs and lending organizations in
ENCOVI 2000, both self-employed workers or farmers and private companies’ employees
seem to use various organizations, including informal lenders (referring to Table 5-1).
Meanwhile, government employees and employers rely on banks and cooperatives. Most day
opens its door for the poor,
which is reflected in this table.
[Insert Table 3]
Among the financial institutions shown in Table 3, MC institutions are defined as private
banks, state banks, cooperatives, associations of producers, financiers, and NGOs. Informal
lenders, such as individuals and friends/family, should not be regarded as MC institutions.
In the early years, MC was recognized as credits for small businesses. The poor in
Guatemala use MC mainly for small businesses especially for agricultural activities as
shown in ENCOVI 2000, although there are some occasions in which MC is used for
consumption smoothing purposes such as emergencies or medical expenses (referring to
Table 4). On the other hand, the non-poor tend to use formal credits for household purposes
especially for loans for construction and reconstruction of houses.
[Insert Table 4]
With regard to guarantees, while 60 percent of the non-poor can borrow formal credit with
no guarantees or only signatures on contracting, almost half of the poor are required to put
their lands as guarantees. From this data, owning land is thought to be one of MC
determinants for the poor.
10 According to Alfaro-Gramajo (2003), Banrural was established in 1998 as the reorganized institution of Banco Nacional de Desarrollo Agricola (BANDESA), which was the state agricultural development bank. Banrural has held the mission that it tries to develop Guatemalan rural areas through the universal financial services. 70 percent of capital was private and the rest was derived from public sector. Its sales performance has been good. For example, its profits doubled from 1997 to 2001 and it took third place in terms of profitability (ROE) among all Guatemalan banks in 2001. Moreover, as for outreach, the number of branches in rural areas has increased three times and the number of accounts has enlarged more than thirty-five times in the years between 1997 and 2001. While most state-owned development banks have diminished in importance since the 1980s, the key to success of Banrural, according to Alfaro-Gramajo (2003), was that private citizens and citizens’ groups participate in the capital formation and the management.

7
workers or unskilled workers have to borrow from informal lenders. Then, narrowing the
objects down to the poor borrowers only (referring to Table 5-2), it becomes clear that private
companies’ employees also depend chiefly on the informal lenders. On the other hand, the
poor self-employed workers or farmers use both formal and informal institutions. They may
have assets or social ties guaranteeing their creditworthiness to borrow from formal MC
institutions.
[Insert Table 5-1 and 5-2]
Paying attention to the relationship between credits’ purposes and borrowers’ jobs, it is
obvious that the majority of credits for agricultural purposes are used by self-employed
workers or farmers (referring to Table 6-1). Narrowing the objects down to only the poor, this
trend is almost the same (referring to Table 6-2). The day workers or unskilled workers and
the employers also use credits for small business purposes (referring to Table 6-1). This
tendency is relatively stronger among the poor borrowers (referring to Table 6-2). In Table
6-1, the employees of both private companies and government are likely to use loans for
household purposes, such as emergencies or medical expenses, and purchasing other
household items. From both Table 5-2 and Table 6-2, MC is used chiefly by the self employed
for small business purposes especially for the agriculture.
[Insert Table 6-1 and 6-2]
Model and variables
To explore the determinants of MC use in Guatemala, I analyze data in ENCOVI 2000
according to an econometric model below.
yi = α + Xiβ1 + Giβ2 +SCiβ3 + ui 11
11 Maximum likelihood function and logarithmic maximum likelihood function of this model are as follows:
iiiiii yi
yi
ni
yi
yi
ni
yii
yii
ni
iiii
SCSCGGXX
ySCGX
)())(1()())(1()())(1(
),,,|,,(
31
3121
211
1
321
ββββββ
βββ
ΦΦ−Π•ΦΦ−Π•ΦΦ−Π
=−
=−
=−
=
( ){ } ( ){ }∑ ∑= =+Φ+Φ−−+Φ+Φ−−
=n
i
n
i iiiiiiii
iiii
GyGyXyXy
ySCGXL
1 1 2211
321
)(ln)(1ln)1()(ln)(1ln)1(
),,,|,,(ln
ββββ
βββ
{ }∑ =Φ+Φ−−
n
i iiii SCySCy1 33 )(ln))(1ln()1( ββ

8
The dependent variable (yi) would be one if at least one family member of a household (i)
borrows from MC institutions in the last twelve months. If no one uses MC in the household,
(yi) would be zero. On this binary response variable, I estimate the households’ properties
which raise the possibilities of MC use applying probit model. Poor borrowers and non-poor
borrowers are estimated separately because their security mechanisms could be different, as
mentioned above. The explanatory variable Xi means a set of characteristics of household i,
Gi means a set of geographical factors, and SCi means a set of household social capital
properties. The ui means error term.
Considering households without access to MC institutions, the probit model with selection
mechanisms which is called Heckman probit model also was tried to be estimated12
12 The econometric model and the maximum likelihood function of Heckman probit model
are as follows:
. But the
yi: use MC or not in a household(i) (use: 1/no: 0)
xi: set of household(i)’s properties including geographical factors, household’s head
characteristics, and household social capital properties
zi: access to MC institutions for a household(i) (access: 1/no: 0)
The set of variables in xi*is not the same as set in xi**.
Maximum likelihood function
{ } ( ) { } ( ){ } ( ) { } ( ) ( )iiiiii
iiiiiiii
yzPyPzzPzzyPzzPzyzxL
|1101,10),,|,,,(
==Π⋅=Π===Π⋅=Π=ρσγβ
Logarithmic maximum likelihood function
( ) ( ) ( ) ( )∑ ∑ ∑= = =
+=+=0 1 1
ln|1lnln,,|,,,lni i iz z z
iiiiiii yPyzPzPyzxL ρσγβ
9
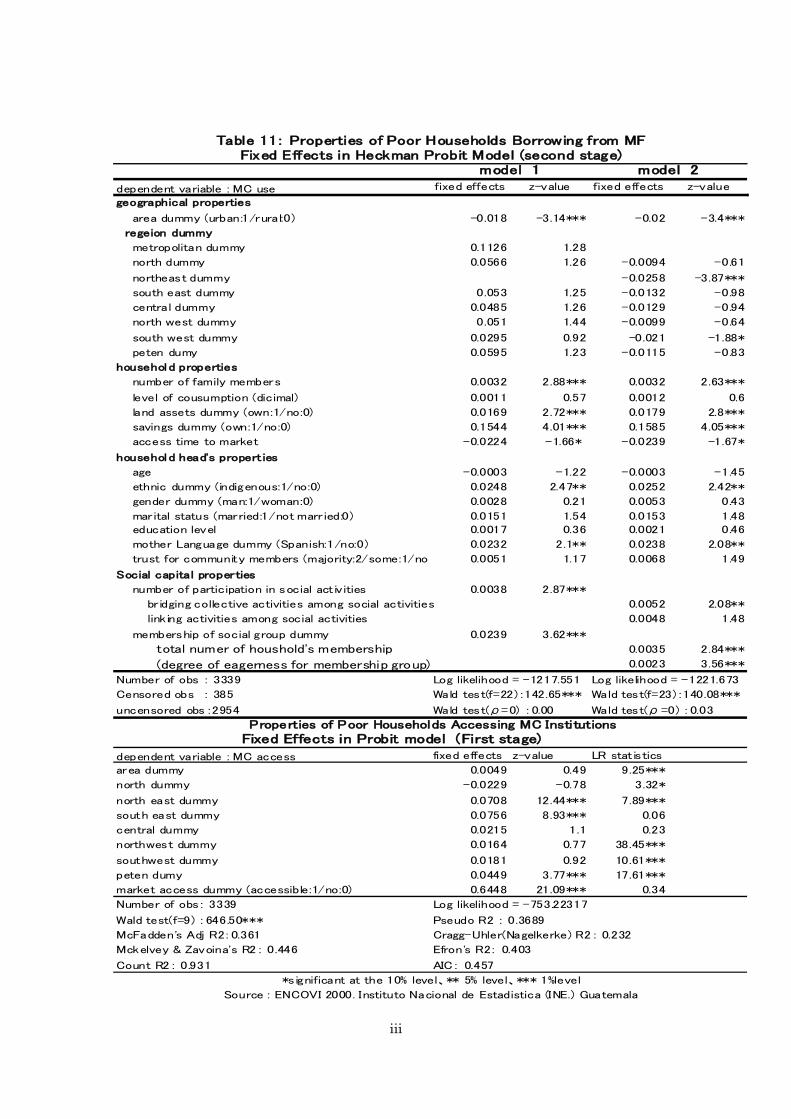
assumption that the coefficient of correlation between error term of probit model and that of
the selection equation is zero could not be rejected(referring to Table 11 and Table 12 in
appendix). Therefore, it is judged that the sample selection probit model would not be
appropriate in this case.
Social capital is thought to be a crucial concept to understand people and societies in
developing countries. It is thought to be the basis of acceptance for development aids. While
the social capital recently has attracted a lot of attention from both researchers and
practitioners, the concept itself has been recognized for a long time and may be suggested
through such terms as social ties, capacity building, network, and so on. In this paper, social
capital is defined as “the institutions, relationships, and norms that shape the quality and
quantity of a society's social interactions” 13
13 Web site of the World Bank: http://www1.worldbank.org/prem/poverty/scapital/whatsc.htm
based on the World Bank’s definition in
ENCOVI 2000. Variables of social capital in ENCOVI 2000 consist mainly of membership of
organizations and participation of collective actions. Those social capital variables could be
interpreted as the index of social ties that guarantees the poor against the risk of default.
Nowadays, membership of an organization generally is used for measuring social capital. On
the contrary, measuring social capital by participation of collective action might be
particularly relevant to developing countries because organizations themselves are not
widespread in those countries, especially in rural areas (Ibanez et al., 2002). In more detail,
participating collective actions are divided into two groups according to their main
functions; bridging and linking collective actions. Bridging collective actions include
construction of community infrastructure, donations, and labor agreement, which could be
defined as putting importance on close connection inside groups or communities. In contrast,
linking collective actions include contacting government officials, appealing to judicial
authorities, and volunteering in election campaigns, which could be characterized by the
tendency of linking outside groups or communities. Which types of social capital are
recognized as guarantees of trustworthiness may depict the situation of social ties in
Guatemala. With regard to membership of organizations, in EVCOVI 2000 all the members
in a household over 12 years are asked to provide up to three names of organizations in

10
which they participate and to report the degree of their eagerness for organizations’
activities. Then, based on the questions a dummy variable of the membership is made,
which shows whether at least one family member belongs to at least one group or not. In
addition, the variables of both the total number of memberships in a household and degree
of eagerness for membership organizations are made up. Although these variables do not
consider family size, they are expected to suggest the abundance of social capital in a
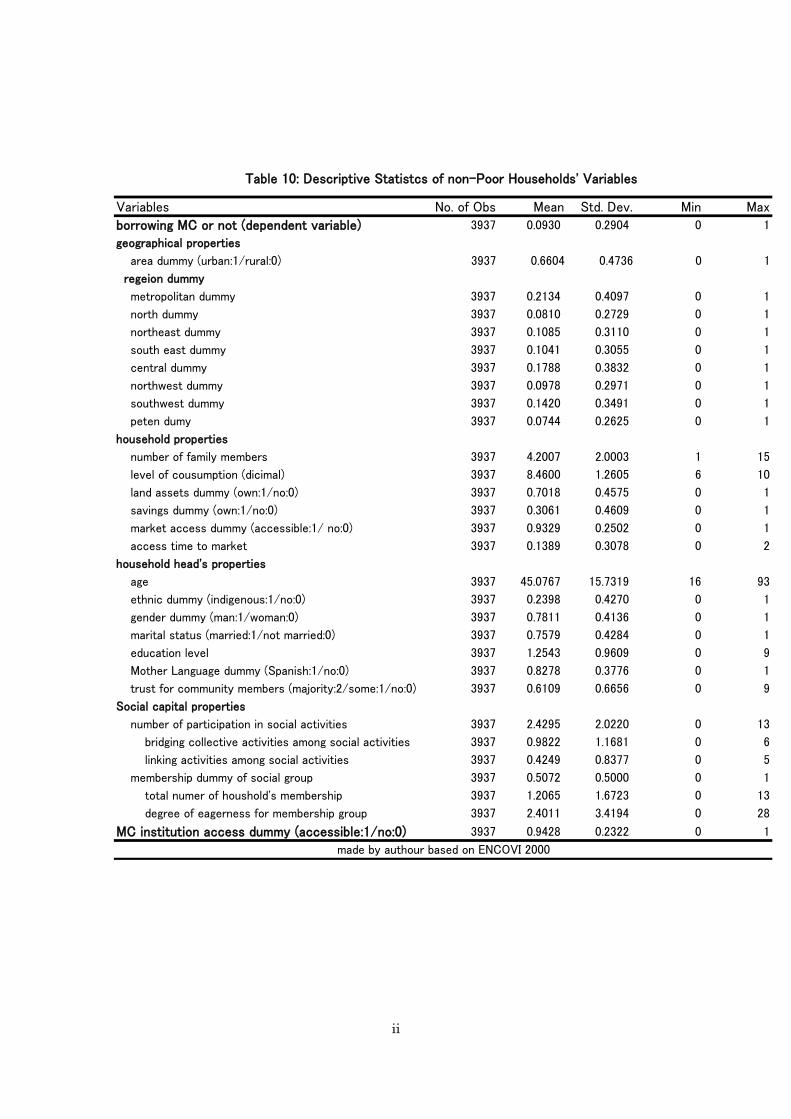
household. Descriptive statistics of poor and non-poor households' variables are referred to
Table 9 and Table10 in appendix.
Results and Interpretations
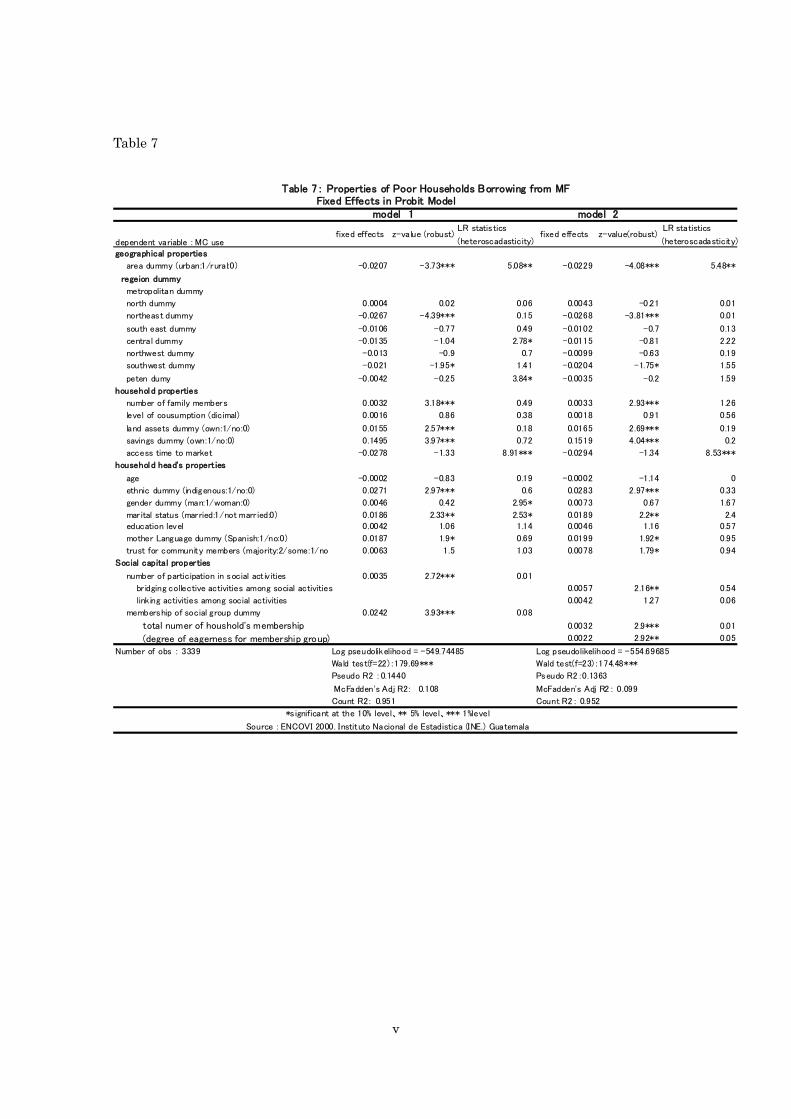
Table 7 shows the result of the estimation that calculates fixed effects of a household’s
properties, raising the possibility of using MC among the poor.
[Insert Table 7]
In model 1, which includes frequency of participation in social activities and a membership
dummy of social group as social capital variables, both the variables are positively
significant. It is demonstrated empirically that the richness of a household’s social capital
could raise the possibility of MC use among the poor. Therefore, the social ties can be said to
function as one of the guarantees of trustworthiness or a factor that overcomes information
asymmetries. Moreover, the significance of an ethnic dummy could endorse the importance
of the social ties for the poor MC use in Guatemala. According to Ibanez et al. (2002),
Guatemalan indigenous communities have enjoyed traditional social norms and a strong
sense of solidarity. In those close-knit societies, credit unions or mutual credit groups have
flourished and MCs have been used frequently under the circumstances in which
information asymmetries have been overcome and mutual guarantees of creditworthiness
established. On the contrary, a household’s consumption level is not significant, which
suggests that the household’s economic situation measured by consumption does not affect
the MC use possibility among the poor. Since the consumption level in the non-poor
estimation shows positively significance for MC use possibilities (referring to Table 8), it
could be a distinctive trait for the poor that the degree of the poor by consumption is not a
determinant of MC use empirically. Thus, the widespread notion that the poorest are

11
excluded from MC use clearly can be negated here.
[Insert Table 8]
Comparing the results of the poor and the non-poor, the determinants of MC use are
considerably different. Although the influence of holding land assets and savings are
suggested in both consumption classes, social capital properties are more important among
the poor than among the non-poor. Ethnicity, marital status, and mother tongue are the
determinants of MC use only for the poor, whereas gender, education level, and trust for
community are only for the non-poor. Those factors may function to raise the
creditworthiness in each consumption class, respectively. Family size, as Evans et al. (1999)
pointed out, performs as a factor of the creditworthiness in both classes because having more
family members possibly leads to earning more money when being at risk under their
repayment. Conversely, small households or single households could face some disadvantage
in their need of borrowing. Therefore, it can be said that the socially weakest people are
excluded from MC in Guatemala, considering the advantage of abundant social ties and
disadvantage of single households for MC use.
Model 2 includes more detailed variables of social capital properties than those in Model 1.
Among the poor in Model 2 (referring to Table 7), bridging collective activities is significant
for raising possibilities of MC use, but linking collective activities is not significant in
contrast. This may suggest that intra-community social ties are more important than social
ties connected to particular authorities outside the community to get trustworthiness and
information in their communities. In the non-poor, only the eagerness for their membership
groups is significant, which might suggest the high social status of the non-poor borrowers.
Because there are heteroscedasticities in both probit estimations, White’s robust variance
estimator is used for the statistical judgment. The model specification is admitted by the
Wald test in both poor and non-poor estimations. McFadden’s adjusted R2 index is 0.108 in
the poor estimation and 0.091 in the non-poor.
Conclusion
Who uses MC is analyzed using Guatemalan LSMS data in this paper. As a result, the
determinants are considerably different between the poor and the non-poor. In the poor,
12
social ties are an important factor to raise the possibility of MC use rather than economic
situation measured by consumption, which verifies the theory that the social ties should
function as collateral for MC borrowing. Thus, the widespread notion that the poorest are
excluded from MC use should be replaced by this finding that the socially weakest are
excluded from MC. In addition, the finding that the MC use determinants might differ in
different classes could improve the impact analysis of MC because MC use determinants are
necessary as control variables in impact analysis of MC.
This empirical analysis could lead to some policy implications. First, it should be recognized
that social ties are an important factor for MC programs. Therefore, it may be effective to
choose program sites from this social-tie-oriented view. To generate social ties combined with
MC programs should be no less effective. When social ties are an important concept for
making policy, however, it should be taken into account that social ties possibly could belong
to communities as well as households. Narayan and Pritchett (1999) suggest that villages’
social capital influences households’ income through credit, public services, and so on.
Although this paper treats only social ties belonging to household under the constraint of
the data, the impact of the community’s social ties should be considered even in the analysis
of the household’s social ties, which should be explored hereafter.
Second, it should be recognized that those excluded from MC are not the poorest but the
socially weakest. Thus, MC programs should be designed to target the weakest or to provide
other poverty alleviation programs. Ibanez et al. (2002) suggested that higher education
levels could improve social capital in Guatemala. Thus, the possibilities of MC use may be
raised through the channel of social ties by education programs for the socially weakest.
In this paper, MC institutions are treated generally, regardless of their programs’ design or
management forms. As Karlen (2007) suggests, what kind of programs or institutions reach
what kind of clients should be investigated in order to improve programs in this field. The
extent to which those common determinants for all MC institutions and all MC programs in
Guatemala can be generalized has to be studied from now on.
i
Tables
Table 1
Total Households Extremely poor Poor Non-poor
Total Households 7276 (100.0) 768 (10.56) 2571 (35.34) 3937 (54.11)
Rural/Urban
Rural 3852 (52.94) 671 (17.42) 1844 (47.87) 1337 (34.71)
Urban 3424 (47.06) 97 (2.83) 727 (21.23) 2600 (75.93)
Regions
Metropolitan 926 (12.73) 4 (0.43) 82 (8.86) 840 (90.71)
North 798 (10.97) 161 (20.18) 318 (39.85) 319 (39.97)
North East 599 (8.23) 19 (3.17) 153 (25.54) 427 (71.29)
South East 805 (11.06) 86 (10.68) 309 (38.39) 410 (50.93)
Central 1251 (17.19) 78 (6.24) 469 (37.49) 704 (56.27)
North West 1197 (16.45) 254 (21.22) 558 (46.62) 385 (32.16)
South West 1115 (15.32) 125 (11.21) 431 (38.65) 559 (50.13)
Peten 585 (8.04) 41 (7.01) 251 (42.91) 293 (50.09)
Source : ENCOVI 2000. Instituto Nacional de Estadistica (INE) Guatemala
Table 1 : Poverty Profile of Households in ENCOVI 2000
frequency (row percentage)
Table 2
using credit no credit Total Households
Total Households 995 (13.68) 6281 (86.32) 7276 (100.00)
Poverty
Extremely poor 92 (11.98) 676 (88.02) 768 (100.00)
Poor 288 (11.20) 2283 (88.80) 2571 (100.00)
Non-poor 615 (15.62) 3322 (84.38) 3937 (100.00)
Rural/Urban
Rural 490 (12.72) 3362 (87.28) 3852 (100.00)
Urban 505 (14.75) 2919 (85.25) 3424 (100.00)
Regions
Metropolitan 163 (17.60) 763 (82.40) 926 (100.00)
North 96 (12.03) 702 (87.97) 798 (100.00)
North East 62 (10.35) 537 (89.65) 599 (100.00)
South East 89 (11.06) 716 (88.94) 805 (100.00)
Central 192 (15.35) 1059 (84.65) 1251 (100.00)
North West 171 (14.29) 1026 (85.71) 1197 (100.00)
South West 153 (13.72) 962 (86.28) 1115 (100.00)
Peten 69 (11.79) 516 (88.21) 585 (100.00)
Table 2 : Loan Penetration by Poverty, Area, and Regions
Made by the authour based on ENCOVI 2000
whether you have borrowed or repayed in the last 12 months
frequency (row percentage)

ii
Table 3
total extremely poor poor no poor
private banks 244 (21.67) 5 (5.21) 40 (12.58) 199 (27.95)
State banks 87 (7.73) 7 (7.29) 20 (6.29) 60 (8.43)
cooperatives 165 (14.65) 14 (14.58) 37 (11.64) 114 (16.01)
association of producers 8 (0.71) 1 (1.04) 5 (1.57) 2 (0.28)
financiers 17 (1.51) 1 (1.04) 7 (2.20) 9 (1.26)
NGOs 54 (4.80) 9 (9.38) 22 (6.92) 23 (3.23)
individuals 155 (13.77) 25 (26.04) 54 (16.98) 76 (10.67)
credit card 1 (0.09) 0 (0) 0 (0) 1 (0.14)
friends,families,etc 304 (27.00) 32 (33.33) 108 (33.96) 164 (23.03)
other what 91 (8.08) 2 (2.08) 25 (7.86) 64 (8.99)
total 1126 (100) 96 (8.53) 318 (28.24) 712 (63.23)
made by the autour based on ENCOVI 2000
Tabel 3 : Financial Institutions and Informal Lenders Providing Credits
frequency (row percentage)
Table 4
total extremely poor poor no poorsmall business purposes
agri purposes 200(34.72) 25(67.57) 68(51.91) 58(14.22)raw materials or inputs 98(17.01) 19(51.35) 53(40.46) 26(6.37)other agri activities 49(8.51) 7(18.92) 24(18.32) 18(4.41)animals 22(3.82) 3(8.11) 4(3.05) 15(3.68)
business purposes 115(19.97) 2(5.4) 22(16.79) 84(20.59)articles for business 40(6.94) 1(2.7) 11(8.4) 28(6.85)raw materials or inputs 28(4.86) 0(0.00) 4(3.05) 24(5.88)other business activities 17(2.95) 1(2.7) 5(3.82) 11(2.70)
consumption smoothing purposeshousehold purposes 261(45.31) 3(8.11) 17(12.98) 241(59.07)
construct houses 65(11.28) 0(0.00) 2(1.53) 63(15.44)other household items 44(7.64) 0(0.00) 4(3.05) 40(9.80)payment of debt 42(7.29) 2(5.41) 3(2.29) 37(9.07)emergency or illness 33(5.73) 0(0.00) 5(3.82) 28(6.86)remodel houses 32(5.56) 1(2.70) 2(1.53) 29(7.11)
576(100.00) 37(100.00) 131(100.00) 408(100.00)obs:576
Table 4 : Purposes of MC by Poverty Level (main purposes of each section)
frequency (column percentage)
made by the authour based on ENCOVI 2000

iii
Table 5-1
governmentemployees
privatecompanies'employees
day workersor unskilledworkers
domesticemployees
employersself employedworkers orfarmers
helper orworkerwithout pay inother location
private banks 52(44.07) 52(20.00) 5(5.21) 0(0.00) 28(29.79) 62(19.38) 3(21.43)State banks 19(16.10) 17(6.54) 3(3.13) 0(0.00) 10(10.64) 30(9.38) 1(7.14)coopearives 24(20.34) 25(9.62) 10(10.42) 1(14.29) 24(25.53) 54(16.88) 2(14.29)association of producers 0(0.00) 1(0.38) 0(0.00) 0(0.00) 0(0.00) 6(1.88) 0(0.00)financiers 1(0.85) 4(1.54) 1(1.04) 1(14.29) 4(4.26) 3(0.94) 0(0.00)NGOs 2(1.69) 8(3.08) 4(4.17) 1(14.29) 8(8.51) 26(8.13) 0(0.00)individuals 5(4.24) 41(15.77) 22(22.92) 0(0.00) 5(5.32) 42(13.13) 3(21.43)credit card 0(0.00) 0(0.00) 0(0.00) 0(0.00) 1(1.06) 0(0.00) 0(0.00)friends,families,etc. 11(9.32) 71(27.31) 39(40.63) 4(57.14) 13(13.83) 79(24.69) 4(28.57)other what 4(3.39) 41(15.77) 12(12.50) 0(0.00) 1(1.06) 18(5.63) 1(7.14)total 118(100.00) 260(100.00) 96(100.00) 7(100.00) 94(100.00) 320(100.00) 14(100.00)
made by the authour based on ENCOVI 2000
frequency (column percentage)obs:995
Table 5-1: Financial Institutions Providing Credits by Borrowers' Job
Table 5-2
governmentemployees
privatecompanies'employees
day workersor unskilledworkers
domesticemployees
employersself employedworkers orfarmers
helper orworkerwithout pay inother location
private banks 1(25.00) 2(3.51) 4(4.94) 0 3(12.00) 30(16.48) 0State banks 0 2(3.51) 2(2.47) 0 6(24.00) 16(8.79) 1(14.29)cooperatives 0 3(5.26) 9(11.11) 1(50.00) 6(24.00) 27(14.84) 1(14.29)association of producers 0 0 0 0 0 5(2.75) 0financiers 0 2(3.51) 1(1.23) 0 1(4.00) 3(1.65) 0NGOs 1(25.00) 1(1.75) 4(4.94) 0 3(12.00) 19(10.44) 0individuals 0 18(31.58) 18(22.22) 0 1(4.00) 26(14.29) 3(42.86)friends,families,etc. 2(50.00) 23(40.35) 36(44.44) 1(50.00) 5(20.00) 45(24.73) 2(28.57)other what 0 6(10.53) 7(8.64) 0 0 11(6.04) 0total 4(100.00) 57(100.00) 81(100.00) 2(100.00) 25(100.00) 182(100.00) 7(100.00)
made by the authour based on ENCOVI 2000
frequency (column percentage)obs:380
Table 5-2: Financial Institutions Providing Credits for the Poor by Borrowers' Job

iv
Table 6-1
totalgovernmentemployees
privatecompanies'employee
day workersor unskilledworkers
domesticemployees
employers
selfemployedworkers orfarmers
helpers orworkerswithout payin otherlocations
small business purposesagri purposes 273(27.44) 10(8.47) 17(6.54) 37(38.54) 1(14.29) 31(32.98) 171(53.44) 6(42.86)
raw materials or inputs 155(15.58) 5(4.24) 7(2.69) 16(16.67) 0(0.00) 16(17.02) 101(31.56) 5(35.71)other agri activities 66(6.83) 1(0.85) 3(1.15) 11(11.46) 1(14.29) 6(6.38) 41(12.81) 1(7.14)animals 22(2.21) 2(1.69) 2(0.77) 2(2.08) 0(0.00) 4(4.26) 11(3.44) 0(0.00)
business purposes 142(14.27) 13(11.02) 24(9.23) 6(6.25) 1(14.19) 35(37.23) 61(19.06) 2(14.29)articles for business 52(5.23) 4(3.39) 8(3.08) 2(2.08) 0(0.00) 14(14.89) 19(5.94) 1(7.14)raw materials or inputs 36(3.62) 4(3.39) 3(1.15) 2(2.08) 1814.29) 8(8.51) 15(4.69) 1(7.14)other business activities 22(2.21) 2(1.69) 8(3.08) 0(0.00) 0(0.00) 4(4.26) 7(2.19) 0(0.00)
consumption smoothing purposeshousehold purposes 495(49.75) 96(81.36) 219(84.23) 53(55.21) 5(71.43) 29(30.85) 87(27.19) 6(42.86)
construct house 82(8.24) 20(16.95) 27(10.38) 5(5.21) 0(0.00) 8(8.51) 10(3.13) 1(7.14)other household items 129(12.96) 14(11.86) 57(21.92) 18(18.75) 2(28.57) 2(2.13) 16(5.00) 2(14.29)payment of debt 70(7.04) 14(11.86) 25(9.62) 6(6.25) 0(0.00) 3(3.19) 10(3.13) 0(0.00)emergency or illness 151(15.18) 17(14.41) 54(20.77) 22(22.92) 3(42.86) 6(6.38) 33(10.31) 1(7.14)remodel house 47(4.72) 12(10.17) 19(7.31) 0(0.00) 0(0.00) 3(3.19) 8(2.50) 2(14.29)
total 118(100.00) 260(100.00) 96(100.00) 7(100.00) 94(100.00) 320(100.00) 14(100.00)obs:995(NA:85) frequency (column percentage)
made by the authour based on ENCOVI 2000
Table 6-1: Purposes of Credits by Borrowers' Job (main purposes in each sections)
Table 6-2
totalgovernmentemployees
privatecompanies'employees
day workersor unskilledworkers
domesticemployees
employers
selfemployedworkers orfarmers
helpers orworkerswithout payin otherlocations
small business purposesagri purposes 190(50.00) 1(25.00) 9(15.79) 34(41.98) 0 18(72.00) 124(68.13) 4(57.14)
raw materials or inputs 114(30.00) 1(25.00) 5(8.77) 15(18.52) 0 12(48.00) 75(41.21) 3(42.86)other agri activities 51(13.42) 0 3(5.26) 10(12.35) 0 5(20.00) 30(16.48) 1(14.29)payment of debt 12(3.16) 0 0 3(3.70) 0 01(4.00) 7(3.85) 0
business purposes 31(8.16) 1(25.00) 6(10.53) 5(6.17) 1(50.00) 5(25.00) 13(7.14) 0articles for business 16(4.21) 0 3(5.26) 2(2.47) 0 4(16.00) 4(2.20) 0raw materials or inputs 8(2.11) 1(25.00) 0 1(1.23) 1(50.00) 0 4(2.20) 0other business activities 6(1.58) 0 2(3.51) 0 0 1(4.00) 3(1.65) 0
consumption smoothing purposesHousehold purposes 137(36.05) 2(50.00) 42(73.68) 42(51.85) 1(50.00) 2(8.00) 45(24.73) 3(42.86)
construct house 15(3.95) 1(25.00) 5(8.77) 5(6.17) 0 0 2(1.10) 1(14.29)other household items 33(8.68) 0 9(15.79) 14(17.28) 1(50.00) 0 9(4.95) 0payment of debt 20(5.26) 1(25.00) 6(10.53) 4(4.94) 0 0 6(3.30) 0emergency or illness 58(15.26) 0 14(24.56) 17(20.99) 0 1(4.00) 19(10.44) 1(14.29)remodel house 11(2.89) 0 4(7.02) 0 0 1(4.00) 4(2.20) 1(14.29)
total 4(100.00) 57(100.00) 81(100.00) 2(100.00) 25(100.00) 182(100.00) 7(100.00)obs:380 (NA:22) frequency (column percentage)
made by the authour based on ENCOVI 2000
Table 6-2: Purposes of loans of the poor by loaners'job (main purposes in each sections)
v
Table 7
LR statistics LR statistics
(heteroscadasticity) (heteroscadasticity)
geographical properties
area dummy (urban:1/rural:0) -0.0207 -3.73*** 5.08** -0.0229 -4.08*** 5.48**
regeion dummy
metropolitan dummy
north dummy 0.0004 0.02 0.06 0.0043 -0.21 0.01
northeast dummy -0.0267 -4.39*** 0.15 -0.0268 -3.81*** 0.01
south east dummy -0.0106 -0.77 0.49 -0.0102 -0.7 0.13
central dummy -0.0135 -1.04 2.78* -0.0115 -0.81 2.22
northwest dummy -0.013 -0.9 0.7 -0.0099 -0.63 0.19
southwest dummy -0.021 -1.95* 1.41 -0.0204 -1.75* 1.55
peten dumy -0.0042 -0.25 3.84* -0.0035 -0.2 1.59
household properties
number of family members 0.0032 3.18*** 0.49 0.0033 2.93*** 1.26
level of cousumption (dicimal) 0.0016 0.86 0.38 0.0018 0.91 0.56
land assets dummy (own:1/no:0) 0.0155 2.57*** 0.18 0.0165 2.69*** 0.19
savings dummy (own:1/no:0) 0.1495 3.97*** 0.72 0.1519 4.04*** 0.2
access time to market -0.0278 -1.33 8.91*** -0.0294 -1.34 8.53***
household head's propert ies
age -0.0002 -0.83 0.19 -0.0002 -1.14 0
ethnic dummy (indigenous:1/no:0) 0.0271 2.97*** 0.6 0.0283 2.97*** 0.33
gender dummy (man:1/woman:0) 0.0046 0.42 2.95* 0.0073 0.67 1.67
marital status (married:1/not marr ied:0) 0.0186 2.33** 2.53* 0.0189 2.2** 2.4education level 0.0042 1.06 1.14 0.0046 1.16 0.57
mother Language dummy (Spanish:1/no:0) 0.0187 1.9* 0.69 0.0199 1.92* 0.95
trust for community members (majority:2/some:1/no 0.0063 1.5 1.03 0.0078 1.79* 0.94
Social capital properties
number of participation in social act ivities 0.0035 2.72*** 0.01
br idging collective activities among social activities 0.0057 2.16** 0.54
linking activities among social activities 0.0042 1.27 0.06
membership of social group dummy 0.0242 3.93*** 0.08
total numer of houshold's membership 0.0032 2.9*** 0.01
(degree of eagerness for membership group) 0.0022 2.92** 0.05
Number of obs : 3339 Log pseudolikelihood = -549.74485 Log pseudolikelihood = -554.69685
Wald test(f=22):179.69*** Wald test(f=23):174.48***
Pseudo R2 :0.1440 Pseudo R2:0.1363
McFadden's Adj R2: 0.108 McFadden's Adj R2: 0.099
Count R2: 0.951 Count R2: 0.952
Fixed Effects in Probit Model model 1 model 2
dependent variable : MC usefixed effects
Table 7: Properties of Poor Households Borrowing from MF
z-value (robust) z-value(robust)fixed effects
*significant at the 10% level、** 5% level、*** 1%level
Source : ENCOVI 2000. Instituto Nacional de Estadistica (INE.) Guatemala

vi
Table 8
LR statistics LR statistics
(heteroscadasticity) (heteroscadasticity)
geographical properties
area dummy (urban:1/rural:0) 0.0121 1.26 0.32 0.0115 1.19 0.36
regeion dummy
metropolitan dummy -0.0367 -2.78*** 0.28 -0.0359 -2.68*** 0.06
north dummy 0.0208 0.9 1.3 0.0228 0.96 1.75
northeast dummy 0.0011 0.06 2.09 0.0025 0.13 1.72
south east dummy -0.005 -0.28 0.01 -0.0039 -0.21 0.03
central dummy -0.0173 -1.1 0.22 -0.0158 -0.99 0.26
northwest dummy 0.0341 1.44 0 0.0371 1.52 0.01
southwest dummy -0.0196 -1.27 0.11 -0.0177 -1.11 0.12
peten dumy
household properties
number of family members 0.0108 5.07*** 11.15*** 0.0108 4.9*** 12.54***
level of cousumption (dicimal) 0.0167 3.8*** 2.41 0.017 3.86*** 1.48
land assets dummy (own:1/no:0) 0.0183 2.03** 0.01 0.0196 2.17** 0
savings dummy (own:1/no:0) 0.0387 3.59*** 3.28* 0.0395 3.65*** 2
access time to market -0.0011 -0.09 0.19 -0.0015 -0.11 1.84
household head's propert ies 0.08
age -0.0001 -0.42 0.1 -0.0001 -0.33 0.1
ethnic dummy (indigenous:1/no:0) -0.0122 -0.84 2.24 -0.0109 -0.73 1.3
gender dummy (man:1/woman:0) 0.0253 2.2** 0.11 0.0262 2.27** 0.24
marital status (married:1/not marr ied:0) 0.019 1.54 0.88 0.0191 1.54 1.24education level 0.0237 5*** 5.34*** 0.0242 5.01*** 6.07**
mother Language dummy (Spanish:1/no:0) -0.0209 -1.06 0.19 0.0209 -1.06 0.03
trust for community members (majority:2/some:1/no 0.0158 2.63*** 3.15* 0.0166 2.77*** 4.01**
Social capital properties
number of participation in social act ivities 0.0029 1.51 0.84
br idging collective activities among social activities 0.0013 0.35 0.32
linking activities among social activities 0.0058 1.22 0.43
membership of social group dummy 0.0241 2.8*** 1.68
total numer of houshold's membership 0.0039 1.63 2.31
(degree of eagerness for membership group) 0.0034 2.98*** 1.95
Number of obs : 3937 Log pseudolikelihood = -1684.1693 Log pseudolikelihood = -1087.1919
Wald test(f=22):266.77*** Wald test(f=23):261.53***
Pseudo R2 :0.1098 Pseudo R2:0.1073
McFadden's Adj R2: 0.091 McFadden's Adj R2: 0.088
Count R2: 0.907 Count R2: 0.907
z-value (robust) z-value(robust)fixed effects
Table 8: Properties of Non-Poor Households Borrowing from MF
*significant at the 10% level、** 5% level、*** 1%level
Source : ENCOVI 2000. Instituto Nacional de Estadistica (INE.) Guatemala
Fixed Effects in Probit Model model 1 model 2
dependent variable : MC usefixed effects

i
Reference
Ahlin, Christian and Townsend, Robert M., Using Repayment Data to Test Across Models of
Joint Liability Lending, The Economic Journal, Vol. 17, Issue 517, 2007, pp.F11-F51.
Alfaro-Gramajo, Luis Noel, Reverting the Tendency in Developing Finance: The Case of
“Banrural S.A.” in Guatemala, Paving the Way Forward for Rural Finance An
International Conference on Best Practices, 2003,
(http://www.basis.wisc.edu/live/rfc/cs_05b.pdf).
Amin, Sajeda, Rai, Ashok S., and Topa, Giorgio, Does microcredit reach the poor and
vulnerable? Evidence from northern Bangladesh, Journal of Development Economics, 70,
2003, pp. 59-82.
Besley, Timothy and Coate, Stephen, Group lending, repayment incentives and social
collateral, Journal of Development Economics, Vol. 46, 1995, pp. 1-18.
Biggs, Tyler, Raturi, Mayank, and Srivastava, Pradeep, Ethnic networks and access to
credit: evidence from the manufacturing sector in Kenya, Journal of Economic Behavior &
Organization, Vol. 49, Issue 4, 2002, pp. 473-486.
Christen, Robert P., Rosenberg, Richard and Jayadeva, Veena, Financial Institutions with a
“Double Bottom Line” Implications for the Future of Microfinance, CGAP Occasional
Paper, No.8, 2004, (http://www.cgap.org/p/site/c/template.rc/1.9.2701).
Coleman, Brett E., The impact of group lending in Northeast Thailand, Journal of
Development Economics, Vol. 60, 1999, pp. 105-141.
Evans, Timothy G., Adams, Alayne M., Mohammed, Rafi, and Norris, Alison, Demystifying
Nonparticipation in Microcredit: A Population-Based Analysis, World Development, Vol.
27, No. 2, 1999, pp. 419-430.
Fisman, Raymond J., Ethnic Ties and the Provision of Credit: Relationship-Level Evidence
from African Firms, Advances in Economic Analysis & Policy, Vol. 3, Issue 1, 2003, Article
4.
Ghatak, Maitreesh, Group Lending, Local Information and Peer Selection, Journal of
Development Economics, Vol. 60, No. 1, 1999, pp. 27-50.
Ghatak, Maitreesh, Screening by the Company You Keep: Joint Liability Lending and the
Peer Selection Effect, The Economic Journal, 110, 2000, pp. 601-631.
Hoff, Kara and Stiglitz, Joseph E., Imperfect Information and Rural Credit Markets:
Puzzles and Policy Perspectives, The World Bank Economic Review, Vol. 4, No. 3, 1990, pp.
ii
235-250.
Honohan, Patrick, Measuring Microfinance Access: Building on Existing Cross- Country
Data, World Bank Policy Research Working Paper No.3606, 2005.
Hulme, David and Mosley, Paul, Finance Against Poverty, Volume 1, London, Routledge,
1996.
Ibanez, Ana Maria, Lindert, Kathy and Woolcock, Michael, Social Capital in Guatemala: A
mixed Methods Analysis, World Bank Technical Paper, No.12, 2002.
Karlan, Dean S., Social Connections and Group Banking, Economic Journal, Vol. 117, Issue
517, 2007, pp. F52 - F84.
Ledgerwood, Joanna, Microfinance Handbook, Washington D.C., The World Bank, 1999.
Narayan, Deepa and Pritchett, Lant, Cents and Sociability: Household Income and Social
Capital in Rural Tanzania, Economic development and Cultural change, Vol. 47, 1999, pp.
871-897.
Navajas, Sergio, Schreiner, Mark, Meyer, Richard L., Gonzalez-Vega, Claidio, and
Rodriguez-Meza, Jorge, Microcredit and the Poorest of the Poor: Theory and Evidence
from Bolivia, World Development, Vol. 28, No. 2, 2000, pp. 333-346.
Pitt, Mark M. and Khandker, Shahidur R., The Impact of Group-Based Credit Programs on
Poor Households in Bangladesh: Does Gender of Participants Matter?, The Journal of
Policy Economy, Vol. 106, No. 5, 1998, pp. 958-996.
Tesliuc, Emil D. and Lindert, Kathy, Vulnerability: A Quantitative and Qualitative
Assessment, Guatemala Poverty Assessment Program, 2002,
(http://info.worldbank.org/etools/docs/library/97185/Keny_0304/Ke_0304/vulnerability.pdf
).
Van Bastelaer, Thierry, Does Social Capital Facilitate the Poor’s Access to Credit? A Review
of the Microeconomic Literature, Social Capital Initiative Working Paper No.8, The World
Bank Social Development Department, 2000.
Wydick Bruce, Can Social Cohesion be Harnessed to Repair Market Failures? Evidence from
Group Lending in Guatemala, The Economic Journal, Vol. 109, No. 457, 1999, pp. 463-475.
Zeller, Manfred, Determinants of credit rationing: A study of informal lenders and formal
credit groups in Madagascar, World Development, Vol. 22, No.12, 1994, pp. 1896-1909.

i
Appendix
Variables No. of Obs Mean Std. Dev. Min Max
borrowing MC or not (dependent variable) 3339 0.0479 0.2136 0 1
geographical properties
area dummy (urban:1/rural:0) 3339 0.2468 0.4312 0 1
regeion dummy
metropolitan dummy 3339 0.0258 0.1584 0 1
north dummy 3339 0.1435 0.3506 0 1
northeast dummy 3339 0.0515 0.2211 0 1
south east dummy 3339 0.1183 0.3230 0 1
central dummy 3339 0.1638 0.3702 0 1
northwest dummy 3339 0.2432 0.4291 0 1
southwest dummy 3339 0.1665 0.3726 0 1
peten dumy 3339 0.0875 0.2825 0 1
household properties
number of family members 3339 6.4055 2.5526 1 18
level of cousumption (dicimal) 3339 3.5112 1.5856 1 6
land assets dummy (own:1/no:0) 3339 0.8002 0.3999 0 1
savings dummy (own:1/no:0) 3339 0.0341 0.1816 0 1
market access dummy (accessible:1/ no:0) 3339 0.9036 0.2952 0 1
access time to market 3339 0.1025 0.3356 0 2
household head's properties
age 3339 43.8302 14.8839 17 99
ethnic dummy (indigenous:1/no:0) 3339 0.5696 0.4952 0 1
gender dummy (man:1/woman:0) 3339 0.8616 0.3453 0 1
marital status (married:1/not married:0) 3339 0.8679 0.3386 0 1
education level 3339 0.5556 0.6342 0 9
Mother Language dummy (Spanish:1/no:0) 3339 0.49 0.5 0 1
trust for community members (majority:2/some:1/no:0) 3339 0.702 0.6189 0 2
Social capital properties
number of participation in social activities 3339 2.2959 1.9928 0 12
bridging collective activities among social activities 3339 0.7592 1.0782 0 6
linking activities among social activities 3339 0.3456 0.7781 0 5
membership dummy of social group 3339 0.4705 0.4992 0 1
total numer of houshold's membership 3339 1.3187 2.051 0 15
degree of eagerness for membership group 3339 2.5125 3.9338 0 30
MC institution access dummy (accessible:1/no:0) 3339 0.8847 0.3194 0 1
Table 9: Descriptive Statistcs of Poor Households' Variables
made by authour based on ENCOVI 2000
ii
Variables No. of Obs Mean Std. Dev. Min Max
borrowing MC or not (dependent variable) 3937 0.0930 0.2904 0 1
geographical properties
area dummy (urban:1/rural:0) 3937 0.6604 0.4736 0 1
regeion dummy
metropolitan dummy 3937 0.2134 0.4097 0 1
north dummy 3937 0.0810 0.2729 0 1
northeast dummy 3937 0.1085 0.3110 0 1
south east dummy 3937 0.1041 0.3055 0 1
central dummy 3937 0.1788 0.3832 0 1
northwest dummy 3937 0.0978 0.2971 0 1
southwest dummy 3937 0.1420 0.3491 0 1
peten dumy 3937 0.0744 0.2625 0 1
household properties
number of family members 3937 4.2007 2.0003 1 15
level of cousumption (dicimal) 3937 8.4600 1.2605 6 10
land assets dummy (own:1/no:0) 3937 0.7018 0.4575 0 1
savings dummy (own:1/no:0) 3937 0.3061 0.4609 0 1
market access dummy (accessible:1/ no:0) 3937 0.9329 0.2502 0 1
access time to market 3937 0.1389 0.3078 0 2
household head's properties
age 3937 45.0767 15.7319 16 93
ethnic dummy (indigenous:1/no:0) 3937 0.2398 0.4270 0 1
gender dummy (man:1/woman:0) 3937 0.7811 0.4136 0 1
marital status (married:1/not married:0) 3937 0.7579 0.4284 0 1
education level 3937 1.2543 0.9609 0 9
Mother Language dummy (Spanish:1/no:0) 3937 0.8278 0.3776 0 1
trust for community members (majority:2/some:1/no:0) 3937 0.6109 0.6656 0 9
Social capital properties
number of participation in social activities 3937 2.4295 2.0220 0 13
bridging collective activities among social activities 3937 0.9822 1.1681 0 6
linking activities among social activities 3937 0.4249 0.8377 0 5
membership dummy of social group 3937 0.5072 0.5000 0 1
total numer of houshold's membership 3937 1.2065 1.6723 0 13
degree of eagerness for membership group 3937 2.4011 3.4194 0 28
MC institution access dummy (accessible:1/no:0) 3937 0.9428 0.2322 0 1
Table 10: Descriptive Statistcs of non-Poor Households' Variables
made by authour based on ENCOVI 2000
iii
geographical properties
area dummy (urban:1/rural:0) -0.018 -3.14*** -0.02 -3.4***
regeion dummy
metropolitan dummy 0.1126 1.28
north dummy 0.0566 1.26 -0.0094 -0.61
northeast dummy -0.0258 -3.87***
south east dummy 0.053 1.25 -0.0132 -0.98
central dummy 0.0485 1.26 -0.0129 -0.94
north west dummy 0.051 1.44 -0.0099 -0.64
south west dummy 0.0295 0.92 -0.021 -1.88*
peten dumy 0.0595 1.23 -0.0115 -0.83
household properties
number of family members 0.0032 2.88*** 0.0032 2.63***
level of cousumption (dicimal) 0.0011 0.57 0.0012 0.6
land assets dummy (own:1/no:0) 0.0169 2.72*** 0.0179 2.8***
savings dummy (own:1/no:0) 0.1544 4.01*** 0.1585 4.05***
access time to market -0.0224 -1.66* -0.0239 -1.67*
household head's propert ies
age -0.0003 -1.22 -0.0003 -1.45
ethnic dummy (indigenous:1/no:0) 0.0248 2.47** 0.0252 2.42**
gender dummy (man:1/woman:0) 0.0028 0.21 0.0053 0.43
marital status (married:1/not marr ied:0) 0.0151 1.54 0.0153 1.48education level 0.0017 0.36 0.0021 0.46
mother Language dummy (Spanish:1/no:0) 0.0232 2.1** 0.0238 2.08**
trust for community members (majority:2/some:1/no 0.0051 1.17 0.0068 1.49
Social capital properties
number of participation in social act ivities 0.0038 2.87***
br idging collective activities among social activities 0.0052 2.08**
linking activities among social activities 0.0048 1.48
membership of social group dummy 0.0239 3.62***
total numer of houshold's membership 0.0035 2.84***
(degree of eagerness for membership group) 0.0023 3.56***
Number of obs : 3339 Log likelihood = -1217.551 Log likelihood = -1221.673
Censored obs : 385 Wald test(f=22):142.65*** Wald test(f=23):140.08***
uncensored obs:2954 Wald test(ρ=0) :0.00 Wald test(ρ=0) :0.03
fixed effects z-value LR stat istics
area dummy 0.0049 0.49 9.25***
north dummy -0.0229 -0.78 3.32*
north east dummy 0.0708 12.44*** 7.89***
south east dummy 0.0756 8.93*** 0.06
central dummy 0.0215 1.1 0.23
northwest dummy 0.0164 0.77 38.45***
southwest dummy 0.0181 0.92 10.61***
peten dumy 0.0449 3.77*** 17.61***
market access dummy (accessible:1/no:0) 0.6448 21.09*** 0.34
Number of obs: 3339 Log likelihood = -753.22317
Wald test(f=9) :646.50*** Pseudo R2 : 0.3689
McFadden's Adj R2:0.361 Cragg-Uhler(Nagelkerke) R2: 0.232
Mckelvey & Zavoina's R2: 0.446 Efron's R2: 0.403
Count R2: 0.931 AIC: 0.457
dependent variable : MC use
Fixed Effects in Probit model (First stage) Properties of Poor Households Accessing MC Institutions
fixed effects z-value fixed effects z-value
*significant at the 10% level、** 5% level、*** 1%level
Source : ENCOVI 2000. Instituto Nacional de Estadistica (INE.) Guatemala
dependent variable : MC access
Table 11: Properties of Poor Households Borrowing from MFFixed Effects in Heckman Probit Model (second stage)
model 1 model 2

iv
geographical properties
area dummy (urban:1/rural:0) 0.0159 1.5 0.0153 1.43
regeion dummy
metropolitan dummy -0.0365 -2.51** -0.0358 -2.41**
north dummy 0.0073 0.32 0.0088 0.37
northeast dummy -0.0067 -0.36 -0.0048 -0.25
south east dummy -0.0069 -0.36 -0.0057 -0.3
central dummy -0.0162 -0.95 -0.0145 -0.84
northwest dummy 0.0296 1.23 0.0327 1.32
southwest dummy -0.0197 -1.19 -0.0172 -1.01
peten dumy
household properties
number of family members 0.0107 4.55*** 0.0107 4.43***
level of cousumption (dicimal) 0.0145 3.12*** 0.015 3.21***
land assets dummy (own:1/no:0) 0.0158 1.68* 0.0172 1.83*
savings dummy (own:1/no:0) 0.0372 3.4*** 0.038 3.45***
access time to market 0.0005 0.04 0.0003 0.02
household head's propert ies
age -0.0001 -0.44 -0.0001 -0.34
ethnic dummy (indigenous:1/no:0) -0.0126 -0.8 -0.0109 -0.68
gender dummy (man:1/woman:0) 0.0238 1.77* 0.0247 1.84*marital status (married:1/not marr ied:0) 0.0161 1.15 0.0163 1.17education level 0.0265 5.15*** 0.027 5.21***
mother Language dummy (Spanish:1/no:0) -0.0191 -0.9 -0.0189 -0.89
trust for community members (majority:2/some:1/no: 0.015 2.31** 0.0159 2.45**
Social capital properties
number of participation in social act ivities 0.0035 1.71*
br idging collective activities among social activities 0.0025 0.64
linking activities among social activities 0.006 1.17
membership of social group dummy 0.0273 3***
total numer of houshold's membership 0.0044 1.76*
(degree of eagerness for membership group) 0.0037 3.03***
Number of obs : 3937 Log likelihood =-1641.52 Log likelihood = -1645.057
Censored obs : 225 Wald test(f=22):212.31*** Wald test(f=23):208.78***
uncensored obs:3712 Wald test(ρ=0) :0.65 Wald test(ρ=0) : 0.58
fixed effects z-value LR stat istics
area dummy 0.0346 5.2*** 53.72***
metropolitan dummy -0.0462 -2.41** 64.72***
north dummy -0.0993 -3.04*** 8.12***
northeast dummy 0.0099 0.98 0.29
southeast dummy 0.0203 2.83*** 7.77***
central dummy -0.0251 -1.6 1.09
northwest dummy 0.0068 0.54 0
southwest dummy -0.0343 -1.91* 11.74***
peten dumy
market access dummy (accessible:1/no:0) 0.3911 12.16*** 10.05***
Number of obs: 3937 Log likelihood = -613.54957
LR test(f=9) :510.41*** Pseudo R2 : 0.2886
McFadden's Adj R2:0.277 Cragg-Uhler(Nagelkerke) R2: 0.119
Mckelvey & Zavoina's R2: 0.280 Efron's R2: 0.259
Count R2: 0.957 AIC: 0.317
*significant at the 10% level、** 5% level、*** 1%level
Source : ENCOVI 2000. Instituto Nacional de Estadistica (INE.) Guatemala
dependent variable : MC access
Table12: Properties of Non-Poor Households Borrowing from MFFixed Effects in Heckman Probit Model (second stage)
model 1 model 2
dependent variable : MC use
Fixed Effects in Probit model (First stage) Properties of Non-Poor Households Accessing MC Institutions
fixed effects z-value fixed effects z-value


![Text Retrieval and Mining Lecture 12 [Borrows slides from Viktor Lavrenko and Chengxiang Zhai]](https://static.fdocument.pub/doc/165x107/56649f3f5503460f94c6042b/text-retrieval-and-mining-lecture-12-borrows-slides-from-viktor-lavrenko-and.jpg)